e n v i r o n m e n t a l t o x i c o l o g y a n d p h a r m a c o l o g y 3 9 ( 2 0 1 5 ) 489–495 Available online at www.sciencedirect.com ScienceDirect jo ur nal homepage: www.elsevier.com/locate/etap Correlation of melanophore index with a battery of functional genomic stress indicators for measurement of environmental stress in aquatic ecosystem Atul P. Daiwile a , Pravin K. Naoghare a , Manisha D. Giripunje a , P.D. Prasada Rao a , Tarun K. Ghosh b , Kannan Krishnamurthi a , Chibuisi G. Alimba a,c , Saravanadevi Sivanesan a,∗ a Environmental Health Division, CSIR – National Environmental Engineering Research Institute (NEERI), Nagpur 440020, India b Ultra-tech, Environmental Consultancy and Laboratory, Pune 411038, India c Cell Biology and Genetics unit, Department of Zoology, University of Ibadan, Nigeria a r t i c l e i n f o Article history: Received 11 September 2014 Received in revised form 12 December 2014 Accepted 13 December 2014 Available online 7 January 2015 Keywords: Melanophore index HSP MCH Vitellogenin Functional stress indicators Correlation a b s t r a c t The correlation of primary stress indicator; melanophore index (MI) with set of genomic stress indicators is important for a better understanding of the cellular stress pathway induced by xenobiotics in aquatic species. This study presents a correlation between melanophore index (MI) and genomic stress indicators in Oreochromis mossambicus treated with lead nitrate, phenol and hexachlorocyclohexane (HCH). O. mossambicus was exposed to sub-lethal concentrations of the different LC 50 values (96 h) of the tested chemicals at varying exposure periods and the response via genomic stress indicators and scale melanophores were assessed in accordance with standard protocols. Melanophore index decreased sig- nificantly (p < 0.01) in a time dependant pattern to the tested chemicals. Gene expression showed significant time dependent increase in the expression of heat shock proteins (HSP70 and HSP60). Vitellogenin (Vtg) expression insignificantly altered. Significant increase in the expression of melanin concentrating hormone (MCH) was observed in response to hexachlorocyclohexane (HCH) in the treated fish. The findings demonstrated an inverse relationship between melanophore index and the set of genomic stress indicators. © 2014 Elsevier B.V. All rights reserved. 1. Introduction Pollution of the aquatic ecosystems due to environmental chemicals has emerged as a global issue (Bontje et al., 2014). Abbreviations: MI, melanophore index; MCH, melanin concentrating hormone; PSS, physiological salt solution; Vtg, vitellogenin; HCH, hexachlorocyclohexane. ∗ Corresponding author. Tel.: +91 7122249757. E-mail address: ss [email protected] (S. Sivanesan). The unprecedented increase in industrialization due to pop- ulation growth caused the discharge of numerous chemicals into the environment with most aquatic ecosystems becom- ing the final recipients of these chemicals. This inevitably led to severe deterioration in the water quality parameters, http://dx.doi.org/10.1016/j.etap.2014.12.006 1382-6689/© 2014 Elsevier B.V. All rights reserved.

Welcome message from author
This document is posted to help you gain knowledge. Please leave a comment to let me know what you think about it! Share it to your friends and learn new things together.
Transcript
Cfme
APCa
4b
c
a
A
R
R
1
A
A
K
M
H
M
V
F
C
1
Pc
h
h1
e n v i r o n m e n t a l t o x i c o l o g y a n d p h a r m a c o l o g y 3 9 ( 2 0 1 5 ) 489–495
Available online at www.sciencedirect.com
ScienceDirect
jo ur nal homepage: www.elsev ier .com/ locate /e tap
orrelation of melanophore index with a battery ofunctional genomic stress indicators for
easurement of environmental stress in aquaticcosystem
tul P. Daiwilea, Pravin K. Naogharea, Manisha D. Giripunjea,.D. Prasada Raoa, Tarun K. Ghoshb, Kannan Krishnamurthia,hibuisi G. Alimbaa,c, Saravanadevi Sivanesana,∗
Environmental Health Division, CSIR – National Environmental Engineering Research Institute (NEERI), Nagpur40020, IndiaUltra-tech, Environmental Consultancy and Laboratory, Pune 411038, IndiaCell Biology and Genetics unit, Department of Zoology, University of Ibadan, Nigeria
r t i c l e i n f o
rticle history:
eceived 11 September 2014
eceived in revised form
2 December 2014
ccepted 13 December 2014
vailable online 7 January 2015
eywords:
elanophore index
SP
CH
a b s t r a c t
The correlation of primary stress indicator; melanophore index (MI) with set of genomic
stress indicators is important for a better understanding of the cellular stress pathway
induced by xenobiotics in aquatic species. This study presents a correlation between
melanophore index (MI) and genomic stress indicators in Oreochromis mossambicus treated
with lead nitrate, phenol and hexachlorocyclohexane (HCH). O. mossambicus was exposed to
sub-lethal concentrations of the different LC50 values (96 h) of the tested chemicals at varying
exposure periods and the response via genomic stress indicators and scale melanophores
were assessed in accordance with standard protocols. Melanophore index decreased sig-
nificantly (p < 0.01) in a time dependant pattern to the tested chemicals. Gene expression
showed significant time dependent increase in the expression of heat shock proteins (HSP70
and HSP60). Vitellogenin (Vtg) expression insignificantly altered. Significant increase in
itellogenin
unctional stress indicators
orrelation
the expression of melanin concentrating hormone (MCH) was observed in response to
hexachlorocyclohexane (HCH) in the treated fish. The findings demonstrated an inverse
relationship between melanophore index and the set of genomic stress indicators.
ulation growth caused the discharge of numerous chemicals
. Introductionollution of the aquatic ecosystems due to environmentalhemicals has emerged as a global issue (Bontje et al., 2014).
Abbreviations: MI, melanophore index; MCH, melanin concentratingexachlorocyclohexane.∗ Corresponding author. Tel.: +91 7122249757.
E-mail address: ss [email protected] (S. Sivanesan).
ttp://dx.doi.org/10.1016/j.etap.2014.12.006382-6689/© 2014 Elsevier B.V. All rights reserved.
© 2014 Elsevier B.V. All rights reserved.
The unprecedented increase in industrialization due to pop-
hormone; PSS, physiological salt solution; Vtg, vitellogenin; HCH,
into the environment with most aquatic ecosystems becom-ing the final recipients of these chemicals. This inevitablyled to severe deterioration in the water quality parameters,
d p h
490 e n v i r o n m e n t a l t o x i c o l o g y a ndue to increased concentrations of these chemical contam-inants in the water bodies (Holt and Miller, 2011; Bontjeet al., 2014). Chemical contaminants readily bioaccumulatein aquatic species and biomagnify along the food chain toreach the tertiary consumers including humans (WHO, 1990).This may exert detrimental health effects on both the aquaticspecies and human population. Lead, phenol and HCH accu-mulation in the environment has been linked mostly tothe discharge from anthropogenic activities. They are toxic,persistent and bioaccumulative chemicals for which theirdischarge into the environment had been restricted by reg-ulatory authorities. Studies have reported their potentialsto bioaccumulate in aquatic species and induced oxidativestress via alterations in antioxidant enzyme activities andmolecules as a major mechanism of toxicity. Studies basicallyquantified these molecules in the water, sediment samplesand aquatic forms using chromatographic and or spectro-photometric techniques (Tine et al., 2010; Holt and Miller,2011; Kaur and Dua, 2012; Duncan et al., 2013). In recentdecades, several methods have been developed to identifyand quantify the environmental contaminants in the aquaticsystem. These techniques are limited in their inability to cor-relate toxicity and stress induction with the quantity of thesecontaminants in biological systems. The development of suit-able biosensors and cytosensors will be appropriate for themeasurement of oxidative stress induced by environmentalchemicals in aquatic organisms (Tine et al., 2010; Holt andMiller, 2011; Kaur and Dua, 2012). The sensitivity of mostaquatic fauna to alterations in water parameters via some bio-logical molecules like chromatophores correlated well withenvironmental stress, hence may serve as a bio-indicatorfor assessing aquatic pollution. Kaur and Dua (2012) showedthat exposure to wastewater induced significant alterations inscales and dispersal of chromatophores (melanophores, xan-thophores, iridophores) in Channa punctatus. They suggestedthat fish scale can be successfully employed as indicatorsof wastewater pollution. However, information is relativelyscarce on the expression of chromatophores and functionalgenomics (gene expression) as an indicator of stress relatedto chemical exposure. Melanophores, black-pigmented cellsof the Tilapia species, readily undergo changes in responseto environmental stressors, hence had been well utilized inthe assessment of change in water parameters due to envi-ronmental contaminants (Kaur and Dua, 2012). Sequel to thesensitivity of melanophores to environmental stress, it is nec-essary to validate the relationship between the melanophoreindex (MI) and batteries of functional stress indicators duringexposure to environmental contaminants.
Lead, a toxic metal, is ubiquitous in the biosphere and itsmassive anthropogenic utilization has resulted in its exten-sive contamination of most aquatic environment. Similarlyphenols and haxachlorocyclohexane (HCH), and their deriva-tives commonly exist in the environment due to their use ascomponents of dyes, polymers, drugs, pesticides and otherorganic substances. The presence of these chemicals in theaquatic ecosystems may greatly affect fish that are commonly
raised for food and which readily change their melanophorein response to change in environmental conditions (Turkerand Takemura, 2011; Chow et al., 2013; Huang et al., 2014).This study attempts to correlate functional stress indicatorsa r m a c o l o g y 3 9 ( 2 0 1 5 ) 489–495
(HSP70, HSP60, Vtg and MCH) with the primary stress indica-tors (scale melanophores) in Oreochromis mossambicus exposedto sub-lethal concentrations of lead nitrate, phenol and HCH atvarying time intervals in a laboratory setting. We hypothesizethat the correlation of functional stress indicators with theprimary stress indicators can facilitate better measurementof environmental stress in aquatic ecosystem.
2. Materials and methods
2.1. Acclimatization of fishes
Tilapias (O. mossambicus), obtained from Baradwari lake nearNagpur, India, was weighed around 78 ± 2 g, average length14 ± 1 cm and kept in 100 L tanks filled with dechlorinatedwater (pH 7.5) and maintained at 24 ± 1 ◦C. Fish were fed withcommercial feed and acclimatized to the laboratory conditionsfor 15 days before the start of experiment.
2.2. Chemicals
Analytical grade lead nitrate, phenol and hexachlorocyclohex-ane (HCH) were obtained from Sigma–Aldrich, USA.
2.3. Acute toxicity and physicochemical parameters
LC50 (96 h) values for lead nitrate, phenol and HCH weredetermined in accordance with Organization for EconomicCo-operation and Development guidelines (OECD No. 203,17th July 1992). Semi-static bioassay was employed duringthe experiment. Fish (eight/tank) were exposed to six ran-domly selected concentrations of the various chemicals andthe controls were maintained in dechlorinated water. Medianlethal concentration (LC50) values for each chemical weredetermined. The physicochemical parameters of the watersamples containing the chemicals were monitored through-out the experiment period; temperature 25 ◦C (±1 ◦C), pH 7–7.5,hardness 150 ppm and dissolved oxygen (DO) 8 mg/L.
2.4. Melanophore index (MI)
Scales were plucked from the left hand side of fish above thelateral line and kept in physiological salt solution (169 mMNaCl; 5.4 mM KCl; 1.8 mM CaCl2; 1.3 mM MgCl2; 5 mM Tris; and5.6 mM d-glucose). Sub-lethal concentrations (1/5th concen-tration of 96 h LC50) of lead nitrate (36 mg/L), phenol (6 mg/L)and HCH (10 mg/L) were added to the scales and analyzedunder the microscope as described by Van der Salm et al.(2005) for 90 min at an interval of 5 min. Melanophore indexwas calculated according to Hogben and Slome (1931).
2.5. RNA isolation
O. mossambicus were exposed to sub-lethal concentrations(1/5th dose of 96 h LC50) of toxicant for 15 min, 45 min
and 90 min, and corresponding controls were maintained foreach treatment. At post exposure, fish were euthanized with0.2% (w/v) ethyl 3-aminobenzoate methanesulfonate (MS 222;Sigma, USA), and blood drawn from the heart was processed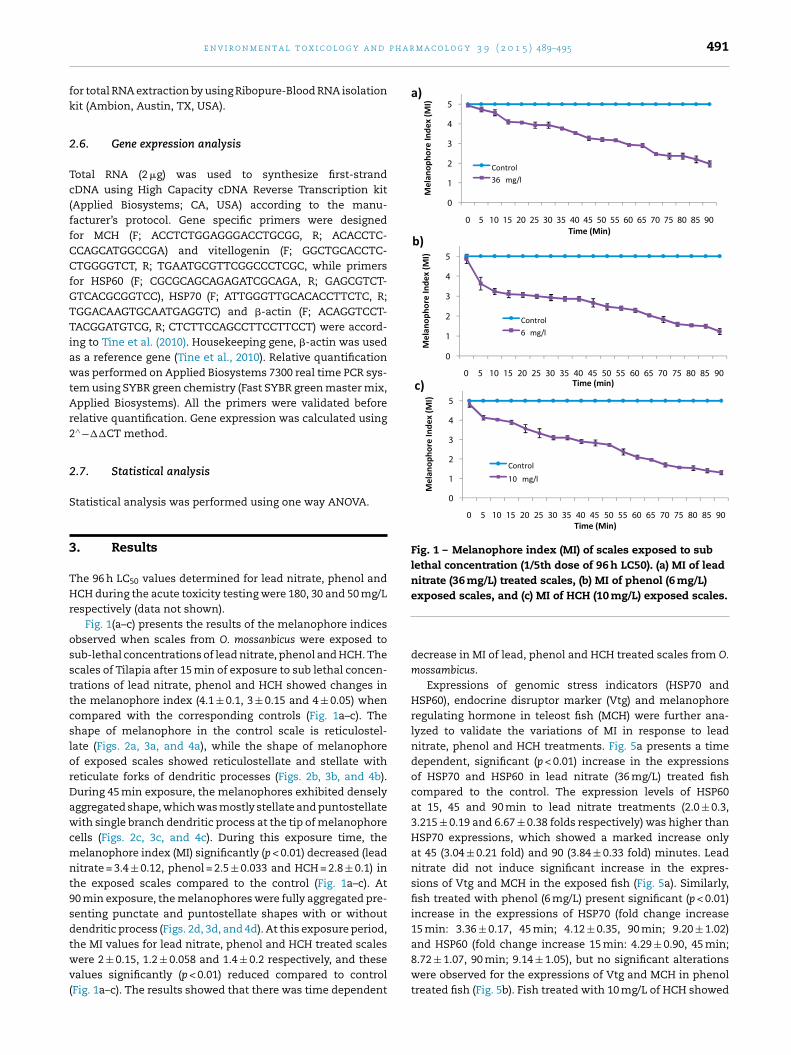
p h a r m a c o l o g y 3 9 ( 2 0 1 5 ) 489–495 491
fk
2
Tc(ffCCfGTTiawtAr2
2
S
3
THr
ossttcslorDawcmnt9sdtwv(
0
1
2
3
4
5
0 5 10 15 20 25 30 35 40 45 50 55 60 65 70 75 80 85 90
Mel
anop
hore
Inde
x (M
I)
Time (min)
Control6 mg/l
0
1
2
3
4
5
0 5 10 15 20 25 30 35 40 45 50 55 60 65 70 75 80 85 90
Mel
anop
hore
Inde
x (M
I)
Time (Min)
Control36 mg/l
0
1
2
3
4
5
0 5 10 15 20 25 30 35 40 45 50 55 60 65 70 75 80 85 90
Mel
anop
hore
Inde
x (M
I)
Time (Min)
Control10 mg/l
a)
b)
c)
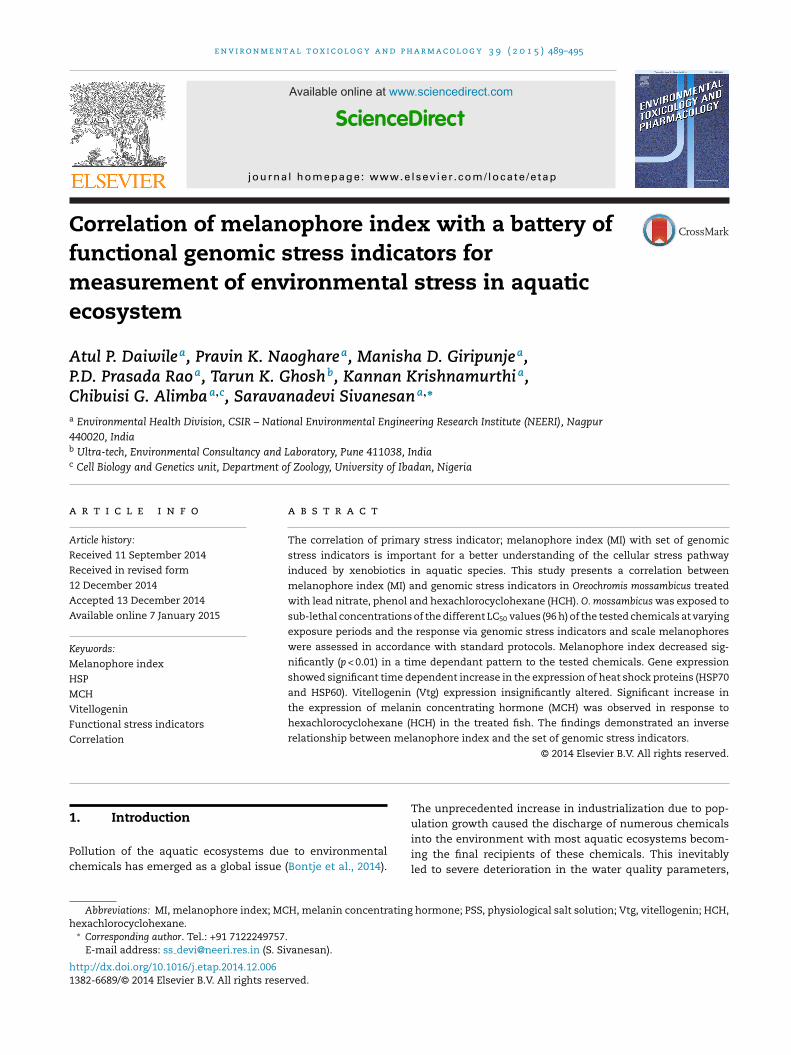
Fig. 1 – Melanophore index (MI) of scales exposed to sublethal concentration (1/5th dose of 96 h LC50). (a) MI of leadnitrate (36 mg/L) treated scales, (b) MI of phenol (6 mg/L)exposed scales, and (c) MI of HCH (10 mg/L) exposed scales.
e n v i r o n m e n t a l t o x i c o l o g y a n d
or total RNA extraction by using Ribopure-Blood RNA isolationit (Ambion, Austin, TX, USA).
.6. Gene expression analysis
otal RNA (2 �g) was used to synthesize first-strandDNA using High Capacity cDNA Reverse Transcription kitApplied Biosystems; CA, USA) according to the manu-acturer’s protocol. Gene specific primers were designedor MCH (F; ACCTCTGGAGGGACCTGCGG, R; ACACCTC-CAGCATGGCCGA) and vitellogenin (F; GGCTGCACCTC-TGGGGTCT, R; TGAATGCGTTCGGCCCTCGC, while primers
or HSP60 (F; CGCGCAGCAGAGATCGCAGA, R; GAGCGTCT-TCACGCGGTCC), HSP70 (F; ATTGGGTTGCACACCTTCTC, R;GGACAAGTGCAATGAGGTC) and �-actin (F; ACAGGTCCT-ACGGATGTCG, R; CTCTTCCAGCCTTCCTTCCT) were accord-ng to Tine et al. (2010). Housekeeping gene, �-actin was useds a reference gene (Tine et al., 2010). Relative quantificationas performed on Applied Biosystems 7300 real time PCR sys-
em using SYBR green chemistry (Fast SYBR green master mix,pplied Biosystems). All the primers were validated before
elative quantification. Gene expression was calculated using∧−��CT method.
.7. Statistical analysis
tatistical analysis was performed using one way ANOVA.
. Results
he 96 h LC50 values determined for lead nitrate, phenol andCH during the acute toxicity testing were 180, 30 and 50 mg/L
espectively (data not shown).Fig. 1(a–c) presents the results of the melanophore indices
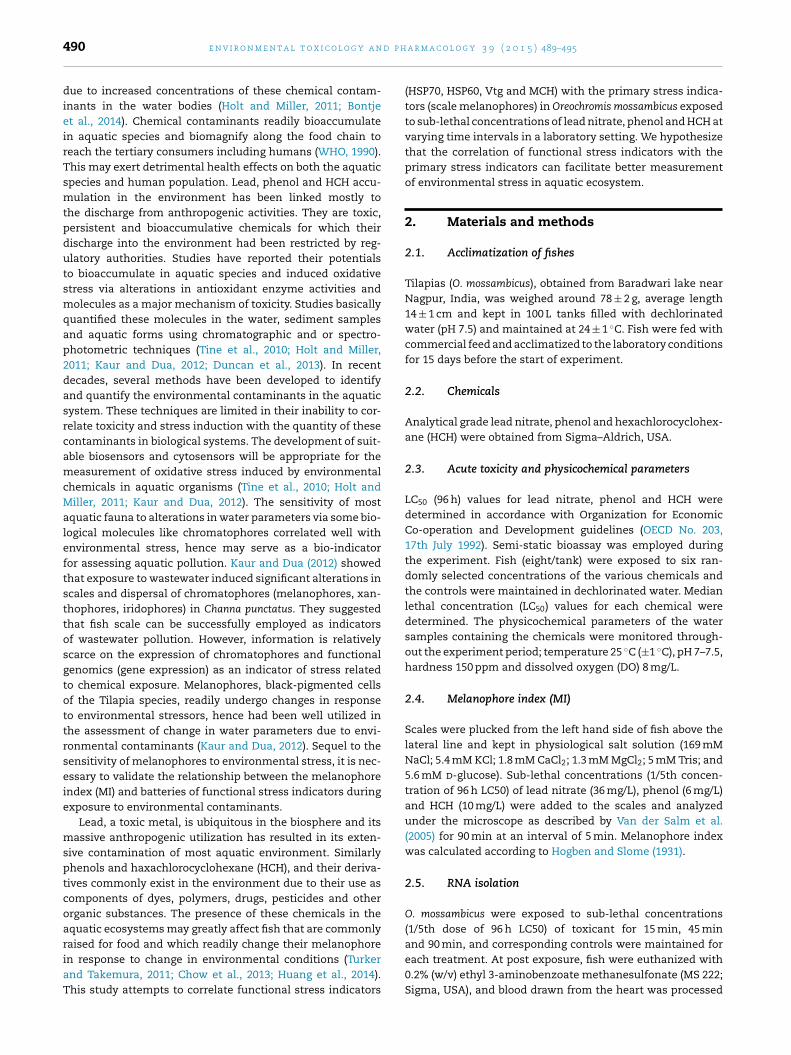
bserved when scales from O. mossanbicus were exposed toub-lethal concentrations of lead nitrate, phenol and HCH. Thecales of Tilapia after 15 min of exposure to sub lethal concen-rations of lead nitrate, phenol and HCH showed changes inhe melanophore index (4.1 ± 0.1, 3 ± 0.15 and 4 ± 0.05) whenompared with the corresponding controls (Fig. 1a–c). Thehape of melanophore in the control scale is reticulostel-ate (Figs. 2a, 3a, and 4a), while the shape of melanophoref exposed scales showed reticulostellate and stellate witheticulate forks of dendritic processes (Figs. 2b, 3b, and 4b).uring 45 min exposure, the melanophores exhibited denselyggregated shape, which was mostly stellate and puntostellateith single branch dendritic process at the tip of melanophore
ells (Figs. 2c, 3c, and 4c). During this exposure time, theelanophore index (MI) significantly (p < 0.01) decreased (lead
itrate = 3.4 ± 0.12, phenol = 2.5 ± 0.033 and HCH = 2.8 ± 0.1) inhe exposed scales compared to the control (Fig. 1a–c). At0 min exposure, the melanophores were fully aggregated pre-enting punctate and puntostellate shapes with or withoutendritic process (Figs. 2d, 3d, and 4d). At this exposure period,
he MI values for lead nitrate, phenol and HCH treated scalesere 2 ± 0.15, 1.2 ± 0.058 and 1.4 ± 0.2 respectively, and thesealues significantly (p < 0.01) reduced compared to controlFig. 1a–c). The results showed that there was time dependent
decrease in MI of lead, phenol and HCH treated scales from O.mossambicus.
Expressions of genomic stress indicators (HSP70 andHSP60), endocrine disruptor marker (Vtg) and melanophoreregulating hormone in teleost fish (MCH) were further ana-lyzed to validate the variations of MI in response to leadnitrate, phenol and HCH treatments. Fig. 5a presents a timedependent, significant (p < 0.01) increase in the expressionsof HSP70 and HSP60 in lead nitrate (36 mg/L) treated fishcompared to the control. The expression levels of HSP60at 15, 45 and 90 min to lead nitrate treatments (2.0 ± 0.3,3.215 ± 0.19 and 6.67 ± 0.38 folds respectively) was higher thanHSP70 expressions, which showed a marked increase onlyat 45 (3.04 ± 0.21 fold) and 90 (3.84 ± 0.33 fold) minutes. Leadnitrate did not induce significant increase in the expres-sions of Vtg and MCH in the exposed fish (Fig. 5a). Similarly,fish treated with phenol (6 mg/L) present significant (p < 0.01)increase in the expressions of HSP70 (fold change increase15 min: 3.36 ± 0.17, 45 min; 4.12 ± 0.35, 90 min; 9.20 ± 1.02)and HSP60 (fold change increase 15 min: 4.29 ± 0.90, 45 min;
8.72 ± 1.07, 90 min; 9.14 ± 1.05), but no significant alterationswere observed for the expressions of Vtg and MCH in phenoltreated fish (Fig. 5b). Fish treated with 10 mg/L of HCH showed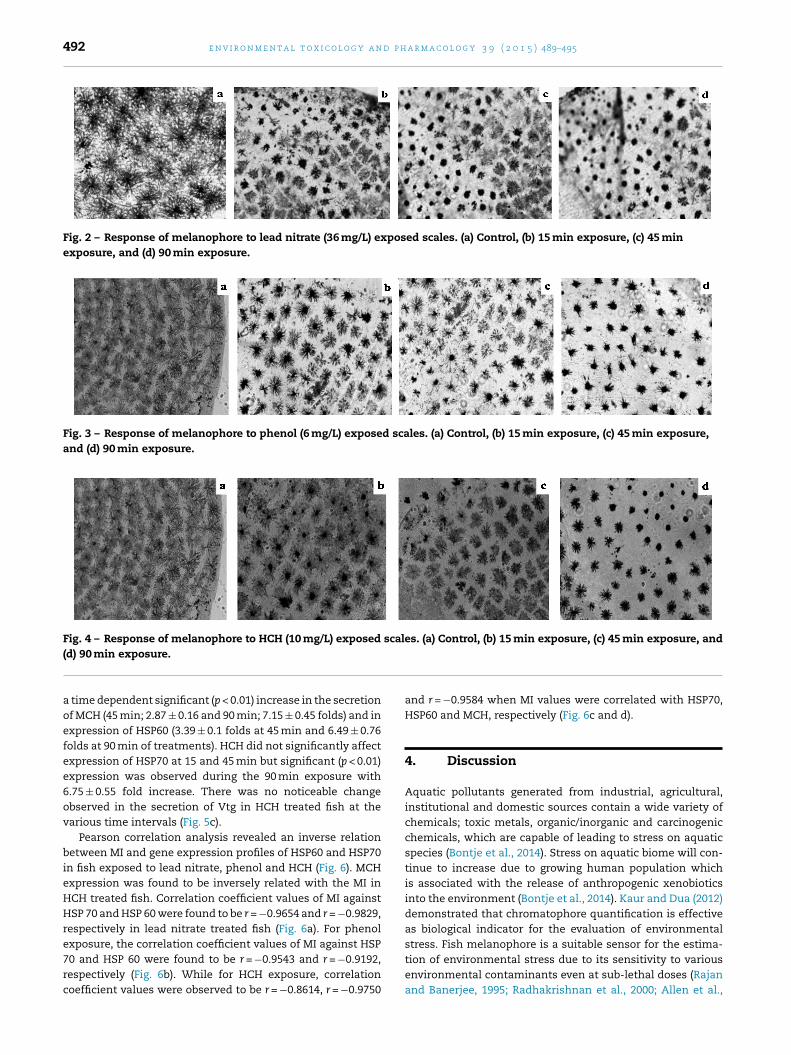
492 e n v i r o n m e n t a l t o x i c o l o g y a n d p h a r m a c o l o g y 3 9 ( 2 0 1 5 ) 489–495
Fig. 2 – Response of melanophore to lead nitrate (36 mg/L) exposed scales. (a) Control, (b) 15 min exposure, (c) 45 minexposure, and (d) 90 min exposure.
Fig. 3 – Response of melanophore to phenol (6 mg/L) exposed scales. (a) Control, (b) 15 min exposure, (c) 45 min exposure,and (d) 90 min exposure.
Fig. 4 – Response of melanophore to HCH (10 mg/L) exposed scales. (a) Control, (b) 15 min exposure, (c) 45 min exposure, and
(d) 90 min exposure.a time dependent significant (p < 0.01) increase in the secretionof MCH (45 min; 2.87 ± 0.16 and 90 min; 7.15 ± 0.45 folds) and inexpression of HSP60 (3.39 ± 0.1 folds at 45 min and 6.49 ± 0.76folds at 90 min of treatments). HCH did not significantly affectexpression of HSP70 at 15 and 45 min but significant (p < 0.01)expression was observed during the 90 min exposure with6.75 ± 0.55 fold increase. There was no noticeable changeobserved in the secretion of Vtg in HCH treated fish at thevarious time intervals (Fig. 5c).
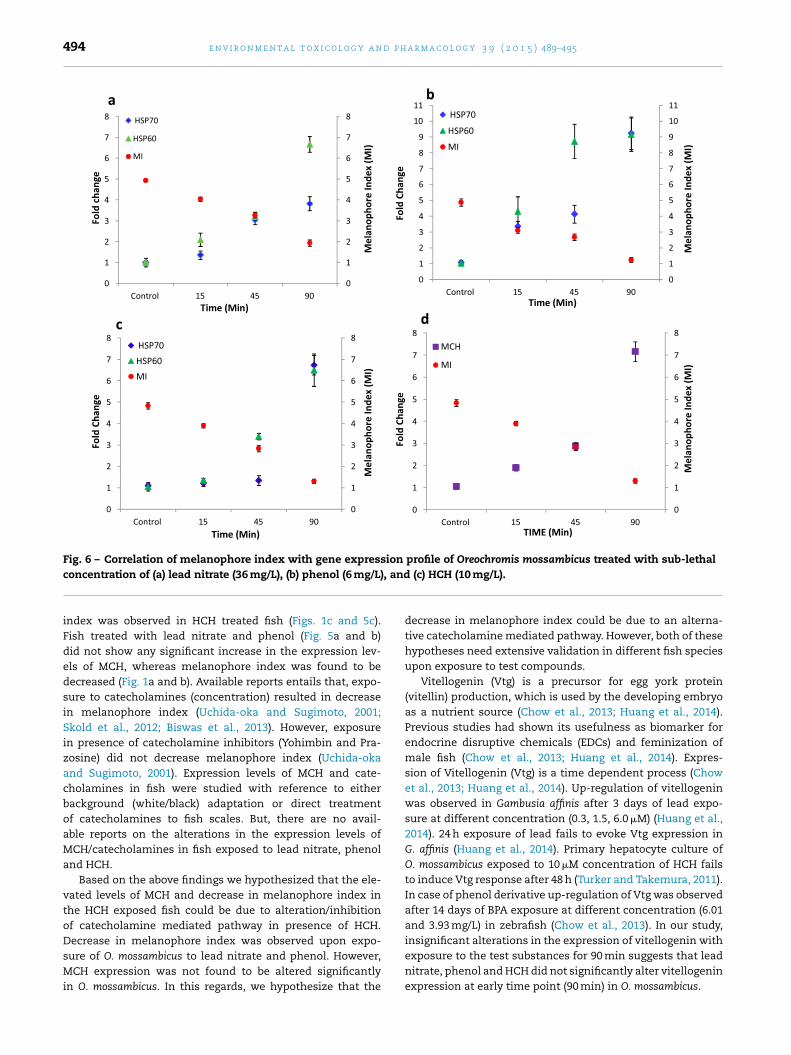
Pearson correlation analysis revealed an inverse relationbetween MI and gene expression profiles of HSP60 and HSP70in fish exposed to lead nitrate, phenol and HCH (Fig. 6). MCHexpression was found to be inversely related with the MI inHCH treated fish. Correlation coefficient values of MI againstHSP 70 and HSP 60 were found to be r = −0.9654 and r = −0.9829,respectively in lead nitrate treated fish (Fig. 6a). For phenol
exposure, the correlation coefficient values of MI against HSP70 and HSP 60 were found to be r = −0.9543 and r = −0.9192,respectively (Fig. 6b). While for HCH exposure, correlationcoefficient values were observed to be r = −0.8614, r = −0.9750and r = −0.9584 when MI values were correlated with HSP70,HSP60 and MCH, respectively (Fig. 6c and d).
4. Discussion
Aquatic pollutants generated from industrial, agricultural,institutional and domestic sources contain a wide variety ofchemicals; toxic metals, organic/inorganic and carcinogenicchemicals, which are capable of leading to stress on aquaticspecies (Bontje et al., 2014). Stress on aquatic biome will con-tinue to increase due to growing human population whichis associated with the release of anthropogenic xenobioticsinto the environment (Bontje et al., 2014). Kaur and Dua (2012)demonstrated that chromatophore quantification is effectiveas biological indicator for the evaluation of environmental
stress. Fish melanophore is a suitable sensor for the estima-tion of environmental stress due to its sensitivity to variousenvironmental contaminants even at sub-lethal doses (Rajanand Banerjee, 1995; Radhakrishnan et al., 2000; Allen et al.,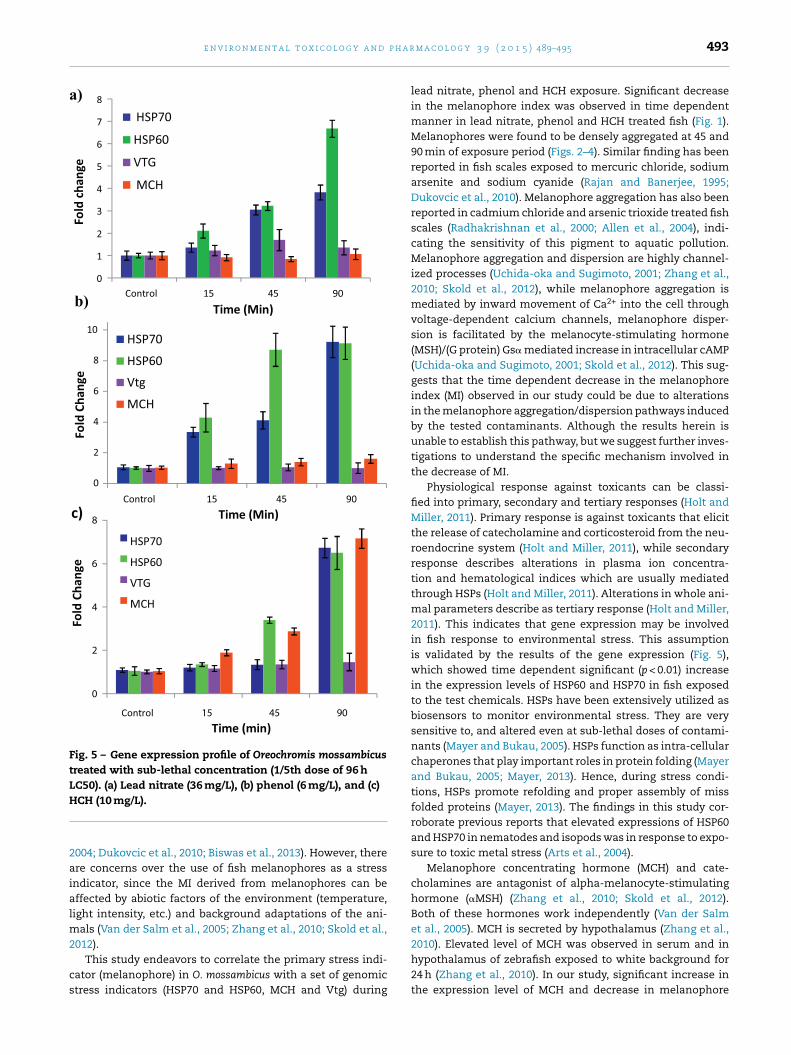
e n v i r o n m e n t a l t o x i c o l o g y a n d p h a r
0
1
2
3
4
5
6
7
8
Con trol 15 45 90
Fold
cha
nge
Time (Min)
HSP 70
HSP 60
VTG
MCH
a)
0
2
4
6
8
Con trol 15 45 90
Fold
Cha
nge
Time (min)
HSP70
HSP60
VTG
MCH
c)
0
2
4
6
8
10
Con trol 15 45 90
Fold
Cha
nge
Time (Min)
HSP 70
HSP 60
Vtg
MCH
b)
Fig. 5 – Gene expression profile of Oreochromis mossambicustreated with sub-lethal concentration (1/5th dose of 96 hLC50). (a) Lead nitrate (36 mg/L), (b) phenol (6 mg/L), and (c)H
2aialm2
cs
2010). Elevated level of MCH was observed in serum and in
CH (10 mg/L).
004; Dukovcic et al., 2010; Biswas et al., 2013). However, therere concerns over the use of fish melanophores as a stressndicator, since the MI derived from melanophores can beffected by abiotic factors of the environment (temperature,ight intensity, etc.) and background adaptations of the ani-
als (Van der Salm et al., 2005; Zhang et al., 2010; Skold et al.,012).
This study endeavors to correlate the primary stress indi-ator (melanophore) in O. mossambicus with a set of genomictress indicators (HSP70 and HSP60, MCH and Vtg) during
m a c o l o g y 3 9 ( 2 0 1 5 ) 489–495 493
lead nitrate, phenol and HCH exposure. Significant decreasein the melanophore index was observed in time dependentmanner in lead nitrate, phenol and HCH treated fish (Fig. 1).Melanophores were found to be densely aggregated at 45 and90 min of exposure period (Figs. 2–4). Similar finding has beenreported in fish scales exposed to mercuric chloride, sodiumarsenite and sodium cyanide (Rajan and Banerjee, 1995;Dukovcic et al., 2010). Melanophore aggregation has also beenreported in cadmium chloride and arsenic trioxide treated fishscales (Radhakrishnan et al., 2000; Allen et al., 2004), indi-cating the sensitivity of this pigment to aquatic pollution.Melanophore aggregation and dispersion are highly channel-ized processes (Uchida-oka and Sugimoto, 2001; Zhang et al.,2010; Skold et al., 2012), while melanophore aggregation ismediated by inward movement of Ca2+ into the cell throughvoltage-dependent calcium channels, melanophore disper-sion is facilitated by the melanocyte-stimulating hormone(MSH)/(G protein) Gs� mediated increase in intracellular cAMP(Uchida-oka and Sugimoto, 2001; Skold et al., 2012). This sug-gests that the time dependent decrease in the melanophoreindex (MI) observed in our study could be due to alterationsin the melanophore aggregation/dispersion pathways inducedby the tested contaminants. Although the results herein isunable to establish this pathway, but we suggest further inves-tigations to understand the specific mechanism involved inthe decrease of MI.
Physiological response against toxicants can be classi-fied into primary, secondary and tertiary responses (Holt andMiller, 2011). Primary response is against toxicants that elicitthe release of catecholamine and corticosteroid from the neu-roendocrine system (Holt and Miller, 2011), while secondaryresponse describes alterations in plasma ion concentra-tion and hematological indices which are usually mediatedthrough HSPs (Holt and Miller, 2011). Alterations in whole ani-mal parameters describe as tertiary response (Holt and Miller,2011). This indicates that gene expression may be involvedin fish response to environmental stress. This assumptionis validated by the results of the gene expression (Fig. 5),which showed time dependent significant (p < 0.01) increasein the expression levels of HSP60 and HSP70 in fish exposedto the test chemicals. HSPs have been extensively utilized asbiosensors to monitor environmental stress. They are verysensitive to, and altered even at sub-lethal doses of contami-nants (Mayer and Bukau, 2005). HSPs function as intra-cellularchaperones that play important roles in protein folding (Mayerand Bukau, 2005; Mayer, 2013). Hence, during stress condi-tions, HSPs promote refolding and proper assembly of missfolded proteins (Mayer, 2013). The findings in this study cor-roborate previous reports that elevated expressions of HSP60and HSP70 in nematodes and isopods was in response to expo-sure to toxic metal stress (Arts et al., 2004).
Melanophore concentrating hormone (MCH) and cate-cholamines are antagonist of alpha-melanocyte-stimulatinghormone (�MSH) (Zhang et al., 2010; Skold et al., 2012).Both of these hormones work independently (Van der Salmet al., 2005). MCH is secreted by hypothalamus (Zhang et al.,
hypothalamus of zebrafish exposed to white background for24 h (Zhang et al., 2010). In our study, significant increase inthe expression level of MCH and decrease in melanophore
494 e n v i r o n m e n t a l t o x i c o l o g y a n d p h a r m a c o l o g y 3 9 ( 2 0 1 5 ) 489–495
0
1
2
3
4
5
6
7
8
0
1
2
3
4
5
6
7
8
Con trol 15 45 90
Mel
anop
hore
Inde
x (M
I)
Fold
cha
nge
Time (Min)
HSP70
HSP60
MI
0
1
2
3
4
5
6
7
8
9
10
11
0
1
2
3
4
5
6
7
8
9
10
11
Con trol 15 45 90
Mel
anop
hore
Inde
x (M
I)
Fold
Cha
nge
Time (Min)
HSP 70
HSP60
MI
0
1
2
3
4
5
6
7
8
0
1
2
3
4
5
6
7
8
Con trol 15 45 90
Mel
anop
hore
Inde
x (M
I)
Fold
Cha
nge
Time (Min)
HSP 70HSP 60MI
0
1
2
3
4
5
6
7
8
0
1
2
3
4
5
6
7
8
Con trol 15 45 90
Mel
anop
hore
Inde
x (M
I)
Fold
Cha
nge
TIME (Min)
MCH
MI
a b
c d
Fig. 6 – Correlation of melanophore index with gene expression profile of Oreochromis mossambicus treated with sub-lethal), and
concentration of (a) lead nitrate (36 mg/L), (b) phenol (6 mg/Lindex was observed in HCH treated fish (Figs. 1c and 5c).Fish treated with lead nitrate and phenol (Fig. 5a and b)did not show any significant increase in the expression lev-els of MCH, whereas melanophore index was found to bedecreased (Fig. 1a and b). Available reports entails that, expo-sure to catecholamines (concentration) resulted in decreasein melanophore index (Uchida-oka and Sugimoto, 2001;Skold et al., 2012; Biswas et al., 2013). However, exposurein presence of catecholamine inhibitors (Yohimbin and Pra-zosine) did not decrease melanophore index (Uchida-okaand Sugimoto, 2001). Expression levels of MCH and cate-cholamines in fish were studied with reference to eitherbackground (white/black) adaptation or direct treatmentof catecholamines to fish scales. But, there are no avail-able reports on the alterations in the expression levels ofMCH/catecholamines in fish exposed to lead nitrate, phenoland HCH.
Based on the above findings we hypothesized that the ele-vated levels of MCH and decrease in melanophore index inthe HCH exposed fish could be due to alteration/inhibitionof catecholamine mediated pathway in presence of HCH.
Decrease in melanophore index was observed upon expo-sure of O. mossambicus to lead nitrate and phenol. However,MCH expression was not found to be altered significantlyin O. mossambicus. In this regards, we hypothesize that the(c) HCH (10 mg/L).
decrease in melanophore index could be due to an alterna-tive catecholamine mediated pathway. However, both of thesehypotheses need extensive validation in different fish speciesupon exposure to test compounds.
Vitellogenin (Vtg) is a precursor for egg york protein(vitellin) production, which is used by the developing embryoas a nutrient source (Chow et al., 2013; Huang et al., 2014).Previous studies had shown its usefulness as biomarker forendocrine disruptive chemicals (EDCs) and feminization ofmale fish (Chow et al., 2013; Huang et al., 2014). Expres-sion of Vitellogenin (Vtg) is a time dependent process (Chowet al., 2013; Huang et al., 2014). Up-regulation of vitellogeninwas observed in Gambusia affinis after 3 days of lead expo-sure at different concentration (0.3, 1.5, 6.0 �M) (Huang et al.,2014). 24 h exposure of lead fails to evoke Vtg expression inG. affinis (Huang et al., 2014). Primary hepatocyte culture ofO. mossambicus exposed to 10 �M concentration of HCH failsto induce Vtg response after 48 h (Turker and Takemura, 2011).In case of phenol derivative up-regulation of Vtg was observedafter 14 days of BPA exposure at different concentration (6.01and 3.93 mg/L) in zebrafish (Chow et al., 2013). In our study,
insignificant alterations in the expression of vitellogenin withexposure to the test substances for 90 min suggests that leadnitrate, phenol and HCH did not significantly alter vitellogeninexpression at early time point (90 min) in O. mossambicus.
p h a r
c(a(ieeeiatrta
ttbeca
C
T
T
Tb
A
To6(N
r
A
A
B
B
e n v i r o n m e n t a l t o x i c o l o g y a n d
The findings from this study clearly showed signifi-ant inverse correlation of the primary stress indicatormelanophore) with the functional stress indicators (HSP60nd HSP70) in fish exposed to different tested contaminantsFig. 6). MCH expression was found to be specifically elevatedn HCH treated fish with inverse correlation to MI. Vitellogeninxpression was found to show insignificant variation in fishxposed to the tested contaminants. Variations in the genexpression patterns depend on the nature of tested chem-cals which may depend on their specific mechanisms ofctions. Thus, considering the wide range of contaminants inhe aquatic ecosystem, functional stress indicators that mayespond to these varieties of contaminants need to be inves-igated for proper understanding of the basic mechanisms ofquatic pollutants induced stress in organisms.
In conclusion, variation in melanophore index (MI) in fishogether with the battery of functional stress indicators facili-ates a better measurement of environmental stress causedy environmental contaminants. This will not only help inliminating erroneous results but also aid in establishingontaminant specific physiological responses in the aquaticnimal models.
onflict of interest
he authors declare that there are no conflicts of interest.
ransparency document
he Transparency document associated with this article cane found in the online version.
cknowledgements
he authors are thankful to the Department of Biotechnol-gy, Government of India (Project No.: BT/PR10940/BCE/08/85/2008) for providing necessary funding. One of the authorsPDPR) was supported by Indian National Science Academy,ew Delhi, through the INSA Honorable Scientist award.
e f e r e n c e s
llen, T., Awasthia, A., Rana, S.V.S., 2004. Fish chromatophores asbiomarkers of arsenic exposure. Environ. Biol. Fishes 71, 7–11.
rts, M.S.J., Schill, R.O., Knigge, T., Eckwert, H., Kammenga, J.E.,Kohler, H.R., 2004. Stress proteins (hsp70, hsp60) induced inisopods and nematodes by field exposure to metals in agradient near Avonmouth, UK. Ecotoxicology 13, 739–755.
iswas, S.P., Jadhao, A.G., Palande, N.V., 2013. Role ofcatecholamines and nitric oxide on pigment displacement ofthe chromatophores of freshwater snakehead teleost fish,
Channa punctatus. Fish Physiol. Biochem. 1, 1–9.ontje, D., Kooi, B.W., VanHattum, B., 2014. Sublethal toxic effectsin a generic aquatic ecosystem. Ecotoxicol. Environ. Saf. 74,929–939.
m a c o l o g y 3 9 ( 2 0 1 5 ) 489–495 495
Chow, W.S., Chan, W.K., Chang, K.M., 2013. Toxicity assessmentand vitellogenin expression in zebrafish (Danio Rerio) embryosand larvae acutely exposed to bisphenol A, endosulfan,heptachlor, methoxychlor and tetrabromobisphenol A. J. Appl.Toxicol. 33, 670–678.
Dukovcic, S.R., Hutchison, J.R., Trempy, J.E., 2010. Conservation ofthe chromatophore pigment response. J. Appl. Toxicol. 30,574–581.
Duncan, K.D., Willis, M.D., Krogh, E., Gill, T.C.G., 2013. A miniaturecondensed-phase membrane introduction mass spectrometry(CP-MIMS) probe for direct and on-line measurements ofpharmaceuticals and contaminants in small, complexsamples. Rapid Commun. Mass Spectrom. 27, 1213–1221.
Hogben, L., Slome, D., 1931. The pigmentary effector system. VI.The dual character of endocrine co-ordination in amphibiancolour change. JSTOR 108, 10–53.
Holt, E.A., Miller, S.W., 2011. Bioindicators: using organisms tomeasure environmental. Nat. Educ. Knowl. 3, 1–8.
Huang, G., Ying, G., Liang, Y., Liu, S., Liu, Y., 2014. Expressionpatterns of metallothionein, cytochrome P450 1A andvitellogenin genes in western mosquitofish (Gambusia affinis)in response to heavy metals. Ecotoxicol. Environ. Saf. 105,97–102.
Kaur, R., Dua, A., 2012. Fish scales as indicators of wastewatertoxicity from international water channel Tung Dhab drain.Environ. Monit. Assess. 184, 2729–2740.
Mayer, M.P., Bukau, B., 2005. Hsp70 chaperones: cellular functionsand molecular mechanism. Cell. Mol. Life Sci. 62, 670–684.
Mayer, M.P., 2013. Hsp70 chaperone dynamics and molecularmechanism. Trends Biochem. Sci. 38, 507–514.
OECD Guidelines for Testing of Chemicals, No. 203. Fish, AcuteToxicity Test. Adopted by the Council on 17th July 1992.
Radhakrishnan, M.V., Hemalatha, S., Paul, V.I., 2000. Effect ofcadmium chloride on the melanophores of Channa striatus(Bloch). Indian J. Fish 47, 135–141.
Rajan, M.T., Banerjee, T.K., 1995. Melanophore indexing: a newbio-assay technique for the analysis of acute heavy metal(HgCl2) toxicity. Biomed. Environ. Sci. 8, 226–231.
Skold, H.N., Aspengren, S., Wallin, M., 2012. Rapid colour changesin fish and amphibians – functions, regulation and emergingapplication. Pigment Cell Melanoma Res. 26, 29–38.
Tine, M., Bonhomme, F., McKenzie, D.J., Durand, J.D., 2010.Differential expression of the heat shock protein Hsp70 innatural populations of the tilapia, Sarotherodonmelanotheron, acclimatised to a range of environmentalsalinities. BMC Ecol. 10, 1–8.
Turker, H., Takemura, A., 2011. Effects of environmentalcontaminants and natural substances on vitellogenesis intilapia primary hepatocytes. Turk. J. Fish. Aquat. Sci. 11,539–545.
Uchida-oka, N., Sugimoto, M., 2001. Norepinephrine inducesapoptosis in skin melanophores by attenuating cAMP-PKAsignals via �2-adrenoceptors in the Medaka, Oryzias latipes.Pigment Cell Res. 14, 356–361.
Van der Salm, A.L., Metz, J.R., Wendelaar Bonga, S.E., Flik, G., 2005.Alpha-MSH, the melanocortin-1 receptor and backgroundadaptation in the Mozambique tilapia, Oreochromismossambicus. Gen. Comp. Endocrinol. 144, 140–149.
WHO, 1990. Environmental health criteria for methylmercury. In:Environmental Health Criteria No. 101. WHO, Geneva,pp. 144.
Zhang, C., Song, Y., Thompson, D.A., Madonna, M.A., Millhauser,G.L., Toro, S., Varga, Z., Westerfield, M., Gamse, J., Chen, W.,Cone, R.D., 2010. Pineal specific agouti protein regulatesteleost background adaptation. PNAS 107, 20164–20171.
Related Documents