AN ABSTRACT OF THE THESIS OF STANLEY EUGENE CORDER for the (Name) MASTER OF SCIENCE (Degree) inMECHANICAL ENGINEERING presented on /k1l) I Z, /96 7 (Major) (Date) Title: INDENTATION HARDNESS OF DOUGLAS FIR AND WESTERN HEMLOCK LUMBER RELATED TO DENSITY Abstract approved William D. McMullen Indentation hardness tests were made on sections of 211 pieces of Douglas fir and 208 pieces of Western hemlock at a moisture con- tent of about 11 percent. Specific gravity and visual-density evalua- tions were also determined. Correlation coefficients for linear regression of density, as measured by specific gravity, on average standard hardness were 0. 826 for Douglas fir and 0. 842 for Western hemlock. Classification according to specific gravity was better using hardness classes compared to using visual-density classes. Redacted for Privacy

Welcome message from author
This document is posted to help you gain knowledge. Please leave a comment to let me know what you think about it! Share it to your friends and learn new things together.
Transcript

AN ABSTRACT OF THE THESIS OF
STANLEY EUGENE CORDER for the(Name)
MASTER OF SCIENCE(Degree)
inMECHANICAL ENGINEERING presented on /k1l) I Z, /96 7
(Major) (Date)
Title: INDENTATION HARDNESS OF DOUGLAS FIR AND WESTERN
HEMLOCK LUMBER RELATED TO DENSITY
Abstract approvedWilliam D. McMullen
Indentation hardness tests were made on sections of 211 pieces
of Douglas fir and 208 pieces of Western hemlock at a moisture con-
tent of about 11 percent. Specific gravity and visual-density evalua-
tions were also determined.
Correlation coefficients for linear regression of density, as
measured by specific gravity, on average standard hardness were
0. 826 for Douglas fir and 0. 842 for Western hemlock.
Classification according to specific gravity was better using
hardness classes compared to using visual-density classes.
Redacted for Privacy

Indentation Hardness of Douglas Fir and WesternHemlock Lumber Related to Density
by
Stanley Eugene Corder
A THESIS
submitted to
Oregon State University
in partial fulfillment ofthe requirements for the
degree of
Master of Science
June 1967

APPROVED:
.
Associate Professor of Mechanical EngineeringIn Charge of Major
Head of Departmentof Mechanical Engineering
Dean of Graduate School
Date thesis is presented /1/I9 I:, /'-/ '7
Typed by Clover Redfern for Stanley Eugene Corder
Redacted for Privacy
Redacted for Privacy
Redacted for Privacy
ACKNOWLEDGEMENTS
The author wishes to express appreciation to all whohave contributed to this project.
Dr. William McMullen and Dr. Lyle Calvin offered
guidance and helpful suggestions. James Johnson and
Thomas Albert selected the material and carried out the
processing in conjunction with a related investigation.
Arne Seiverts assisted in conducting hardness tests while
Ray huna and Gene Kelsey helped with drafting. Corn-
puter programming was provided by David Niess.

TABLE OF CONTENTS
Page
INTRODUCTION 1
Variability of Wood 1
Specific Gravity and Physical Properties a
Lumber Grading 3Growth Rate and Properties 4Summerwood and Properties 4
PURPOSE 6
INDENTATION HARDNESS 7
PROCEDURE 11Material Selection 11Processing of Material 1 2
Hardness Tests 13
RESULTS 17Load-penetration 17Hardness and Specific Gravity 17Specific -gravity Clas sification 28
DISCUSSION 36Load-penetration 36Hardness-specific gravity 36Visual-density Classes 39
CONCLUSIONS 41
BIBLIOGRAPHY 42

LIST OF FIGURES
Figure Page
1. Sketch showing method of conducting hardness test. 15
2. Overall view of hardness test. 16
3. Closeup view of hardness tool. 16
4. Load-penetration curves for four hardness observa-tions of a specimen with 0. 501 specific gravity. 18
5. Load-penetration curves for four hardness observa-tions of a specimen with 0. 314 specific gravity. 19
6. Load-penetration relationship using average valuesfor all tests of Douglas fir. 20
7. Photograph showing indentation resulting from indenterloads of (A) 545 (maximum), (B) 200, (C) 100 and (D) 50pounds. 21
8. Linear regression of specific gravity on averagehardness for 211 pieces of Douglas fir. 22
9. Linear regression of specific gravity on averagehardness for 208 pieces of Western hemlock. 23
10. Linear regression of specific gravity on firsthardness for 211 pieces of Douglas fir. 25
11. Linear regression of specific gravity on firsthardness for 208 pieces of Western hemlock. 26
1 2. Histogram showing distribution of specific gravity forvisual-density classes of 211 pieces of Douglas firlumber. 31
1 3. Histogram showing distribution of specific gravity forvisual-density classes of 208 pieces of Western hemlocklumber. 32
14. Histogram showing distribution of specific gravity foraverage-hardness classes of 211 pieces of Douglas firlumber 33
15. Histogram showing distribution of specific gravity foraverage-hardness classes of 208 pieces of Westernhemlock lumber. 34

LIST OF TABLES
Table Page
1. Results of linear regression analysis taking specificgravity on various measures of hardness for 211 piecesof Douglas fir. 24
2. Results of linear regression analysis taking specificgravity on various measures of hardness for 208 piecesof Western hemlock. 27
3. Mean values and standard deviations of properties forlumber tested. 28
4. Distribution of specimens by visual-density classes. 29
5. Comparison of mean values of specific gravity for visual-density and average-hardness classes of lumber. 30
6, Comparison of specific-gravity segregation by visual-density and by average-hardness classes for Douglas fir. 35

INDENTATION HARDNESS OF DOUGLAS FIR ANDWESTERN HEMLOCK LUMBER
RELATED TO DENSITY
INTRODUCTION
Wood is one of the most common structural materials. Most
residences in this country use wood in the major structural building
elements.
Variability of Wood
Trees, from which wood in the form of lumber is obtained,
grow under a wide range of environmental conditions. Soil, temper-
ature, moisture, growing space and genetic inheritance are some of
the factors which influence the physical properties of the wood from
a tree. It is, then, not surprising that there is quite a bit of varia-
tion in the physical properties of lumber. Some features, such as
knots, which occur in lumber make it visually obvious that physical
properties, such as strength, vary markedly from piece to piece of
lumber. Even when the lumber is free of apparent growth character-
istics, like knots, there is still much variation of properties of the
clear wood.
To illustrate the variability which might be expected of the pro-
perty specific gravity in a species such as coast-type Douglas fir,

2
Markwardt (10) noted that in measuring 1000 pieces the heaviest
piece was about twice as heavy as the lightest piece. Most of the val-
ues of specific gravity were close to the mean, but the extremes were
different by a factor of about two. The distribution of values follows
a normal frequency distribution, as would be expected.
Specific Gravity and Physical Properties
Density is the weight of a substance per unit volume while spe-
cific gravity is the density of the substance in question divided by the
density of water. Wood volume varies with moisture content of wood.
Because of this variation, expressions of density, or specific gravi-
ty, should include a statement of the moisture content at which vol-
ume measurements were made. It is customary to exclude the weight
of water when referring to density or specific gravity of wood.
The specific gravity of cell wall substance of wood is fairly con-
stant at a value of about 1.53 (11). Specific gravity of wood is, then,
normally directly related to the amount of cell-wall substance pre-
sent in the wood.
It is reasonable to expect that physical properties of clear wood,
such as strength, might be related to specific gravity of the wood.
Specific gravity is, indeed, related to strength as shown by many in-
vestigators (10, 11, 16). McKimmy (1.1) found a coefficient of corre-
lation of 0. 91 between modulus of rupture and specific gravity in

young-growth Douglas fir.
Lumber Grading
3
In order to make the most efficient use of structural lumber, it
is desirable and necessary to sort pieces into classes of expected
strength. Rules have been established (2, 16, 18) which guide the
grading of structural lumber.
The principles of stress grading involve first establishing basic
stresses for the clear wood of a species. Basic stress is a general-
ized working strength value for the clear wood. Basic stresses in-
dude factors for variability, safety factor, and long-term loading.
Other characteristics such as knots, slope of grain, checks and splits
are assessed visually and accounted for in the strength ratio.
Strength ratio is the estimated ratio of the strength of the piece with
strength-reducing characteristics divided by the strength of similar
clear wood. Strength ratios are multiplied by the basic stress to ar-
rive at a working stress for structural design.
Basic stresses for the clear wood of a species must take into
account the natural variability of the clear wood. If it were possible
to detect pieces with higher strength, then that group of pieces could
be assigned a higher basic stress. For some species of wood, such
as Douglas fir, there are criteria for increasing basic stresses of
certain classes of material (2).

4
Growth Rate and Properties
Studies (1, 4) have shown that rate of growth of the tree has an
effect on specific gravity and strength. In general, fast-growing
wood is lower in specific gravity and strength than wood grown more
slowly. Grading rule restrictions (2, 18) imply that wood which is
extremely slow-growing is also lower in properties than material
grown at an intermediate rate. Alexander (1) and Drow (4, p. 14),
however, do not show lower strength and specific gravity for extreme-
ly slow-growing wood.
Grading rules for Douglas fir (2, 16, 18) allow an increase in
basic stresses of about one-fifteenth for material meeting the quali-
fications of close-grained. Close-grained Douglas fir is defined as
pieces of lumber which have an average of not less than six nor more
than 30 annual growth rings per inch. Pieces averaging at least five
or more than 30 rings per inch are accepted if they consist of one-
third or more summerwood. Definition of summerwood is in the fol-
lowing section.
Summerwood and Properties
Each year a tree will add an annual growth ring. The inner
part of the growth ring is formed first in the growing season and is
called springwood. The outer part of the ring is formed later in the

5
growing season and is called summerwood. Springwood, in general,
has cells with large cavities and thin walls, while summerwood has
smaller cavities and thicker walls.
In some species, such as Douglas fir, springwood differs mark-
edly from summerwood in both appearance and in physical properties.
Summerwood is darker in color, more dense, and consequently
stronger than springwood.
A study (14) in which summerwood was precisely defined and
percent s umme rwood determinations were made microscopically, re -
ported a high correlation relating amount of summerwood to specific
gravity for Douglas fir.
The proportion of summerwood is sometimes used to evaluate
wood quality. Grading rules for Douglas fir (2, 16, 18) allow an in-
crease in basic stresses of about one-sixth for material meeting the
qualifications of dense. Dense Douglas fir is defined as material
with a growth rate of not less than six annual rings per inch contain-
ing at least one-third summerwood. Douglas fir is also accepted as
dense if it has five annual growth rings per inch and contains one-
half or more summerwood.

PUR POSE
As an aid in assessing clear wood quality, lumber grading
rules use growth rate and proportion of summerwood as criteria. It
was reasoned that hardness also might be a useful indicator for
evaluating wood quality or specific gravity.
Using Douglas fir and Western hemlock lumber, the purpose of
this study was:
1. To determine the correlation between hardness and speci-
fic gravity.
Z. To compare several ways of expressing hardness.
3. To compare hardness as an indicator of specific gravity
with growth rate and proportion of summerwood as indica-
tors of specific gravity.

7
INDENTATION HARDNESS
The resistance of a material to indentation is a property of the
material called indentation hardness. Hardness tests are used exten-
sively in the metal-working industry for evaluating materials.
Lysaght (9) stated hardness tests were probably the most frequently
used test in the matal-working industry during World War II, amount-
ing to over 50, 000, 000 hardness determinations a day in this country.
Hardness tests are non-destructive, relatively simple, quickly made,
and low in cost which accounts for their widespread application with
metals. Physical properties of metals, especially steels, are relat-
ed to hardness (9, 13, 19) so that the test is normally employed to
determine the suitability of a material for a certain purpose.
Measurement of indentation hardness involves the use of a giv-
en type of indenter and applied load. Some tests use a fixed load, or
loads, while hardness is related to area of indentation or depth of in-
dentation. Other hardness tests are conducted by forcing the indenter
to a fixed depth and using load required as a measure of hardness.
Two common tests for metals are the Brinell and Rockwell hardness
tests.
The Brinell hardness test is made by applying a fixed load, us-
ually 3000 kilograms, to a 10 millimeter diamete,r hardened steel
ball. The load is then removed and the diameter of impression is
measured under a microscope. The Brinell number is calculated by
dividing the load by the spherical area of the indentation.
The Rockwell hardness test commonly uses either a one -
sixteenth inch diameter steel ball or a conical-shaped diamond indent-
er. A. small initial load is applied followed by the major load. An
indication of hardness is obtained by measuring the difference in
depth of penetration before and after application of the major load.
The Rockwell number is arbitrary and the Rockwell scale, indicating
the indenter and major load, must be noted.
There is only one recognized standard indentation hardness
test for wood in use in this country, which is the American Society
for Testing and Materials (hereafter called ASTM) ball-hardness test
(2) for wood, A.STM (designation D 143). The test uses a steel ball
indenter 0.444 inches in diameter. Hardness is defined as the load
in pounds required to imbed the ball to a depth of one-half its diamet-
er. Weatherwax, Erickson, and Stamm (17) say the test was devel-
oped by Janka in 1906 and later adopted as an ASTM standard.
Other hardness tests have been used with wood. Liska (8) ex-
perimented with several types of hardness tests including a modified
Rockwell test with both ball and rectangular flat-end penetrators, and
a laboratory hand hardness tester with conical indenters. He con-
cluded the ASTM ball hardness test was satisfactory for density
range of normal wood, but did not cover the range of densified or

resin-impregnated wood.
Weatherwax, Erickson, and Stamm (17) found that the standard
ASTM hardness tester could be used over a broad specific-gravity
range, including resin-impregnated woods if the test procedure was
modified. They used the standard test indenter but plotted a load-
penetration curve. The slope of this curve was linear over a major
part of the range of this test. Hardness then was expressed in terms
of the slope of the linear part of the load-penetration curve. It was
found that for normal wood, standard ASTM hardness and slope-of-
curve hardness were closely related.
Baker (3) and Tu (15) used small, flat, square-ended indenters
to measure the hardness of springwood and summerwood separately.
Correlation of hardness to specific gravity was low with one test (3)
but relatively high in the other (15).
Kloot (5, 6) explored a hardness test for wood in which he used
a falling-ball. A. sheet of carbon paper and a sheet of white paper
were placed on the specimen which provided a record of the area of
contact at impact. The surface area was then a measure of wood
hardness. It was indicated (6) that the ASTM ball hardness test gave
a slightly higher correlation with wood specific gravity than did the
impact hardness.
Wood and Soltis (ZO) used a hardness tester developed by the
Western Pine Association to test hardness of lumber. The indenter

10
was an inverted V-shaped metal blade which was loaded by a falling
weight. Length of the impression was a measure of hardness. They
concluded (20, p. )IT a trend toward correlation of hardness
with specific gravity, but with considerable scatter of gravity values
at a specific hardness level.

ii
PROCEDURE
Material Selection
Material used in this study was originally selected for use in a
related investigation. It was planned to obtain a representative sam-
pie of 225 pieces of lumber from each of two species, Douglas fir and
Western hemlock. Pieces of lumber included grades of Select Struc-
tural, Construction, and Utility; and sizes of nominal two by four,
two by six, and two by ten inches in cross section.
Material was initially selected from five different sawmills in
Western Oregon. Selection was accomplished at a mill by taking
every fifth piece of lumber from the top part of an available stacked
unit of lumber until five pieces of a particular species, grade, and
size were obtained. A. similar procedure was repeated at a mill un-
til the three grades and three sizes of lumber were obtained for each
species. Since the five sawmills initially visited did not have all
grades and sizes of Western hemlock, it was necessary to visit three
additional mills to complete the lumber selection.
Lumber at the time of selection was planed and kiln-dried to
about 19 percent moisture. Length of the pieces ranged from ten to
sixteen feet.
12
Processing of Material
Material, after selection, was taken to the Forest Research
Laboratory where it was trimmed to a length of 92 inches and air-
dried to a moisture content of about 11 percent. Moisture content
was determined with an electric moisture meter using a needle pene-
tration depth of one-third of an inch to obtain a reading reflecting av-
erage moisture content, An average of four measurements along the
length of the piece was used for moisture content.
Width and thickness of each piece was measured at mid-length
to the nearest 0. 01 inch and weight was determined to the nearest 0. 1
pound. Volume of the piece was calculated and specific gravity was
then determined using weight and volume. Specific gravity was based
on oven-dry weight and volume at about 11 percent moisture.
The growth rate in terms of average number of rings per inch
was measured on one end of each piece of lumber as given in lumber
grading rules (2, 18). A. visual evaluation was also made to note if a
piece averaged one-third or more summerwood. Pieces were given
a visual density rating determined by growth rate and percent sum-
merwood. The visual density rating was based on grading rule clas-
sification (2) and were as follows:
1. A rating of Ho? was given pieces with a growth rate of less
than 4 rings per inch.

13
2. A rating of "1" indicated the piece met qualifications for
medium grain which was 4 or more annual rings per inch.
3. A rating of "2" included material qualifying as close grain,
that is, pieces with not less than six nor more than 30 rings
per inch. Pieces with at least five and more than 30 rings
per inch were acceted if they had one third or more sum-
merwood.
4. A rating of "3" was for pieces qualifying as dense. To
qualify as dense, a piece must have six or more rings per
inch and, in addition, have one-third or more summerwood.
The above classifications follow ASTM (D 245) grading rules (2)
procedure with the exception that material qualifying as dense, under
ASTM, also includes pieces with four or more rings per inch if they
have one-half or more summerwood. Grading rules (2, 18) restrict
the above classifications to Douglas fir and southern yellow pine but
the same classifications were also used for Western hemlock in this
study for comparison purposes. The highest rating number for which
a piece was qualified determined the rating number of that piece.
Hardness Tests
For a related investigation, other physical tests were carried
out with the pieces of lumber. A short section about 12 to 18 inches
long was then cut from each piece of lumber and hardness

14
determinations were made on the sections.
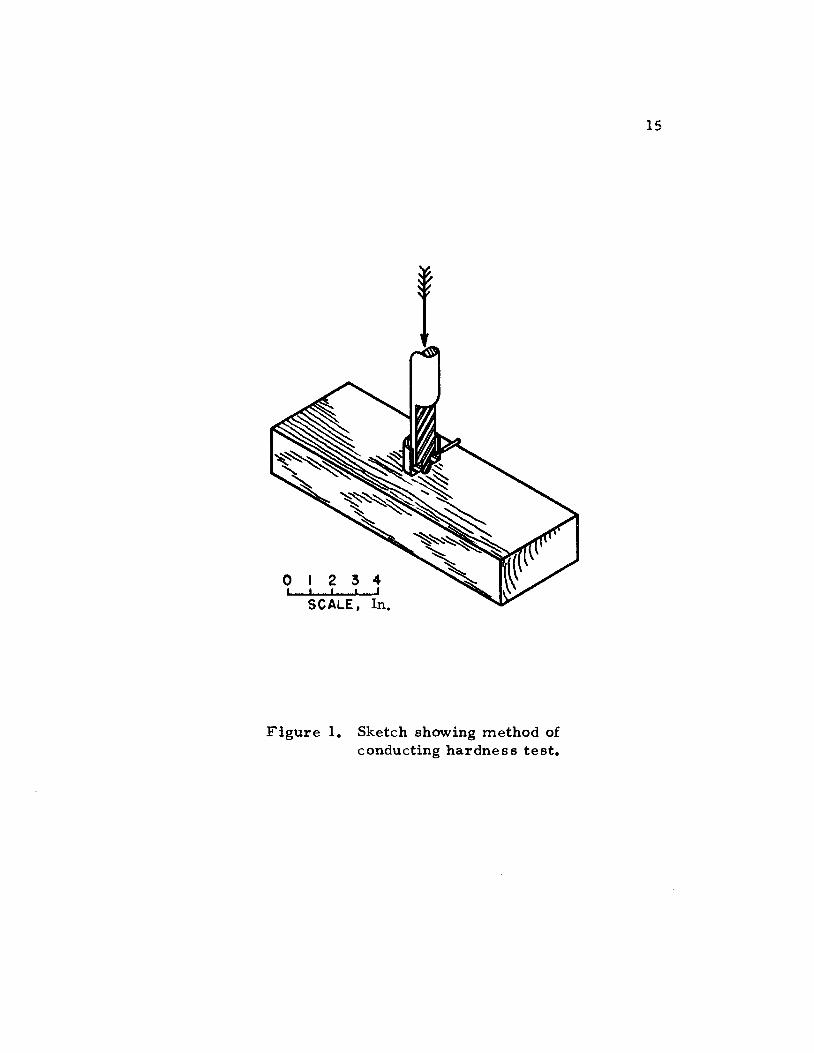
Hardness tests were made using standard ASTM (D 143) proce-
dures (2). A steel ball 0. 444 inches in diameter was forced into the
wood specimen to a depth of 0. 222 inches, as indicated by tightening
of a collar (Figure 1). The load, in pounds, when the collar tighten-
ed is a measure of hardness. In addition to the standard measure of
hardness, measurements were made of ball penetration at loads of50, 100 and 200 pounds.
The method of conducting the hardness test is illustrated in
Figure 1. An overall view of the testing apparatus is shown in Figure
2 with a closer view of the hardness tool in Figure 3.
Four hardness tests were made on each specimen. The firstand second tests were made on one wide face with the third and fourth
tests being made on the other wide face of the piece of lumber.
Hardness was expressed in seven different ways:
1. Penetration at a load of 50 pounds.
2. Penetration at a load of 100 pounds.
3. Penetration at a load of 200 pounds.
4. Penetration difference between loads at ZOO and 100 pounds.
5. Penetration difference between loads at 200 and 50 pounds.
6. Penetration difference between loads at 100 and 50 pounds.
7. Load, in pounds, at a penetration of 0. 222 inches.
It was mentioned that 225 pieces of each species was collected for
testing. Duringprocessing, some pieces were lostsothathardness tests
were made with Zilpieces of Douglas fir and 208 pieces of Westernhemlock.
15
-J
Figure 1. Sketch showing method ofconducting hardness test.

16
Figure 2. Overall view of hardness test.
Figure 3. Closeup view of hardness tool.

17
RESIJ LTS
Load-penetration
Typical load-penetration curves are shown in Figures 4 and 5.
Curves shown in Figure 4 were obtained using a specimen with a rel-
atively high specific gravity of 0. 501. Curves given in Figure 5 were
obtained from a specimen with a relatively low specific gravity of
0. 314. When the average values for all hardness tests of Douglas fir
are plotted, the load-penetration relationship given in Figure 6 is ob-tame d.
Relative size of indentations made at indenter loads of 50, 100,
ZOO, and 545 pounds is illustrated for a typical specimen in the pho-tograph in Figure 7. The indentation shown in 1'A." is when the ball
is at a depth of one-half its diameter, or 0. Z22 inches. The standard
hardness test gives such an indentation.
Hardness and Specific Gravity
The relationship between specific gravity and average standard
hardness for Douglas fir is shown in Figure 8. A calculated line of
linear regression is included in the Figure. A similar relationshipand linear regression for Western hemlock is presented in Figure 9.
Average hardness is the average of four determinations for each spec-ime n

18
7':
6C
9 400
0
300
20
10
o First observationSecond
A Third£ Fourth
0 0.1 0.2Penetration, inches
Figure 4. Load-penetration curves for four hardnessobservations of a specimen with 0. 501 specificgravity.

19
400
300
aa
0200
100
F
I I I
o First observationSecond
A Third£ Fourth
0. 1Penetration, inches
0. 2
FIgure 5. Load-penetration curves for four hardnessobservations of a specimen with 0.314 specificgravity.

zo
500
400
004
'd 300
0
200
100
I-
Penetration, inches
Figure 6. Load-penetration relationship using average valuesfor all hardness tests of Douglas fir.

a'
Figure 7. Photograph showing indentation resultingfrom indenter loads of (A) 545 (maximum),(B) 200, (C) 100 and (D) 50 pounds.

0,
.0.
00
U'-49-4.r4
Ucjj
0.
0.
22
00D 0
00
O00 9)
0 0000 000 000000 0 0
00a:x90
c10 o0 0 00 0
0 0
0d900
0oo8
0 0
0
I I I I I I I I
I'. - I 1'. A t. f / ( 1'. r , , ,s ,1 UJV OVU I'JVV
hardness, pounds
Figure 8. Linear regression of specific gravity on averagehardness for 211 pieces of Douglas fir.

L!J
0.ii 0c3
bfi
U
U1)
Cr1
0M
o.t
01,0 000
/v0
o0côQ
0
I00°
0,31 0
0di#I0 00 400 600 800 1000
Average hardness, pounds
Figure 9. Linear regression of specific gravity on averagehardness for 208 pieces of Western hemlock.
Z3

24The relationship and linear regression between specific gravity
and one hardness determination for each specimen- -the first deter-
mination--is shown in Figure 10 for Douglas fir and in Figure 1]. for
Western hemlock.
A summary of linear regressions showing correlation coeffi-
cients and slopes of the linear regression line for the relationships
between specific gravity and the different measures of hardness is
listed in Table 1 for Douglas fir and in Table 2 for Western hemlock.
Table 1. Results of linear regression analysis takingspecific gravity on various measures of hard-ness for 211 pieces of Douglas fir.
Hardness Index Correlationcoefficient
Slope
Standard hardness 0.826k 0. 0002961Load at 0. 222 inch
2 2penetration, pounds (0. 751) (0. 000 Z46)
Penetration at 50 lb. , -0. 388 -3. 60inches (-0. 269) (-1. 74)Penetration at 100 lb. , -0. 52.7 -. 324inches (-0. 390) (-1. 79)Penetration at 200 lb. , -0. 649 -2. 32inches (-0.531) (-1.56)Penetration difference -0. 699 -5. 13200-100 lb.,, inches (-0.540) (-3.08)Penetration difference -0. 702 -3.54200-50 lb. , inches (-0. 566) (-2. 31)Penetration difference -0. 605 -8. 35100-50 lb. , inches (-0. 447) (-4. 56)
'Values not in parenthesis are from average of four hardnessvalues per specimen.
2Values in parenthesis are for one hardness determination perspecimen.

U.14
U
(1)
0.
0.
0.
0.
25
First hardness, pounds
Figure 10. Linear regression of specific gravity on firsthardness for 211 pieces of Douglas fir.

0.
0.
"3
bO
C)
C)
U)
0.:
LI
I
00
0
S
.
S.
S
S.S
S
ULIII
0o
000/
8 000
u U.(IID
First hardness, pounds
Figure 11. Linear regression of specific gravity on firsthardness for 208 pieces of Western hemlock.
26

27
Table 2. Results of linear regression analysis takingspecific gravity on various measures of hardnessfor 208 pieces of Western hemlock.
Hardness Index Correlation Slopecoefficient
Standard hardness,Load at 0. 222 inch 0 84z 0 0003211
(0: 745)2 (0: 000252)2penetration, poundsPenetration at 50 lb. , -0. 478 -3. 90inches (-0. 365) (-2. 28)Penetration at 100 lb. , -0. 642 -3. 32inches (-0. 527) (-2. 24)Penetration at 200 lb. , -0. 762 -2. 11inches (-0. 660) (-1. 58)Penetration difference -0. 795 -4. 19200-100 lb., inches (-0. 648) (-2. 81)Penetration difference -0. 800 2. 95200-50 lb., inches (-0. 673) (-2. 10)Penetration difference -0. 716 -7.82100-50 lb., inches (-0. 562) (-4. 86)
1Values not in parenthesis are from average of four hardnessvalues per specimen.
2Values in parenthesis are for one hardness determination perspecimen.
Mean values and standard deviations of properties for the lum-
ber tested are presented in Table 3.
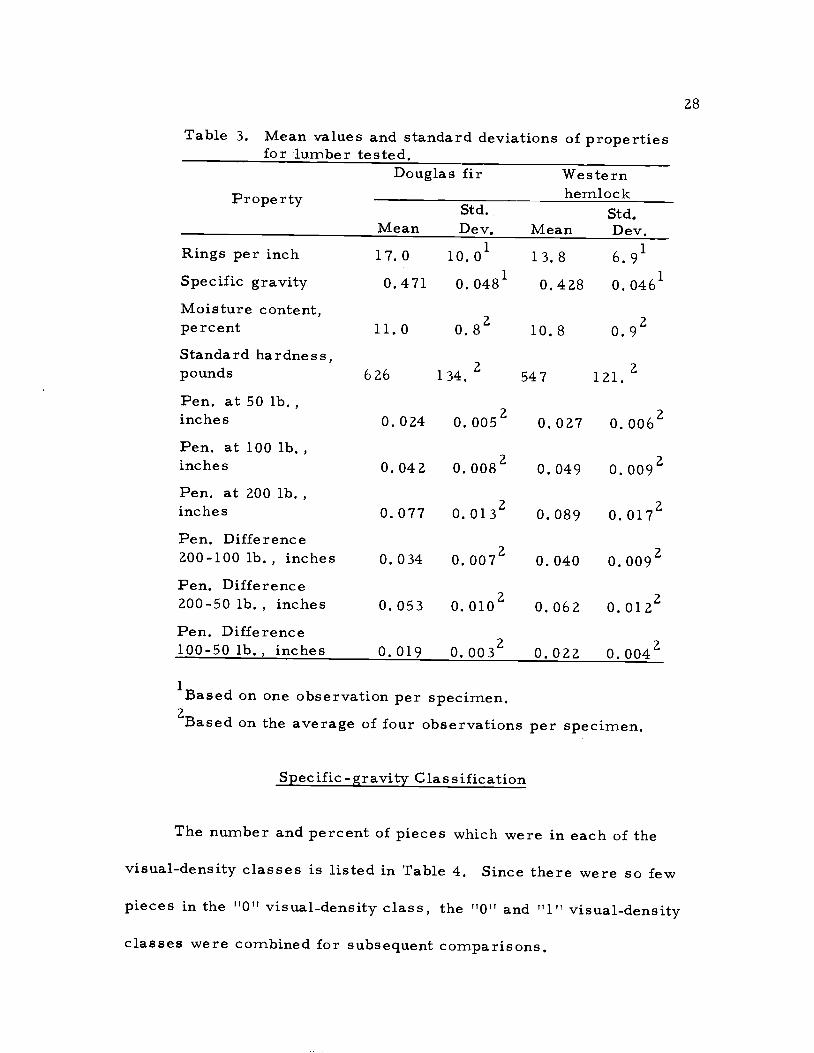
Table 3. Mean values and standard deviations of propertiesfor lumber tested.
Douglas fir WesternProperty hemlock
Std. Std,Mean Dev, Mean Dev.
Rings per inch 17.0 10.01 13.8 6.91Specific gravity 0.471 0.0481 0.428 0.046kMoisture content,
2percent 11.0 0.8 10.8 0.9Standard hardness,pounds 626 2134. 547 2121.Pen, at 50 lb.,inches 0. 024 20. 005 0. 027 20. 006Pen, at 100 lb.,inches 0,042 0.008 0.049 20.009Pen, at 200 lb.,inches 0.077 20.013 0.089 0.017Pen, Difference200-100 lb., inches 20.034 0.007 20.040 0.009Pen. Difference200-50 lb., inches 20.053 0.010 20.062 0.012Pen. Difference100-501b., inches 20,019 0.003 20.022 0.004
'Based on one observation per specimen,2Based on the average of four observations per specimen.
Specific -gravity Classification
The number and percent of pieces which were in each of the
visual-density classes is listed in Table 4. Since there were so few
pieces in the visual-density class, the and till visual-density
classes were combined for subsequent comparisons.

29
Table 4. Distribution of specimens by visual-densityclasses.
Visualdensityclass
0
1
2
3
Total
Douglas firNumbe rof pieces Percent
3 1.421 10.052 24.6
135 64.0211 100.0
Western hemlockNumber
of pieces Percent1 0.5
14 6.767 32.2
126 60.6208 100.0
A. histogram showing the distribution of specific gravity for
each of the visual-density classes of Douglas fir is illustrated in Fig-
ure 12. A similar histogram for Western hemlock is given in Figure
1 3.
In order to compare the specific gravity classification of visual-
density classes with average-hardness classes, pieces were classified
in three average-hardness classes. The same number of pieces (as
close as possible) were used for the average-hardness classes as
there were in the visual-density classes. The lowest visual-density
class (hbOl and TIlT) had 24 pieces for Douglas fir, class 2 had 52
pieces, and class 3 had 135 pieces. The average-hardness classes
of Douglas fir had 24 pieces with an average hardness below 495
pounds for class 1, 53 pieces between average hardness of 495 and
572 pounds for class 2, and 134 pieces above 572 pounds average
hardness in class 3. The average hardness classes for Western

30
hemlock consisted of pieces below 380 pounds average hardness in
class 1, pieces from 380 to 505 pounds in class 2, and pieces above
505 pounds average hardness in class 3.
A. histogram depicting the distribution of specific gravity for
each of the three average-hardness classes for Douglas fir is shown
in Figure 14. A. similar representation for Western hemlock follows
in Figure 15, while Table 5 compares mean specific gravity of visual-
density and average-hardness classes.
Table 5. Comparison of mean values of specificgravity for visual-density and ave rage-hardness classes of lumber.
Visual-density Douglas WesternClass fir hemlock
0 and 1 0.456 0.4092 0.455 0.4113 0.480 0.439
A.verage-hardnes sclass
1 0.409 0. 3452 0.447 0.4003 0.492 0.452

20 Visual density class 0 and 1
C)
1)
rx4
60
40
20
(1.3 0.4 0.5 0.6 0.7Specific gravity
Figure 12. Histogram showing distribution of specificgravity for visual-density classes of 211pieces of Douglas fir lumber.
31

32
201 Visual density class 0 and 1
U
C)
/oO
40
20
0.3 04 0.5 0.6 0.7Specific gravity
Figure 13. Histogram showing distribution of specificgravity for visual-density classes of 208pieces of Western hemlock lumber.

20
20
40
20
0,3 0.4 0.5 0.6 0.7Specific gravity
Figure 14. Histogram showing distribution of specificgravity for average-hardness classes of 211pieces of Douglas fir lumber.
33

U4)
4,
14
34
20 Average hardness Class I
40
20
40
0.3 0.4 0.5 0.6 0.7Specific gravity
Figure 15. Histogram showing distribution of specificgravity for average-hardness classes of 208pieces of Western hemlock.

35
A. tabular type of comparison can be made for visual density and
average hardness in their ability to classify by specific gravity.
Specific-gravity classes for Douglas fir were established in a manner
similar to the average-hardness classes. Class 1 specific gravity
contained 24 pieces below 0.418 specific gravity; class 2 contained
52 pieces between 0.418 and 0.45 3 specific gravity; and class 3 con-
sisted of 135 pieces with a specific gravity greater than 0.453. Table
6 compares the specific gravity classification of visual-density and
average-hardness classes for Douglas fir. In all cases, the average-
hardness class has more pieces in the same numbered specific-gray-
ity class than does the comparable visual-density class.
Table 6. Comparison of specific-gravity segrega-tion by visual-density and by average-hard-ness classes for Douglas fir.
Specific Visual-density classGravityClass 0&l 2 3 Total
1 3 8 13 242 10 18 24 523 11 26 98 135
Total 24 52 135 211
Specific Average-hardness classGravityClass 1 2 3 Total
1 16 6 2 242 8 28 16 523 0 19 116 135
Total 24 53 134 211

36
DISC IJSSION
Load-penetration
The relationship for indenter load and penetration appeared to
be nearly linear (Figures 4, 5 and 6). It would be expected, however,
that if the penetrator was passing through a springwood-summerwood
transition zone, the load-penetration curve might deviate from lin-
earity while the general relationship could still be linear. Weather-
wax, Erickson and Stamm (17) also found that the load-penetration
curve was linear over a major part of the test.
There is a chance for experimental error when the penetration
gage is indexed for the zero load reading of penetration. For the
above reason, it was expected that the hardness index using the dif-
ference in penetration between two given loads would involve less er-
ror than using penetration at a particular load. Results show that
penetration difference does, in general, result in higher correlation
coefficients with specific gravity than does penetration at fixed loads.
Hardness -specific gravity
Plots of data (Figures 8, 9, 10, 11) show that within the range
of a species for the two tested, the relationship of standard hardness
to specific gravity is approximately linear.

37
The Wood Handbook (16, P. 88) states that the average results
of 160 species gives the following relationship between side hardness
and specific gravity at 12 percent moisture:
Side hardness = 3770 G2
Where G is specific gravity
It is further stated that within a species, properties vary by a higher
power of specific gravity. Within a species, the exponent of specific
gravity should be increased by 0. 25.
From the present data, the power curve which most closely fit
the data was for Douglas fir:
Side hardness = 2204 G' 69
And for Western hemlock the relation was:
Side hardness 2310 G1' 71
While the relationship of hardness and specific gravity may
more accurately be related by a power function, for the range of var-
iables in this test the advice of a statistician was that linear regres-
sian was appropriate.
The correlation coefficients given in Table 1 are a measure of
how closely the various hardness indexes are related to specific gray-
ity. The higher the absolute value of the correlation coefficient, the

To1.1I
more closely the values tend to cluster near the regression line. If
there were no relationship between the variables, the expected corre-
lation coefficient would be zero. On the other hand, if all of the
points plotted on the regression line, there would be a perfect linear
relationship and the correlation coefficient would be 1. 0. It would
then be possible to predict specific gravity without error by deter-
mining the hardness index. The sign of the slope of the line of linear
regression determines whether the sign of the correlation coefficient
is plus or minus.
Mean values of side hardness found in this study were 626
pounds for Douglas fir and 547 pounds for Western hemlock. Mark-
wardt (10, face p. 4) reported an average side-hardness value of 670
pounds for Coast Douglas fir and 580 pounds for Western hemlock.
There is a larger range in hardness than in specific gravity.
For example, with Douglas fir the specific gravity ranged from a low
of 0. 348 to a high of 0.663, so that the highest value was about 1.9
times the lowest value. Average hardness ranged from 342 to 1175
pounds so that the highest average hardness was 3.44 times the low-
est value.
Specific gravity determinations were made by weighing the
piece and measuring its length and cross-section at the center while
hardness measurements were made within a one-foot section of a
piece whose total length was nearly eight feet. It would be expected
39
that higher correlations between hardness and specific gravity would
be found if density was measured more precisely and if hardness mea-
surements included a more complete sampling of the piece.
Since wood is anisotropic, it might be expected that side hard-
ness would be different on radial compared to tangential surfaces.
No marked differences were noted in this testing program and Mark-
wardt (10, p. 16) noted 'There is no significant difference between
radial and tangential hardness, and they are averaged together as
side hardness .....
Visual-density Classes
In the present study, 64 percent of the pieces of Douglas fir
qualified for visual-density class 3, or essentially "dense" classifica-
tion by lumber grading rules (2, 18). Drow (4, p. 55) reported 55
percent of Coast virgin Douglas fir and 33 percent of Coast second-
growth Douglas fir qualified as "dense" in an extensive sampling of
1759 specimens. The higher proportion of "dense" material in the
present study might be accounted for in sampling difference or by dif-
ference in personal element in estimating percent summerwood.
Specific gravity segregation by visual-density classes (Figure
12) was not as good as segregation by average-hardness classes (Fig-
ure 14). Smith (14) using microscopic measuring techniques and
small samples found a high correlation of percent summerwood and

40
specific gravity (correlation coefficient of 0. 94 for the complete
growth ring). Visual estimates of percent summer wood, such as
used in the present study, were not nearly as effective in correlating
with specific gravity. The personal element in visual estimates of
percent summerwood is, of course, quite variable. But in the pre-
sent study the evaluator was trained in wood technology and had time
to examine each piece closely. His evaluation of summerwood was
probably at least as accurate as many persons grading lumber where
time for examination is very short.

41
CONCLUSIONS
The relationship between hardness and specific gravity was ap.-
proximately linear over the range of specific gravity studied. Cor-
relation coefficients relating average hardness and specific gravity
were 0. 826 for Coast Douglas fir and 0. 842 for Western hemlock.
Of the different methods used in expressing hardness, the
method using the maximum penetration, which is the standard ASTM
hardness test for wood, gave the highest correlations with specific
gravity. The standard hardness test also results in the largest in-
dentation of the wood, which would be less desirable if the test were
to be used as an aid in grading lumber.
Standard-hardness classes gave a more effective segregation
of pieces according to specific gravity than did visual-density classes
which are presently used in lumber grading.
Use of the property of hardness as an aid in lumber grading for
predicting specific gravity appears feasible. For use in lumber grad-
ing, the hardness test should be fast, preferably automatic, and leave
a relatively small imprint on the lumber. Such a test could be used
for species which presently have no provision for density segregation
based on visual examination.

42
BIBLIOGRAPHY
1. Alexander, J. B. The effect of rate of growth upon the specificgravity and strength of Douglas fir. Ottawa, 1935. 8 p. (Can-ada. Forest Service. Dominion forest service circular 44)
2. American Society for Testing and Materials. 1966 book of A.S. T.M. standards with related material, Part 16, structuralsandwich constructions; Wood; Adhesives. Philadelphia, 1966.810 p.
3. Baker, Frederic Bruce. The possible specific gravity-hardnessrelationship in second-growth Douglas fir, Master's thesis.Seattle, University of Washington, 1949. 48 numb, leaves.
4. Drow, John T. Relationship of locality and rate of growth todensity and strength of Douglas fir. Madison, Wis., 1957.56 p. (U.S. Forest Products Laboratory. Report no, 2078)
5. Kloot, N. H. Impact harness tests on wood, I. The effects ofmachine variables. Australian Journal of Applied Science 4:65-76. 1953.
6. Kloot, N. H. Commonwealth Scientific and Industrial ResearchOrganization, Division of Forest Products, Personal commun-ication. Victoria, Australia. January, 1961.
7. Li, Jerome C.R. Statistical inference. Vol 1. Rev. ed. AnnArbor, Edwards Brothers, 1964. 658 p.
8. Liska, J.A. Exploratory tests on the relative suitability ofvarious methods of determining the hardness of wood. Madison,Wis., 1943. 8 p. (U.S. Forest Products Laboratory. Reportno. DO-51)
9. Lysaght, Vincent E. Indentation hardness testing. New York,Reinhold, 1949. 288 p.
10. Markwardt, L. J. and T. R. C. Wilson. Strength and relatedproperties of woods grown in the United States. Washington,1935. 99 p. (U.S. Dept. of Agriculture. Technical bulletinno. 479)

43
11. McKimmy, M.D. Factors related to variation of specific grav-ity in young-growth Douglas fir. Corvallis, 1959. 52 p. (Ore-gon. Forest Products Research Center. Bulletin 8)
1 2. Schniewind, A.rno P. An improved and semi-automatic methodof conducting the standard hardness test for timber. AmericanSociety for Testing and Materials Bulletin no. 236:57-59. Feb,1959.
13. Small, Louis. Hardness theory and practice, Part 1, Practice.Ferndale, Michigan, Service Diamond Tool Co., 1960. 549 p.
14. Smith, Diana M. Relationship between specific gravity and per-centage of summerwood in wide-ringed, second-growth Douglas-fir. Madison, Wis., 1955. 14 p. (U.S. Forest Products Lab-oratory. Report no. 2045)
15. Tu, Hung-Yeuan. Hardness and specific hardness tests ofwood. Ph.D. thesis. Seattle, University of Washington, 1952.116 numb, leaves.
16. U.S. Forest Products Laboratory. Wood handbook. Washing-ton, 1955. 528 p. (U.S. Dept. of Agriculture. Agriculturehandbook no. 72)
17. Weatherwax, Richard C.., E. C. 0. Erickson and A.lfred J.Stamm. A. means of determining the hardness of wood and mod-ified woods over a broad specific gravity range. American So-ciety for Testing and Materials Bulletin no. 153:35-39. Aug.,1948.
18. West Coast Lumber Inspection Bureau. Standard grading anddressing rules for Douglas fir, West Coast hemlock, Sitkaspruce, Western red cedar lumber. Portland, 1956. 357 p.
19. Williams, Samuel R. Hardness and hardness measurements.Cleveland, American Society for Metals, 1942. 558 p.
20. Wood, Lyman W. and Lawrence A. Soltis. Stiffness and shrink-age of green and dry joists. Madison, Wis., 1964. 26 p.(U.S. Forest Products Laboratory, Research paper FPL 15)
Related Documents