Correlation between SO 2 emissions rate and S contained in fuel used in a power plant, Noumea, New Caledonia Philipson Bani 1,2 , Clive Oppenheimer 3 , Vitchko Tsanev 3 , Michel Lardy 2 , Thierry Hoibian 1 , Michel Allenbach 1 , Isabelle Rouet 1 1 PPME, Université de la Nouvelle Calédonie, BP 4477, 98851 Nouméa NC. Tel : (687) 265868, Fax 254829, email : [email protected] 2 IRD-Nouméa, BP A5 98848, Nouméa Cedex, Nouvelle Calédonie 3 Department of Geography, University of Cambridge, Downing Place, Cambridge, UK CB2 3EN ABSTRACT SO 2 emissions from fossil fuel power plants can have significant impacts on human health and ecosystems. Consequently, numerous techniques are in use to monitor these emissions, in order to comply with environmental legislations. Here we highlight the correlation between SO 2 emissions rate and the S contained in fuel used in power plant. We obtained a maximum of 1.3 kg.s -1 of SO 2 emissions rate and a minimum of 0.4 kg.s -1 corresponding respectively to 2.9 % and 1.2 % of S contained in fuel. Measurements also indicate that high concentration of SO 2 released from the Noumea 121 MW power plant is rapidly diluted in the first 10 minutes, corresponding to 3-4 km distance from the source downwind. Thus inhabitants living within the 3-4 km radius are potentially exposed to power plant emissions. Keywords: power plant emissions, SO 2 emission rates, S contained in fossil fuel 1. INTRODUCTION After releasing into the atmosphere, gas phase oxidation of SO 2 to sulphuric acid occurs mainly via reaction with OH [1], [2], [3]. Heterogeneous reactions in the aqueous phase involve oxidants such as H 2 O 2 and ozone (e.g., [1]). The formation and deposition of sulphuric acid can lead to damage ecosystems and buildings [4], [1], [5], [6]. Related formations of sulphates are major components of the fine particle pollution that plagues many parts of different countries. SO 2 emissions from power plant significantly harm the cardiovascular and respiratory health of people who live near plants. As stated elsewhere [4], there are different techniques used to monitor emissions from power station, including in-stack techniques (UV fluorescence and electrochemical cell analysers) and optical remote sensing Multispectral, Hyperspectral, and Ultraspectral Remote Sensing Technology, Techniques, and Applications II, edited by Allen M. Larar, Mervyn J. Lynch, Makoto Suzuki, Proc. of SPIE Vol. 7149, 71490Y © 2008 SPIE · CCC code: 0277-786X/08/$18 · doi: 10.1117/12.804902 Proc. of SPIE Vol. 7149 71490Y-1 2008 SPIE Digital Library -- Subscriber Archive Copy

Welcome message from author
This document is posted to help you gain knowledge. Please leave a comment to let me know what you think about it! Share it to your friends and learn new things together.
Transcript
Correlation between SO2 emissions rate and S contained in fuel used in
a power plant, Noumea, New Caledonia
Philipson Bani1,2, Clive Oppenheimer3, Vitchko Tsanev3, Michel Lardy2, Thierry Hoibian1, Michel
Allenbach1, Isabelle Rouet1
1PPME, Université de la Nouvelle Calédonie, BP 4477, 98851 Nouméa NC. Tel : (687) 265868, Fax
254829, email : [email protected] 2IRD-Nouméa, BP A5 98848, Nouméa Cedex, Nouvelle Calédonie
3Department of Geography, University of Cambridge, Downing Place, Cambridge, UK CB2 3EN
ABSTRACT SO2 emissions from fossil fuel power plants can have significant impacts on human health and ecosystems.
Consequently, numerous techniques are in use to monitor these emissions, in order to comply with environmental
legislations. Here we highlight the correlation between SO2 emissions rate and the S contained in fuel used in power
plant. We obtained a maximum of 1.3 kg.s-1 of SO2 emissions rate and a minimum of 0.4 kg.s-1 corresponding
respectively to 2.9 % and 1.2 % of S contained in fuel. Measurements also indicate that high concentration of SO2
released from the Noumea 121 MW power plant is rapidly diluted in the first 10 minutes, corresponding to 3-4 km
distance from the source downwind. Thus inhabitants living within the 3-4 km radius are potentially exposed to power
plant emissions.
Keywords: power plant emissions, SO2 emission rates, S contained in fossil fuel
1. INTRODUCTION After releasing into the atmosphere, gas phase oxidation of SO2 to sulphuric acid occurs mainly via reaction with OH [1],
[2], [3]. Heterogeneous reactions in the aqueous phase involve oxidants such as H2O2 and ozone (e.g., [1]). The
formation and deposition of sulphuric acid can lead to damage ecosystems and buildings [4], [1], [5], [6]. Related
formations of sulphates are major components of the fine particle pollution that plagues many parts of different
countries. SO2 emissions from power plant significantly harm the cardiovascular and respiratory health of people who
live near plants. As stated elsewhere [4], there are different techniques used to monitor emissions from power station,
including in-stack techniques (UV fluorescence and electrochemical cell analysers) and optical remote sensing
Multispectral, Hyperspectral, and Ultraspectral Remote Sensing Technology, Techniques, and Applications II, edited by Allen M. Larar, Mervyn J. Lynch, Makoto Suzuki, Proc. of SPIE Vol. 7149, 71490Y
© 2008 SPIE · CCC code: 0277-786X/08/$18 · doi: 10.1117/12.804902
Proc. of SPIE Vol. 7149 71490Y-12008 SPIE Digital Library -- Subscriber Archive Copy
techniques, including FTIR (Fourier Transform Infrared spectroscopy), COSPEC (correlation spectrometer) and DOAS
(Differential Optical Absorption Spectroscopy) [7], [8], [9]. DOAS has proven very useful and adapted for SO2 flux
estimates of both volcanic emissions, especially for individual volcanoes [10] and power station [4]. Here we highlight
the sensitivity of DOAS to changes of the S content in fuel used in the power plant that supports Noumea, New
Caledonia. This power plant is surrounded by more than 91 386 inhabitants of Noumea (2004 census), and thus a better
understanding of the fuel-power station plume is necessary in order to better constrain zones exposed to high
concentration of SO2.
2. METHODOLOGY Sulphur dioxide column measurements were made using a small UV spectrometer (Ocean Optics USB2000) coupled
across a 50 µm entrance slit by fibre optic bundle to a simple telescope, constructed with two quartz lenses viewing the
zenith sky (20 mrad field of view). The spectrometer spanned the spectral interval 280-400 nm with a spectral resolution
of 0.5 nm and was powered via USB connection to laptop computer that ran software for data collection (DOASIS,
http://crusoe.iup.uni-heidelberg.de/urmel/doasis/download/). Exposure time for individual spectrum was 150 ms and we
co-added 8 spectra to enhance signal-to-noise ratio. Traverse profiles of the SO2 column were obtained either by boat or
by driving along roads in Noumea city. Background spectra were collected at the limits of each traverse, along with dark
spectra. The position of each UV spectrum was determined from the log of a continuous recording GPS unit (1 Hz data
rate).
SO2 column amounts were obtained using scripts running under DOASIS following procedures described in [9], [4], and
[12]. The dark spectrum was first subtracted from both measured spectrum and background spectrum, in order to correct
for dark current and electronic offset. The adjusted measured spectrum was then divided by the corrected background
spectrum. A binomial high-pass filter was then applied to remove low-frequency components of the resulting ratio
spectrum, followed by logarithm (Beer’s Law) and low-pass filter to reduce noise. Finally, SO2 column amounts were
obtained by fitting the reference spectrum to the resultant spectrum using a nonlinear least-squares procedure. SO2
column amounts were evaluated in real time, which was very useful when the plume could no be visually located,
especially during cloudy conditions. SO2 fluxes were calculated by multiplying each retrieved column amount by the
distance traversed perpendicularly to the plume transport direction. The sum of these products across the entire plume
was then multiplied by the wind speed, assumed to be equivalent to plume speed, to obtain the fluxes. Wind speeds and
directions were obtained from the Noumea Meteo-France meteorological station, placed 80 m a.s.l. (one of the highest
point of Noumea) and 2.5 km SE of the power plant, whose chimneys height is 64 m a.s.l. The optimum fitting window
found by obtaining a near random fit residual with minimal standard deviation was 310.7-321.4 nm. The reference
spectrum was obtained by convolving high resolution spectra for SO2 [13].
Errors in flux measurements are estimated following [14]. Wind contribution to relative error is ~ 20 %, the mean
retrieved SO2 column amount contribution is 0.1 %, the mean contribution from projected distance is 1.5 % and
variations in the wind direction contribution is ± 1.6-6.7 %. Combined errors in flux measurements in this works amount
to around 25 %.
Proc. of SPIE Vol. 7149 71490Y-2
measurements Nuniberof AverdQeSO AverageSO Scontained Windspeed winddirectionstart time
10/0312004 005612J1212004 004610/0012005 105820/00/2005 100022J00/2005 131325/00/2005 123626/00/2005 135428/00/2005 122120/0012005 081602J1012005 08:0602J1012005 142406/1012005 071307/1012005 082208J1012005 095408/1012005 102210/1012005 150813J1012005 100419/1012005 09:1720/1012005 083323J1012005 101414/0312006 103215/0312006 1156
(ppm.ml4 0267 0356 0.1110 020IS 025II 0-0915 00812 0258 01610 lOSIS 0-0810 02422 0108 0214 0.1010 0.187 0.1813 01314 0127 0077 0118 0-09
fraverses Column aniount emission rates (kg)s} in fuel (%) rn/si
t30 29 6 120120 29 3-4 210-220060 15 6 240tOO 281 5 140-160tOO 281 4 130-140090 262 II 120090 262 12 120tOO 262 4 260090 2 62 5-7 60-100 262 I 330040 I 24 6 230tOO 262 1-4 140-170060 I 32 2-7 210-200100 262 5 240050 I 27 6 240120 2 62 6-7 240-260lAO 262 6 120-130060 I 64 3-6 210-240070 I 67 5-6 270-200060 I 73 8-0 260-270lAO 233 10-Il 110-120070 233 7-0 100
so_&
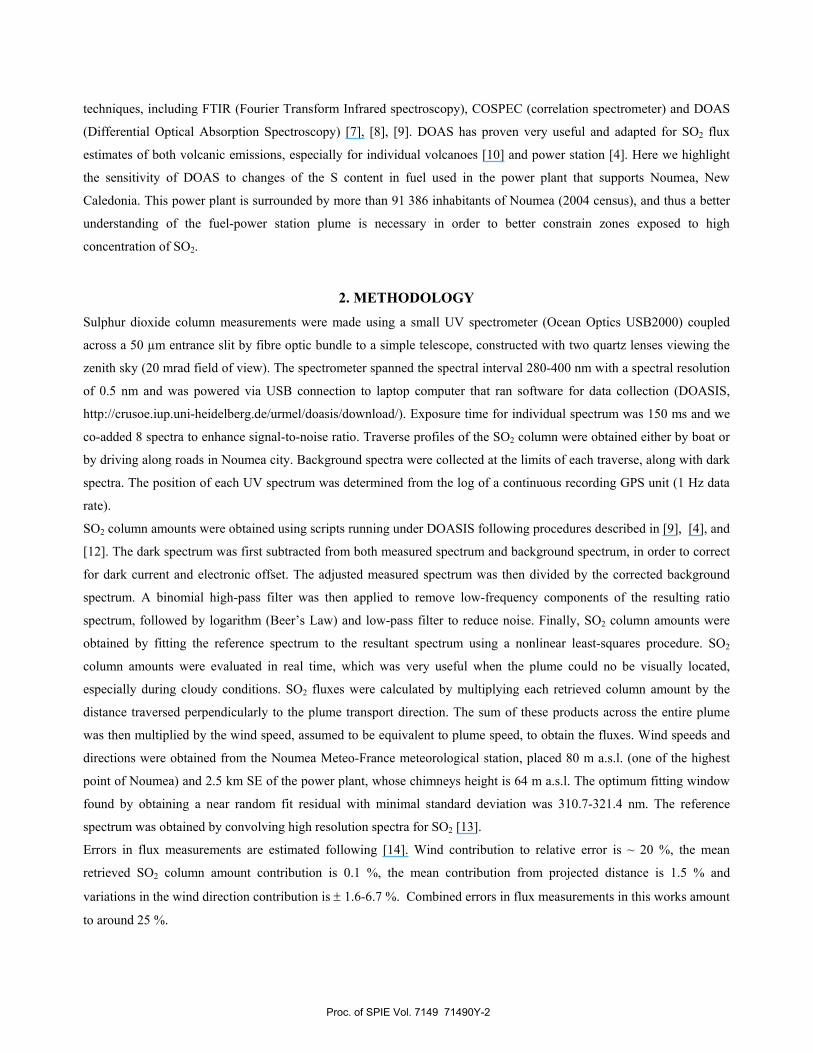
Table 1. SO2 emissions rate and the corresponding S contained in fuel in the Noumea 121 MW power station between 2004 and 2006. Wind speed and wind direction are also indicated.
Fig.1. Representative cross sectional profil of SO2 concentration for traverses beneath the Noumea power plant plume. The 3 major pics correspond to 3 emitting stacks.
3. RESULTS SO2 fluxes obtained between March 2004 and March 2006 are summarized in Table 1 and Fig.1 shows a representative
plot of column amount versus distance traversed perpendicular to the power station plume transport direction. Data were
obtained for different wind speeds
(~1 to ~13 m.s-1) and directions.
224 traverses beneath the power
station plume were made, at
distances from 0.04 km to 7 km
downwind from the source.
Results highlight significant
fluctuations of SO2 emission
rates, with a maximum obtained
in March 2004 (1.3 kg.s-1) and a
minimum in October 2005 (0.4
kg.s-1). Results also highlight
notable changes in SO2 emission
rates in the same day; for
example on 2nd and 8th October
2005, where emissions rate was
reduced respectively from 1.0 to 0.4 kg.s-1 and from 1.0 to 0.5 kg.s-1. The mean emissions rate obtained from the whole
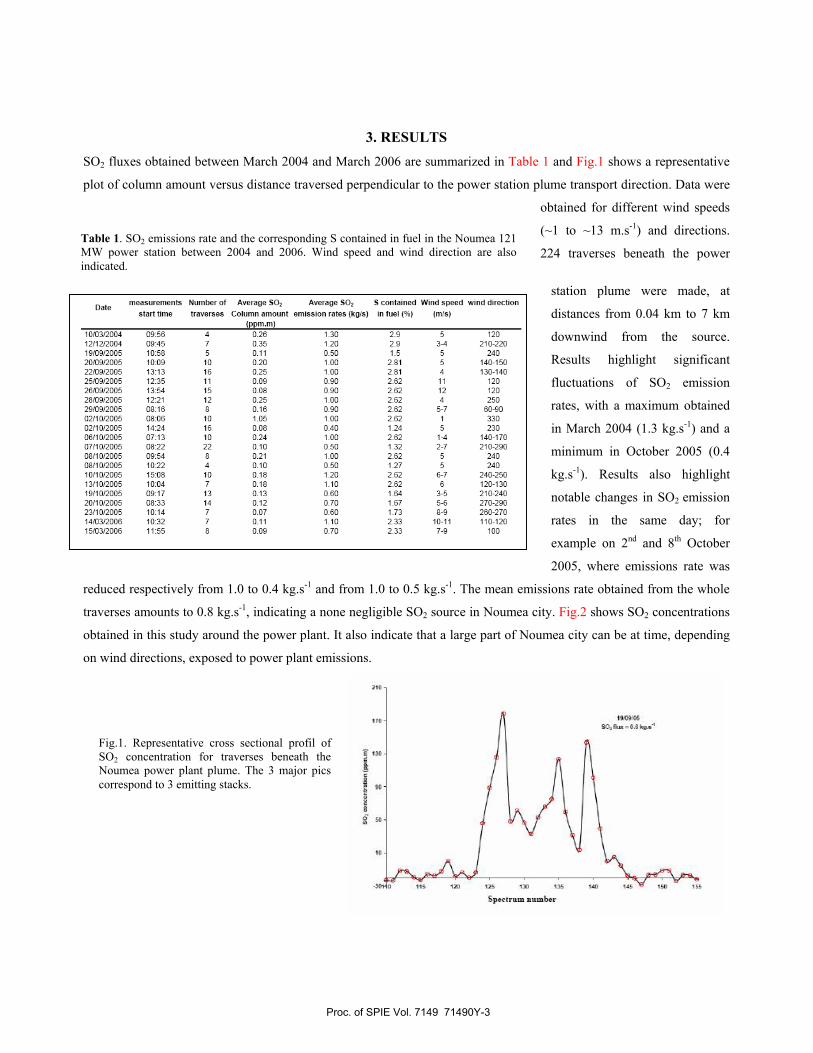
traverses amounts to 0.8 kg.s-1, indicating a none negligible SO2 source in Noumea city. Fig.2 shows SO2 concentrations
obtained in this study around the power plant. It also indicate that a large part of Noumea city can be at time, depending
on wind directions, exposed to power plant emissions.
Proc. of SPIE Vol. 7149 71490Y-3
I •—' \<•r -
I;':
Fig.2. SO2 concentration recorded in Noumea between March 2004 and March 2006.
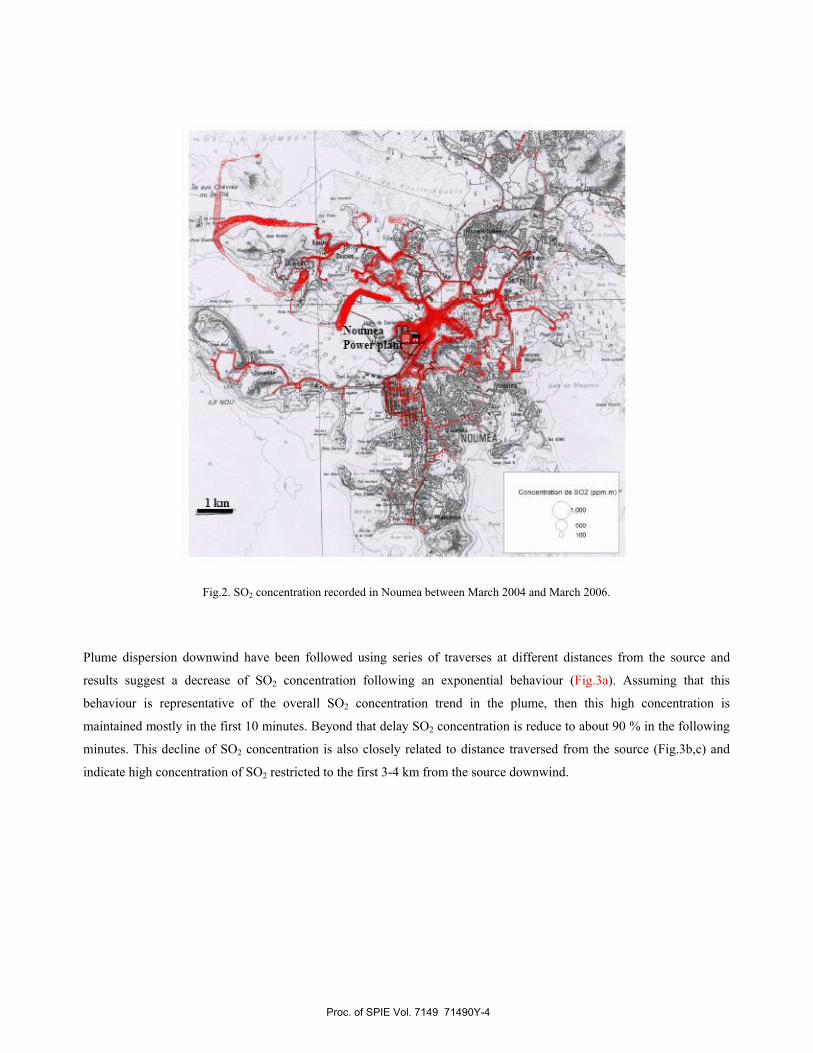
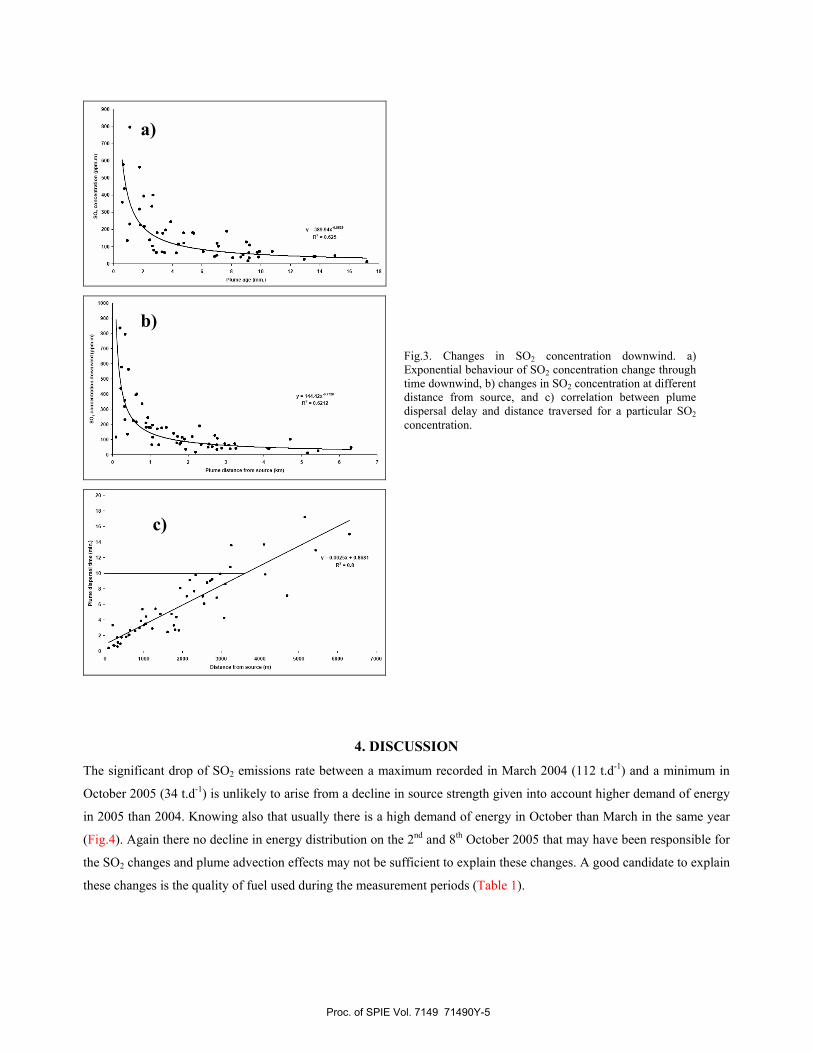
Plume dispersion downwind have been followed using series of traverses at different distances from the source and
results suggest a decrease of SO2 concentration following an exponential behaviour (Fig.3a). Assuming that this
behaviour is representative of the overall SO2 concentration trend in the plume, then this high concentration is
maintained mostly in the first 10 minutes. Beyond that delay SO2 concentration is reduce to about 90 % in the following
minutes. This decline of SO2 concentration is also closely related to distance traversed from the source (Fig.3b,c) and
indicate high concentration of SO2 restricted to the first 3-4 km from the source downwind.
Proc. of SPIE Vol. 7149 71490Y-4
000
000
000
000
500
400
g 000
200
100
V 384.94oIV' 0.625
0 2 4 0 4 10 12 14 10 18
Plume 840 (1111.6
V O.0025x + 0.8581+ 8.8
1008 2000 3000 4000
Distance Scorn source
5000 6000 COOS
Fig.3. Changes in SO2 concentration downwind. a) Exponential behaviour of SO2 concentration change through time downwind, b) changes in SO2 concentration at different distance from source, and c) correlation between plume dispersal delay and distance traversed for a particular SO2 concentration.
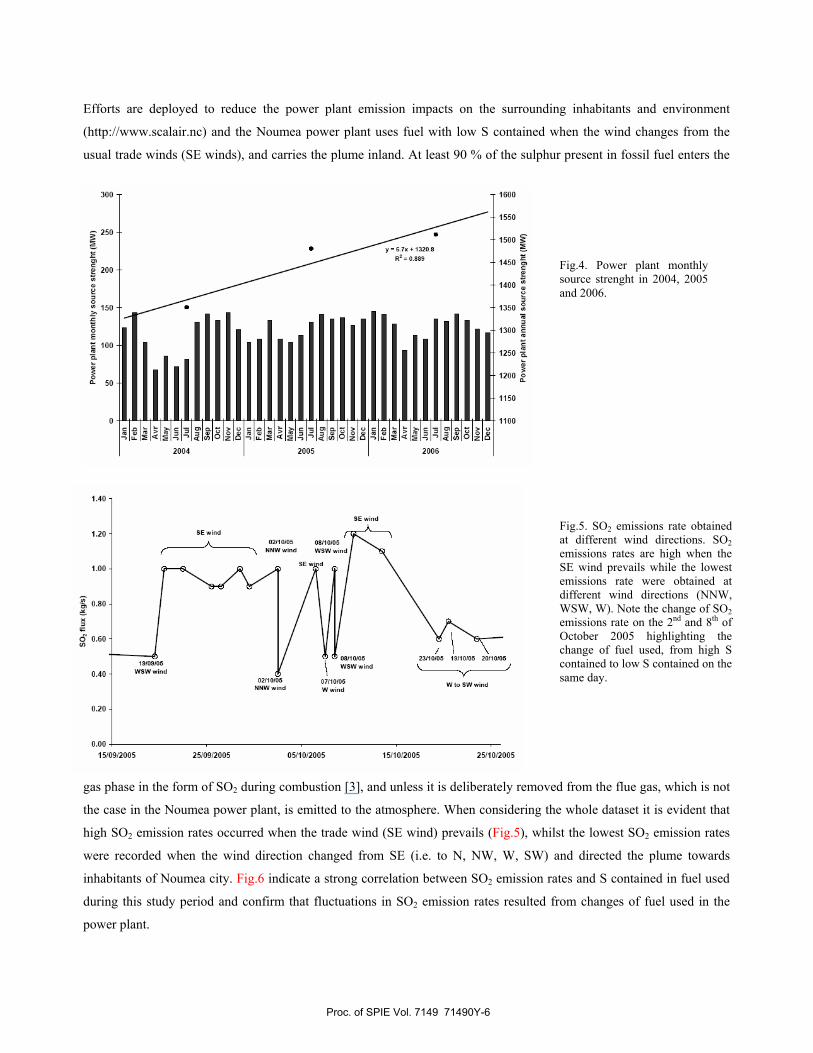
4. DISCUSSION The significant drop of SO2 emissions rate between a maximum recorded in March 2004 (112 t.d-1) and a minimum in
October 2005 (34 t.d-1) is unlikely to arise from a decline in source strength given into account higher demand of energy
in 2005 than 2004. Knowing also that usually there is a high demand of energy in October than March in the same year
(Fig.4). Again there no decline in energy distribution on the 2nd and 8th October 2005 that may have been responsible for
the SO2 changes and plume advection effects may not be sufficient to explain these changes. A good candidate to explain
these changes is the quality of fuel used during the measurement periods (Table 1).
a)
b)
c)
Proc. of SPIE Vol. 7149 71490Y-5
Po,r
plan
t mon
thly
sour
ce s
tp.n
ghtM
W)
Jan
Feb
Mar
A
v,
May
Ju
n
Aug
Se
p ot
No,
,
Fb
Mr
Av
May
Ju
n
Aug
Se
p ot
No,
,
Av
____
_ 9
Aug
Se
p O
ct
NO
V
Fow
erpl
ant
rnin
usou
rces
tieng
ht(M
W
1.40
1.20
1.00
0.80
a 0.60
0.40
0.20
251090005 0511012005 15) 10)2005 2 5110)2005
Fig.4. Power plant monthly source strenght in 2004, 2005 and 2006.
Fig.5. SO2 emissions rate obtained at different wind directions. SO2 emissions rates are high when the SE wind prevails while the lowest emissions rate were obtained at different wind directions (NNW, WSW, W). Note the change of SO2 emissions rate on the 2nd and 8th of October 2005 highlighting the change of fuel used, from high S contained to low S contained on the same day.
Efforts are deployed to reduce the power plant emission impacts on the surrounding inhabitants and environment
(http://www.scalair.nc) and the Noumea power plant uses fuel with low S contained when the wind changes from the
usual trade winds (SE winds), and carries the plume inland. At least 90 % of the sulphur present in fossil fuel enters the
gas phase in the form of SO2 during combustion [3], and unless it is deliberately removed from the flue gas, which is not
the case in the Noumea power plant, is emitted to the atmosphere. When considering the whole dataset it is evident that
high SO2 emission rates occurred when the trade wind (SE wind) prevails (Fig.5), whilst the lowest SO2 emission rates
were recorded when the wind direction changed from SE (i.e. to N, NW, W, SW) and directed the plume towards
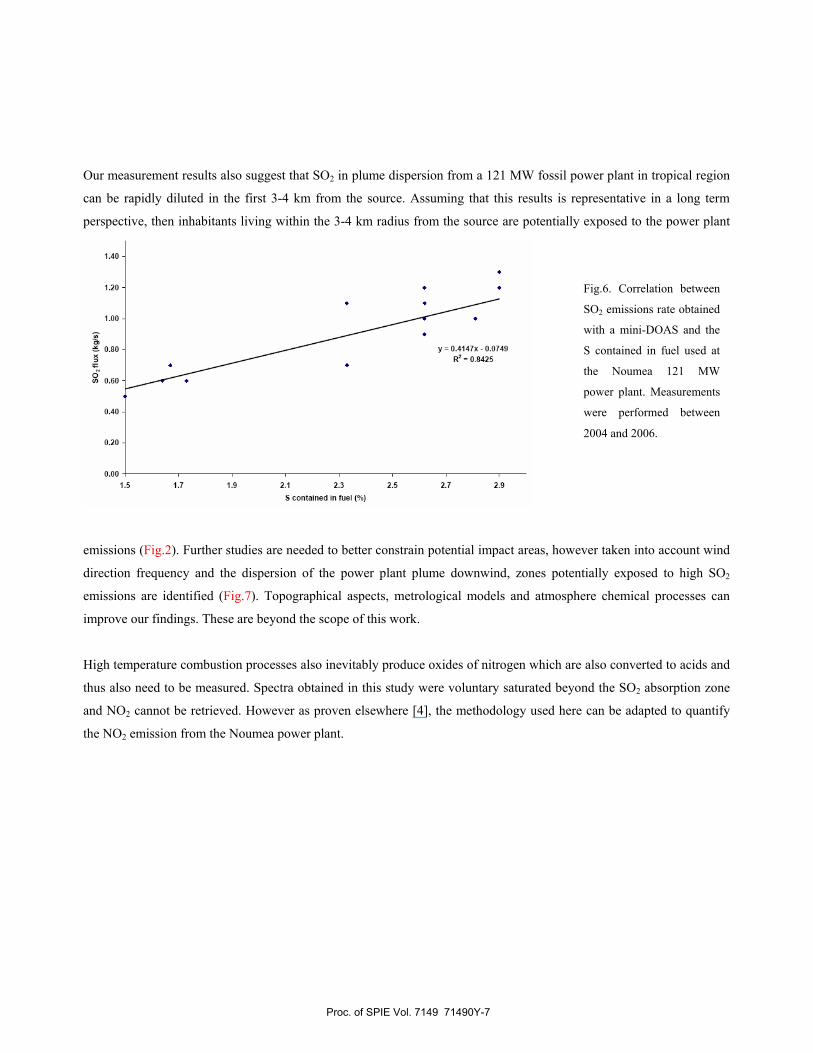
inhabitants of Noumea city. Fig.6 indicate a strong correlation between SO2 emission rates and S contained in fuel used
during this study period and confirm that fluctuations in SO2 emission rates resulted from changes of fuel used in the
power plant.
Proc. of SPIE Vol. 7149 71490Y-6
0.20
0.00
1.5 1.7 1.9 2.1 2.3 2.5 2.7 2.9
S contdIned in I uel %)
Fig.6. Correlation between
SO2 emissions rate obtained
with a mini-DOAS and the
S contained in fuel used at
the Noumea 121 MW
power plant. Measurements
were performed between
2004 and 2006.
Our measurement results also suggest that SO2 in plume dispersion from a 121 MW fossil power plant in tropical region
can be rapidly diluted in the first 3-4 km from the source. Assuming that this results is representative in a long term
perspective, then inhabitants living within the 3-4 km radius from the source are potentially exposed to the power plant
emissions (Fig.2). Further studies are needed to better constrain potential impact areas, however taken into account wind
direction frequency and the dispersion of the power plant plume downwind, zones potentially exposed to high SO2
emissions are identified (Fig.7). Topographical aspects, metrological models and atmosphere chemical processes can
improve our findings. These are beyond the scope of this work.
High temperature combustion processes also inevitably produce oxides of nitrogen which are also converted to acids and
thus also need to be measured. Spectra obtained in this study were voluntary saturated beyond the SO2 absorption zone
and NO2 cannot be retrieved. However as proven elsewhere [4], the methodology used here can be adapted to quantify
the NO2 emission from the Noumea power plant.
Proc. of SPIE Vol. 7149 71490Y-7
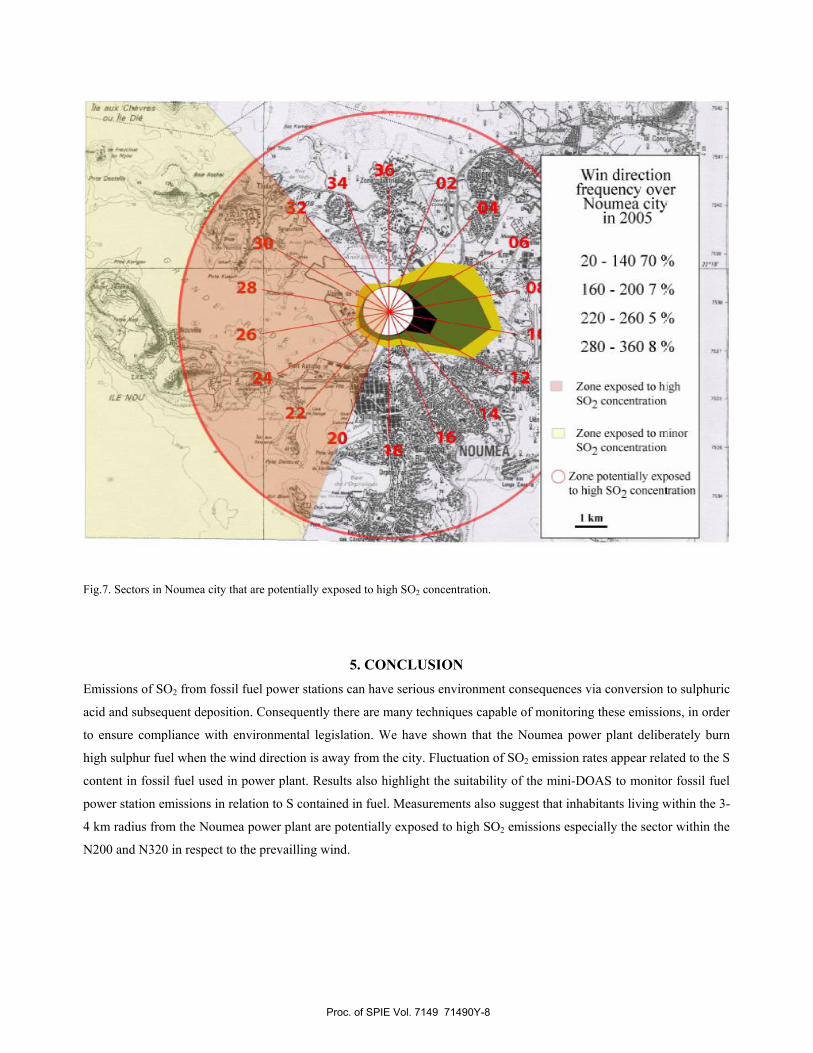
Fig.7. Sectors in Noumea city that are potentially exposed to high SO2 concentration.
5. CONCLUSION Emissions of SO2 from fossil fuel power stations can have serious environment consequences via conversion to sulphuric
acid and subsequent deposition. Consequently there are many techniques capable of monitoring these emissions, in order
to ensure compliance with environmental legislation. We have shown that the Noumea power plant deliberately burn
high sulphur fuel when the wind direction is away from the city. Fluctuation of SO2 emission rates appear related to the S
content in fossil fuel used in power plant. Results also highlight the suitability of the mini-DOAS to monitor fossil fuel
power station emissions in relation to S contained in fuel. Measurements also suggest that inhabitants living within the 3-
4 km radius from the Noumea power plant are potentially exposed to high SO2 emissions especially the sector within the
N200 and N320 in respect to the prevailling wind.
Proc. of SPIE Vol. 7149 71490Y-8
ACKNOWLEDGEMENT
We acknowledge the support from MOM (Ministère d’Outre Mer), ADECAL (Agence de Développement Economique
Calédonien), Société le Nickel, and Météo-France NC.
REFERENCES [1] Harris, G.W., Atkinson, R., Pitts Jr., J.N., “Temperature dependence of the reaction OH + SO2 + M HSO3 + M
for A rand SF6,” Chemical and Physical Letter 69, 378-382 (1980). [2] Leu, M.-T., “Rate constants for the reaction of OH with SO2 at low pressure”, Journal of Physical Chemistry 86,
4558-4562 (1982). [3] Hewitt, C.N., “The atmospheric chemistry of sulphur and nitrogen in power station plumes,” Atmospheric
Environment 35, 1155-1170 (2001). [4] McGonigle, A.J.S., Thomson, C.L., Tsanev, V.I., Oppenheimer, C., “A simple technique for measuring power
station SO2 and NO2 emissions,” Atmos. Environ., doi: 10.1016/j.atmosenv.2003.09.048 (2003). [5] Wright, R.F., Schinler, D.W., “Interaction of acid rain and global changes: effects on terrestrial and aquatic
ecosystems,” Water Air and Soil Pollution 85, 89-99 (1995). [6] Munn, T., Timmerman, P., Whyte, A., “Emerging environmental issues,” Bulletin of the American Meteorological
Society 81, 1603-1609 (2000). [7] Hamilton, P.M., Varey, R.H., Millan, M.M., “Remote sensing of sulphur dioxide,” Atmospheric Environment 12,
127-133 (1978) [8] Moffat, A.J., Millan, M.M., “The application of optical correlation techniques to the remote sensing of SO2 plumes
using sky light,” Atmospheric 5, 677-690 (1971). [9] Galle, B., Oppenheimer, C., Geyer, A., McGonigle, A.J.S., Edmonds, M., Horrocks, L., “A miniaturised ultraviolet
spectrometer for remote sensing of SO2 fluxes: a new tool for volcano surveillance,” J. Volcanol. Geotherm. Res. 119, 241-254 (2003).
[10] McGonigle, A.J.S., Oppenheimer, C., Galle, B., Mather, T.A., Pyle, D.M., “Walking traverse and scanning DOAS measurements of volcanic gas emission rates,” Geophysical Research Letters 29(20), 1985, doi: 10.1029/2002GL015827 (2002)
[11] Bani, P., Lardy, M., “Sulphur dioxide emission rates from Yasur volcano, Vanuatu archipelago,” Geophysical Research Letters, 34(20) L20309, doi: 10.1029/2007GL030411 (2007)
[12] Oppenheimer, C., Tsanev, V.I., Allen, A.G., Cardoso, A.A., Wiatr, A., Paterlini, W., De Mello Dias, C., “NO2 Emissions from Agricultural Burning in Sao Paulo, Brazil,” Environ. Sci. Technol. 38, 4557-4561 (2004).
[13] Rufus, J., Stark, G., Smith, P.L., Pickering, J.C., & Thorne, A.P., “High-resolution photoabsorption cross-section measurements of SO2, 2: 220 to 325 nm at 295 K,” Journal Geophysic Research, v.108, N° 5011, doi: 10.1029/2002JE001931 (2003).
[14] Mather, T.A., et al., “A reassessment of current volcanic emissions from the Central American arc with specific examples from Nicaragua,” Journ. of Volcanol. And Geotherm. Res. 149(3-4), 297-311 (2006).
Proc. of SPIE Vol. 7149 71490Y-9
Related Documents