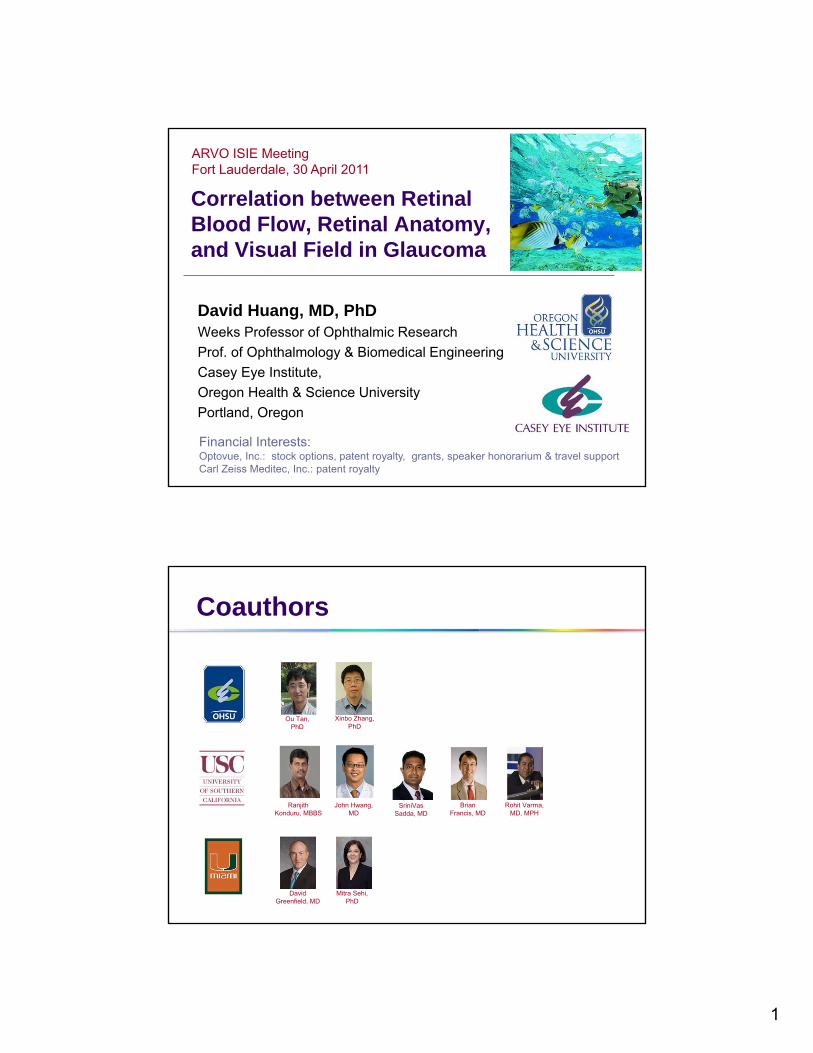
1 Correlation between Retinal Blood Flow, Retinal Anatomy, and Visual Field in Glaucoma David Huang, MD, PhD Weeks Professor of Ophthalmic Research Prof. of Ophthalmology & Biomedical Engineering Casey Eye Institute, Oregon Health & Science University Portland, Oregon Financial Interests: Optovue, Inc.: stock options, patent royalty, grants, speaker honorarium & travel support Carl Zeiss Meditec, Inc.: patent royalty ARVO ISIE Meeting Fort Lauderdale, 30 April 2011 Coauthors SriniVas Sadda, MD John Hwang, MD Ranjith Konduru, MBBS Ou Tan, PhD Xinbo Zhang, PhD Rohit Varma, MD, MPH Brian Francis, MD David Greenfield, MD Mitra Sehi, PhD

Welcome message from author
This document is posted to help you gain knowledge. Please leave a comment to let me know what you think about it! Share it to your friends and learn new things together.
Transcript
1
Correlation between Retinal Blood Flow, Retinal Anatomy, and Visual Field in Glaucoma
David Huang, MD, PhDWeeks Professor of Ophthalmic Research
Prof. of Ophthalmology & Biomedical Engineering
Casey Eye Institute,
Oregon Health & Science University
Portland, Oregon
Financial Interests:Optovue, Inc.: stock options, patent royalty, grants, speaker honorarium & travel supportCarl Zeiss Meditec, Inc.: patent royalty
ARVO ISIE MeetingFort Lauderdale, 30 April 2011
Coauthors
SriniVas Sadda, MD
John Hwang, MD
Ranjith Konduru, MBBS
Ou Tan, PhD
Xinbo Zhang, PhD
Rohit Varma, MD, MPH
Brian Francis, MD
David Greenfield, MD
Mitra Sehi, PhD

2
Conventional glaucoma pathophysiology
Elevated intraocular pressure (IOP)
Loss of retinal ganglion cells &
nerve fibers
Loss of visual field
What is the role of blood flow?
Elevated IOP
Loss of retinal ganglion cells &
nerve fibers
Loss of visual field
Decreased blood flow
?

3
5
The relationship of OBF and retinal and optic nerve structure should be investigated.
Statistically significant thinning of the RNFL in association with reduced retrobulbar blood flow velocities was previously observed in OAG patients.1
An ideal device would assess both structure of the retina and optic nerve and blood flow in a single device
There is a consensus to investigate structure and blood flow in glaucoma
1. Januleviciene I, Sliesoraityte I, Siesky B, Harris A..Acta Ophthalmol. 2008 Aug;86(5):552-7.
A technique for rapid & accurate quantitation of total retinal blood flow is needed
Fluorescein & ICG angiography - qualitative
Doppler ultrasound -inaccurate
Laser doppler flowmeter –time consuming
David Huang, MD, PhD www.AIGStudy.net
4
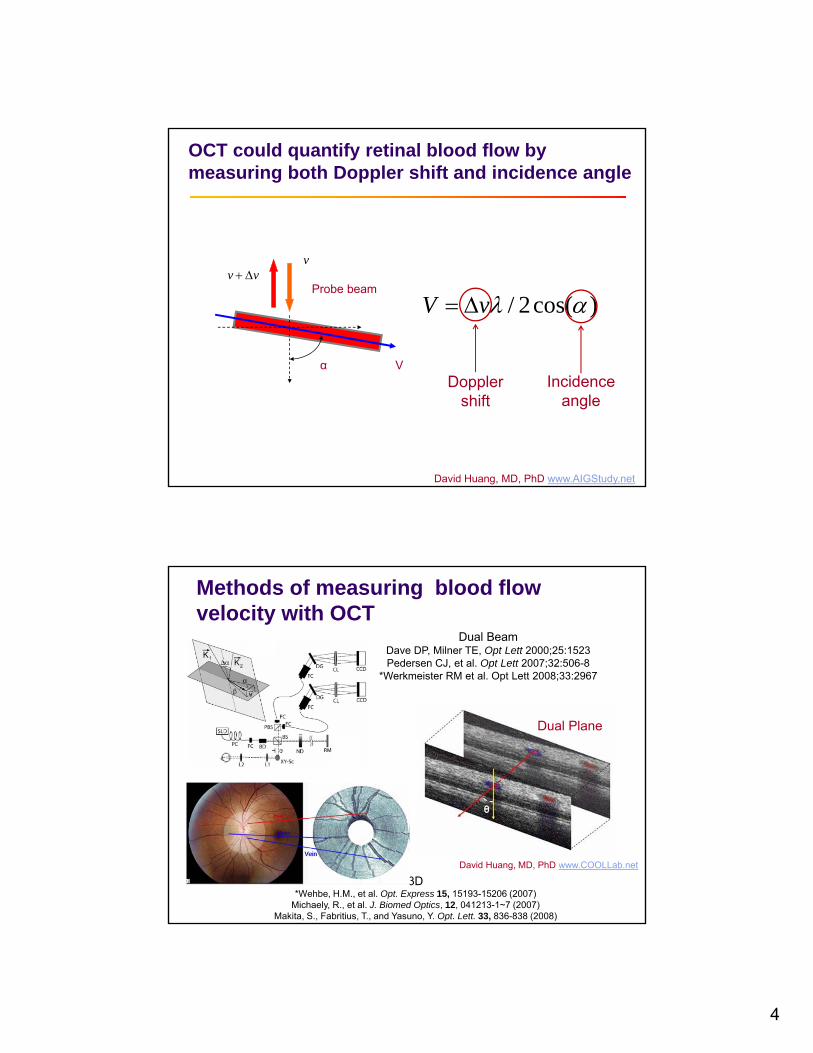
OCT could quantify retinal blood flow by measuring both Doppler shift and incidence angle
α V
Probe beamvv
v
David Huang, MD, PhD www.AIGStudy.net
)cos(2/ vV
Dopplershift
Incidenceangle
Methods of measuring blood flow velocity with OCT
Dual BeamDave DP, Milner TE, Opt Lett 2000;25:1523Pedersen CJ, et al. Opt Lett 2007;32:506-8
*Werkmeister RM et al. Opt Lett 2008;33:2967
Dual Plane
3D*Wehbe, H.M., et al. Opt. Express 15, 15193-15206 (2007)
Michaely, R., et al. J. Biomed Optics, 12, 041213-1~7 (2007)Makita, S., Fabritius, T., and Yasuno, Y. Opt. Lett. 33, 836-838 (2008)
David Huang, MD, PhD www.COOLLab.net
5
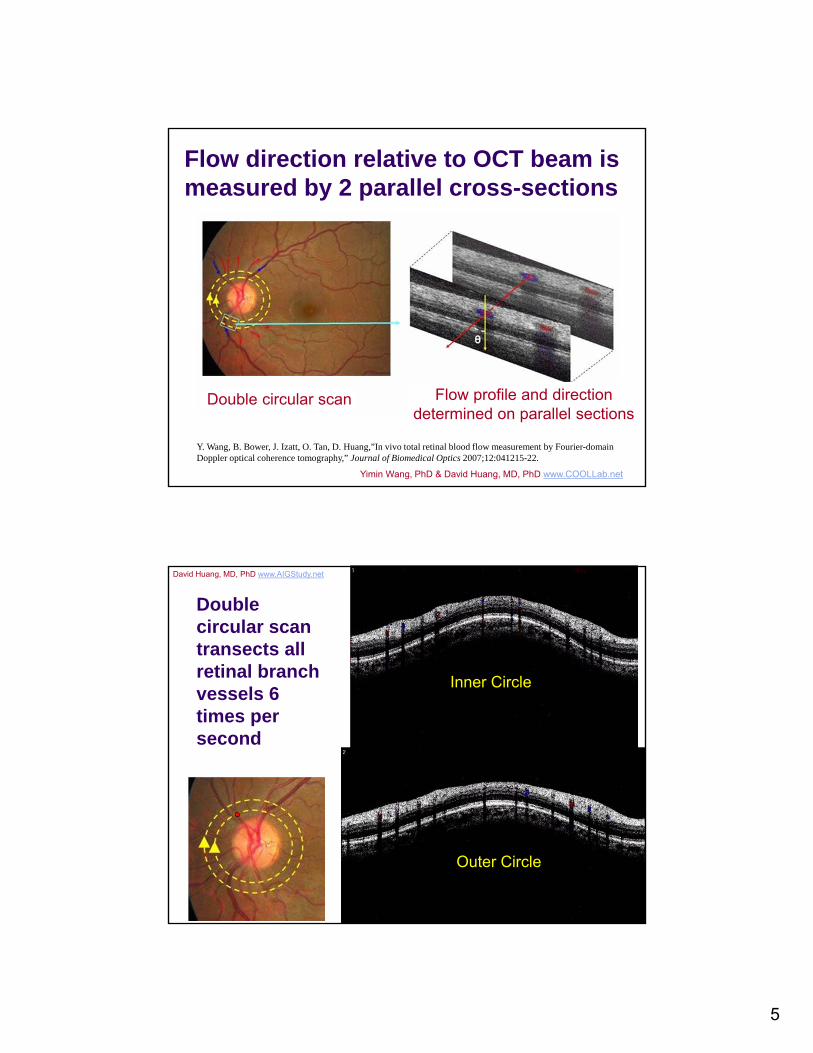
Flow direction relative to OCT beam is measured by 2 parallel cross-sections
Double circular scan Flow profile and directiondetermined on parallel sections
Y. Wang, B. Bower, J. Izatt, O. Tan, D. Huang,”In vivo total retinal blood flow measurement by Fourier-domain Doppler optical coherence tomography,” Journal of Biomedical Optics 2007;12:041215-22.
Yimin Wang, PhD & David Huang, MD, PhD www.COOLLab.net
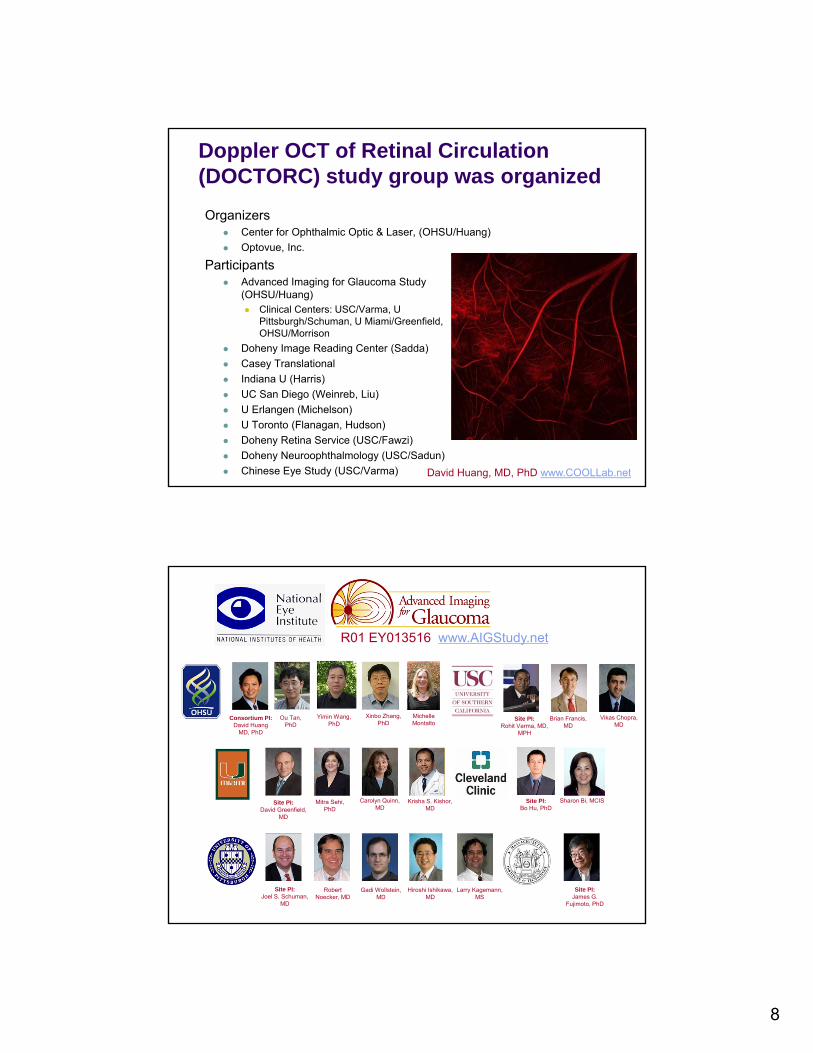
Double circular scan transects all retinal branch vessels 6 times per second
Inner Circle
Outer Circle
David Huang, MD, PhD www.AIGStudy.net

6
dxdz
cos2
∑Total Retinal Blood Flow
Flow in Veins
Algorithm for Total Retinal Blood Flow
0
1
2
3
4
5
0 0.5 1 1.5 2
Time (second)
Flo
w (
mic
rolit
er/
min
ute
)
Y. Wang, et. al., Journal of Biomedical Optics 13, 064003, (2008)
Flow value : 40.8 to 52.9 l/min, CV: 10.5%
Wang Y, et al. Br J Ophthalm, 93:634 (2009)
x
z
vessel velocitycross section
Flow in a single vessel
Average flow over 2 seconds for each vessel
Doppler anglemeasurement
Yimin Wang, PhD & David Huang, MD, PhD www.COOLLab.net
Pilot study showed that glaucoma, PDR and NAION all decreased retinal blood flow
Group(# of eyes)
Blood Flow(μl/min)
Venous Area(mm2)
Venous Velocity(mm/s)
Arterial Area(mm2)
Arterial Velocity(mm/s)
Normal (20)
47.6 ± 5.4 0.046 ± 0.008 17.7 ± 3.1 0.033 ± 0.005 24.6 ± 4.0
Glaucoma (16)
34.1 ± 4.9(p<0.001)
0.046 ± 0.008(p=0.977)
12.7 ± 1.7(p<0.001)
0.034 ± 0.008(p=0.454)
17.1 ± 3.6(p<0.001)
NAION (7)
28.2 ± 8.2(p<0.001)
0.030 ± 0.007(p<0.001)
15.4 ± 3.2(p=0.109)
0.025 ± 0.006(p=0.002)
19.0 ± 3.4(p=0.003)
PDR(5)
15.8 ± 10.1(p<0.001)
0.024 ± 0.007(p<0.001)
10.4 ± 3.6(p=0.001)
0.018 ± 0.011(p<0.001)
16.0 ± 5.0(p=0.001)
Wang Y, Fawzi AA, Varma R, Sadun AA, Zhang X, Tan O, Izatt JA, Huang D. Pilot study of optical coherence tomography measurement of retinal blood flow in retinal and optic nerve diseases. Invest Ophthalmol Vis Sci 2011; 52:840-845

7
The dual circular scan OCT Doppler retinal blood flow measurement technology has been licensed by USC to Optovue for commercial development
Optovue RTVue26 kHz, 6 circles/secDavid Huang, MD, PhD www.AIGStudy.net
Semi-automated grading software was developed for Doppler OCT reading center
Probe beam
Doppler angle
En face view of 3D OCT scan
Vessel-normal vector
Vessel cross-sections from double circular scans
Doppler OCT of Retinal Circulation (DOCTORC) software uses both double-circular and 3D volumetric scans
Flow vector
Ou Tan, PhD & David Huang, MD, PhD www.COOLLab.net
8
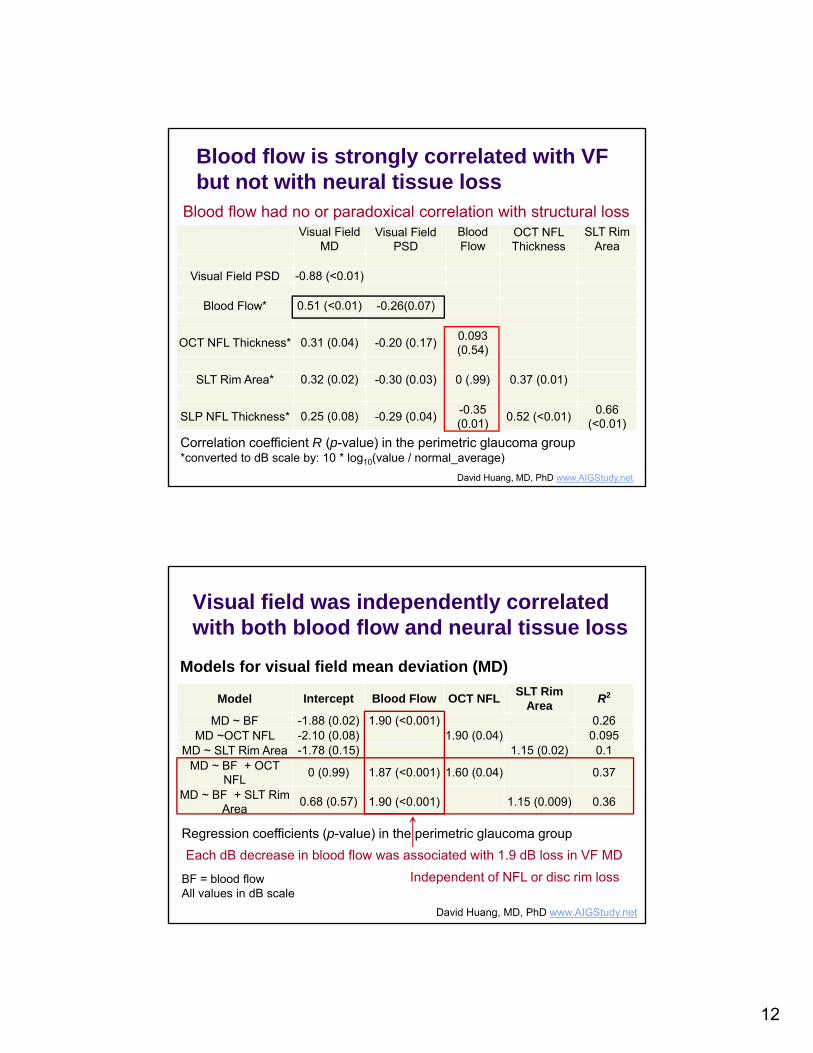
Doppler OCT of Retinal Circulation (DOCTORC) study group was organized
Organizers Center for Ophthalmic Optic & Laser, (OHSU/Huang)
Optovue, Inc.
Participants Advanced Imaging for Glaucoma Study
(OHSU/Huang) Clinical Centers: USC/Varma, U
Pittsburgh/Schuman, U Miami/Greenfield, OHSU/Morrison
Doheny Image Reading Center (Sadda)
Casey Translational
Indiana U (Harris)
UC San Diego (Weinreb, Liu)
U Erlangen (Michelson)
U Toronto (Flanagan, Hudson)
Doheny Retina Service (USC/Fawzi)
Doheny Neuroophthalmology (USC/Sadun)
Chinese Eye Study (USC/Varma) David Huang, MD, PhD www.COOLLab.net
R01 EY013516 www.AIGStudy.net
Site PI: James G.
Fujimoto, PhD
Consortium PI: David Huang
MD, PhD
Site PI: Joel S. Schuman,
MD
Site PI: David Greenfield,
MD
Yimin Wang, PhD
Ou Tan, PhD
Xinbo Zhang, PhD
Carolyn Quinn, MD
Krisha S. Kishor, MD
Mitra Sehi, PhD
Robert Noecker, MD
Gadi Wollstein, MD
Hiroshi Ishikawa, MD
Larry Kagemann, MS
Site PI:Bo Hu, PhD
Sharon Bi, MCIS
Site PI:Rohit Varma, MD,
MPH
Vikas Chopra, MD
Brian Francis, MD
Michelle Montalto

9
Stratus OCTOptical coherence tomographyNerve fiber layer (NFL) thickness GDx-ECC SLP
Scanning laser polarimetryNFL thickness
HRT3 SLTScanning laser tomography Disc rim area
Standard quantitative imaging modalities were used to measure loss of retinal nerve fibers
David Huang, MD, PhD www.COOLLab.net
Case control comparison confirms that glaucoma decreases total retinal blood flow
Variable NormalPerimetricGlaucoma p-value
#eyes 27 51# Systemic Hypertension 9 (33%) 16 (31%)# Diabetes Mellitus 1 (4%) 3 (6%)Age (Years) 60.3 ± 9.0 61.6 ± 8.6 0.51Blood Flow (μl/min) 45.5 ± 9.5 34.8 ± 8.2 < 0.001Arterial Area (mm²) 0.033 ± 0.0077 0.028 ± 0.0073 0.004Venous Area (mm²) 0.041 ± 0.012 0.039 ± 0.0084 0.006Arterial Velocity (mm/sec) 24.9 ± 7.2 21.9 ± 7.1 0.23Venous Velocity (mm/sec) 16.3 ± 2.8 14.5 ± 3.5 0.024VF MD (dB) 0.23 ± 1.00 -4.34 ± 4.22 < 0.0001VF PSD (dB) 1.63 ± 0.38 6.45 ± 4.55 < 0.0001OCT NFL Thickness (µm) 97.1 ± 8.9 75.5 ± 11.6 < 0.0001SLT Rim Area (mm²) 1.60 ± 0.48 0.99 ± 0.28 < 0.0001SLP NFL Thickness (µm) 55.3 ± 4.7 44.2 ± 6.2 < 0.0001
David Huang, MD, PhD www.AIGStudy.net
matched
VF = visual field; MD = mean deviationPSD = pattern standard deviation

10
Case control comparison confirms that glaucoma decreases total retinal blood flow
Variable NormalPerimetricGlaucoma p-value
#eyes 27 51# Systemic Hypertension 9 (33%) 16 (31%)# Diabetes Mellitus 1 (4%) 3 (6%)Age (Years) 60.3 ± 9.0 61.6 ± 8.6 0.51Blood Flow (μl/min) 45.5 ± 9.5 34.8 ± 8.2 < 0.001Arterial Area (mm²) 0.033 ± 0.0077 0.028 ± 0.0073 0.004Venous Area (mm²) 0.041 ± 0.012 0.039 ± 0.0084 0.006Arterial Velocity (mm/sec) 24.9 ± 7.2 21.9 ± 7.1 0.23Venous Velocity (mm/sec) 16.3 ± 2.8 14.5 ± 3.5 0.024VF MD (dB) 0.23 ± 1.00 -4.34 ± 4.22 < 0.0001VF PSD (dB) 1.63 ± 0.38 6.45 ± 4.55 < 0.0001OCT NFL Thickness (µm) 97.1 ± 8.9 75.5 ± 11.6 < 0.0001SLT Rim Area (mm²) 1.60 ± 0.48 0.99 ± 0.28 < 0.0001SLP NFL Thickness (µm) 55.3 ± 4.7 44.2 ± 6.2 < 0.0001
Glaucoma decreased blood flow, vessel area, velocity
David Huang, MD, PhD www.AIGStudy.net
VF = visual field; MD = mean deviationPSD = pattern standard deviation
Case control comparison confirms that glaucoma decreases total retinal blood flow
Variable NormalPerimetricGlaucoma p-value
#eyes 27 51# Systemic Hypertension 9 (33%) 16 (31%)# Diabetes Mellitus 1 (4%) 3 (6%)Age (Years) 60.3 ± 9.0 61.6 ± 8.6 0.51Blood Flow (μl/min) 45.5 ± 9.5 34.8 ± 8.2 < 0.001Arterial Area (mm²) 0.033 ± 0.0077 0.028 ± 0.0073 0.004Venous Area (mm²) 0.041 ± 0.012 0.039 ± 0.0084 0.006Arterial Velocity (mm/sec) 24.9 ± 7.2 21.9 ± 7.1 0.23Venous Velocity (mm/sec) 16.3 ± 2.8 14.5 ± 3.5 0.024VF MD (dB) 0.23 ± 1.00 -4.34 ± 4.22 < 0.0001VF PSD (dB) 1.63 ± 0.38 6.45 ± 4.55 < 0.0001OCT NFL Thickness (µm) 97.1 ± 8.9 75.5 ± 11.6 < 0.0001SLT Rim Area (mm²) 1.60 ± 0.48 0.99 ± 0.28 < 0.0001SLP NFL Thickness (µm) 55.3 ± 4.7 44.2 ± 6.2 < 0.0001
Glaucoma caused visual field loss
David Huang, MD, PhD www.AIGStudy.net
VF = visual field; MD = mean deviationPSD = pattern standard deviation

11
Case control comparison confirms that glaucoma decreases total retinal blood flow
Variable NormalPerimetricGlaucoma p-value
#eyes 27 51# Systemic Hypertension 9 (33%) 16 (31%)# Diabetes Mellitus 1 (4%) 3 (6%)Age (Years) 60.3 ± 9.0 61.6 ± 8.6 0.51Blood Flow (μl/min) 45.5 ± 9.5 34.8 ± 8.2 < 0.001Arterial Area (mm²) 0.033 ± 0.0077 0.028 ± 0.0073 0.004Venous Area (mm²) 0.041 ± 0.012 0.039 ± 0.0084 0.006Arterial Velocity (mm/sec) 24.9 ± 7.2 21.9 ± 7.1 0.23Venous Velocity (mm/sec) 16.3 ± 2.8 14.5 ± 3.5 0.024VF MD (dB) 0.23 ± 1.00 -4.34 ± 4.22 < 0.0001VF PSD (dB) 1.63 ± 0.38 6.45 ± 4.55 < 0.0001OCT NFL Thickness (µm) 97.1 ± 8.9 75.5 ± 11.6 < 0.0001SLT Rim Area (mm²) 1.60 ± 0.48 0.99 ± 0.28 < 0.0001SLP NFL Thickness (µm) 55.3 ± 4.7 44.2 ± 6.2 < 0.0001
Glaucoma caused loss of disc rim and retinal nerve fibers
David Huang, MD, PhD www.AIGStudy.net
VF = visual field; MD = mean deviationPSD = pattern standard deviation
Blood flow is strongly correlated with VF but not with neural tissue loss
VF MD VF PSDBlood Flow
OCT NFL Thickness
SLT Rim Area
VF PSD -0.88 (<0.01)
Blood Flow* 0.51 (<0.01) -0.26(0.07)
OCT NFL Thickness* 0.31 (0.04) -0.20 (0.17)0.093 (0.54)
SLT Rim Area* 0.32 (0.02) -0.30 (0.03) 0 (.99) 0.37 (0.01)
SLP NFL Thickness* 0.25 (0.08) -0.29 (0.04)-0.35 (0.01)
0.52 (<0.01)0.66
(<0.01)
Correlation coefficient R (p-value) in the perimetric glaucoma group*converted to dB scale by 10 * log10(value / normal_average)
Blood flow was most strongly correlated with VF mean deviation
David Huang, MD, PhD www.AIGStudy.net
12
Blood flow is strongly correlated with VF but not with neural tissue loss
Visual Field MD
Visual Field PSD
Blood Flow
OCT NFL Thickness
SLT Rim Area
Visual Field PSD -0.88 (<0.01)
Blood Flow* 0.51 (<0.01) -0.26(0.07)
OCT NFL Thickness* 0.31 (0.04) -0.20 (0.17)0.093 (0.54)
SLT Rim Area* 0.32 (0.02) -0.30 (0.03) 0 (.99) 0.37 (0.01)
SLP NFL Thickness* 0.25 (0.08) -0.29 (0.04)-0.35 (0.01)
0.52 (<0.01)0.66
(<0.01)
Blood flow had no or paradoxical correlation with structural loss
Correlation coefficient R (p-value) in the perimetric glaucoma group*converted to dB scale by: 10 * log10(value / normal_average)
David Huang, MD, PhD www.AIGStudy.net
Visual field was independently correlated with both blood flow and neural tissue loss
Model Intercept Blood Flow OCT NFLSLT Rim
AreaR2
MD ~ BF -1.88 (0.02) 1.90 (<0.001) 0.26MD ~OCT NFL -2.10 (0.08) 1.90 (0.04) 0.095
MD ~ SLT Rim Area -1.78 (0.15) 1.15 (0.02) 0.1MD ~ BF + OCT
NFL0 (0.99) 1.87 (<0.001) 1.60 (0.04) 0.37
MD ~ BF + SLT Rim Area
0.68 (0.57) 1.90 (<0.001) 1.15 (0.009) 0.36
Regression coefficients (p-value) in the perimetric glaucoma group
BF = blood flowAll values in dB scale
Models for visual field mean deviation (MD)
Each dB decrease in blood flow was associated with 1.9 dB loss in VF MD
David Huang, MD, PhD www.AIGStudy.net
Independent of NFL or disc rim loss

13
Conclusion: Blood flow has a direct effect on visual function independent of neural structural loss
Elevated IOP
Loss of retinal ganglion cells &
nerve fibers
Loss of visual field
Decreased blood flow
David Huang, MD, PhD www.AIGStudy.net
The role of blood flow in glaucoma monitoring and treatment deserve further investigation
Elevated IOP
Loss of retinal ganglion cells &
nerve fibers
Loss of visual field
Decreased blood flow
Depressed neural activityLocal vasculopathy
Systemic factors
??
David Huang, MD, PhD www.AIGStudy.net

14
Questions for future glaucoma studies
Could retinal blood flow be improved by lowering intraocular pressure?
Could retinal blood flow be improved by eye drops or systemic medications?
Could improved retinal blood flow improve visual field function?
Could improved retinal blood flow slow visual field loss in glaucoma?
David Huang, MD, PhD www.AIGStudy.net
David Huang, MD, PhD
Maolong Tang, PhD
Yan Li, PhD
Ou Tan, PhD Yimin Wang, PhD
Xinbo Zhang, PhD
www.COOLLab.net
Jason Tokayer, MS
Bing Qin, MD
Janice Van Norman, COT
Jenner Banbury
Hrebesh Subhash, PhD
Michelle Montalto
15
RETINAL BLOOD FLOW IN GLAUCOMATOUS EYES WITH SINGLE-
HEMIFIELD DAMAGE
M Sehi, PhD1; MC Reyes, MD1; R Konduru, MBBS2; O Tan, PhD3; D Huang, MD3; and DS Greenfield, MD1
1. Bascom Palmer Eye Institute, Department of Ophthalmology, University of Miami Miller School of Medicine, Palm Beach Gardens, FL;
2. Doheny Eye Institute, Department of Ophthalmology, Keck School of Medicine, University of Southern California, Los Angeles, California.
3. Casey Eye Institute, Department of Ophthalmology, Oregon Health and Science University, Portland, OR
Please come to poster board # 45
Related Documents