This content has been downloaded from IOPscience. Please scroll down to see the full text. Download details: IP Address: 190.216.188.190 This content was downloaded on 08/10/2013 at 11:09 Please note that terms and conditions apply. Correlation between birefringent bands and shear bands in surfactant solutions View the table of contents for this issue, or go to the journal homepage for more J. Stat. Mech. (2006) P04003 (http://iopscience.iop.org/1742-5468/2006/04/P04003) Home Search Collections Journals About Contact us My IOPscience

Welcome message from author
This document is posted to help you gain knowledge. Please leave a comment to let me know what you think about it! Share it to your friends and learn new things together.
Transcript
This content has been downloaded from IOPscience. Please scroll down to see the full text.
Download details:
IP Address: 190.216.188.190
This content was downloaded on 08/10/2013 at 11:09
Please note that terms and conditions apply.
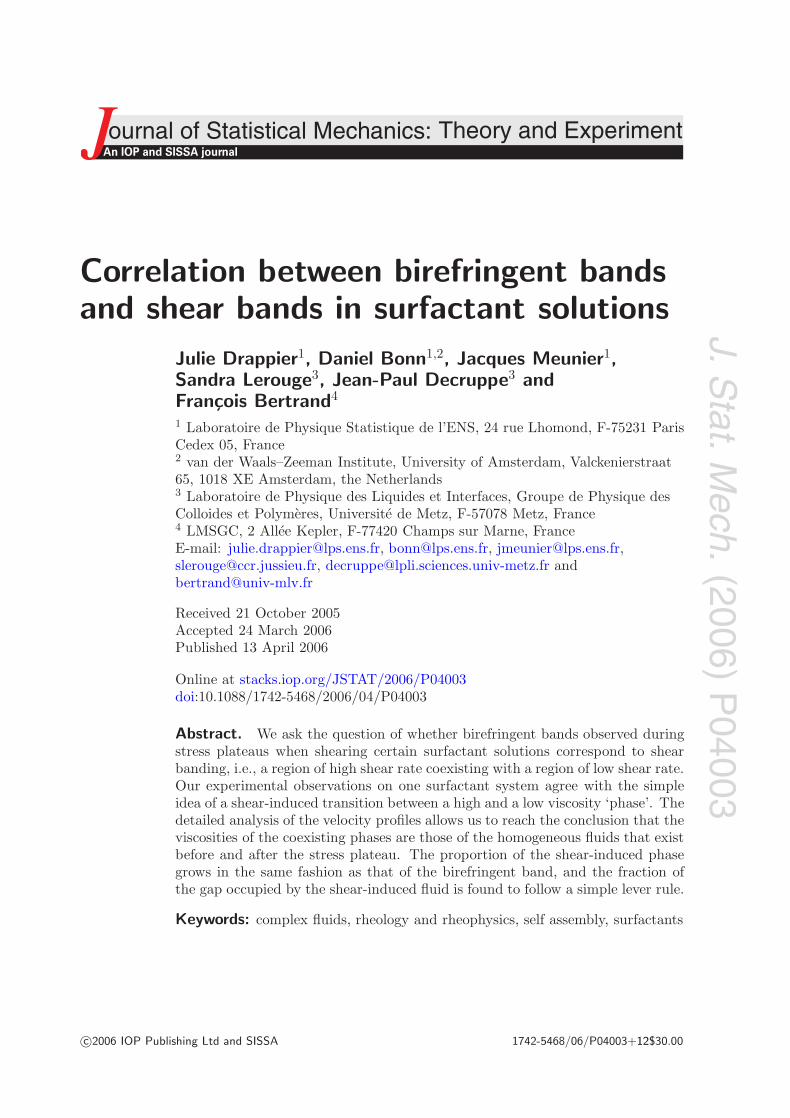
Correlation between birefringent bands and shear bands in surfactant solutions
View the table of contents for this issue, or go to the journal homepage for more
J. Stat. Mech. (2006) P04003
(http://iopscience.iop.org/1742-5468/2006/04/P04003)
Home Search Collections Journals About Contact us My IOPscience
J.Stat.M
ech.(2006)
P04003
ournal of Statistical Mechanics:An IOP and SISSA journalJ Theory and Experiment
Correlation between birefringent bandsand shear bands in surfactant solutions
Julie Drappier1, Daniel Bonn1,2, Jacques Meunier1,Sandra Lerouge3, Jean-Paul Decruppe3 andFrancois Bertrand4
1 Laboratoire de Physique Statistique de l’ENS, 24 rue Lhomond, F-75231 ParisCedex 05, France2 van der Waals–Zeeman Institute, University of Amsterdam, Valckenierstraat65, 1018 XE Amsterdam, the Netherlands3 Laboratoire de Physique des Liquides et Interfaces, Groupe de Physique desColloides et Polymeres, Universite de Metz, F-57078 Metz, France4 LMSGC, 2 Allee Kepler, F-77420 Champs sur Marne, FranceE-mail: [email protected], [email protected], [email protected],[email protected], [email protected] [email protected]
Received 21 October 2005Accepted 24 March 2006Published 13 April 2006
Online at stacks.iop.org/JSTAT/2006/P04003doi:10.1088/1742-5468/2006/04/P04003
Abstract. We ask the question of whether birefringent bands observed duringstress plateaus when shearing certain surfactant solutions correspond to shearbanding, i.e., a region of high shear rate coexisting with a region of low shear rate.Our experimental observations on one surfactant system agree with the simpleidea of a shear-induced transition between a high and a low viscosity ‘phase’. Thedetailed analysis of the velocity profiles allows us to reach the conclusion that theviscosities of the coexisting phases are those of the homogeneous fluids that existbefore and after the stress plateau. The proportion of the shear-induced phasegrows in the same fashion as that of the birefringent band, and the fraction ofthe gap occupied by the shear-induced fluid is found to follow a simple lever rule.
Keywords: complex fluids, rheology and rheophysics, self assembly, surfactants
c©2006 IOP Publishing Ltd and SISSA 1742-5468/06/P04003+12$30.00
J.Stat.M
ech.(2006)
P04003
Correlation between birefringent bands and shear bands in surfactant solutions
Contents
1. Introduction 2
2. Experiments and results 3
3. Discussion 9
Acknowledgments 10
References 10
1. Introduction
The flow behaviour of ‘complex fluids’ such as polymer or surfactant solutions is of bothpractical and fundamental interest [5, 22, 36]. The large length scales present in thesesystems, when compared to molecular dimensions, can lead to interactions between theflow field and the structure of the complex fluids. A structural change can affect theviscosity of the fluid and thus, in turn, modify the flow field; this coupling betweenstructure and flow is in most cases responsible for the large difference in flow propertiesbetween complex fluids and ‘normal’ (Newtonian) fluids.
One of the problems that has attracted much attention lately [2, 4, 8, 9, 13, 18,23, 24, 32, 40, 42] is the effect of shear on the flow and structure of surfactant solutions. Oneof the key questions is the physical origin of the stress plateau observed in stress–straincurves. Such plateaus have been observed for a variety of systems; for surfactant systemsprincipally in lamellar phases [13, 23, 40] and systems forming giant micelles [4, 9, 24].Such stress plateaus, also observed for other complex fluids [21, 27, 35, 37, 43] can havevery different origins. The observations on some systems agree with the hypothesis of ashear-induced two-phase coexistence. Other systems exist for which two different typesof surfactant organization are observed, but these two ‘phases’ coexist in a mechanicallyunstable configuration [6]. In addition, in again different systems, it has been shown thatthe stress plateau can be due to wall slip [19]. It appears therefore that there is no simplerelation between the occurrence of a stress plateau and the organization of the surfactantsystems.
Here, we focus on the first situation, which appears the easiest one to understand.This situation occurs most frequently in wormlike micellar surfactant solutions, and itssignature is the occurrence of plateaus (vertical or horizontal) in the measured flow curves,i.e. of the stress as a function of the shear rate [3]. The rheological interpretation of suchplateaus is not straightforward, as for instance a stress plateau (a horizontal plateau)implies that for a given stress, several shear rates, and consequently viscosities, arepossible. An explanation that has been proposed is a shear-induced phase coexistence: ashear-induced phase transition occurs [4, 34, 36] at a certain shear rate, and the plateausignals a two-phase coexistence. The variation of the (average) shear rate is achieved ifthe proportion of the less viscous phase (which has the larger shear rate) grows, and theproportion of the more viscous phase diminishes.
doi:10.1088/1742-5468/2006/04/P04003 2
J.Stat.M
ech.(2006)
P04003
Correlation between birefringent bands and shear bands in surfactant solutions
For some, but not all, cases for which a plateau is found, a macroscopic phaseseparation has indeed been observed [4, 6, 9, 18, 19, 24]. In the wormlike micellar systemsthat we consider here, the shear-induced ‘phase’ usually appears as a birefringent bandthat progressively invades the gap of a Couette cell. Olmsted [33] argues that if theplateau is horizontal, a common stress phase separation occurs. The bands are at thesame stress, and consequently have different strain rates. Mechanically, the phases thenhave to coexist in the flow gradient direction. The coexistence of a high and a low shearrate region is called shear banding; also this shear banding has been observed in wormlikemicelles [4, 9, 18, 24].
However, it has not been demonstrated convincingly that the birefringent bandsobserved in some experiments [3, 10, 12, 26], correspond to the shear bands observed inother experiments with MRI imaging [7, 14, 15, 25, 29], light scattering [41], ultrasound [30]or PIV [31]. This is what we seek to understand here. We therefore perform rheologicaland birefringence measurements on the same system, and determine the velocity profilesunder shear using magnetic resonance imaging (MRI). This allows us to make aquantitative comparison, allowing us to reach the conclusion that the birefringent bandsdo indeed correspond to shear bands, which is the main conclusion of this paper. Veryrecently, Hu and Lips [20] studied shear banding with a combination of rheology, MRI andbirefringence measurements, very similarly to what we do here, although on a differentsystem, and with more emphasis on the kinetics than on the steady states.
2. Experiments and results
The system that we study is an aqueous solution containing 2.5% of cetyltrimethylammo-nium bromide (CTAB) and 0.4% of sodium salicylate (NaSal). In these proportions, thisis a wormlike micellar system in the semidilute regime. For the CTAB/salicylate system,stress plateaus in relation to shear banding have been studied previously in the semidiluteregime that we are studying here also [3, 28, 39]. In the dilute regime, this system is shearthickening and has been observed to fracture under flow [11, 16, 18, 19]. The rheology wasdone on a Reologica Stress-Tech rheometer, which imposes either the shear stress or theshear rate in a Couette cell with a diameter of 25 mm. Different gaps were used: 0.125,0.25, 0.5, 1 and 3 mm. The optical measurements consisted of both a direct observationof the transparent Couette cell from the side and a birefringence measurement in the gap.For the latter we used a gap of 1 mm and sent polarized white light through the vorticitydirection, i.e. along the axis of the Couette cell, which is detected between crossed polar-izers [18, 24]. Velocity profiles in the gap were measured by MRI in a Couette cell with agap of 1 or 0.65 cm to achieve a larger shear rate; the details of this technique and theset-up are given elsewhere [38].
Imposing first the shear rate and plotting the shear stress as a function of the shearrate (figure 1), an almost horizontal plateau can be observed. We wait 300 s for eachpoint, a time long enough that we believe the results to correspond to a steady state,despite the slight bump at the beginning of the plateau that should not be present in astrictly steady state. During the plateau, the same shear stress σ is measured, for a shearrate between γ1 ≈ 1 s−1 and γ2 ≈ 100 s−1. Consequently the viscosity η = σ/γ decreasesduring the plateau and the system is strongly shear thinning.
doi:10.1088/1742-5468/2006/04/P04003 3

J.Stat.M
ech.(2006)
P04003
Correlation between birefringent bands and shear bands in surfactant solutions
She
ar s
tres
s (P
a)
Shear rate (s–1)
Figure 1. Shear stress as a function of the shear rate measured in a Couette cellwith a gap of 1 mm at the imposed shear rate. The time for each point is 300 s.Inset: the hysteresis observed if the shear stress is imposed with a time of 10 sfor each point.
If in this experiment each stress is imposed for only 10 s upon increasing andsubsequently decreasing the stress we observe a hysteresis (inset of figure 1). Performingthe same experiments with different gap sizes of the Couette cell, the plateau is alwaysobserved at the same stress; there is no dependence on the gap.
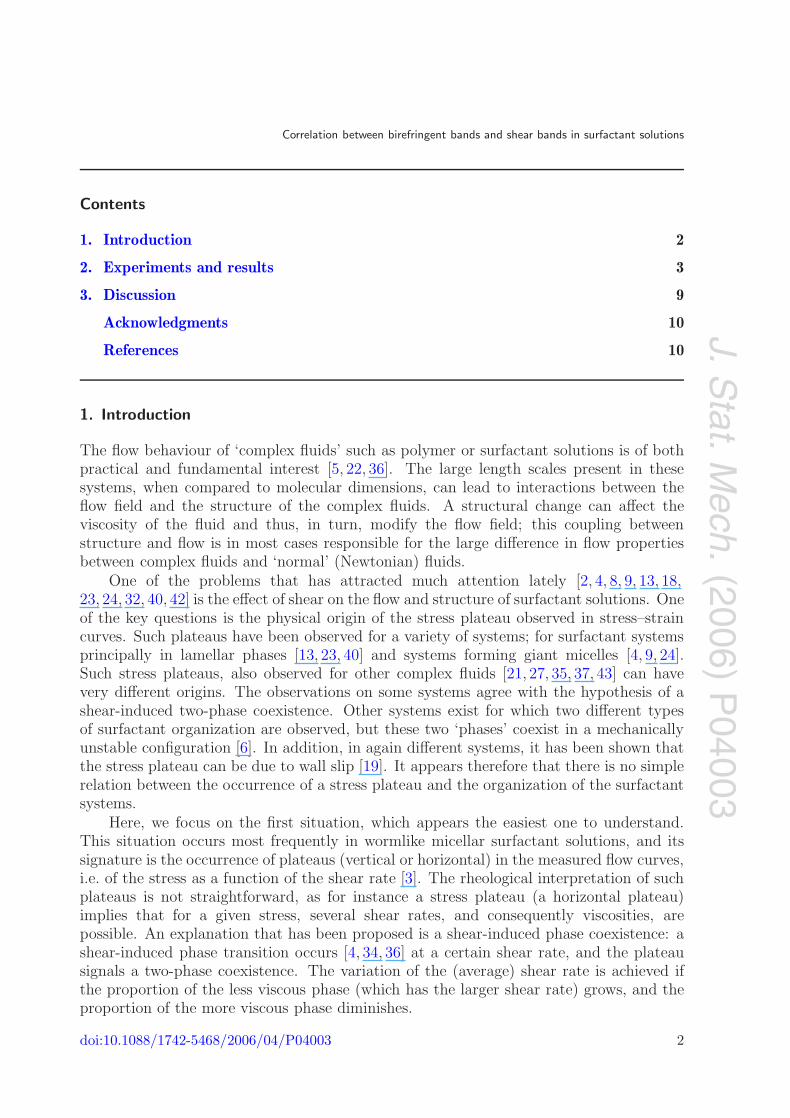
We now turn to the shear banding. Visualization of the sheared fluid in the gapbetween crossed polarizers shows that increasing the shear rate, at the beginning of theplateau, a new birefringent phase forms, growing from the moving inner cylinder (figure 2).We observe a phase coexistence and during the plateau the new phase progressively growsto fill the gap completely at the end of the plateau. The pictures show a birefringent bandnear the inner and a small birefringent region near the outer cylinder; we will come backto this observation later.
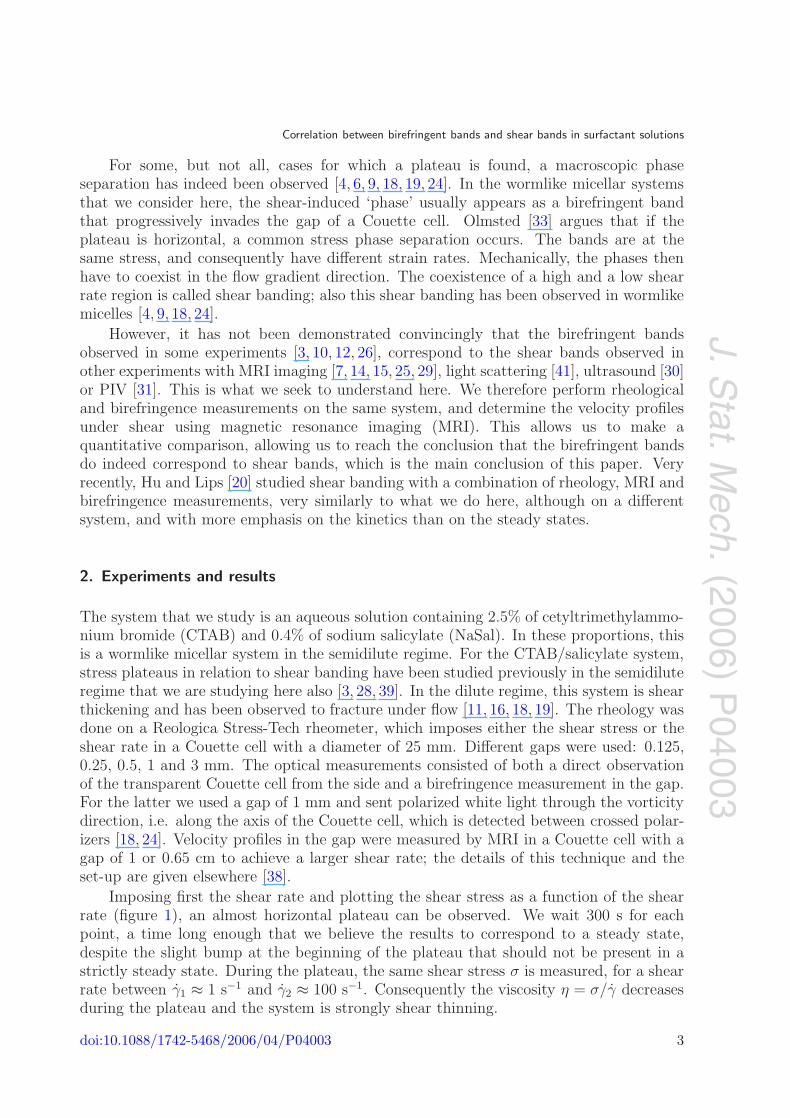
The velocity profile in the gap measured by MRI (figure 3) shows that, upon increasingthe shear rate on the stress plateau, a highly sheared region progressively invades the gap.This region appears to correspond to the birefringent band; as we shall see later morequantitatively, they occupy roughly the same fraction of the gap in the two experiments(birefringence and MRI) at the same shear rate. The larger part of the shear rate isconcentrated in the new band, near the rotating cylinder: the shear-induced phase has alower viscosity. In figure 3 the points closest to the rotating wall are missing, because ofthe experimental limitations of the MRI. However, extrapolations of the velocity profilesto the wall as a power law (figure 7) show that there is no wall slip.
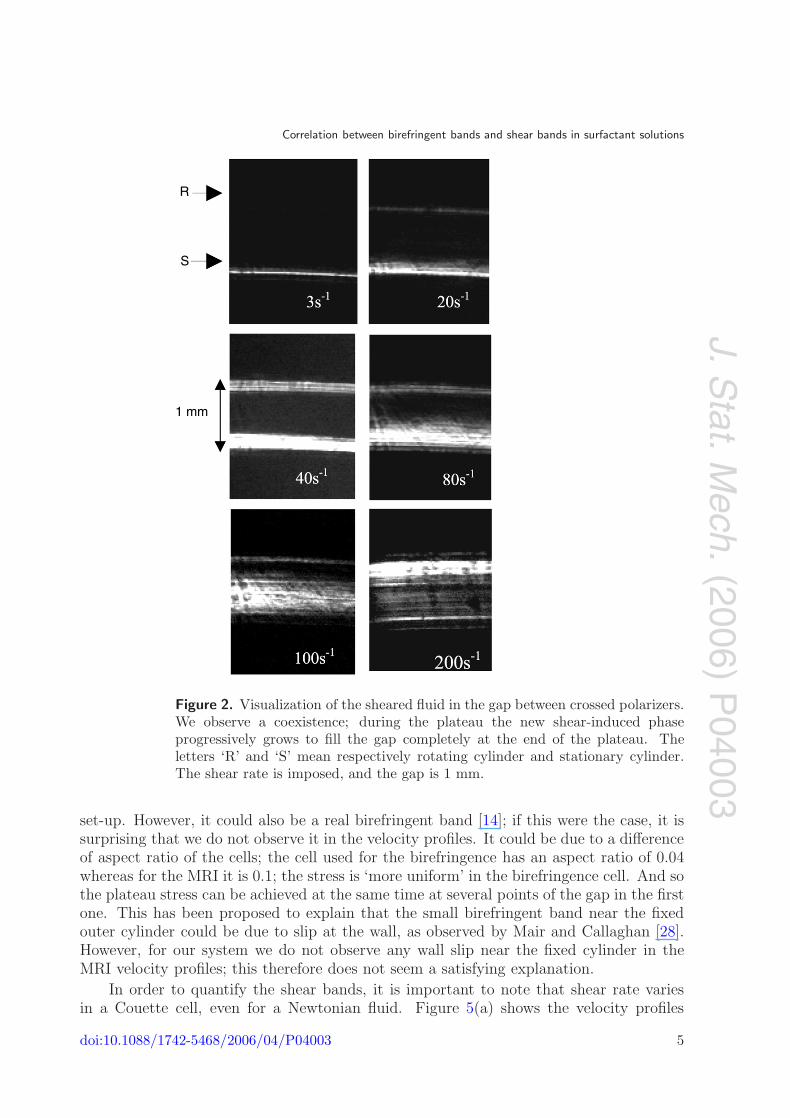
To make a more quantitative comparison between the shear bands and the birefringentbands, we first quantify the birefringence measurements. Figure 4 shows how the grey levelwithin the gap changes when the shear rate is increased on the plateau. We determine thewidth of the birefringent band by means of a threshold. We can see a small second brightband near the fixed outer cylinder. This band could be an artefact of the experimental
doi:10.1088/1742-5468/2006/04/P04003 4
J.Stat.M
ech.(2006)
P04003
Correlation between birefringent bands and shear bands in surfactant solutions
R
S
1 mm
Figure 2. Visualization of the sheared fluid in the gap between crossed polarizers.We observe a coexistence; during the plateau the new shear-induced phaseprogressively grows to fill the gap completely at the end of the plateau. Theletters ‘R’ and ‘S’ mean respectively rotating cylinder and stationary cylinder.The shear rate is imposed, and the gap is 1 mm.
set-up. However, it could also be a real birefringent band [14]; if this were the case, it issurprising that we do not observe it in the velocity profiles. It could be due to a differenceof aspect ratio of the cells; the cell used for the birefringence has an aspect ratio of 0.04whereas for the MRI it is 0.1; the stress is ‘more uniform’ in the birefringence cell. And sothe plateau stress can be achieved at the same time at several points of the gap in the firstone. This has been proposed to explain that the small birefringent band near the fixedouter cylinder could be due to slip at the wall, as observed by Mair and Callaghan [28].However, for our system we do not observe any wall slip near the fixed cylinder in theMRI velocity profiles; this therefore does not seem a satisfying explanation.
In order to quantify the shear bands, it is important to note that shear rate variesin a Couette cell, even for a Newtonian fluid. Figure 5(a) shows the velocity profiles
doi:10.1088/1742-5468/2006/04/P04003 5
J.Stat.M
ech.(2006)
P04003
Correlation between birefringent bands and shear bands in surfactant solutions
v (c
m/s
)
r (cm)
w
w
w
w
w
Figure 3. Velocity profiles measured by MRI for different imposed shearrates. Increasing the shear rate on the stress plateau, a highly sheared regionprogressively invades the gap. The gap is 1 cm. For each imposed shear rate, thevelocity of the wall is denoted as ‘vw’.
Tran
smitt
ed li
ght i
nten
sity
(arb
itary
uni
t)
Position in the gap (mm)
Figure 4. Variation of the transmitted light intensity as a function of the gapfrom the pictures shown in figure 2.
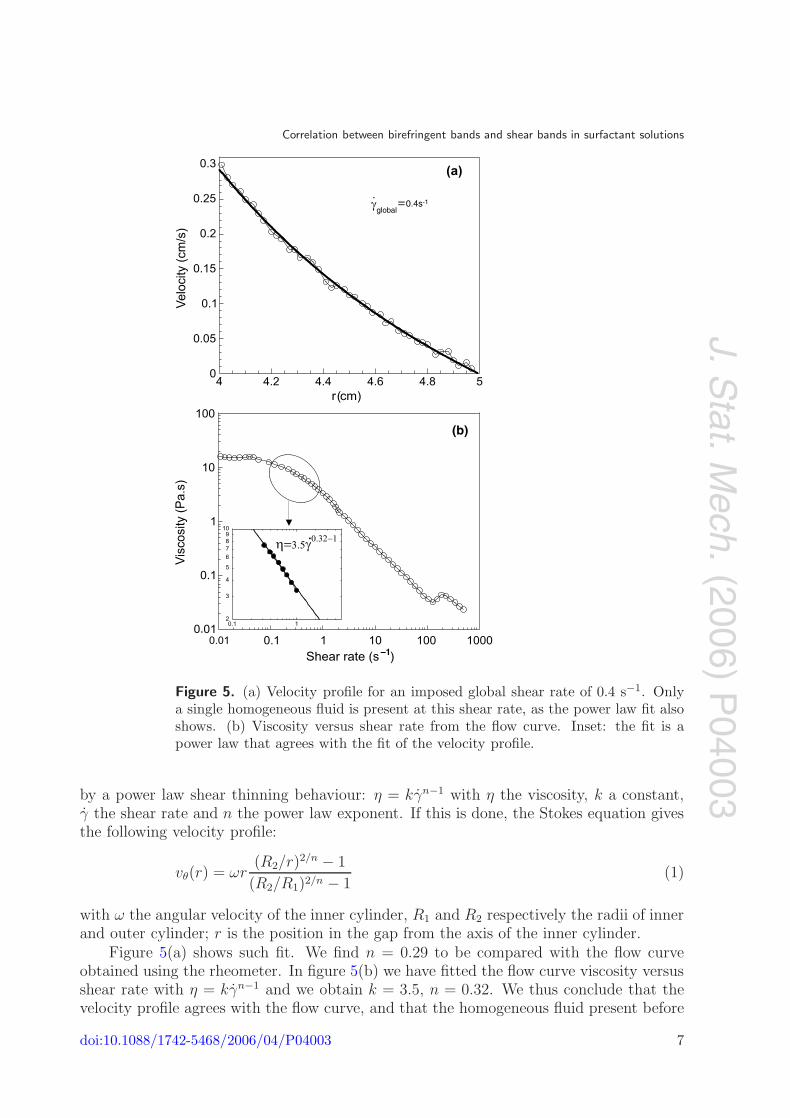
measured for shear rates of 0.4 s−1 (just before the plateau): the fluid is sheared in ahomogeneous way. We first ask the question of whether the MRI measurements on thesehomogeneous fluids agree with the rheology measurements. For our non-Newtonian fluid,it seems reasonable to suppose that for the limited range of stresses and shear rates coveredin a single experiment, the behaviour of the a homogeneous fluid can be approximated
doi:10.1088/1742-5468/2006/04/P04003 6
J.Stat.M
ech.(2006)
P04003
Correlation between birefringent bands and shear bands in surfactant solutions
(b)
–1
global0.4s-1
Figure 5. (a) Velocity profile for an imposed global shear rate of 0.4 s−1. Onlya single homogeneous fluid is present at this shear rate, as the power law fit alsoshows. (b) Viscosity versus shear rate from the flow curve. Inset: the fit is apower law that agrees with the fit of the velocity profile.
by a power law shear thinning behaviour: η = kγn−1 with η the viscosity, k a constant,γ the shear rate and n the power law exponent. If this is done, the Stokes equation givesthe following velocity profile:
vθ(r) = ωr(R2/r)
2/n − 1
(R2/R1)2/n − 1(1)
with ω the angular velocity of the inner cylinder, R1 and R2 respectively the radii of innerand outer cylinder; r is the position in the gap from the axis of the inner cylinder.
Figure 5(a) shows such fit. We find n = 0.29 to be compared with the flow curveobtained using the rheometer. In figure 5(b) we have fitted the flow curve viscosity versusshear rate with η = kγn−1 and we obtain k = 3.5, n = 0.32. We thus conclude that thevelocity profile agrees with the flow curve, and that the homogeneous fluid present before
doi:10.1088/1742-5468/2006/04/P04003 7

J.Stat.M
ech.(2006)
P04003
Correlation between birefringent bands and shear bands in surfactant solutions
Vel
ocity
(cm
/s)
r (cm)
0
global115 s
Figure 6. Velocity profile for an imposed global shear rate of 115 s−1. Again,only one fluid is present at this shear rate, as also shown by the power law fit.The gap here is 0.65 cm, in order to achieve a high shear rate of 115 s−1.
the plateau is a shear thinning fluid with an exponent n = 0.3. We now consider thevelocity profile measured for the shear rate of 115 s−1 (figure 6) just at the end of theplateau. This is the largest shear rate we can impose with the MRI set-up. We observethat at this shear rate, only one ‘fluid’ is present and sheared in a homogeneous way.Indeed, we can fit the velocity profile with a power law model (equation (1)) from whichwe obtain n = 0.038 (figure 6). So the induced phase is very different from the one presentbefore the plateau: it is a strongly shear thinning fluid as its exponent n is very small.Unfortunately we cannot compare the power law fit with the flow curve: the high shearrate branch is not accessible due to the appearance of flow instabilities. We have also triedto describe the velocity profile of the shear-induced fluid with a Bingham model [41], butthe results are not satisfactory.
We now turn to what happens on the stress plateau. Figure 7 shows the measuredvelocity profiles for a few imposed global shear rates: there is a clear discontinuity inslope in the profile, corresponding to the low (black points) and the high (white points)shear band. The insets represent the calculated local shear rate from the velocity withγ = r(∂/∂r)(vθ/r). We initially put the interface position at the discontinuity in localshear rate, and then determine it more precisely as the intersection between the fits of thetwo velocity profiles. For each imposed global shear rate of figure 7, the profile in the lowshear band (black points) is fitted with the power law model of equation (1), keeping nconstant and equal to 0.3. The profile in the high shear band (white points) is fitted withpower law model for the general case where both cylinders are rotating at velocities ω1
and ω2: vθ(r) = r[ω2 + ((ω1 − ω2)/(R2/R1)2/n − 1)((R2/r)
2/n − 1)]. For ω2, the rotationvelocity of the outer cylinder, we have taken the velocity of the fluid at the position thatseparates the two bands, as if the less sheared fluid were a wall. The exponent n is keptconstant and equal to 0.038. This allows us to say that on the stress plateau there isindeed a coexistence of two fluids, one of which has the viscosity of the homogeneous fluidbefore the stress plateau, and the other one the viscosity of the shear-induced phase, i.e.,
doi:10.1088/1742-5468/2006/04/P04003 8

J.Stat.M
ech.(2006)
P04003
Correlation between birefringent bands and shear bands in surfactant solutions
globalglobal s10
global64 s global
100 s
10
8
6
4
2
0
Vel
ocity
(cm
/s)
40
30
20
10
0
Vel
ocity
(cm
/s)
40
30
20
10
0
Vel
ocity
(cm
/s)
4 4.2 4.4 4.6 4.8 5r(cm)
4 4.24.1 4.4 4.5 4.6 4.6r(cm)
50
40
30
20
10
0
Vel
ocity
(cm
/s)
4 4.24.1 4.4 4.5 4.6 4.6r(cm)
4 4.2 4.4 4.6 4.8 5r(cm)
Figure 7. Velocity profiles for different imposed global shear rates. The opencircles are for the shear band, and the filled circles are for the initial fluid, bothfitted with a power law. The insets show the local shear rate extracted from thevelocity profile.
the fluid after the end of the plateau. We are able to locate the average position of theinterface rather precisely, although large fluctuations in the interface position have beenobserved in similar systems [1, 17, 25].
3. Discussion
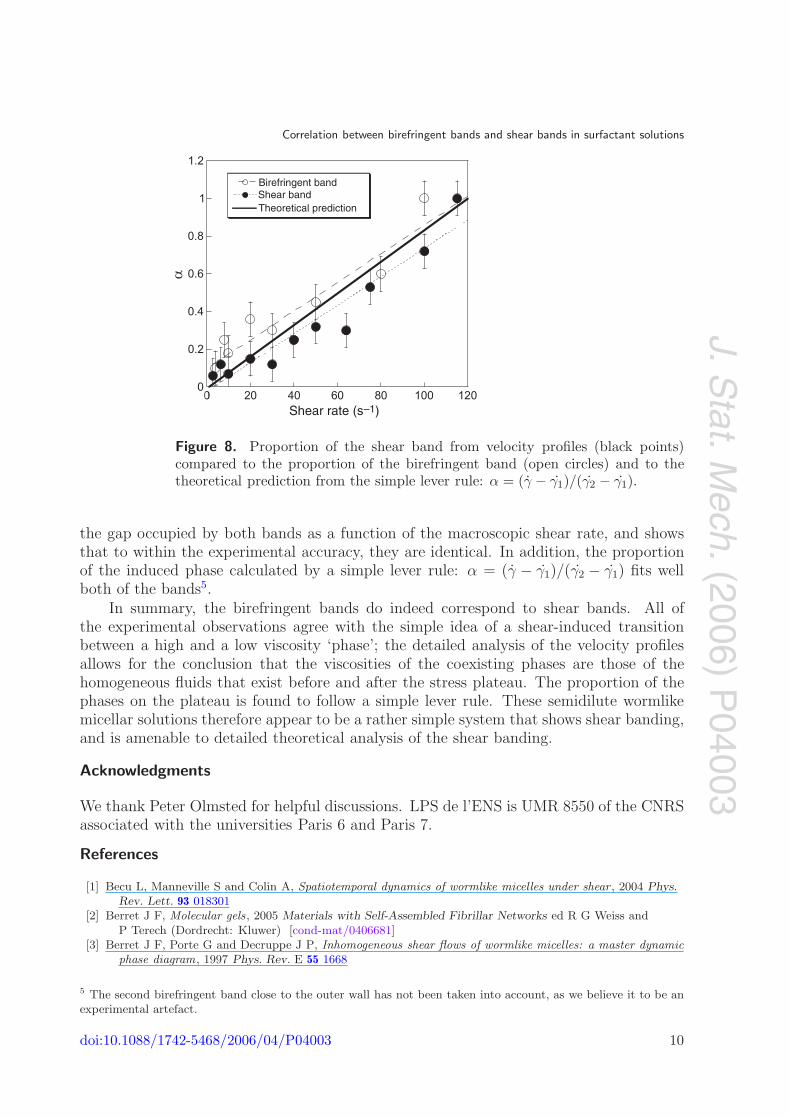
We can now compare the results from the birefringence measurements with themeasurements of the velocity profile, and answer the question of whether the birefringentbands are indeed the shear bands. Figure 8 shows the comparison with the fraction of
doi:10.1088/1742-5468/2006/04/P04003 9
J.Stat.M
ech.(2006)P
04003
Correlation between birefringent bands and shear bands in surfactant solutions
Theoretical predictionShear bandBirefringent band
Shear rate (s–1)
Figure 8. Proportion of the shear band from velocity profiles (black points)compared to the proportion of the birefringent band (open circles) and to thetheoretical prediction from the simple lever rule: α = (γ − γ1)/(γ2 − γ1).
the gap occupied by both bands as a function of the macroscopic shear rate, and showsthat to within the experimental accuracy, they are identical. In addition, the proportionof the induced phase calculated by a simple lever rule: α = (γ − γ1)/(γ2 − γ1) fits wellboth of the bands5.
In summary, the birefringent bands do indeed correspond to shear bands. All ofthe experimental observations agree with the simple idea of a shear-induced transitionbetween a high and a low viscosity ‘phase’; the detailed analysis of the velocity profilesallows for the conclusion that the viscosities of the coexisting phases are those of thehomogeneous fluids that exist before and after the stress plateau. The proportion of thephases on the plateau is found to follow a simple lever rule. These semidilute wormlikemicellar solutions therefore appear to be a rather simple system that shows shear banding,and is amenable to detailed theoretical analysis of the shear banding.
Acknowledgments
We thank Peter Olmsted for helpful discussions. LPS de l’ENS is UMR 8550 of the CNRSassociated with the universities Paris 6 and Paris 7.
References
[1] Becu L, Manneville S and Colin A, Spatiotemporal dynamics of wormlike micelles under shear , 2004 Phys.Rev. Lett. 93 018301
[2] Berret J F, Molecular gels, 2005 Materials with Self-Assembled Fibrillar Networks ed R G Weiss andP Terech (Dordrecht: Kluwer) [cond-mat/0406681]
[3] Berret J F, Porte G and Decruppe J P, Inhomogeneous shear flows of wormlike micelles: a master dynamicphase diagram, 1997 Phys. Rev. E 55 1668
5 The second birefringent band close to the outer wall has not been taken into account, as we believe it to be anexperimental artefact.
doi:10.1088/1742-5468/2006/04/P04003 10

J.Stat.M
ech.(2006)P
04003
Correlation between birefringent bands and shear bands in surfactant solutions
[4] Berret J F, Roux D C and Porte G, Isotropic-to-nematic transition in wormlike micelles under shear , 1994J. Physique II 4 1261
[5] Bird R B, Armstrong R C and Hassager O, 1987 Dynamics of Polymeric Liquids vol 1 (New York: Wiley)[6] Bonn D, Meunier J, Greffier O, Al-Kahwaji A and Kellay H, Bistability in non-Newtonian flow: rheology of
lyotropic liquid crystals, 1998 Phys. Rev. E 58 2115[7] Britton M and Callaghan P T, Two-phase shear band structures at uniform stress, 1997 Phys. Rev. Lett.
78 4930[8] Britton M and Callaghan P T, Shear banding instability in wormlike micellar solutions, 1999 Eur. Phys. J.
B 7 237[9] Cappalaere E, Berret J F, Decruppe J P, Cressely R and Lindner P, Rheology, birefringence, and
small-angle neutron scattering in a charged micellar system: evidence of a shear-induced phase transition,1995 Phys. Rev. E 52 4009
[10] Cappalaere E, Berret J F, Decruppe J P, Cressely R and Lindner P, 1997 Phys. Rev. E 56 1668[11] Cressely R and Hartmann V, Rheological behavior and shear-thickening exhibited by aqueous CTAB micellar
solutions, 1998 Eur. Phys. J. B 6 57[12] Decruppe J P, Cressely R, Makhoufli R and Cappelaere E, 1995 Colloid Polym. Sci. 273 346[13] Diat O, Roux D and Nallet F, Effect of shear on a lyotropic lamellar phase, 1993 J. Physique II 3 1427[14] Fischer E and Callaghan P T, Shear-banding and the isotropic-to-nematic transition in wormlike micelles,
1999 Phys. Rev. E 64 95[15] Fischer E and Callaghan P T, Is a birefringence band a shear band? , 2000 Europhys. Lett. 50 803[16] Hartmann V and Cressely R, Simple salt effects on the characteristics of the shear thickening exhibited by
an aqueous micellar solution of CTAB/NaSal , 1997 Europhys. Lett. 40 691[17] Holmes W M, Lopez-Gonzales M R and Callaghan P T, Fluctuations in shear-banded flow seen by NMR
velocimetry , 2003 Europhys. Lett. 64 274[18] Hu Y, Boltenhagen P and Pine D J, Shear thickening in low-concentration solutions of wormlike micelles. I.
Direct visualization of transient behavior and phase transitions, 1998 J. Rheol. 79 1185[19] Hu Y, Boltenhagen P, Maatthys E F and Pine D J, Shear thickening in low-concentration solutions of
wormlike micelles. II. Slip, fracture, and stability of the shear-induced phase, 1998 J. Rheol. 79 1209[20] Hu Y and Lips A, Kinetics and mechanism of shear banding in an entangles micellar solution, 2005 J.
Rheol. 49 1001[21] Larson R G, 1992 Rheol. Acta 31 213[22] Larson R G, 1999 The Structure and Rheology of Complex Fluids (New York: Oxford University Press)[23] Leon A, Bonn D and Meunier J, Coupling between flow and structure for a lamellar surfactant phase, 2000
Phys. Rev. Lett. 84 1335[24] Lerouge S, Decruppe J P and Humbert C, Shear banding in a micellar solution under transient flow , 1998
Phys. Rev. Lett. 81 5457[25] Lopez-Gonzalez M R, Holmes W M, Callaghan P T and Photinos P J, Shear banding fluctuations and
nematic order in wormlike micelles, 2004 Phys. Rev. Lett. 93 268302[26] Makhoufli R, Decruppe J P, Aitali A and Cressely R, 1995 Europhys. Lett. 32 253[27] McLeish T C B and Ball R C, 1986 J. Polym. Phys., Polym. Phys. Edn 24 1735[28] Mair R W and Callaghan P T, Observation of shear banding in wormlike micelles by NMR velocimetry
imaging , 1996 Europhys. Lett. 36 719[29] Mair R W and Callaghan P T, 1997 J. Rheol. 41 901[30] Manneville S, Salmon J B and Colin A, 2004 Eur. Phys. J. E 13 197[31] Mendez-Sanchez A F, Perez-Gonzales J, de Vargas L, Castrejon-Pita J R, Castrejon-Pita A A and
Huelsz G, 2003 J. Rheol. 47 1455[32] Oda R, Panizza P, Schmitz M and Lequeux F, Direct evidence of the shear-induced structure of wormlike
micelles: Gemini surfactant 12-2-12 , 1996 Langmuir 13 6407[33] Olmsted P D, Two-state shear diagrams for complex fluids in shear flow , 1999 Europhys. Lett. 48 339[34] Olmsted P D and Golbart P M, Theory of the nonequilibrium phase transition for nematic liquid crystal
under shear flow , 1990 Phys. Rev. A 41 4578[35] Panizza P, Archambault P and Roux D, Effects of shear on the smectic a-phase of thermotropic
liquid-crystals, 1995 J. Physique II 5 303[36] Porte G, Berret J F and Harden J, Inhomogeneous flows of complex fluids: mechanical instability versus
non-equilibrium phase transition, 1997 J. Physique II 7 459 and references therein[37] Pujolle C-R and Noirez L, Observation of shear-induced nematic-transition in side-chain liquid crystal
polymers, 2001 Nature 409 167
doi:10.1088/1742-5468/2006/04/P04003 11
J.Stat.M
ech.(2006)
P04003
Correlation between birefringent bands and shear bands in surfactant solutions
[38] Raynaud J S, Moucheront P, Baudez J C, Bertrand F, Guilbaud J P and Coussot P, Direct determinationby nuclear magnetic resonance of the thixotropic and yielding behavior of suspensions, 2002 J. Rheol.46 709
[39] Rehage H and Hofmann H, Shear induced phase transitions in highly dilute aqueous detergent solutions,1982 Rheol. Acta 21 561
[40] Roux D, Nallet F and Diat O, Rheology of lyotropic lamellar phases, 1993 Europhys. Lett. 24 53[41] Salmon J B, Colin A and Manneville S, Velocity profiles in shear-banding wormlike micelles, 2003 Phys.
Rev. Lett. 90 228303[42] Spenley N A, Cates M E and McLeish T C B, Nonlinear rheology of wormlike micelles, 1993 Phys. Rev.
Lett. 71 939[43] Tordella J P, 1969 Rheology, Theory and Applications ed F R Eirich (New York: Academic)
doi:10.1088/1742-5468/2006/04/P04003 12
Related Documents