Chlorine Residuals Corpus Christi Water Dept. Presentation by: Edward Tatum Hankins

Corpus Christi Water Dept. Presentation by: Edward Tatum Hankins.
Dec 26, 2015
Welcome message from author
This document is posted to help you gain knowledge. Please leave a comment to let me know what you think about it! Share it to your friends and learn new things together.
Transcript

Chlorine Residuals Corpus Christi Water Dept.
Presentation by: Edward Tatum Hankins

Data/Tools
Data:Chlorine Residuals – Corpus Christi Water QualityTiger Files - www.census.gov/geo/www/tiger/Census Data – www.factfinder.census.gov
Software:MS EXCEL © Microsoft 2011ArcGIS 10 © ESRIOpenGeoDa © Luc Anselin 2011

What is a Dead End Main


Why do we Flush?
• The water mains must be flushed on a monthly basis to ensure a quality potable water supply.
• Water that stands still, moves slowly, or does not circulate in the mains eventually will deplete disinfection residuals. Inadequate residuals increase bacterial growth in the distribution system. Excessive bacterial growth can then occur causing the water to become un-potable.
• 30 TAC 290.46(d) requires the presence of a disinfection residual of at least .2mg/l free chlorine or .5 mg/l of available chloramine throughout the distribution system.


Does Population Density Affect Chlorine Residuals? Does population density have any effect on the chlorine residuals as water is pumped through the system?
Null Hypothesis: Population Density will have no affect on chlorine residuals.
Test Hypothesis: Population Density will affect chlorine residuals, as more water is pulled into higher populated areas it likely pull in more chlorine as well.

Data - Data on DEM averages was provided in Excel Format from the Water Quality Department.
- Three months of data was provided in Excel format of each flushing point showing chlorine residuals.
- At each of the 2000 flushing points a chlorine residual has been taken.
- Using excel the data was averaged so each point has its own unique value.

Dead End Mains were plotted and then outliers and null sets were excluded. The resulting data was re-plotted and a pattern is beginning to emerge.


Population Density Map
Tigerline Shape Files were downloaded from http://www.census.gov/geo/www/tiger/
These were joined with Census Data taken from American FactFinder.
The joined by the tractID


Statistical Analysis

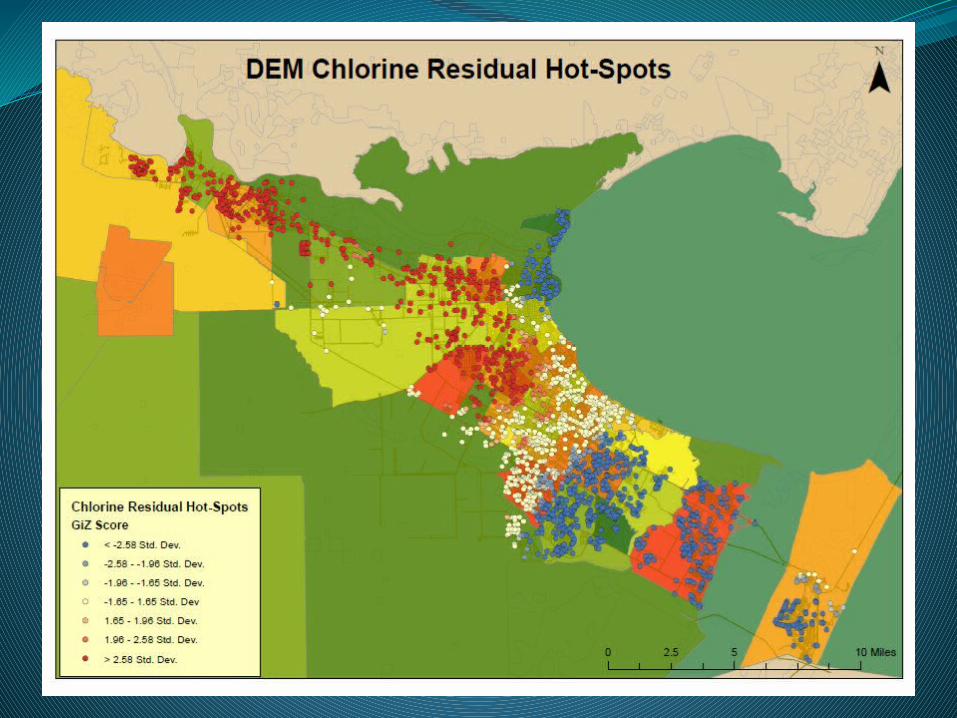
Clustering
The data shows that there is significant clustering of High to High values and Low to Low values. The K function shows that clustering exists both in the close observations and in the distant observations.

Population Vs. Residuals
When the population layer and residual layer are viewed together we can see that population has little to no effect on chlorine residuals.
As the water is pumped through the system is loses its chlorine is way that is modeled by:

Interpolated Values

Interpolated Values

Conclusions
In conclusion we can see that chlorine residual readings are independent of population and instead are solely dependant on the properties of the water line carrying the water.

Future Work
Identify what is causing the loss of chlorine residuals into the new development on the south side of town.
Build a model of the water system, this would allow for modeling of a reinjection of chlorine from a pumping substation in the case of catastrophic loss of pressure.
This would also allow us to model how different size water mains will affect pressure in new subdivisions.

Sources
Data provided by:
Water Quality Department, City of Corpus Christi Water.Water Department of Corpus Christihttp://www.census.gov/geo/www/tiger/http://factfinder.census.gov
Analysis done with:
ArcMAP 10 © ESRI OpenGeoDa © 2011 Luc Anselin
Related Documents