Corpus-based generation of linguistic hypotheses using quantitative methods Hermann Moisl, University of Newcastle, UK

Welcome message from author
This document is posted to help you gain knowledge. Please leave a comment to let me know what you think about it! Share it to your friends and learn new things together.
Transcript

Corpus-based generation of linguistic hypotheses using quantitative methods
Hermann Moisl, University of Newcastle, UK

Introduction
What is the relationship between theoretical and quantitative linguistics, that is,
between
• the statement of scientific hypotheses about the human language faculty and its
use in the world on the one hand, and
• the application of mathematical and statistical methods to interpretation of
natural language speech and text corpora on the other?
In terms of the currently‐dominant Popperian scientific methodology, there is an
obvious answer.
Corpora provide a potential source of data for testing linguistic hypotheses, and it is
the role of the quantitative linguist to provide the tools to realize that potential.

Introduction
It's hard to see why anyone would or should dispute this.
As the present talk argues, however, there is more to the relationship than that.
Specifically, the argument is that corpus‐based quantitative linguistics has a
fundamental role to play in the scientific study of language: hypothesis
generation.

Introduction
The discussion is in two main parts.
The first part briefly outlines Popperian methodology and the place of hypothesis
generation within it, and explains why the statement of scientifically interesting
linguistic hypotheses can be problematical under some circumstances.
The second then goes on to show how two mathematical techniques,
cluster analysis
and principal component analysis, can be used to resolve that problem.
Hypothesis generationThe aim of science is to understand the reality around us.
Philosophy of science is devoted to explicating the nature of science and its
relationship to reality, and, perhaps predictably, both are controversial.
In practice, most scientists explicitly or implicitly assume a view of scientific
methodology based on the philosophy of Karl Popper, which is centred on the
concept of the falsifiable hypothesis:
• a research question is asked about some domain of interest,
• a hypothesis is proposed in answer to the question,
• the hypothesis is tested to see if its claims and implications are compatible with
observation of the domain: if it is the hypothesis is taken to be confirmed as a
valid statement about the domain, and if not it is taken to be falsified and must
then either be modified so as to make it compatible with observation, or
abandoned.
Hypothesis generation
Because the falsifiable hypothesis is central in contemporary science, it is natural to
ask how hypotheses are generated.
The consensus in philosophy of science is that hypothesis generation is non‐
algorithmic, that is, not reducible to a formula, but is rather driven by human
intellectual creativity in response to a research question.
In principle any one of us, whatever our background, could suddenly articulate an
utterly novel and brilliant hypothesis that, say, unifies quantum mechanics and
Einsteinian relativity, but this kind of inspiration is highly unlikely and must be
exceedingly rare.
In practice, hypothesis generation is a matter of (i) becoming familiar with the domain
of interest by observation of it, (ii) reading the associated research literature, (ii)
formulating a research question which, if convincingly answered,
will enhance
scientific understanding, (iv) abstracting data from the domain and drawing
inferences from it, and (v) on the basis of these inferences formulating a
hypothesis that interestingly answers the research question.

Hypothesis generation
Until now, this latter approach to hypothesis generation has served the linguistics
community well, but the appearance and rapid proliferation of digital electronic
text since the second half of the twentieth century is undermining its usefulness
for two main reasons.

Hypothesis generation
1. Traditionally, hypothesis generation based on linguistic corpora has involved the
researcher listening to or reading through a corpus, often repeatedly, noting
features of interest, and then formulating a hypothesis.
The advent of information technology in general and of digital representation of text
in particular in the past few decades has made this often‐onerous process much
easier via a range of computational tools, but, as the amount of
digitally‐
represented language available to linguists has grown, a new problem has
emerged: text overload.
Actual and potential language corpora are growing ever‐larger, and even now they are
often on the limit of what the individual researcher can work through efficiently in
the traditional way.
Moreover, as we shall see, data abstracted from such large corpora can be so complex
as to be impenetrable to understanding.

Hypothesis generation
2. Though linguistics in all its subdisciplines has studied a wide range of world
languages, any survey of the literature will show that the main focus has been on
western European languages and on English in particular.
Because these latter languages have been well studied, and because most of the
world's linguists have until recently been and probably still are native speakers of
them, interesting hypotheses about these languages are relatively easy to
formulate, being supported on the one hand by an extensive literature and on the
other by native speaker intuition.
The advent of information technology is, however, also generating large amounts of
digital text in world languages that have been less well studied, and electronic
corpora of dialectal and historical language varieties as well as of endangered
languages are now appearing.
In the absence of extensive research literatures and native speaker intuitions, how
easy is it to formulate interesting hypotheses about these?

Hypothesis generation
One approach is to stick with what one knows, that is, to deal only with corpora of
tractable size in languages whose characteristics are well known.
But ignoring evidence is not scientifically respectable.
The other is to exploit the rich new source of data about the world's present and past
languages and dialects that electronic speech and text offer, and to formulate
hypotheses based on that data.
The question is: how?
Hypothesis generation
The answer is to look at what is done in other sciences.
Information technology has generated not just huge volumes of text but also vast
amounts of digital data of all kinds across a wide range of science and engineering
disciplines, and, because these disciplines have historically been quantitatively‐
oriented, they have developed mathematically and statistically based
computational technologies for data interpretation.
The general solution to the problem of how to deal with large and diverse digital
electronic corpora in linguistics is to adapt these technologies
to analysis of data
derived from them.

Methods for hypothesis generation
The remainder of the discussion shows how mathematical methods well established
in other sciences can be applied to hypothesis generation in quantitative
linguistics.
It is in three sections:
• the first section describes the corpus on the basis of which the
concepts and
techniques introduced in what follows are exemplified
• the second discusses data creation
• the third presents the methods themselves.

Methods for hypothesis generation: example corpusApplication of the concepts and techniques described in
what follows is exemplified with reference to the
Newcastle Electronic Corpus of Tyneside English,
henceforth referred to as NECTE, a corpus of dialect
speech from Tyneside in North‐East England.
It is based on two pre‐existing corpora of audio‐recorded
speech, one of them gathered in the late 1960s by
the Tyneside Linguistic Survey (TLS) and the other
between 1991 and 1994.
Its aim was to enhance the corpora by amalgamating
them into a single, TEI‐conformant electronic corpus.
The result is now available to the research community in
a variety of formats: digitized sound, phonetic
transcription, and standard orthographic
transcription, all aligned and accessible on the Web.
Methods for hypothesis generation: example corpus
The TLS component of NECTE included phonetic transcriptions of about 10 minutes of
each of 64 recordings, which its creators produced with the aim of determining
whether systematic phonetic variation among Tyneside speakers of
the period
could be significantly correlated with variation in their social
characteristics.
To this end they developed a methodology which was radical at the time and remains
so today:
• In contrast to the then‐universal and still‐dominant theory driven approach, where
social and linguistic factors are selected by the analyst on the
basis of some
combination of an independently‐specified theoretical framework, existing case
studies, and personal experience of the domain of enquiry,
• They proposed a fundamentally empirical approach in which salient factors are
extracted from the data itself and then serve as the basis for model construction.
Methods for hypothesis generation: example corpus
To realize this research aim using its empirical methodology, the audio interviews had
to be compared at the phonetic level of representation.
This required that the analog speech signal be discretized into phonetic segment
sequences, or, in other words, to be phonetically transcribed.
The resulting phonetic transcriptions are the basis for the examples in what follows.

Methods for hypothesis generation: data creation
Data' is the plural of 'datum', the past participle of Latin 'dare', 'to give', and means
'things that are given'.
A datum is therefore something to be accepted at face value, a true statement about
the world.
What is a true statement about the world?
That question has been debated in philosophical metaphysics since Antiquity and
probably before, and, in our own time, has been intensively studied by the
disciplines that comprise cognitive science.
The issues are complex, controversy abounds, and the associated academic literatures
are vast ‐‐saying what a true statement about the world might be is anything but
straightforward.
We can't go into all this, and so will adopt the attitude prevalent in most areas of
science: data are abstractions of what we observe using our senses, often with the
aid of instruments.
Methods for hypothesis generation: data creationData are ontologically different from the world.
The world is as it is; data are an interpretation of it for the purpose of scientific study.
The weather is not the meteorologist’s data –measurements of such things as air
temperature are.
A text corpus is not the linguist’s data –measurements of such things as lexical
frequency are.
Data are constructed from observation of things in the world, and the process of
construction raises a range of issues that determine the amenability of the data to
analysis and the interpretability of the analytical results.
Methods for hypothesis generation: data creation
The importance to cluster analysis of understanding such data issues can hardly be
overstated.
On the one hand, nothing can be discovered that is beyond the limits of the data
itself.
On the other, failure to understand and where necessary to emend
relevant
characteristics of data can lead to results and interpretations that are distorted or
even worthless.
For these reasons, a brief account of data creation is given before moving on to
discussion of interpretative methods.

Methods for hypothesis generation: data creation
Any aspect of the world can be described in an arbitrary numbers
of ways and to
arbitrary degrees of precision.
A desktop computer can, for example, be described in terms of its physical
appearance, its hardware components, the functionality of the software installed
on it, the programs which implement that functionality, the design of the chips on
the circuit board, or the atomic and subatomic characteristics of the transistors on
the chips.
Which description is best? That depends on why one wants the description.
A software developer wants a clear definition of the required functionality but doesn't
care about the details of chip design; the chip designer doesn't
care about the
physical appearance of the machines in which her devices are installed but a
marketing manager does; and so on.
In general, how one describes a thing depends on what one wants to know about it,
or, in other words, on the question one has asked.

Methods for hypothesis generation: data creationIn a scientific context, the question one has asked is the research question component
of the hypothetico‐deductive model outlined in the Introduction.
Given a domain of interest, how is a good research question formulated?
That, of course, in the central question in science. Asking the right questions is what
leads to scientific breakthroughs and makes reputations, and, beyond a thorough
knowledge of the research area and possession of a creative intelligence, there is
no known guaranteed route to the right questions.
What is clear, though, is that a well‐defined question is the key precondition to the
conduct of research, and more particularly to the creation of the data that will
support hypothesis formulation.
The research question provides an interpretative orientation; without such an
orientation, how does one know what to observe in the domain, what is
important, and what is not?
Methods for hypothesis generation: data creation
In the present case we will be interested in sociophonetics with
specific reference to
NECTE, and the research question is the one stated in the Introduction:
Is there systematic phonetic variation among speakers in the Tyneside speech
community as represented by NECTE, and, if so, does that variation correlate
interestingly with social factors?

Methods for hypothesis generation: data creation
Variable selection
Given that data are an interpretation of some domain of interest, what does such an
interpretation look like?
It is a description of objects in the domain in terms of variables.
A variable is a symbol, that is, a physical entity to which a meaning is assigned by
humans; the physical shape A in the English spelling system means the phoneme
/a/ because all users of the system agree that it does.
The variables chosen to describe a domain are crucial because each one represents an
aspect of the domain considered to be relevant in answering the research
question, and the set of variables constitutes the template in terms of which the
domain is interpreted.
Selection of variables appropriate to the research question is, therefore, crucial in
scientific research.

Methods for hypothesis generation: data creation
Variable selection
Which variables are appropriate in any given case?
The fundamental principle is that the selected variables must represent all and only
those aspects of the domain which are relevant to the research question.
In general, this is an unattainable ideal.
Any domain can be described by an essentially arbitrary number of finite sets of
variables; selection of one particular set can only be done on the basis of personal
knowledge of the domain and of the body of scientific theory associated with it,
tempered by personal discretion.
In other words, there is no algorithm for choosing an optimally relevant set of
variables.

Methods for hypothesis generation: data creationVariable selection
The research question defined on NECTE implies phonetic transcription of the audio
interviews: a set of variables is defined each of which represents a characteristic
of the speech signal taken to be phonetically significant, and these are then used
to interpret the continuous signal as a sequence of discrete symbols.
The TLS researchers felt that the standard IPA symbology was too
restrictive in the
sense that it did not capture phonetic features which they considered to be of
interest, and so they invented their own transcription scheme.
The remainder of this discussion refers to data abstracted from these TLS
transcriptions, as already noted, but it has to be understood that the 158 variables
in that scheme are not necessarily optimal or even adequate relative to our
research question.
They only constitute one view of what is important in the phonetics of Tyneside
speech. In fact, as we shall see, many of them have no particular relevance to the
research question.
Methods for hypothesis generation: data creation
Variable value assignment
Once variables have been selected, a value is assigned to each of them for each of the
objects of interest in the domain.
This value assignment is what makes the link between the researcher's
conceptualization of the domain in terms of the variables s/he has chosen and the
actual state of the world, and allows the resulting data to be taken as a valid
representation of the domain.
The objects of interest in NECTE are the 64 speakers, each of whom is described by
the values for each of the 158 phonetic variables.
What kind of value should be assigned? We shall use quantitative
values which
represent the number of times the speaker uses each of the phonetic segments.

Methods for hypothesis generation: data creation
Data representation
Having decided on a set of variables and on how the domain they are intended to
describe should be measured, the next step is to represent the data in a format
that can be computationally analyzed.
The standard way of doing this is by means of vectors and matrices.
A vector for present purposes is a list of indexed values:
Methods for hypothesis generation: data creation
Data representation
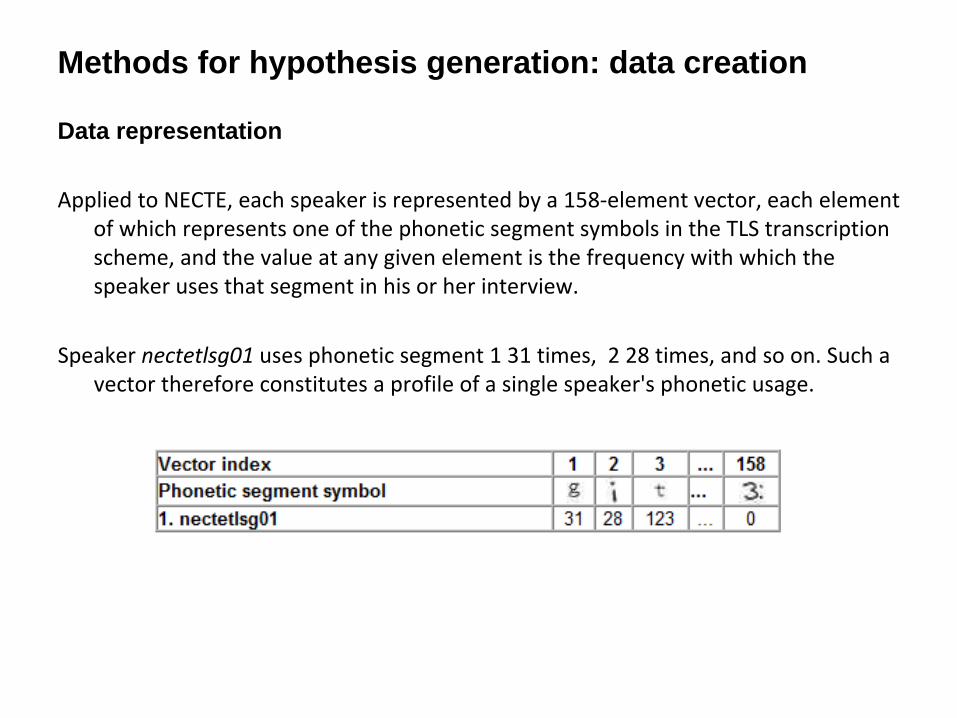
Applied to NECTE, each speaker is represented by a 158‐element vector, each element
of which represents one of the phonetic segment symbols in the TLS transcription
scheme, and the value at any given element is the frequency with
which the
speaker uses that segment in his or her interview.
Speaker nectetlsg01
uses phonetic segment 1 31 times,
2 28 times, and so on. Such a
vector therefore constitutes a profile of a single speaker's phonetic usage.

Methods for hypothesis generation: data creation
Data representation
The set of speaker vectors is assembled into a matrix M in which
the rows i (for i =
1..n, where n
is the number of speakers) represent the 64 speakers, the
columns j (for j = 1..158) represent the variables, and the value at Mi,j
is the
number of times speaker i uses the phonetic segment j.
A fragment of this 64 x 158 matrix M is shown below.

Methods for hypothesis generation: data creation
Data transformation
Once a data matrix has been constructed, it can be transformed in a variety of ways
prior to analysis.
In some cases such transformation is desirable in that it enhances the quality of the
data and thereby of the analysis.
In others the transformation is not only desirable but necessary
to mitigate or
eliminate characteristics in the matrix that would compromise the quality of the
analysis or even render it valueless.
One of these, length normalization, was applied to M so as to remove the effect of
variation in interview lengths on the observed frequencies.
Another, dimensionality reduction, is described and applied later in this discussion.

Methods for hypothesis generation: data analysis
This section analyzes the NECTE data matrix M using a combination of two
mathematical techniques, cluster analysis and principal component analysis, to
generate a hypothesis that answers the following research question about the
speakers in the NECTE corpus.
Is there systematic phonetic variation among speakers in the Tyneside speech
community as represented by NECTE, and, if so, does that variation correlate
interestingly with social factors?
The discussion is in three main parts:
i.
cluster analyzes M and draws some inferences about the Tyneside speech
community from the result.
ii.
shows how principal component analysis (PCA) can be used to improve the quality
of the data in M and generates a modified matrix MPCA
, which is again cluster
analyzed.
iii.
proposes a hypothesis based on the analysis in part (ii)

Methods for hypothesis generation: data analysis
Cluster analysis
Because each row of M is a complete description of the phonetic usage of a single speaker,
the obvious approach to finding systematic phonetic variation among the speakers is to
compare the 64 rows to one another.
Methods for hypothesis generation: data analysisCluster analysis
Given time to examine the fragment thoroughly, what hypothesis would one
formulate taking account of the 24 speakers and 12 variables shown?
What about the full 64 speakers and 158 variables?
These questions are clearly rhetorical, and there is a straightforward moral: human
cognitive makeup is unsuited to seeing regularities in anything but the smallest
collections of numerical data.
To see the regularities we need help, and that is what a mathematical technique
called cluster analysis provides.
Cluster analysis is a family of computational methods for identification and graphical
display of structure in data when the data is too large either in terms of the
number of variables or of the number of objects described, or both, for it to be
readily interpretable by direct inspection.

Methods for hypothesis generation: data analysisCluster analysis
To see how cluster analysis can be applied in the present case, the discussion
• first introduces the concept of vector space,
• then relates cluster analysis to it,
• and finally cluster analyses M.

Methods for hypothesis generation: data analysis
Cluster analysis: vector space
Geometry is based on human intuitions about the world around us:
that we exist in a
space, that there are directions in that space, that distances along those directions
can be measured, that relative distances between and among objects in the space
can be compared, that objects in the space themselves have size and shape which
can be measured and described.
The earliest geometries were attempts to define these intuitive notions of space,
direction, distance, size, and shape in terms of abstract principles which could, on
the one hand, be applied to scientific understanding of physical
reality, and on the
other to practical problems like construction and navigation.
Basing their ideas on the first attempts by the early Mesopotamians and Egyptians,
Greek philosophers from the seventh century BC onwards developed
such
abstract principles systematically, and their work culminated in
the geometrical
system attributed to Euclid.
This Euclidean geometry was the unquestioned framework for understanding of
physical reality until the 18th century CE, and remains a useful
interpretative
framework for physical reality to the present day.
Methods for hypothesis generation: data analysis
Cluster analysis: vector space
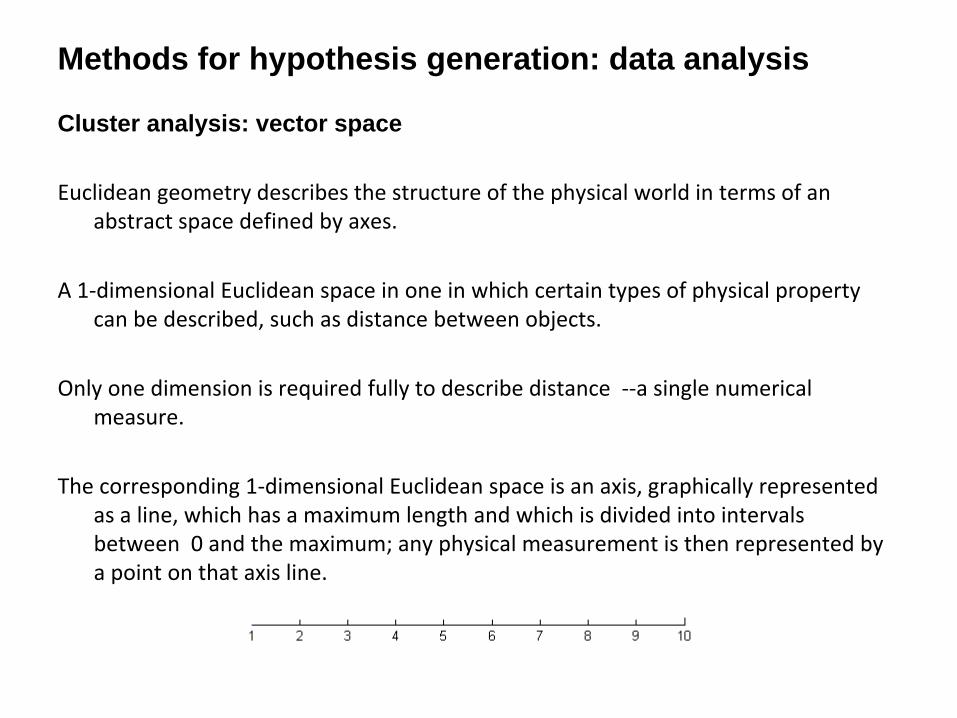
Euclidean geometry describes the structure of the physical world
in terms of an
abstract space defined by axes.
A 1‐dimensional Euclidean space in one in which certain types of physical property
can be described, such as distance between objects.
Only one dimension is required fully to describe distance ‐‐a single numerical
measure.
The corresponding 1‐dimensional Euclidean space is an axis, graphically represented
as a line, which has a maximum length and which is divided into intervals
between
0 and the maximum; any physical measurement is then represented
by
a point on that axis line.

Methods for hypothesis generation: data analysisCluster analysis: vector space
There are some kinds of physical property which cannot be described by only one
dimension, such as the area of, say, a farmer's field.
Two measurements are required, length and width, and these are represented in
Euclidean geometry as a 2‐dimensional space defined by two axes at right angles
to one another.
One axis represents length and the other width, each with appropriate maximum and
gradations; the axes are at right angles to represent the independence of the two
dimensions ‐‐a field can be as long as one likes, and that length has no implications
for its width.

Methods for hypothesis generation: data analysisCluster analysis: vector space
There are still other kinds of physical property which cannot be
described in two
dimensions but require 3, such as the volume of a box.
These are represented in Euclidean geometry as a 3‐dimensional space defined by
three axes all at right angles to one another for the reason just given in the 2‐
dimensional case.
Methods for hypothesis generation: data analysisCluster analysis: vector space
Euclid stopped at three dimensions, since he and Greek philosophers generally were
concerned with what they took to be abstractions of fundamental forms in the
natural world ‐‐lines, squares, triangles, circles, spheres, and so on, and three
dimensions were sufficient for this.
Modern geometry has, however, extended the notion of Euclidean space to arbitrary
dimensionalities ‐‐4, 5, 10, 20, 1000... .
The motivation for doing this is the insight that Euclidean space can be used far more
generally in description of the world than the Greeks originally
intended.

Methods for hypothesis generation: data analysisCluster analysis: vector spaceThe Greeks wanted to describe fundamental natural forms, as noted, but the is no
reason to restrict Euclidean space to that.
• IQ, for example, has nothing to do with fundamental forms, but it is 1‐dimensional
in that it requires only one measurement and can be represented in a 1‐
dimensional Euclidean space
• a social profile in terms of income and age again has nothing to
do with
fundamental forms, but it requires two measurements and can be represented in
a 2‐dimensional Euclidean space
• characteristics of plants in terms of height, petal length, and flowering duration
has nothing to do with fundamental forms but can be represented in 3‐
dimensional space.
• This continues indefinitely: the national economy can be represented by an
arbitrarily large number of dimensions ‐‐GDP, balance of payments, taxation
revenue, average income, interest rate, and so on to some number
n
of
dimensions, and this could be represented using an n‐dimensional Euclidean
space.

Methods for hypothesis generation: data analysisCluster analysis: vector space
The obvious objection is that it is impossible to think about spaces of dimension
higher than 3 or to represent them graphically, and thus that there is something
strangely wrong with n‐dimensional spaces
This objection is based on an ambiguity with respect to senses of the word 'space':
• the Greeks assumed a direct correspondence between physical and geometric
space and thus understood 'space' physically
• but that assumption has been abandoned in contemporary geometry except as a
special case, and 'space' is an abstract mathematical concept.
Methods for hypothesis generation: data analysisCluster analysis: vector space
Why all this talk about geometry? Because there is a fundamental
relationship
between geometrical space on the one hand, and the vectors and matrices which
are standardly used to represent data.
As we have seen, a vector is a sequence of n
numbers, and the sequence is
conventionally represented as comma‐separated numerals between square
brackets.
A vector has a Euclidean geometrical interpretation:
• the dimensionality of the vector, that is, the number of its components n, defines
an n‐dimensional vector space.
• the sequence of n
numbers comprising the vector specifies the coordinates of the
vector in the vector space.
• the vector itself is a point at the specified coordinates

Methods for hypothesis generation: data analysisCluster analysis: vector space
For example, the components of the 2‐dimensional vector v = [36 160] in the figure
below are its coordinates in a 2‐dimensional vector space , and the components of
the 3‐dimensional vector v = [36, 160, 30] are its coordinates in a 3‐dimensional
vector space
Methods for hypothesis generation: data analysisCluster analysis: vector space
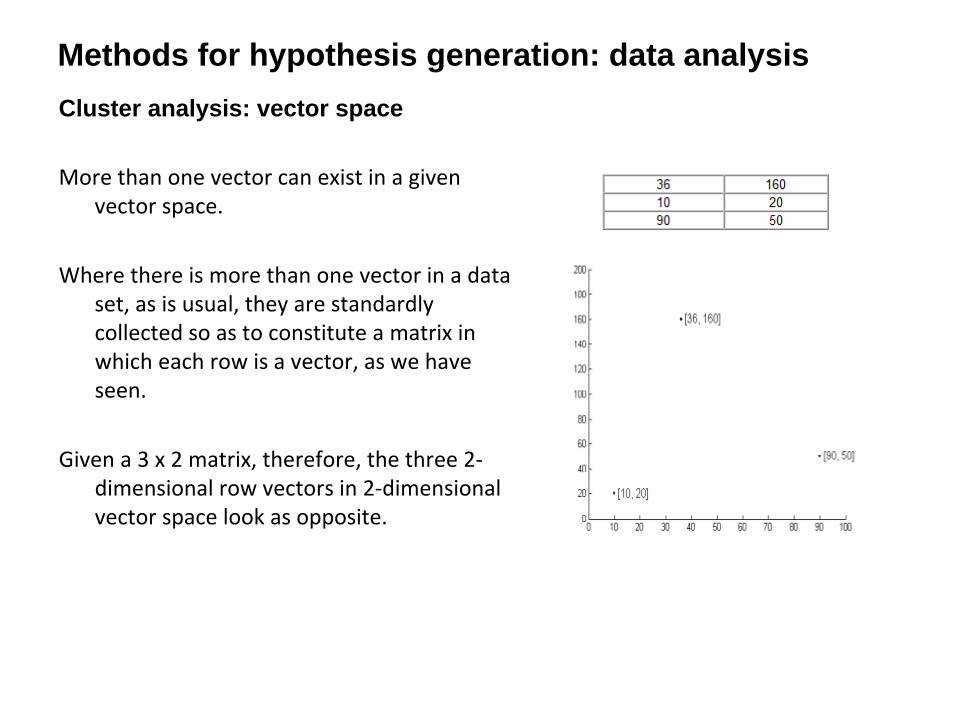
More than one vector can exist in a given
vector space.
Where there is more than one vector in a data
set, as is usual, they are standardly
collected so as to constitute a matrix in
which each row is a vector, as we have
seen.
Given a 3 x 2 matrix, therefore,
the three 2‐
dimensional row vectors in 2‐dimensional
vector space look as opposite.

Methods for hypothesis generation: data analysisCluster analysis: vector space
This principle applies to any number of vectors
and any dimensionality. Let's say we had a
1000 x 3 matrix.
Plotting the 1000 3‐dimensional vectors in 3‐
dimensional vector space will give some
shape; in this case it is a doughnut shape, or
torus.
That shape is a manifold. The idea extends
directly to any dimensionality, though such
general spaces cannot be shown graphically.
For the purposes of this discussion, therefore,
a manifold is a set of vectors in n‐dimensional
space.
Methods for hypothesis generation: data analysisVector space and cluster analysis
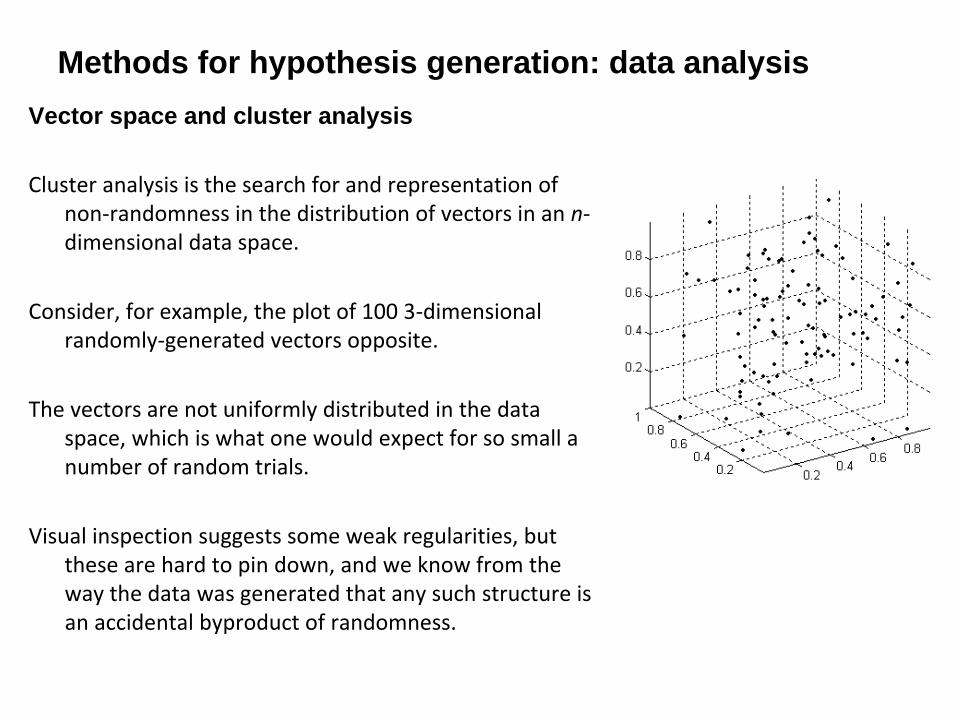
Cluster analysis is the search for and representation of
non‐randomness in the distribution of vectors in an n‐
dimensional data space.
Consider, for example, the plot of 100 3‐dimensional
randomly‐generated vectors opposite.
The vectors are not uniformly distributed in the data
space, which is what one would expect for so small a
number of random trials.
Visual inspection suggests some weak regularities, but
these are hard to pin down, and we know from the
way the data was generated that any such structure is
an accidental byproduct of randomness.

Methods for hypothesis generation: data analysisVector space and cluster analysis
Contrast the plot of a known, non‐random 3‐
dimensional data set.
Visual inspection makes it immediately apparent that
the distribution of points is non‐random: there are
three clearly defined groups of vectors such that
intra‐group distance is small relative to the
dimensions of the data space, and inter‐group
distance relatively large.
Cluster analysis is a collection of methods whose aim is
to detect such groups in data and to display them
graphically in an intuitively accessible way.

Methods for hypothesis generation: data analysisVector space and cluster analysis
If that's all there is cluster analysis, what need is there for the method about to be
presented? Why not simply plot the points in the data space?
The answer is that this works well for data dimensionalities up to 3, since they can be
visually represented.
For higher dimensionality, however, the straightforward diagrammatic approach
breaks down: how does one represent a 5‐dimensional space graphically, not to
speak of a 100‐dimensional or 1000‐dimensional one?
Cluster analysis addresses the problem of finding clusters in arbitrarily high‐
dimensional spaces and of representing these clusters in a dimensionality that can
be plotted and intuitively interpreted in a low dimensional, that is, two or three
dimensional space.

Methods for hypothesis generation: data analysisVector space and cluster analysis
There is an extensive range of cluster
analysis methods, but the one
presented here, hierarchical cluster
analysis, is both the most widely used
and the easiest to understand.
It represents the relative distances among
vectors in the data manifold as a
constituency tree.
The aim in the example opposite is to
discover whether there is any
interesting cluster structure in the 30
row vectors of the matrix.

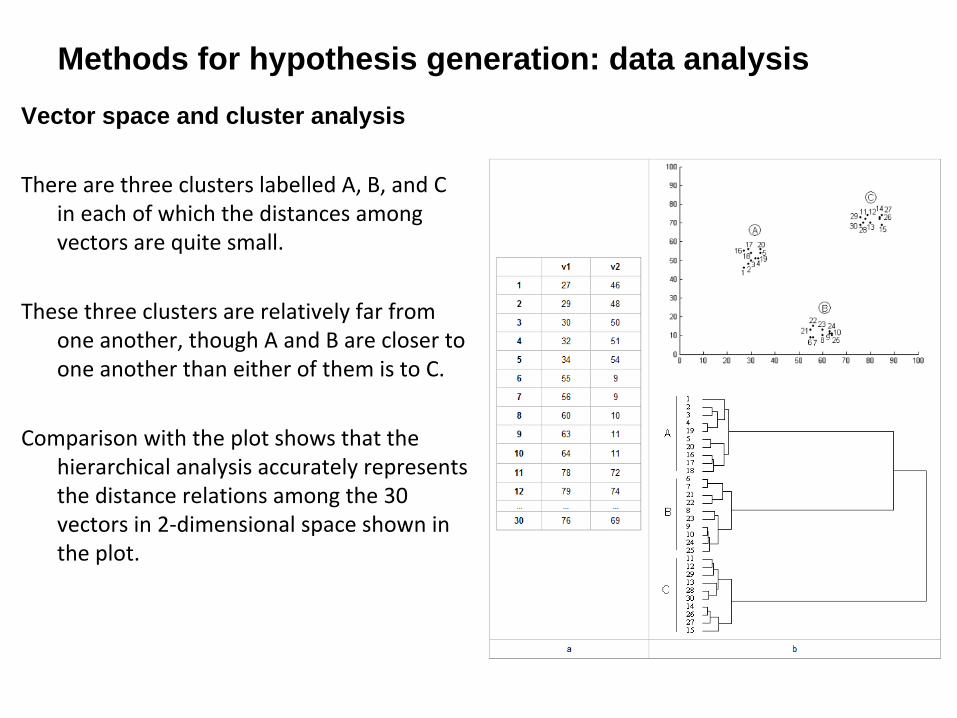
Methods for hypothesis generation: data analysisVector space and cluster analysis
Because the row vectors in (a) are two‐
dimensional they can be directly
plotted.
This is shown in the upper part of (b), and
there is a clear 3‐cluster structure, with
clusters labelled A, B and C.
The corresponding hierarchical cluster tree
is shown in the lower part of (b).
• The leaves are labels for the data items
corresponding to the numerical labels of
the row vectors in the data matrix. • The subtrees represent relativities of
distance between clusters. The lengths
of the branches linking the clusters
represent degrees of closeness: the
shorter the branch, the more similar the
clusters.
Methods for hypothesis generation: data analysisVector space and cluster analysis
There are three clusters labelled A, B, and C
in each of which the distances among
vectors are quite small.
These three clusters are relatively far from
one another, though A and B are closer to
one another than either of them is to C.
Comparison with the plot shows that the
hierarchical analysis accurately represents
the distance relations among the 30
vectors in 2‐dimensional space shown in
the plot.
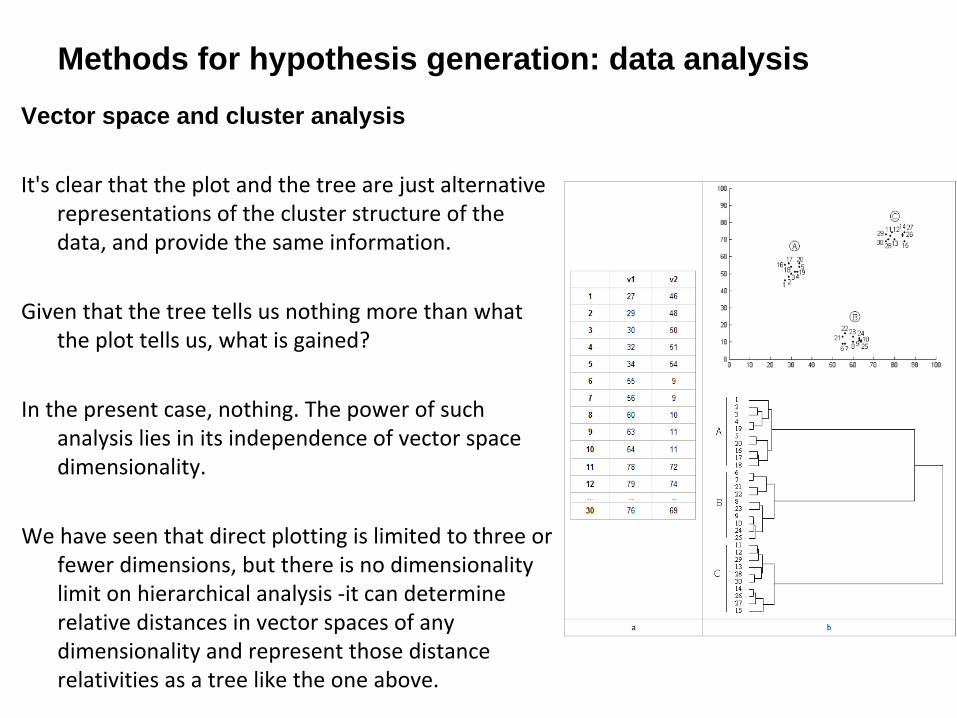
Methods for hypothesis generation: data analysisVector space and cluster analysis
It's clear that the plot and the tree are just alternative
representations of the cluster structure of the
data, and provide the same information.
Given that the tree tells us nothing more than what
the plot tells us, what is gained?
In the present case, nothing. The power of such
analysis lies in its independence of vector space
dimensionality.
We have seen that direct plotting is limited to three or
fewer dimensions, but there is no dimensionality
limit on hierarchical analysis ‐it can determine
relative distances in vector spaces of any
dimensionality and represent those distance
relativities as a tree like the one above.

Methods for hypothesis generation: data analysisCluster analysis of the NECTE data matrix M
Hierarchical cluster analysis was applied to M, and the
result is shown opposite.
There is a clear differentiation into clusters, so the first
part of the research question is answered: there is
systematic phonetic variation among speakers in the
Tyneside speech community as represented by the
NECTE speakers.
Methods for hypothesis generation: data analysis
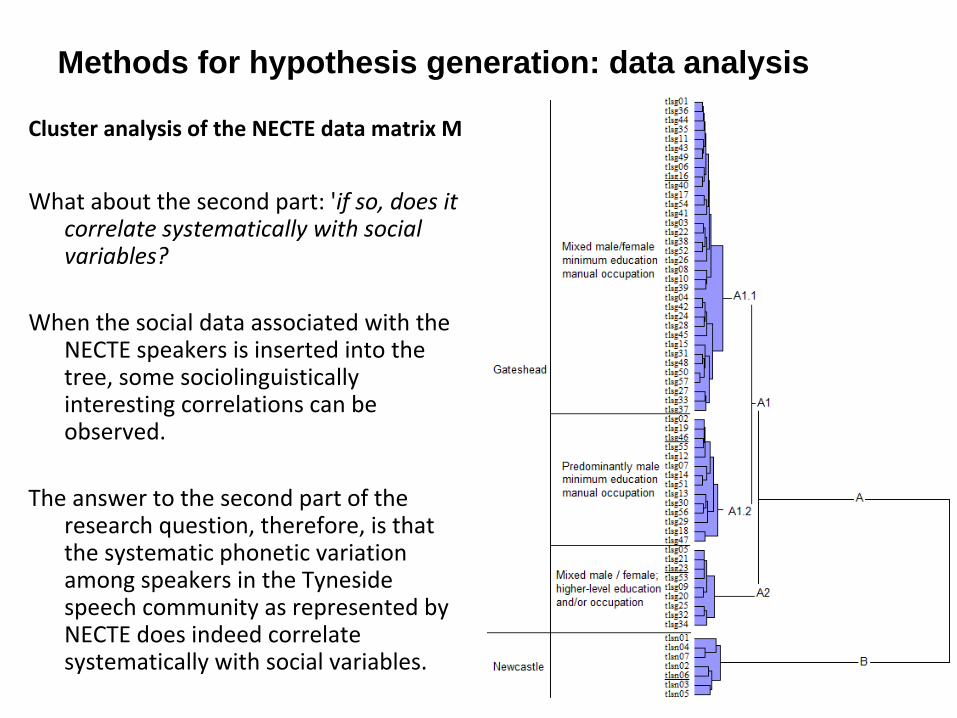
Cluster analysis of the NECTE data matrix M
What about the second part: 'if so, does it
correlate systematically with social
variables?
When the social data associated with the
NECTE speakers is inserted into the
tree, some sociolinguistically
interesting correlations can be
observed.
The answer to the second part of the
research question, therefore, is that
the systematic phonetic variation
among speakers in the Tyneside
speech community as represented by
NECTE does indeed correlate
systematically with social variables.

Methods for hypothesis generation: data analysisPrincipal component analysis of M
Cluster analytical results can be refined by applying principal component analysis to
the raw data matrix prior to clustering.
The refinement is based on reduction of data sparsity and consequent improved
definition of the data manifold, which in turn yields more reliable cluster analytical
results.
This section
explains what is meant by data sparsity, why it is a problem, and how to
mitigate the problem using principal component analysis.

Methods for hypothesis generation: data analysis
Principal component analysis: data sparsity
Assume a research domain in which the objects of interest are described by three
variables, and a vector space representation of the data abstracted from the domain.
If only two objects are selected there are only two 3‐dimensional vectors in the space,
and the only reasonable manifold to propose is a straight line, as in (a).
These vectors might belong to a more complex manifold, but with only two data points
there is no justification for positing such a manifold.
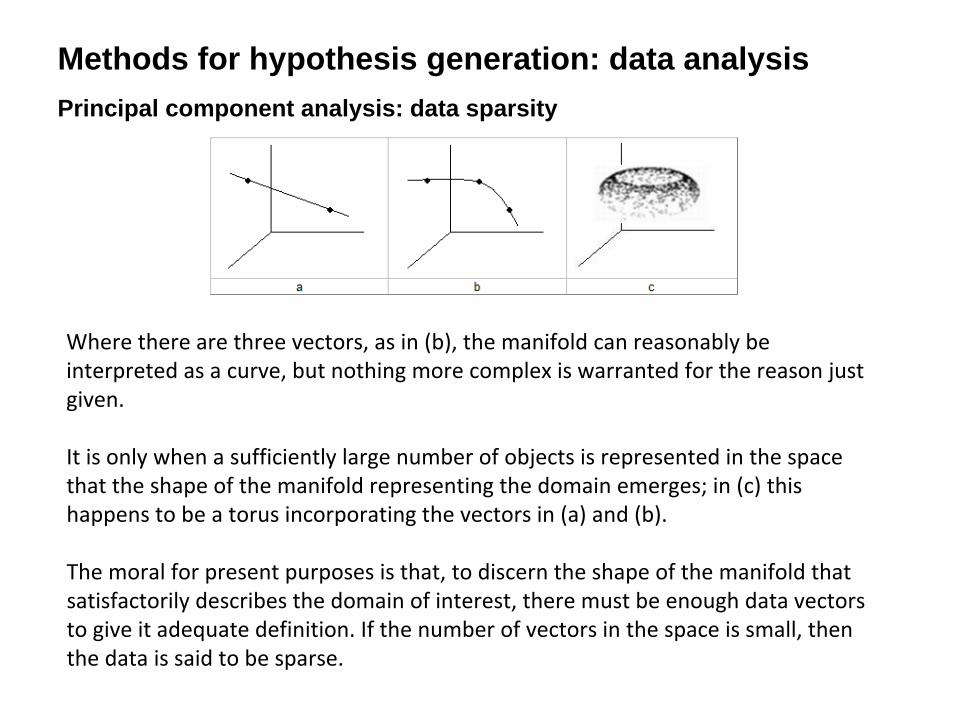
Methods for hypothesis generation: data analysisPrincipal component analysis: data sparsity
Where there are three vectors, as in (b), the manifold can reasonably be
interpreted as a curve, but nothing more complex is warranted for the reason just
given.
It is only when a sufficiently large number of objects is represented in the space
that the shape of the manifold representing the domain emerges; in (c) this
happens to be a torus incorporating the vectors in (a) and (b).
The moral for present purposes is that, to discern the shape of the manifold that
satisfactorily describes the domain of interest, there must be enough data vectors
to give it adequate definition. If the number of vectors in the space is small, then
the data is said to be sparse.
Methods for hypothesis generation: data analysis
Principal component analysis: why sparsity is a problem
Getting enough data vectors is usually difficult and often intractable as dimensionality
grows.
The problem is that the space in which the manifold is embedded
grows very quickly
with dimensionality
To retain a reasonable manifold definition, more and more data is required until,
equally quickly, getting enough becomes impracticable.

Methods for hypothesis generation: data analysisPrincipal component analysis: why sparsity is a
problem
What does it mean to say that 'the space in which the manifold
is embedded grows very quickly with dimensionality'?
Assume a two‐dimensional space with horizontal and vertical
axes in the range 0..9, and data vectors which can take
integer, that is, whole‐number values only, such as [1, 9],
[7, 4], [3, 5] and so on.
Since there are 10 x 10 = 100 such whole‐number locations,
there can be a maximum of 100 vectors in this space, as
shown in the figure opposite

Methods for hypothesis generation: data analysisPrincipal component analysis: why sparsity is a
problem
For a three‐dimensional space with all three axes in the
same range 0..9 the number of possible vectors like
[0,9,2] and [3,4,7] in the space is 10 x 10 x 10 =
1000.

Methods for hypothesis generation: data analysis
Principal component analysis: why sparsity is a problem
For a four‐dimensional space the maximum number of vectors is 10 x 10 x 10 x 10 =
10000, and so on.
In general, assuming integer data, the number of possible vectors is rd, where r
is the
measurement range (here 0..9 = 10) and d
the dimensionality.
The rd
function generates an extremely rapid increase in data space size with
dimensionality: even a modest d = 8 for a 0..9 range allows for 108
= 100,000,000
vectors.

Methods for hypothesis generation: data analysis
Principal component analysis: why sparsity is a problem
Why is this rapid growth of data space size with dimensionality a problem?
Because, the larger the dimensionality, the more difficult it becomes to define the
manifold sufficiently well to achieve reliable analytical results.
Assume that we want to analyse, say, 24 speakers in terms of their usage frequency of
2 phonetic segments in the range of 0..9. The ratio of actual to
possible vectors in
the space is 24/100 = 0.24, that is, the vectors occupy 24% of the data space.
If one analyses the 24 speakers in terms of 3 phonetic segments,
the ratio of actual to
possible vectors is 24/1000 = 0.024 or 2.4 % of the data space.
In the 8‐dimensional case it is 24/100000000, or 0.00000024 %.

Methods for hypothesis generation: data analysis
Principal component analysis: why sparsity is a problem
A fixed number of vectors occupies proportionately less and less
of the data space
with increasing dimensionality.
In other words, the data space becomes so sparsely inhabited by vectors that the
shape of the manifold is increasingly poorly defined.
What about using more data? Let’s say that 24% occupancy of the data space is
judged to be adequate for manifold resolution.
To achieve that for the 3‐dimensional case one would need 240 vectors, 2400 for the
4‐dimensional case, and 24,000,000 for the 8‐dimensional one. This may or may
not be possible.
And what are the prospects for dimensionalities higher than 8?
Methods for hypothesis generation: data analysisPrincipal component analysis: dimensionality reduction
The solution is to reduce data dimensionality using principal component analysis
(PCA), as follows.
We have seen that the selection of data variables in any given application is not
guaranteed to be optimal, and that some variables may be more useful in
describing the domain of interest than others.
In a clustering context, where the aim is to group objects in terms of their relative
degrees of difference, a variable is useful in proportion to the
variability in the
values it takes: a variable like 'income', whose values across a
random sample of a
population can be expected to vary substantially, is a far better differentiator of
people than, say 'number of limbs'.
A precise quantification of such variability is given by a variable's variance.

Methods for hypothesis generation: data analysis
Principal component analysis: dimensionality reduction
The global variance of a data matrix is the sum of the variances
of all the variable
columns.
Dimensionality reduction using PCA is based on the idea that all
or at least most of the
global variance of data with n
variables can be expressed by a smaller number k
<
n
of newly‐defined variables.
These k
new variables are found using the shape of the manifold in the original n‐
dimensional space.

Methods for hypothesis generation: data analysisPrincipal component analysis: dimensionality reduction
The horizontal and vertical axes in (a) represent two variables v1 and v2, the objects
described by these variables are represented as vectors in the two‐dimensional
space, and the set of vectors constitutes a manifold.
The main direction of variability in the manifold can be visually identified; the line of
best fit drawn through the manifold in that direction, as in (b), is the first new
variable w1: it captures most of the variance in the manifold, and its length is the
amount of variance that it captures.
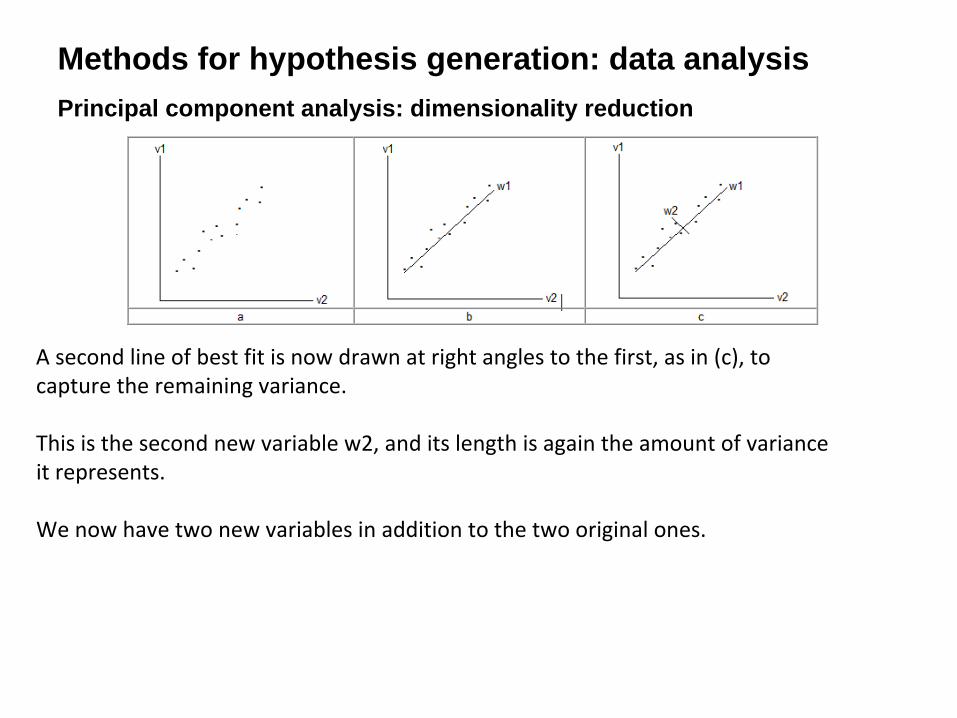
Methods for hypothesis generation: data analysisPrincipal component analysis: dimensionality reduction
A second line of best fit is now drawn at right angles to the first, as in (c), to
capture the remaining variance.
This is the second new variable w2, and its length is again the amount of variance
it represents.
We now have two new variables in addition to the two original ones.
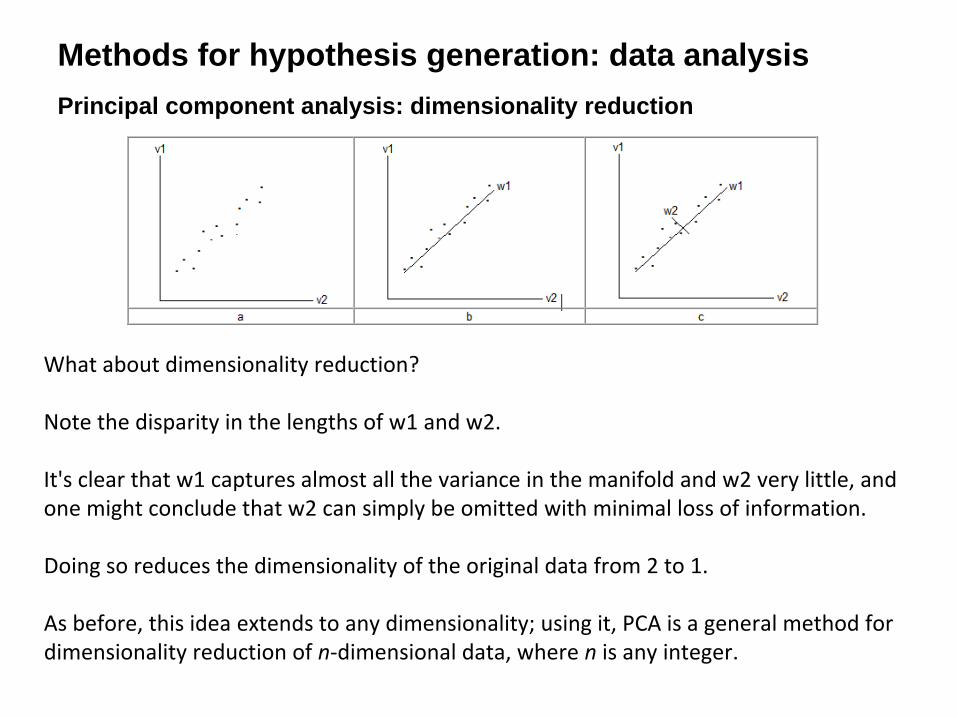
Methods for hypothesis generation: data analysisPrincipal component analysis: dimensionality reduction
What about dimensionality reduction?
Note the disparity in the lengths of w1 and w2.
It's clear that w1 captures almost all the variance in the manifold and w2 very little, and
one might conclude that w2 can simply be omitted with minimal loss of information.
Doing so reduces the dimensionality of the original data from 2 to 1.
As before, this idea extends to any dimensionality; using it, PCA is a general method for
dimensionality reduction of n‐dimensional data, where n
is any integer.

Methods for hypothesis generation: data analysisPrincipal component analysis: dimensionality reduction
PCA was applied to the 158‐dimensional data matrix M and, as above, it generated
158 new variables such that the first new variable captured the greatest direction
of variability in the data manifold, and second new variable the
second‐greatest
direction of variability, and so on.
The amount of variance captured by each is shown below, sorted in descending order
of magnitude and plotted.

Methods for hypothesis generation: data analysisPrincipal component analysis: dimensionality reduction
Note that most of the variance in the original 158‐dimensional data is captured by the
first 25 or so of the new variables generated by PCA, and that the remaining
variables contribute little or nothing.
In other words, dimensionality can be reduced from 158 to 25 with little loss of
information, yielding a new matrix MPCA25
.

Methods for hypothesis generation: data analysisPrincipal component analysis: re-
clustering
MPCA25
was cluster analyzed and the result
compared to the analysis based on the
full‐dimensional data presented earlier
to see what, if any, the effect of
reduction had been.
The comparison is shown opposite.
The trees are similar but not identical:
• B and A2 are the same
• There’s quite a bit of movement in A1.1
• Most importantly, three speakers have
moved clusters from A1.2 to A1.2
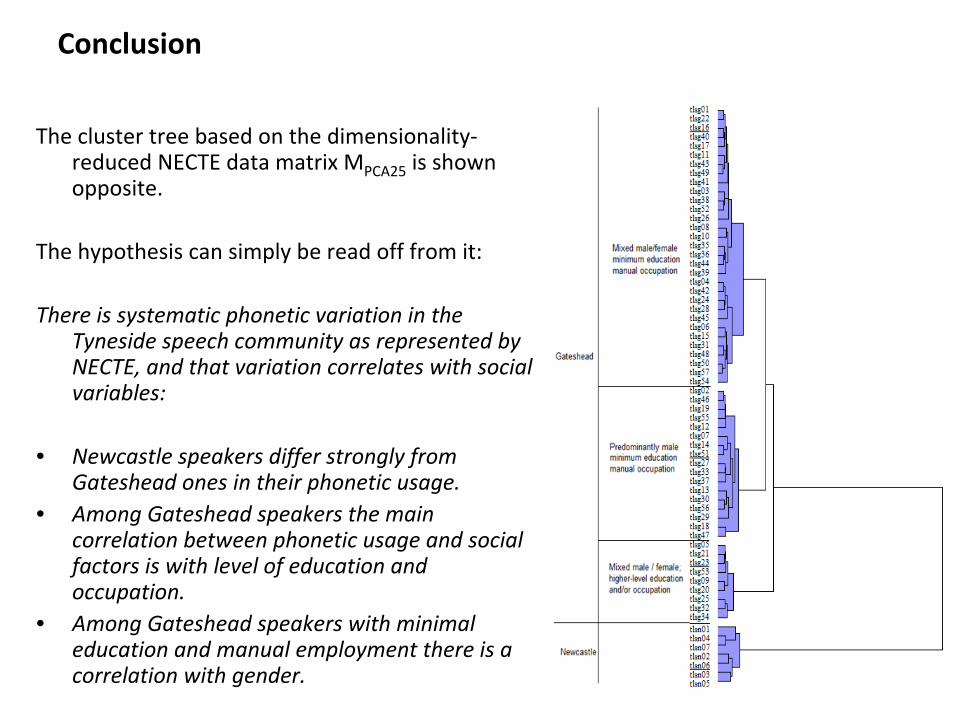
Conclusion
The cluster tree based on the dimensionality‐
reduced NECTE data matrix MPCA25
is shown
opposite.
The hypothesis can simply be read off from it:
There is systematic phonetic variation in the
Tyneside speech community as represented by
NECTE, and that variation correlates with social
variables:
• Newcastle speakers differ strongly from
Gateshead ones in their phonetic usage.• Among Gateshead speakers the main
correlation between phonetic usage and social
factors is with level of education and
occupation.• Among Gateshead speakers with minimal
education and manual employment there is a
correlation with gender.

Conclusion
The approach to hypothesis generation just described can usefully be applied in any
research where the number of objects and variables is so large that the data
cannot easily be interpreted by direct inspection.
The foregoing discussion has sketched an application to sociolinguistic analysis; a few
other random possibilities are, briefly:
• A historical linguist might want to infer phonetic or phonological structure in a
legacy corpus on the basis of spelling by cluster analyzing alphabetic n‐grams for
different magnitudes 2, 3, 4... of n.
• A generative linguist might want to infer syntactic structures in a little‐known or
endangered language by clustering lexical n‐grams for different magnitudes of n.
• A philologist might want to use cluster analysis of alphabetic n‐grams to see if a
collection of historical or literary texts can be classified chronologically of
geographically on the basis of their spelling.
Related Documents