US Army Corps of Engineers BUILDING STRONG ® Mid-West Electric Consumers Association September 16, 2014 Corps of Engineers US Army ssouri River Mainstem System 14-2015 Draft Annual Operating Plan Mike Swenson, P.E. Power Production Team Lead Missouri River Basin Water Management

Corps of Engineers
Jan 02, 2016
Missouri River Mainstem System 2014-2015 Draft Annual Operating Plan. US Army. Corps of Engineers. Mike Swenson, P.E. Power Production Team Lead Missouri River Basin Water Management. Graphics courtesy of National Drought Mitigation Center. June Precipitation – Percent of Normal. - PowerPoint PPT Presentation
Welcome message from author
This document is posted to help you gain knowledge. Please leave a comment to let me know what you think about it! Share it to your friends and learn new things together.
Transcript

US Army Corps of Engineers
BUILDING STRONG®
Mid-West Electric Consumers AssociationSeptember 16, 2014
Corps of EngineersUS Army
Missouri River Mainstem System2014-2015 Draft Annual Operating Plan
Mike Swenson, P.E.Power Production Team LeadMissouri River Basin Water Management
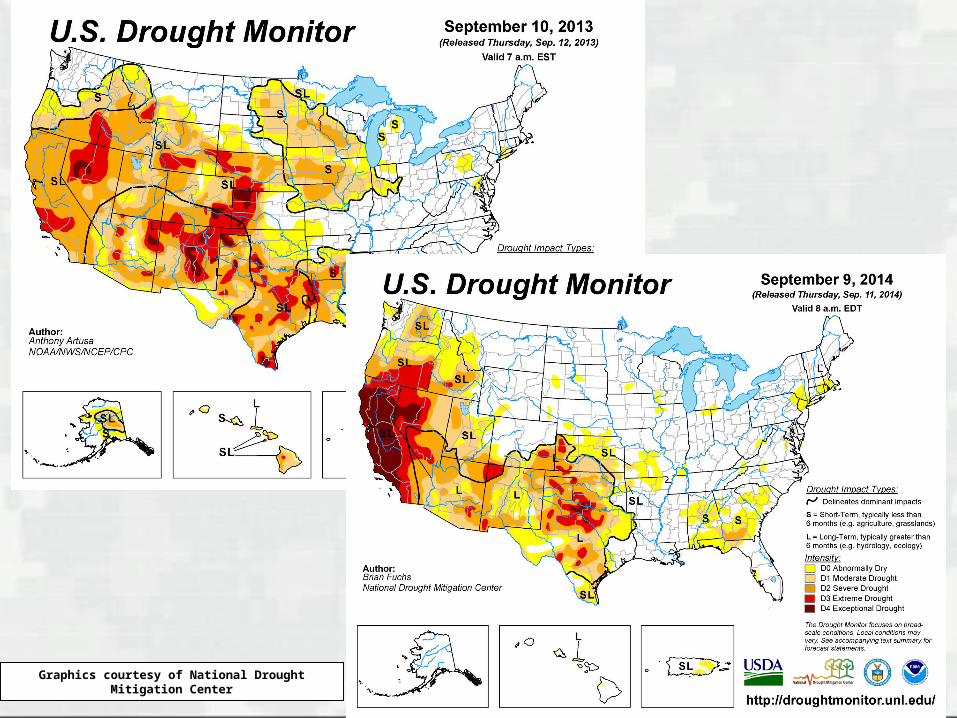
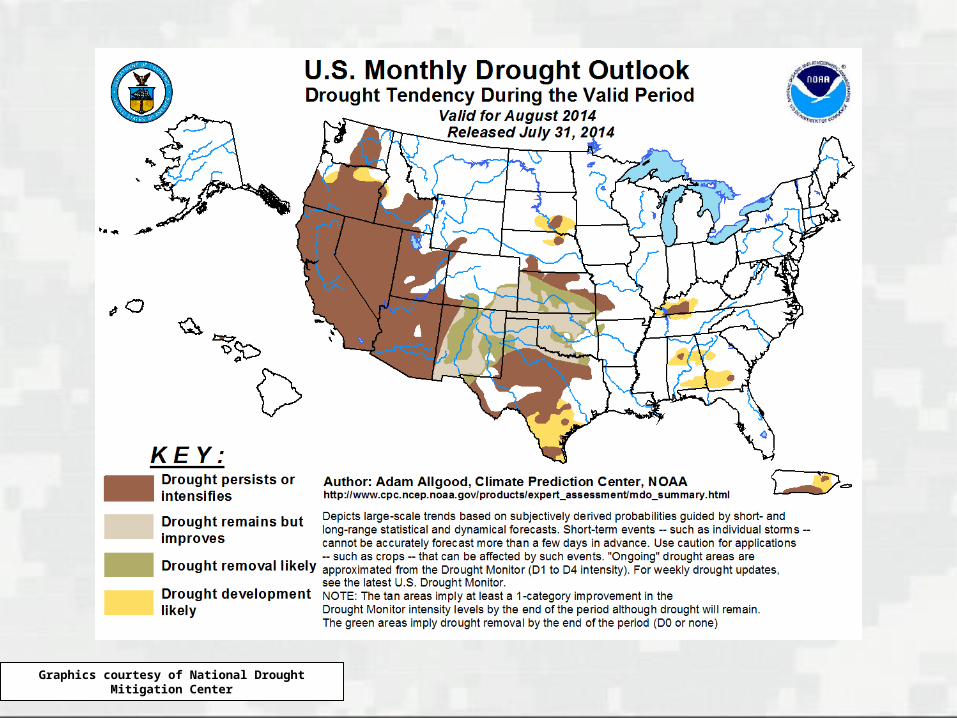
Graphics courtesy of National Drought Mitigation Center
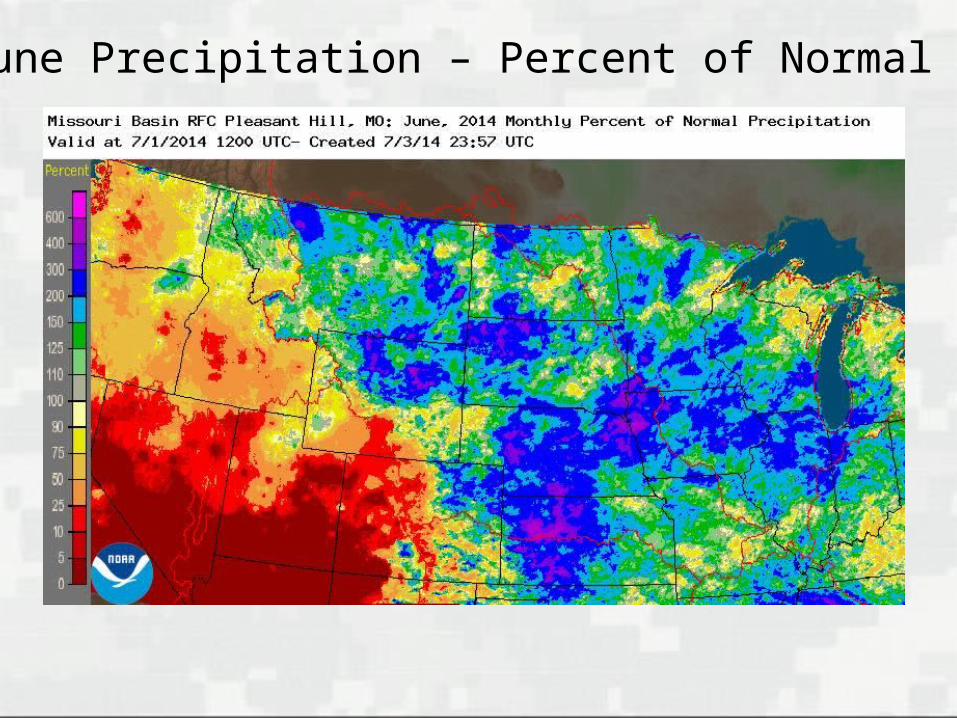
June Precipitation – Percent of Normal
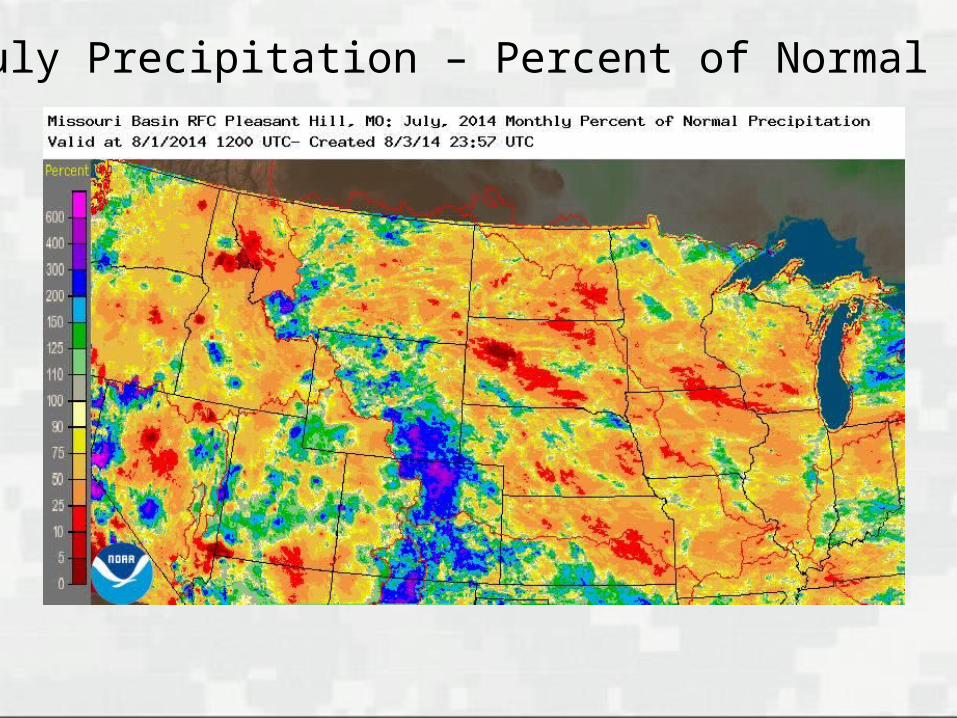
July Precipitation – Percent of Normal
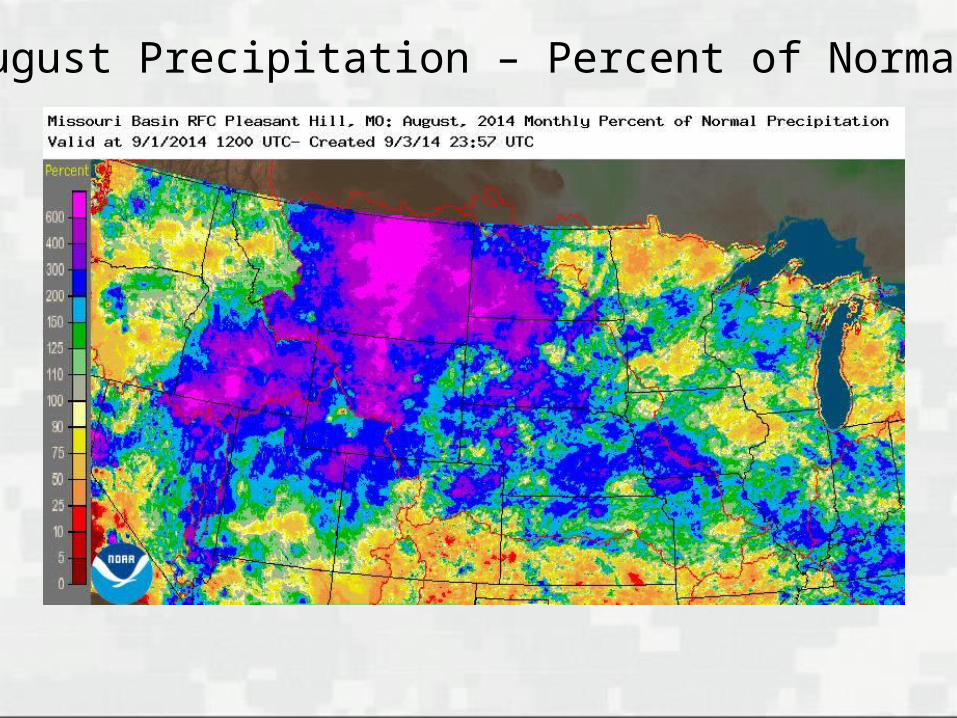
August Precipitation – Percent of Normal
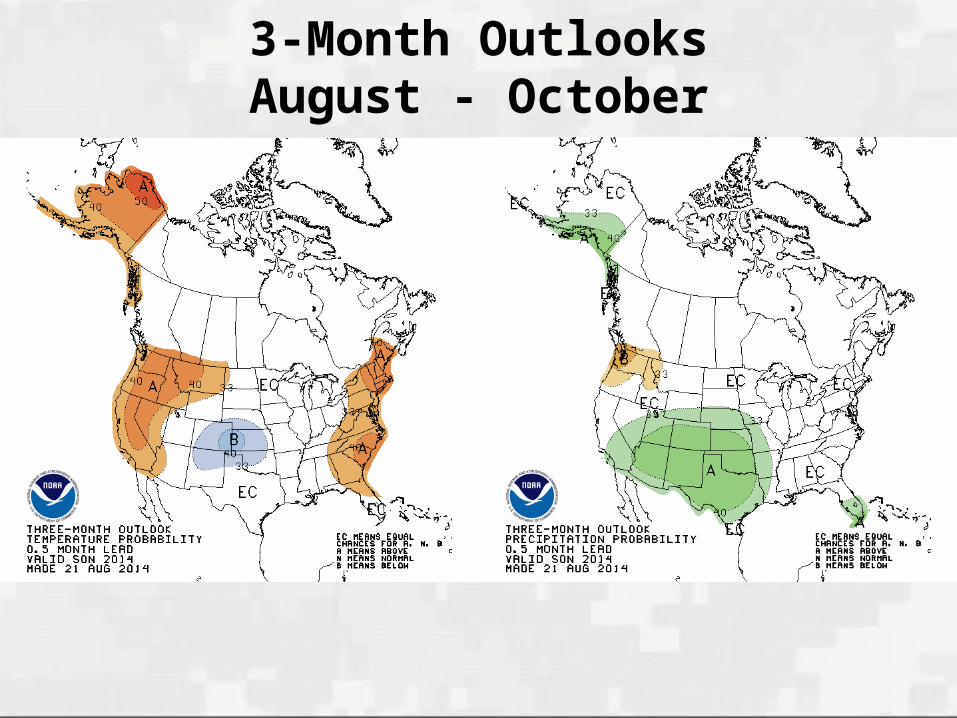
3-Month OutlooksAugust - October
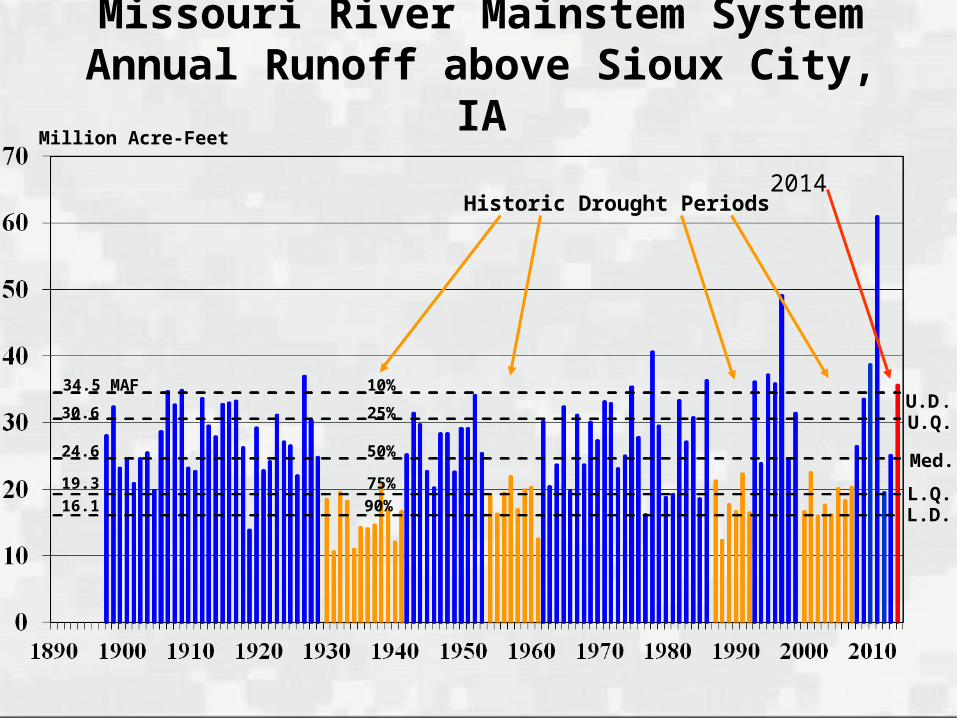
Missouri River Mainstem SystemAnnual Runoff above Sioux City, IA
Million Acre-Feet
U.D.
L.D.L.Q.
U.Q.
Med.
10%
90%
75%
25%
50%
34.5 MAF
16.1
19.3
30.6
24.6
Historic Drought Periods2014
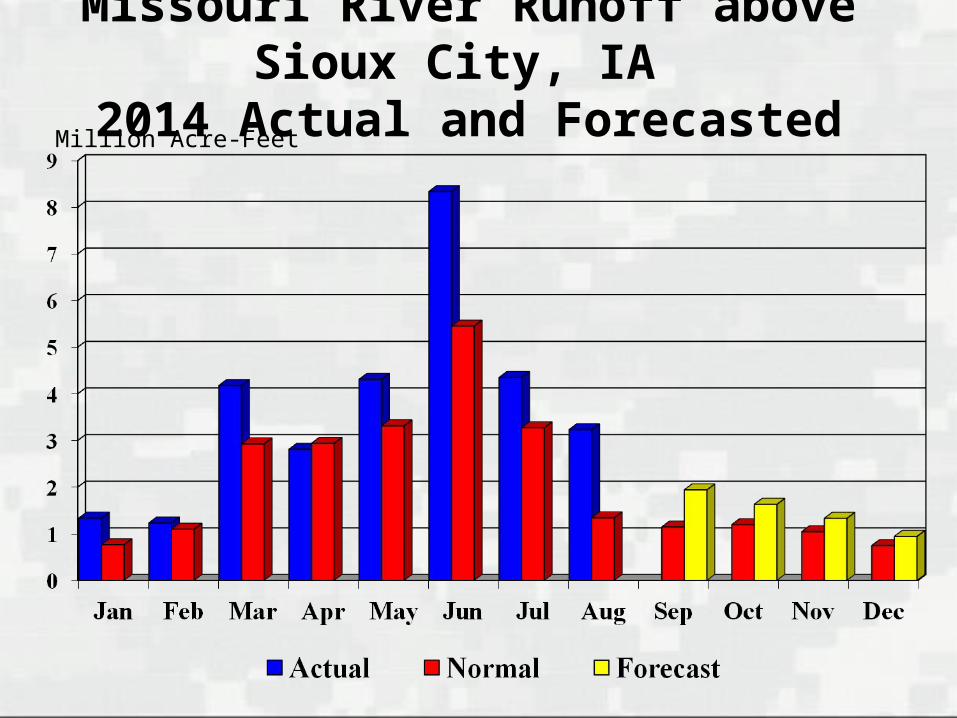
Missouri River Runoff above Sioux City, IA 2014 Actual and Forecasted
Million Acre-Feet
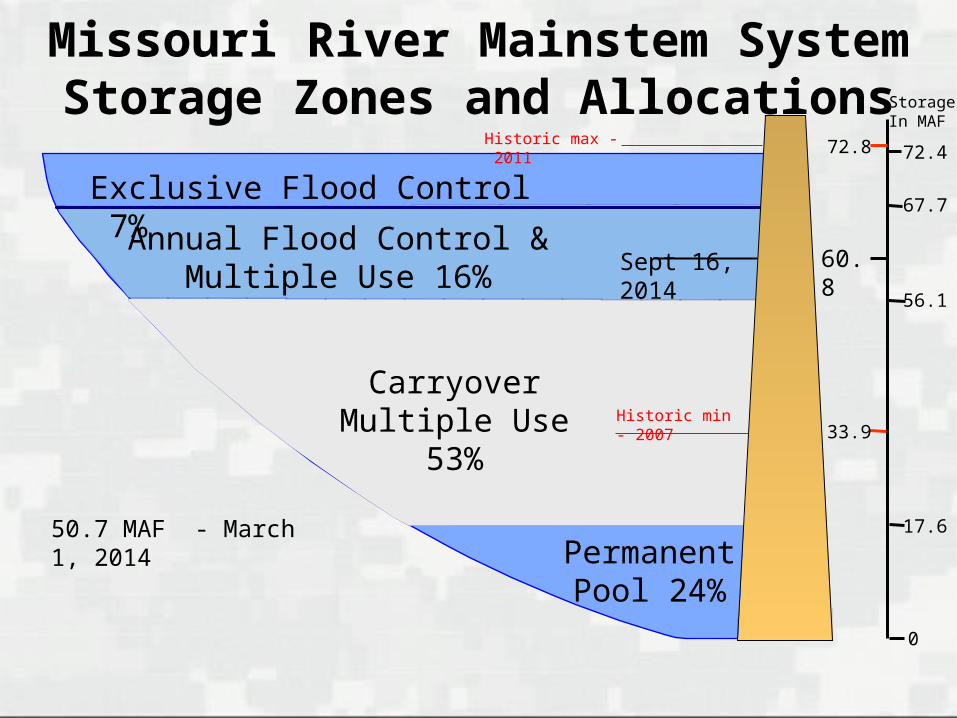
Missouri River Mainstem SystemStorage Zones and Allocations
Exclusive Flood Control 7%
Carryover Multiple Use
53%
Permanent Pool 24%
0
17.6
56.1
72.4
67.7
72.8
StorageIn MAF
33.9
Annual Flood Control & Multiple Use 16% Sept 16, 2014
Historic max - 2011
Historic min - 2007
60.8
50.7 MAF - March 1, 2014
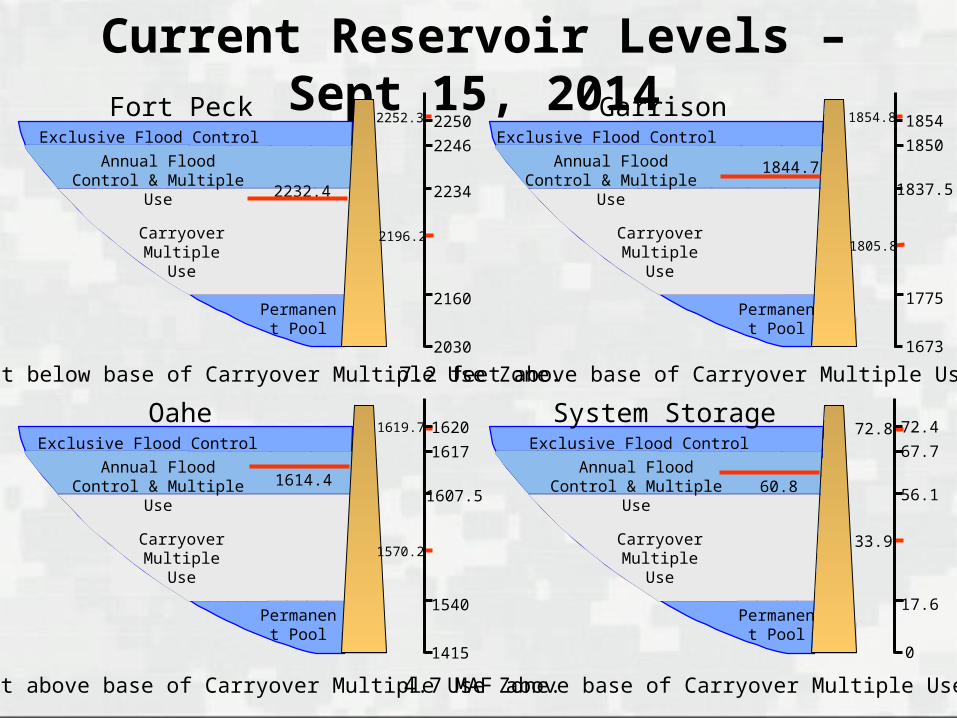
Current Reservoir Levels – Sept 15, 2014
2220.1
Exclusive Flood Control
Annual Flood Control & Multiple Use
Carryover Multiple Use
Permanent Pool
22502252.3
2220.1
Exclusive Flood Control
Annual Flood Control & Multiple Use
Carryover Multiple Use
Permanent Pool
2220.1
Exclusive Flood Control
Annual Flood Control & Multiple Use
Carryover Multiple Use
Permanent Pool
2220.1
Exclusive Flood Control
Annual Flood Control & Multiple Use
Carryover Multiple Use
Permanent Pool
2246
2234
2160
2030
1854
1850
1837.5
1775
1673
1854.8
1620
1617
1607.5
1540
1415
72.4
67.7
56.1
17.6
0
Fort Peck
Oahe
Garrison
System Storage
2232.4
1805.8
1570.233.9
1619.7 72.8
2196.2
1844.7
1614.4 60.8
1.6 feet below base of Carryover Multiple Use Zone. 7.2 feet above base of Carryover Multiple Use Zone.
6.9 feet above base of Carryover Multiple Use Zone. 4.7 MAF above base of Carryover Multiple Use Zone.
BUILDING STRONG®
2014 Reservoir Operations Flood Control
► System storage peaked on September 1 at 61.3 MAF, utilizing 32 percent of the system’s flood control storage
► Gavins Point releases reduced in mid-June in response to record flooding on the Big Sioux River. Release reduction lowered peak stages 3 to 4 feet in most areas
► Releases increased at lower four projects in September to evacuate stored water
Navigation ► Started season at intermediate service► Increased to full service flow support after July 1 storage check► 10-Day extension to the navigation season
Hydropower► Annual generation forecast is 9.9 BkWh; long term average is 9.4 BkWh
Recreation, Water Supply and Irrigation► Normal to above reservoir levels and releases► Gavins Point winter release will be 20,000 cfs
Fish and Wildlife / Endangered Species► All three upper reservoirs rose this year during the forage fish spawn► Spring pulses from Gavins Point dam were not conducted this year
BUILDING STRONG®
Planned Operation for 2015 Draft Annual Operating Plan developed using 1 September
starting conditions► Based on 5 statistical runoff scenarios► Will begin runoff year at the base of the Annual Flood Control
Zone► No spring pulse in 2015
Letter to Tribes will offer consultation Draft AOP released in September 2014 Public meetings scheduled for October 27-29, 2014
► Fort Peck, Bismarck, Pierre, Smithville and Council Bluffs
Final Annual Operating Plan in December 2014
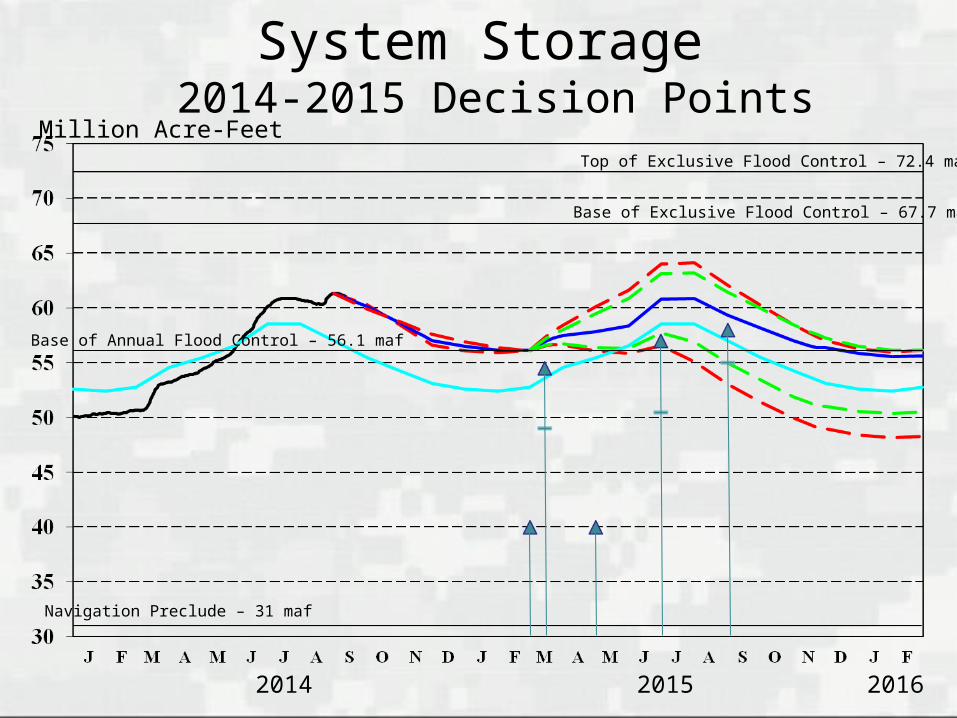
System Storage 2014-2015 Decision Points
Top of Exclusive Flood Control – 72.4 maf
Base of Exclusive Flood Control – 67.7 maf
Million Acre-Feet
Base of Annual Flood Control – 56.1 maf
2014 2015 2016
Navigation Preclude – 31 maf
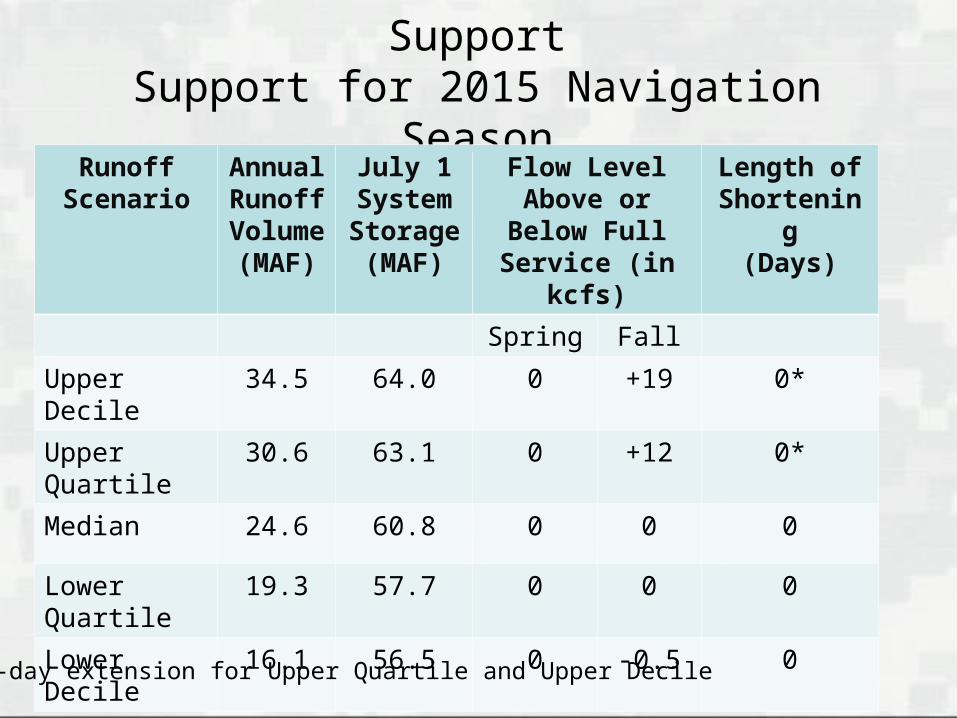
Missouri River Downstream Flow SupportSupport for 2015 Navigation Season
Runoff Scenario
Annual Runoff Volume(MAF)
July 1 System Storage (MAF)
Flow Level Above or Below Full
Service (in kcfs)
Length of Shortening
(Days)
Spring Fall
Upper Decile 34.5 64.0 0 +19 0*
Upper Quartile 30.6 63.1 0 +12 0*
Median 24.6 60.8 0 0 0
Lower Quartile 19.3 57.7 0 0 0
Lower Decile 16.1 56.5 0 -0.5 0
* 10-day extension for Upper Quartile and Upper Decile
BUILDING STRONG®
Draft 2014-2015 Annual Operating Plan (AOP)Median Runoff Condition
Flood Control►Begin 2015 runoff season at the base of the annual flood
control zone
Navigation ► Full service flow support to start season► Full service flow support for Lower Quartile and above
runoff following July 1 storage check► Full length navigation season
Hydropower – Annual Generation = 9.7 BkWh in 2015
BUILDING STRONG®
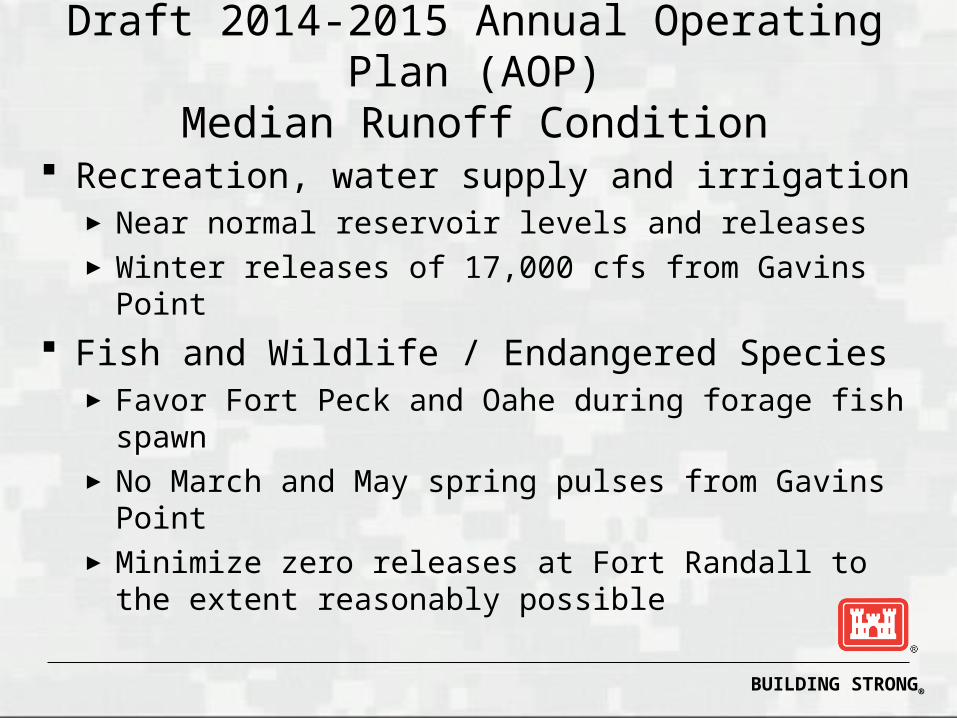
Draft 2014-2015 Annual Operating Plan (AOP)Median Runoff Condition
Recreation, water supply and irrigation►Near normal reservoir levels and releases►Winter releases of 17,000 cfs from Gavins Point
Fish and Wildlife / Endangered Species► Favor Fort Peck and Oahe during forage fish spawn►No March and May spring pulses from Gavins Point►Minimize zero releases at Fort Randall to the extent
reasonably possible
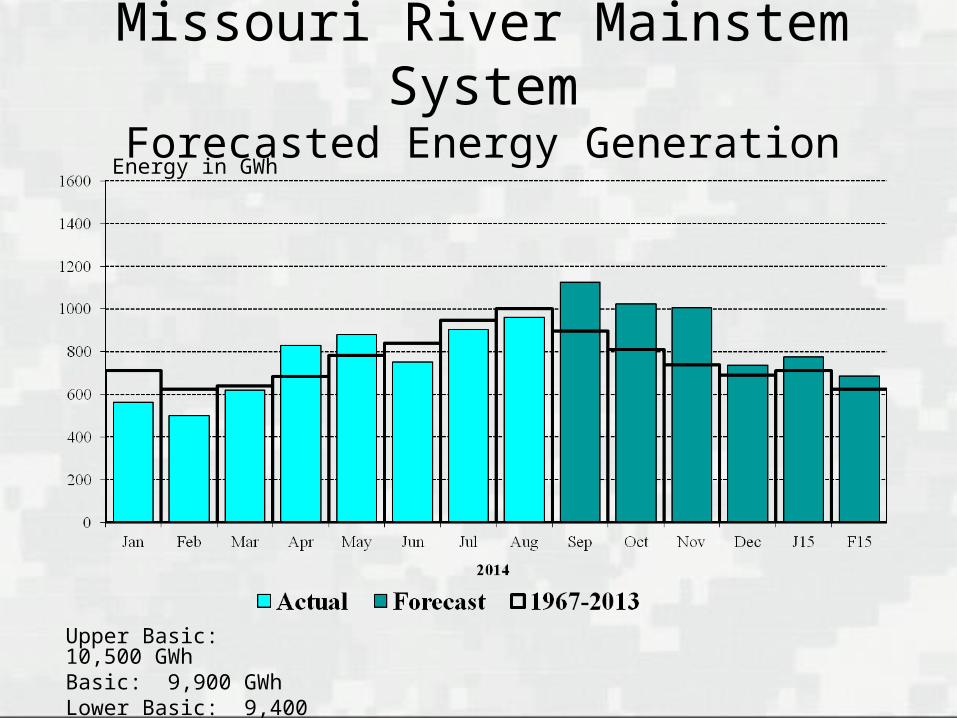
Missouri River Mainstem SystemForecasted Energy Generation
Upper Basic: 10,500 GWhBasic: 9,900 GWhLower Basic: 9,400 GWh
Energy in GWh
BUILDING STRONG®
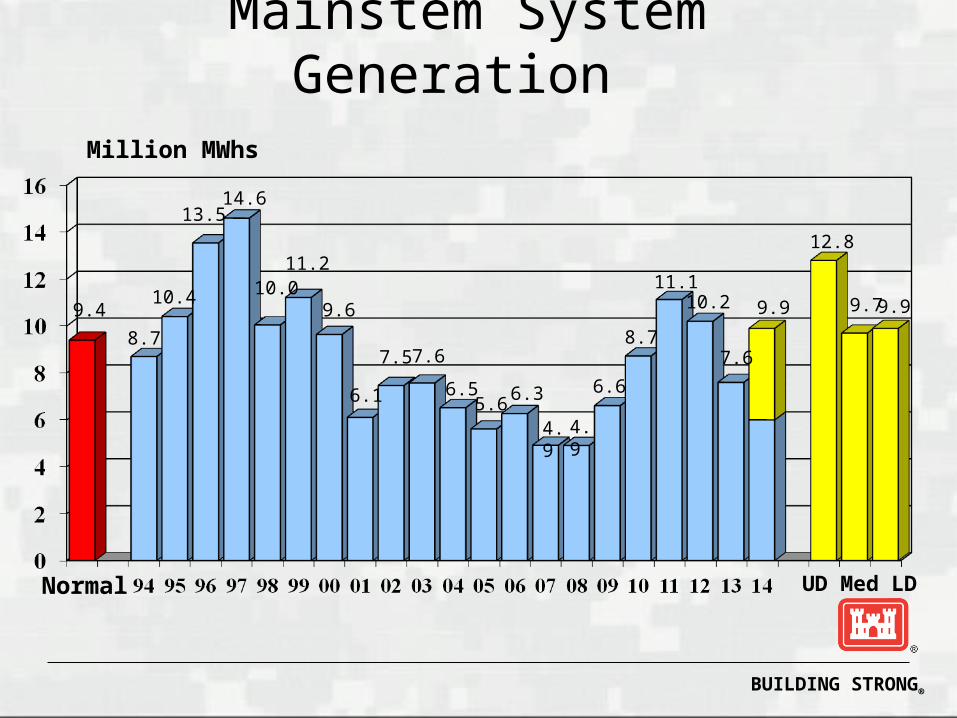
Mainstem System Generation
Million MWhs
Normal UD Med LD
9.410.4
7.68.7
11.2
14.6
10.09.6
6.1
7.5 7.6
6.55.6
6.3
4.9
6.6
9.7
12.8
9.911.1
13.5
4.9
8.7
10.2 9.9

BUILDING STRONG®
BUILDING STRONG®
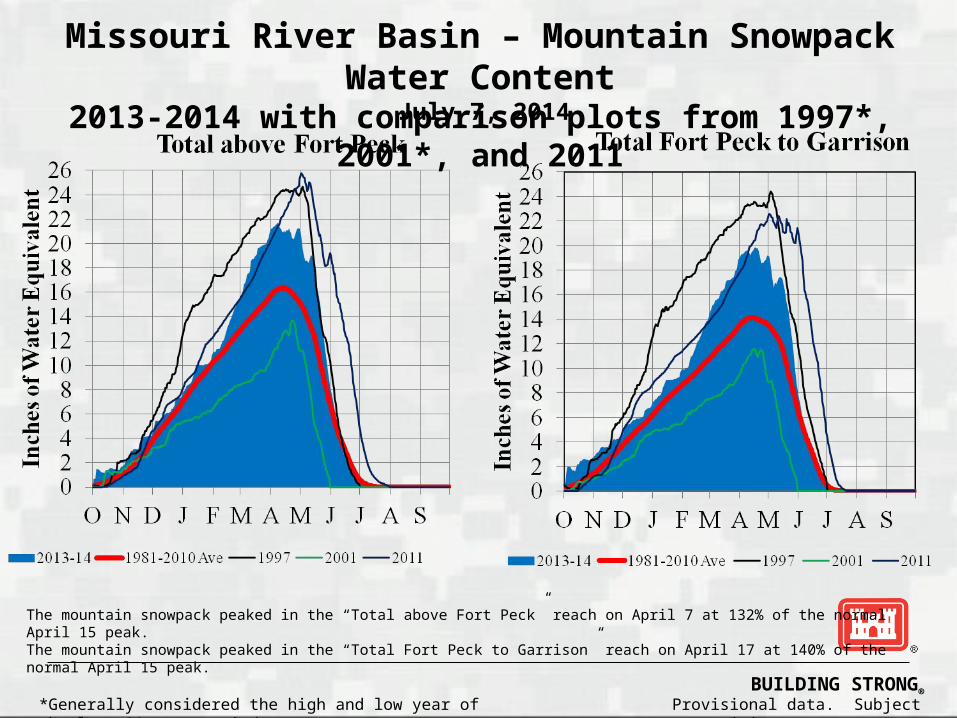
Missouri River Basin – Mountain Snowpack Water Content2013-2014 with comparison plots from 1997*, 2001*, and 2011
The mountain snowpack peaked in the “Total above Fort Peck” reach on April 7 at 132% of the normal April 15 peak.The mountain snowpack peaked in the “Total Fort Peck to Garrison” reach on April 17 at 140% of the normal April 15 peak.
*Generally considered the high and low year of the last 20-year period. Provisional data. Subject to revision.
July 7, 2014
BUILDING STRONG®
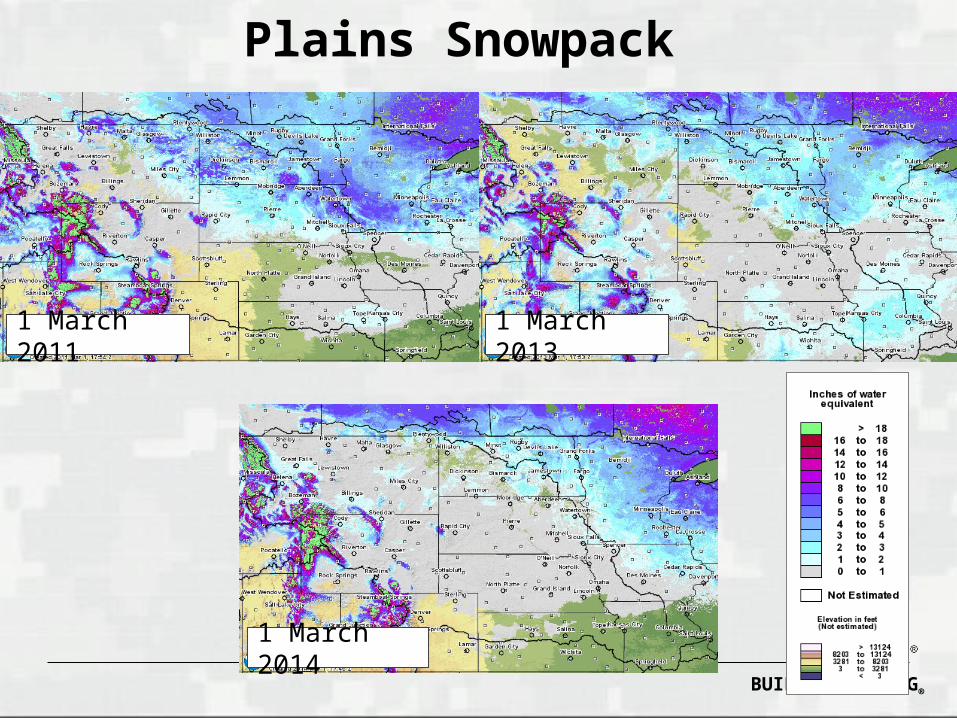
Plains Snowpack
1 March 2014
1 March 20131 March 2011
Graphics courtesy of National Drought Mitigation Center

BUILDING STRONG®
Related Documents