2010 ENMAX Corporation 2010 financial report.

Welcome message from author
This document is posted to help you gain knowledge. Please leave a comment to let me know what you think about it! Share it to your friends and learn new things together.
Transcript
2010EN
MA
X C
orpo
rati
on
2010 financial report.

Contents
SECTION PAGE
Message to stakeholders 1
Financial governance 5
Caution regarding forward-looking information 7
Supplementary financial information 8
Financial summary 12
Management’s discussion and analysis 14
Overview of the business environment 14
Overall financial performance 19
Business segment results 22
Selected quarterly financial data 27
Non-GAAP financial measures 28
Financial condition 30
Liquidity and capital resources 30
Future accounting changes 33
Critical accounting estimates 36
Risk management and uncertainties 38
Financial instruments 47
Transactions with related parties 48
Controls and procedures 49
Outlook 49
Consolidated financial statements 50
Management’s report 50
Independent auditor’s report 51
Consolidated balance sheets 52
Consolidated statements of income and comprehensive income 53
Consolidated statements of shareholder’s equity 54
Consolidated statements of cash flows 55
Notes to consolidated financial statements 56
Glossary of terms 92
Corporate information IBC

With solid performance in 2010, ENMAX Corporation and its subsidiaries (ENMAX or the Corporation) continue to follow a strategy of procuring and producing electricity and providing value-added energy products directly to its retail customers while adapting to a low price market and the challenges of a recessionary economy. We entered 2011 with an opportunity to illustrate the benefit of our vision and strategic investments and an ability to continue to create value for our Shareholder.
Key highlights of 2010 include:
1 The opening of the Downtown District Energy Centre (DDEC). This facility has a capacity to supply heat for up to 10 million sq. ft. of new and existing residential and commercial buildings;
2 The unveiling of an electric vehicle pilot project to Calgarians, announcing ENMAX’s plans to prepare the city for future transitioning to electric powered personal transportation;
3 The Climate Change and Emissions Management Corporation’s (CCEMC) announcement of plans to partially fund ENMAX’s developmental program to install solar panels and wind turbines in homes across Alberta;
4 Divestiture of certain British Columbia assets to continue the Corporation’s increased focus on the core Alberta marketplace;
5 Conditional approval by the Alberta Utilities Commission (AUC) and approval by the Minister of Energy to allow ENMAX to commence construction of the 800 megawatt (MW) Shepard Energy Centre (Shepard) in East Calgary; and
6 The fifth anniversary of the innovative EasyMax® retail program. Since its launch in 2005, thousands of customers across Alberta have joined the program.
Chief Financial Officer’s message to stakeholders
Message to stakeholders. pg1 ENMAX Corporation 2010

Message to stakeholders. pg2 ENMAX Corporation 2010
In 2010, ENMAX continued to see growth in its customer base with a 5% increase in electricity volume sold. As prices remained fairly consistent with 2009, this increase in volumes resulted in an overall improvement in electricity revenues. At the same time, ENMAX experienced improvements in most other operating earnings streams. An expanded hedging strategy for foreign exchange exposures and financial instruments implemented in 2009 mitigated the risks and impacts of these exposures in 2010. As a result, the $57.0 million of 2009 gains related to these items did not recur in 2010. Excluding these items and a $21.7 million regulatory rate increase received in 2009 related to prior periods, ENMAX's 2010 operating margin improved 7% over 2009 levels due primarily to higher electricity sales and distribution volumes, a peak in settled pool prices in the second quarter and higher tariff and transmission rates set by the AUC.
With an expectation of continued soft commodity prices, ENMAX implemented stringent cost control measures to be able to continue to provide stable returns to its Shareholder. As a result, operating, maintenance and administrations costs (OM&A) were 4% lower than 2009 in spite of the effect of inflation on costs.
Overall, ENMAX’s financial results for 2010 outperformed expectations, with net earnings being 17% above target. Given these strong results, ENMAX was able to provide $346.9 million in funds generated by operations and invest $341.6 million in capital projects.
2011 and future opportunities. We will continue to execute on our strategy, strengthen our competitive position, grow gas-based generation and enhance customer service offerings all while maintaining one of the most reliable electrical systems in Canada. At the same time, expectations for reasonably soft electricity prices and a competitive retail market provide for challenges in 2011.

Message to stakeholders. pg3 ENMAX Corporation 2010
We are expecting growth in electricity and natural gas volumes sold due primarily to customer site acquisitions. This increase in volume may be more than offset by lower weighted average selling prices, resulting in declining operating margins. With this decline and an expected increase in OM&A costs in order to maintain operating facilities, standardized earnings before interest, income tax, deprecia-tion and amortization (EBITDA) may decline in 2011.
Capital expenditures are expected to grow in the regulated transmission and distribution segment, while development of new generating facilities is expected in the non-regulated segment.
Financial prudence. ENMAX continues to maintain a strong financial position and a reasonably conservative balance sheet with sustainable cash flows and ample liquidity. Our record of prudent financial policies is reflected in investment grade credit ratings and a stable outlook.
As the custodian of The City of Calgary’s (The City) original investment in the Calgary utility assets, ENMAX continues to provide a stable return to our Share-holder by maintaining dividend levels at or above $50 million per year, matching or exceeding the Corporation’s dividend policy.
Commitment to financial disclosure. While ENMAX’s shares are not publicly traded, we have long demonstrated our commitment to balanced corporate disclosure, having produced comprehensive annual reports every year since 1999 when the Corporation was created. For both of the last two years, ENMAX has been recog-nized in the Oilweek/ATB Financial Annual Report Competition for excellence in financial disclosure and editorial and design. This competition is considered Western Canada’s leading energy-related annual report competition. ENMAX's annual reports have earned top positions in the Transmission & Utility/Public and Government Sector categories for two consecutive years. In addition, ENMAX’s 2008 annual report received the Apex Award, for the best annual report in the competition that year, from a field of 65 reports produced by Alberta’s leading energy producers.

Message to stakeholders. pg4 ENMAX Corporation 2010
ENMAX is on track to transition our consolidated financial statements from Canadian generally accepted accounting principles (GAAP) to International Financial Reporting Standards (IFRS) in 2012. A comprehensive status report can be found beginning on page 33 of the MD&A.
DAVID HALFORD Executive Vice President, Finance and Chief Financial Officer

VOLUNTARY PRACTICES
ENMAX prides itself on its strong commitment to financial disclosure and corporate governance. While not required by regulation to adhere to the corporate governance standards set by the Canadian Securities Administrators (CSA), a summary of ENMAX’s compliance with CSA standards related to financial reporting is as follows:
CSA STANDARD PURPOSE COMMENTARY
1 NI 51-102 Requirements for the preparation of annual and interim consolidated financial statements and Management Discussion and Analysis (MD&A) for public issuance
ENMAX meets CSA standards for presenting its consolidated financial statements and MD&A which are publicly available on its website, except disclosure of forward-looking information to the extent required by CSA standards.
2 NI 51-102 Requirements for business acquisition reports ENMAX has not entered into a business acquisition since 2008.
3 NI 51-102 Requirements for material change reports ENMAX issues press releases for material changes in its business but does not provided a material change report.
4 NI 51-102 Annual Information Report and Management Information Circulars
Information required by these reports is included in ENMAX’s Annual and Financial Reports and corporate governance document, “How We Govern”. The prescribed format required by NI 51-102 is utilized for standardized reporting on System for Electronic Document Analysis and Retrieval (SEDAR). ENMAX has not provided these reports in prescribed format.
5 NI 51-102F6 Requirements for disclosure of executive compensation
ENMAX commenced disclosure of this information in December 2010, in its “How We Govern” corporate governance document and expects to continue this disclosure annually in the future.
6 NI 52-109 Requirements for CEO and CFO certification of disclosure controls and procedures and internal controls around financial reporting
ENMAX provides a restricted scope certification process on key risks.
7 NI 52-110 Requirements for the composition and mandate of the Audit Committee
ENMAX meets CSA standards for composition and mandate of its Audit and Finance Committee.
Financial governance
Financial governance. pg5 ENMAX Corporation 2010
Management’s discussion and analysis. pg6 ENMAX Corporation 2010
Management’s discussion and analysis.
2 Significant accounting policies. [CONTINUED]
Financial governance. pg6 ENMAX Corporation 2010
Financial governance
AUDIT COMMITTEE
ENMAX’s Board of Directors (the Board) has appointed an Audit and Finance Committee (Audit Committee) which has the responsibilities and mandate to oversee finance-related activities of the Corporation. Details of this committee’s mandate can be found in the Corporation’s published corporate governance documents. The scope of the Audit Committee includes governance oversight of the following areas:
- integrity of the Corporation’s consolidated financial statements and the financial reporting process;- management information systems including internal controls over financial reporting and disclosure
controls and processes;- financial and enterprise risk management;- financing plans and strategies, budgets and forecasts; - auditor qualifications (internal and external);- delegation of authorities and other key financial policies;- accounting policies including reviewing and approving changes in accounting policies including IFRS; and- other risk matters including monitoring business continuity plans, placement of insurance programs and
Finance Office succession plans.
Many of these mandate activities are in excess of the requirements set by NI 52-110 and are considered best practices in industry.
Management’s discussion and analysis. pg7 ENMAX Corporation 2010
2 Significant accounting policies. [CONTINUED]
Forward-looking information. pg7 ENMAX Corporation 2010
This document contains statements about future events and financial and operating results of ENMAX that are forward-looking. By their nature, forward-looking statements require the Corporation to make assump-tions and are subject to inherent risks and uncertainties. There is significant risk that predictions and other forward-looking statements will not prove to be accurate. Readers are cautioned not to place undue reliance on forward-looking statements as a number of factors could cause actual future results, conditions, actions or events to differ materially from financial and operating targets, expectations, estimates or intentions expressed in the forward-looking statements.
When used in this report, the words “may”, “would”, “could”, “will”, “intend”, “plan”, “anticipate”, “believe”, “seek”, “propose”, “estimate”, “expect” and similar expressions, as they relate to the Corporation or an affili-ate of the Corporation, are intended to identify forward-looking statements. Such statements reflect the Corporation’s current views with respect to future events and are subject to certain risks, uncertainties and assumptions. Many factors could cause the Corporation’s actual results, performance or achievements to vary from those described in this report. Should one or more of these risks or uncertainties materialize or should assumptions underlying forward-looking statements prove incorrect, actual results may vary materi-ally from those described in this report. Intended, planned, anticipated, believed, estimated or expected and other forward-looking statements included in this report herein should not be unduly relied upon. These statements speak only as of the date of this report. The Corporation does not intend, and does not assume any obligation, to update these forward-looking statements except as required by law, and reserves the right to change, at any time at its sole discretion, the practice of updating annual targets and guidance. Targets for 2011 are described in the MD&A Section 16: Outlook and on page 12 and 13 of this document.
Factors that could cause actual results to differ materially include, but are not limited to:
- competitive factors and pricing pressures, including the supply side and demand side of the Alberta power market and the volatile fluctuations in the pricing of natural gas in the North American market;
- regulatory developments as it relates to transmission and distribution rate-making and the impact of deregulation in the industry;
- human resources, including possible labour disruptions;- financing and debt requirements, including ability to carry out refinancing activities; - tax matters, including acceleration or deferral of required cash payments, realization of timing differences
and potential reassessments by tax authorities; - litigation and legal matters; - business continuity events (including man-made and natural threats); - economic growth and fluctuations as it relates to the resource-based Alberta economy; - change in customers’ wants and needs due to evolving technologies and a movement to more
environmentally friendly ways of living; and - other risk factors discussed herein and listed from time to time in ENMAX’s reports and other public
disclosure documents.
For further information, see the MD&A Section 11: Risk Management and Uncertainties.
Caution regarding forward-looking information

Management’s discussion and analysis. pg8 ENMAX Corporation 2010
Management’s discussion and analysis.
2 Significant accounting policies. [CONTINUED]
Supplementary financial information. pg8 ENMAX Corporation 2010
Key performance indicators
The Corporation has key measures which are vital in determining how ENMAX is achieving its targets. These key measures, along with a discussion of how they are correlated to the financial results, are outlined below. Please see the 2010 Financial Report on enmax.com for more detailed information.
GENERATION AND WHOLESALE ENERGY
2010 2009
Generation volume (GWh) 11,714 11,092Market heat rate – flat average (GJ/MWh) 13.40 12.72Average market spark spread ($/MWh) (1) $20.45 $17.76
(1) Assuming an average CCGT heat rate of 8 GJ per MWh.
Higher pool prices and relatively flat natural gas prices as outlined in Section 1 of the MD&A created a favour-able spark spread which resulted in additional generation from the gas-fired facilities. Increased generation and a higher spark spread result in higher margins in the generating business.
RESIDENTIAL, SMALL BUSINESS, INDUSTRIAL, COMMERCIAL AND INSTITUTIONAL SALES
2010 2009
Electricity sales volumes (GWh) 19,467 18,542Average selling prices ($/MWh) $63.95 $65.86
Fixed price volumes are higher due to new customer sign-ups and variable price volumes are higher due primarily to sales to existing industrial customers. These increases were offset by lower settled prices in 2010. The lower average prices can be attributed to the decreased number of fixed price sign-ups at the current EasyMax® prices, lower short term regulated rate option (RRO) prices relative to the long term EasyMax® prices, as well as lower wholesale market prices for industrial, commercial and institutional clients.
DISTRIBUTION AND TRANSMISSION
2010 (1) 2009
Regulated ROE – distribution 7.6% 9.8%Regulated ROE – transmission 8.2% 10.4%
(1) These numbers are based on preliminary information. Regulatory true-ups and adjustments could be required in 2011 relating to 2010 delivery.
OM&A savings for both distribution and transmission in 2010 were not at the same levels as in 2009 as a result of reduced capital spending resulting in less OM&A being capitalized to projects and therefore more costs being recognized in earnings. This increase in recognized costs was partially offset by continued cost management. Increases in amortization charges due to a higher asset base also contributed to the lower return on equity (ROE). Allowed ROE under the formula based ratemaking (FBR) framework is 9.0%. Lower than expected load growth, lower than expected inflation and higher rate base have resulted in actual ROE being lower than the authorized level.
Supplementary financial information
Management’s discussion and analysis. pg9 ENMAX Corporation 2010
2 Significant accounting policies. [CONTINUED]
Supplementary financial information. pg9 ENMAX Corporation 2010
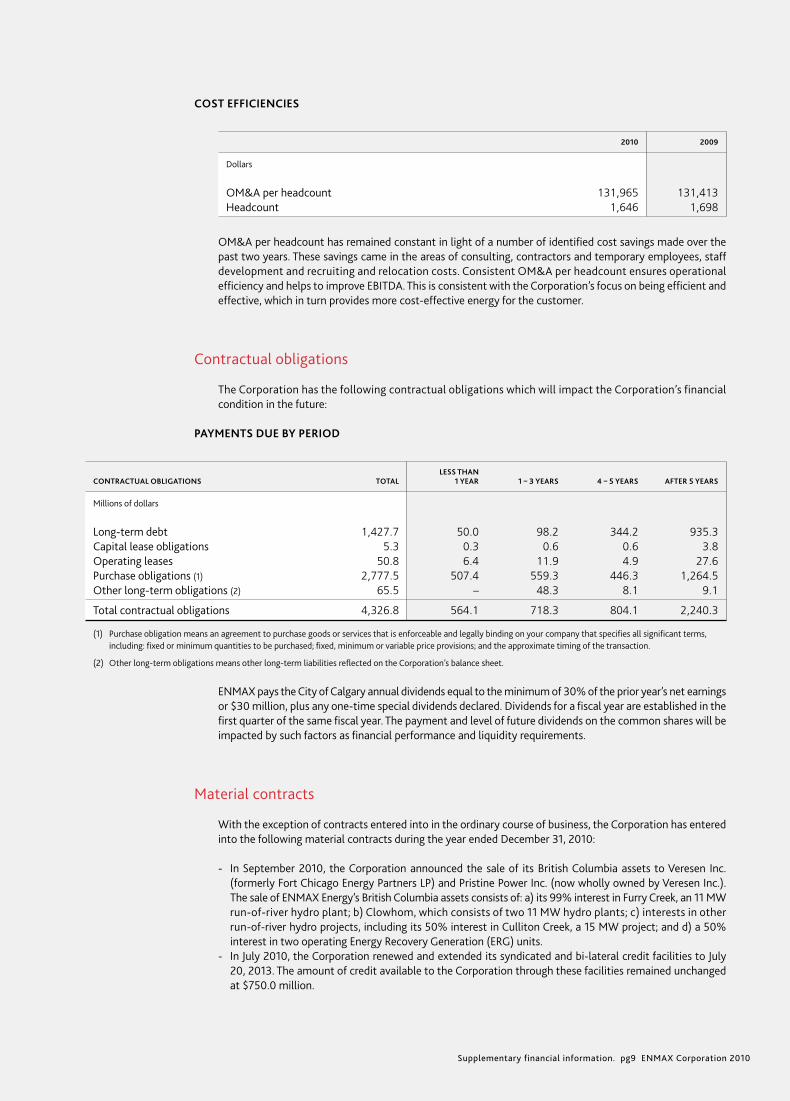
COST EFFICIENCIES
2010 2009
Dollars
OM&A per headcount 131,965 131,413Headcount 1,646 1,698
OM&A per headcount has remained constant in light of a number of identified cost savings made over the past two years. These savings came in the areas of consulting, contractors and temporary employees, staff development and recruiting and relocation costs. Consistent OM&A per headcount ensures operational efficiency and helps to improve EBITDA. This is consistent with the Corporation’s focus on being efficient and effective, which in turn provides more cost-effective energy for the customer.
Contractual obligations
The Corporation has the following contractual obligations which will impact the Corporation’s financial condition in the future:
PAYMENTS DUE BY PERIOD
LESS THAN CONTRACTUAL OBLIGATIONS TOTAL 1 YEAR 1 – 3 YEARS 4 – 5 YEARS AFTER 5 YEARS
Millions of dollars
Long-term debt 1,427.7 50.0 98.2 344.2 935.3Capital lease obligations 5.3 0.3 0.6 0.6 3.8Operating leases 50.8 6.4 11.9 4.9 27.6Purchase obligations (1) 2,777.5 507.4 559.3 446.3 1,264.5Other long-term obligations (2) 65.5 – 48.3 8.1 9.1
Total contractual obligations 4,326.8 564.1 718.3 804.1 2,240.3
(1) Purchase obligation means an agreement to purchase goods or services that is enforceable and legally binding on your company that specifies all significant terms, including: fixed or minimum quantities to be purchased; fixed, minimum or variable price provisions; and the approximate timing of the transaction.
(2) Other long-term obligations means other long-term liabilities reflected on the Corporation’s balance sheet.
ENMAX pays the City of Calgary annual dividends equal to the minimum of 30% of the prior year’s net earnings or $30 million, plus any one-time special dividends declared. Dividends for a fiscal year are established in the first quarter of the same fiscal year. The payment and level of future dividends on the common shares will be impacted by such factors as financial performance and liquidity requirements.
Material contracts
With the exception of contracts entered into in the ordinary course of business, the Corporation has entered into the following material contracts during the year ended December 31, 2010:
- In September 2010, the Corporation announced the sale of its British Columbia assets to Veresen Inc. (formerly Fort Chicago Energy Partners LP) and Pristine Power Inc. (now wholly owned by Veresen Inc.). The sale of ENMAX Energy’s British Columbia assets consists of: a) its 99% interest in Furry Creek, an 11 MW run-of-river hydro plant; b) Clowhom, which consists of two 11 MW hydro plants; c) interests in other run-of-river hydro projects, including its 50% interest in Culliton Creek, a 15 MW project; and d) a 50% interest in two operating Energy Recovery Generation (ERG) units.
- In July 2010, the Corporation renewed and extended its syndicated and bi-lateral credit facilities to July 20, 2013. The amount of credit available to the Corporation through these facilities remained unchanged at $750.0 million.
Management’s discussion and analysis. pg10 ENMAX Corporation 2010
Management’s discussion and analysis.
2 Significant accounting policies. [CONTINUED]
Supplementary financial information. pg10 ENMAX Corporation 2010
Supplementary financial information
Interests of experts.
The Corporation’s Auditors are Deloitte & Touche LLP, Chartered Accountants, Suite 700, 850 – 2nd Street SW, Calgary, Alberta, T2P 0R8. Deloitte & Touche LLP has confirmed that they are independent with respect to the Corporation within the meaning of the Rules of Professional Conduct of the Institute of Chartered Accountants of Alberta.
The Corporation utilizes external professional services in relation to its employee benefits from Towers Watson, Suite 1600, 111 – 5th Avenue SW, Calgary, Alberta, T2P 3Y6. Towers Watson is independent with respect to the Corporation, as they have no equity interest in the Corporation and are compensated at a contracted fixed rate, regardless of the outcome of their reports.
Legal and regulatory proceedings
The Corporation is occasionally named as a party in various claims and legal proceedings which arise during the normal course of its business. The Corporation reviews each of these claims, including the nature of the claim and the amount in dispute. Although there is no assurance that each claim will be resolved in favour of the Corporation, the Corporation does not believe that the outcome of any claims or potential claims it is currently aware of will have a material adverse effect on the Corporation, after taking into account amounts previously reserved by the Corporation. For further information, please refer to Note 20 in the Notes to the Consolidated Financial Statements in the 2010 Financial Report on enmax.com.
Climate change and the environment
ENVIRONMENTAL RISKS
Refer to the MD&A Section 10: Risk Management and Uncertainties for discussion regarding the Corporation’s environmental risks.
TRENDS AND UNCERTAINTIES
Environmental matters cause certain trends and uncertainties to exist. The items listed below can impact both the Corporation’s operations and its financial performance and condition.
- Customers are becoming more aware of the emissions profiles of various generation sources via the media coverage on this subject. As a result, the need to offer energy from “cleaner” alternative production methods and renewable resources is increasing. Based on ENMAX’s asset portfolio, the Corporation is positioned to be able to offer consumers the choice of generation with lower greenhouse gas emissions as compared to existing coal facilities and that will help increase revenues should this trend continue to develop.
- The Corporation is also well positioned to offer innovative technologies that will help increase customer choice and ultimately revenues. The Generate Choice™ program was launched in late 2010 and will provide customers the opportunity to generate their own solar and wind power.
- The Corporation will continue to procure emissions credits and offsets to mitigate the costs of the emissions obligations relating to its portfolio of generation assets, if regulatory bodies place an increased emphasis (and value) on cleaner producing energy sources.
- The Corporation’s mandate includes spending resources in regards to research and development costs for more environmentally efficient operations and alternative energy technologies.
- The Corporation’s expenses are likely to decrease in regards to purchases of allowances and offsets to meet regulatory emissions requirements as its investment in coal-fired facilities continues to be reduced leading up to the 2020 expiry of its final Power Purchase Arrangement (PPA).
Management’s discussion and analysis. pg11 ENMAX Corporation 2010
2 Significant accounting policies. [CONTINUED]
Supplementary financial information. pg11 ENMAX Corporation 2010
ENVIRONMENTAL LIABILITIES
The Corporation’s environmental liabilities consist of greenhouse gas (GHG) liabilities. These obligations relate to electricity generated from both of the Corporation’s PPAs and Calgary Energy Centre (CEC). These items have been reflected as liabilities in the consolidated financial statements as at December 31, 2010. The Corporation will continue to actively monitor and abide with current and future environmental regulations.
There are currently no outstanding lawsuits in litigation against the Corporation for environmental matters.
There are no other known environmental liabilities at this point in time or foreseen in the future.
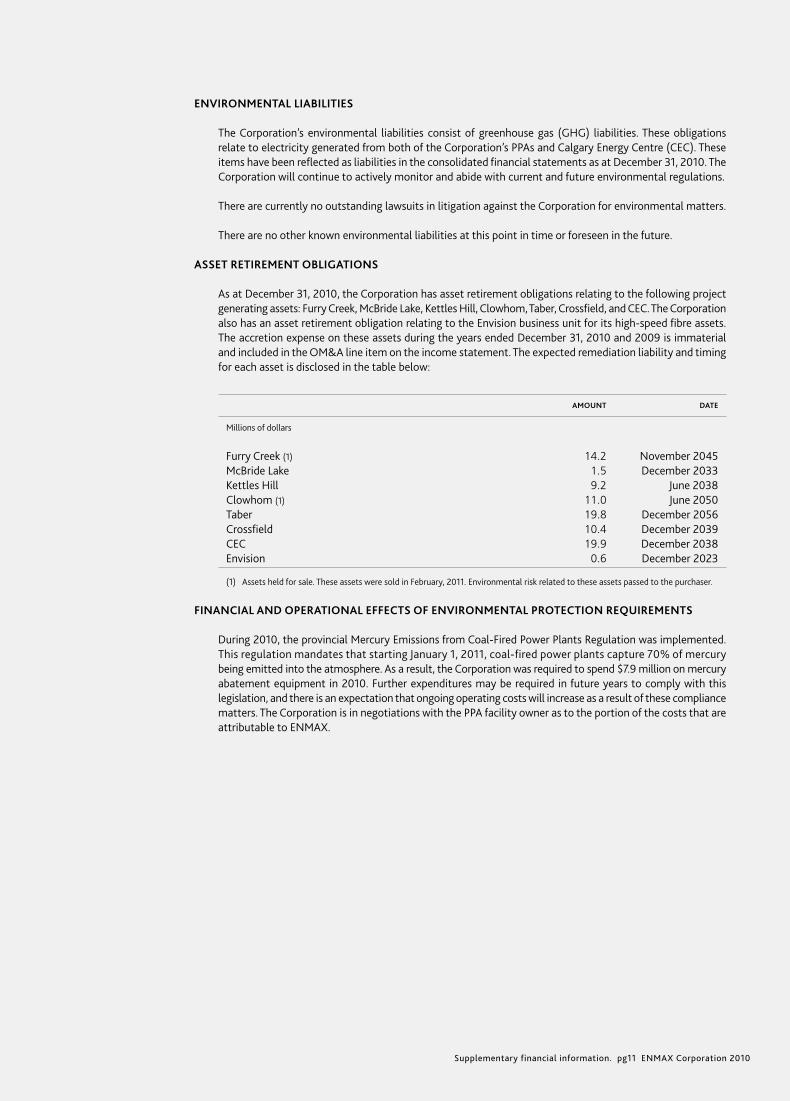
ASSET RETIREMENT OBLIGATIONS
As at December 31, 2010, the Corporation has asset retirement obligations relating to the following project generating assets: Furry Creek, McBride Lake, Kettles Hill, Clowhom, Taber, Crossfield, and CEC. The Corporation also has an asset retirement obligation relating to the Envision business unit for its high-speed fibre assets. The accretion expense on these assets during the years ended December 31, 2010 and 2009 is immaterial and included in the OM&A line item on the income statement. The expected remediation liability and timing for each asset is disclosed in the table below:
AMOUNT DATE
Millions of dollars
Furry Creek (1) 14.2 November 2045McBride Lake 1.5 December 2033Kettles Hill 9.2 June 2038Clowhom (1) 11.0 June 2050Taber 19.8 December 2056Crossfield 10.4 December 2039CEC 19.9 December 2038Envision 0.6 December 2023
(1) Assets held for sale. These assets were sold in February, 2011. Environmental risk related to these assets passed to the purchaser.
FINANCIAL AND OPERATIONAL EFFECTS OF ENVIRONMENTAL PROTECTION REQUIREMENTS
During 2010, the provincial Mercury Emissions from Coal-Fired Power Plants Regulation was implemented. This regulation mandates that starting January 1, 2011, coal-fired power plants capture 70% of mercury being emitted into the atmosphere. As a result, the Corporation was required to spend $7.9 million on mercury abatement equipment in 2010. Further expenditures may be required in future years to comply with this legislation, and there is an expectation that ongoing operating costs will increase as a result of these compliance matters. The Corporation is in negotiations with the PPA facility owner as to the portion of the costs that are attributable to ENMAX.

Financial summary. pg12 ENMAX Corporation 2010
Financial summary
ANNUAL CONSOLIDATED FINANCIAL INFORMATION
2010 2009 2008 2007 2006 2005 2004 2003
(millions of dollars, except return on equity and operating statistics)
Total revenues 2,404.2 2,354.9 2,668.0 2,107.2 1,665.1 1,295.6 1,193.1 1,226.2Operating margin (1) 644.3 682.6 576.8 461.3 397.9 430.5 480.8 531.9Standardized earnings before interest, income tax, depreciation and amortization (EBITDA) (1) 427.0 459.6 365.9 300.8 255.3 223.9 282.1 301.5Net earnings before discontinued operations 181.2 206.6 181.9 141.4 129.4 116.4 152.2 173.0Net earnings 177.8 205.9 181.1 141.8 130.1 116.7 152.2 173.0
Return on equity (2) 9.9% 12.3% 11.9% 10.0% 9.7% 10.1% 12.5% 15.8%Return on assets (3) 7.9% 9.1% 9.5% 9.3% 9.4% 8.9% 12.2% 15.4%
Dividend payout 61.8 55.0 50.0 50.0 50.0 50.0 50.4 50.0
Capital assets (4) 2,903.8 2,687.9 2,466.4 1,602.1 1,418.5 1,047.3 947.1 899.3Total assets 3,882.9 3,744.3 3,481.6 2,456.2 2,160.4 1,791.2 1,730.4 1,443.3Total debt (5) 1,427.7 1,338.0 1,124.8 462.6 411.3 234.3 252.3 160.6Total shareholder’s equity 1,845.2 1,744.5 1,596.5 1,458.8 1,385.5 1,305.4 1,238.7 1,127.1Total capitalization (6) 3,272.9 3,082.5 2,721.3 1,921.4 1,796.8 1,539.7 1,491.0 1,287.7
Long-term debt to total capitalization ratio (7) 43.6% 42.8% 36.7% 22.6% 20.6% 15.2% 16.9% 12.5%
Cash provided by operating activities 320.2 283.6 271.1 264.4 189.8 79.8 267.4 289.1Cash used by investing activities 335.3 409.1 638.4 268.6 289.3 316.1 52.6 123.3Cash provided / (used) by financing activities 25.2 145.9 350.2 1.5 127.5 (89.9) 37.6 (68.2)
(1) Non-GAAP financial measure. See discussion that follows in the MD&A.
(2) Return on equity is equal to net earnings divided by average Shareholder’s equity for the period.
(3) Return on assets is equal to net earnings before after-tax interest charges divided by average total assets (adjusted for capital assets under construction and current liabilities) for the period.
(4) Capital assets include property, plant and equipment (PPE), power purchase arrangements and intangible assets.
(5) Total debt includes short-term financing and long-term debt.
(6) Total capitalization is equal to total debt plus Shareholder’s equity.
(7) Long-term debt to total capitalization is equal to total long-term debt divided by total capitalization.
Financial summary. pg13 ENMAX Corporation 2010
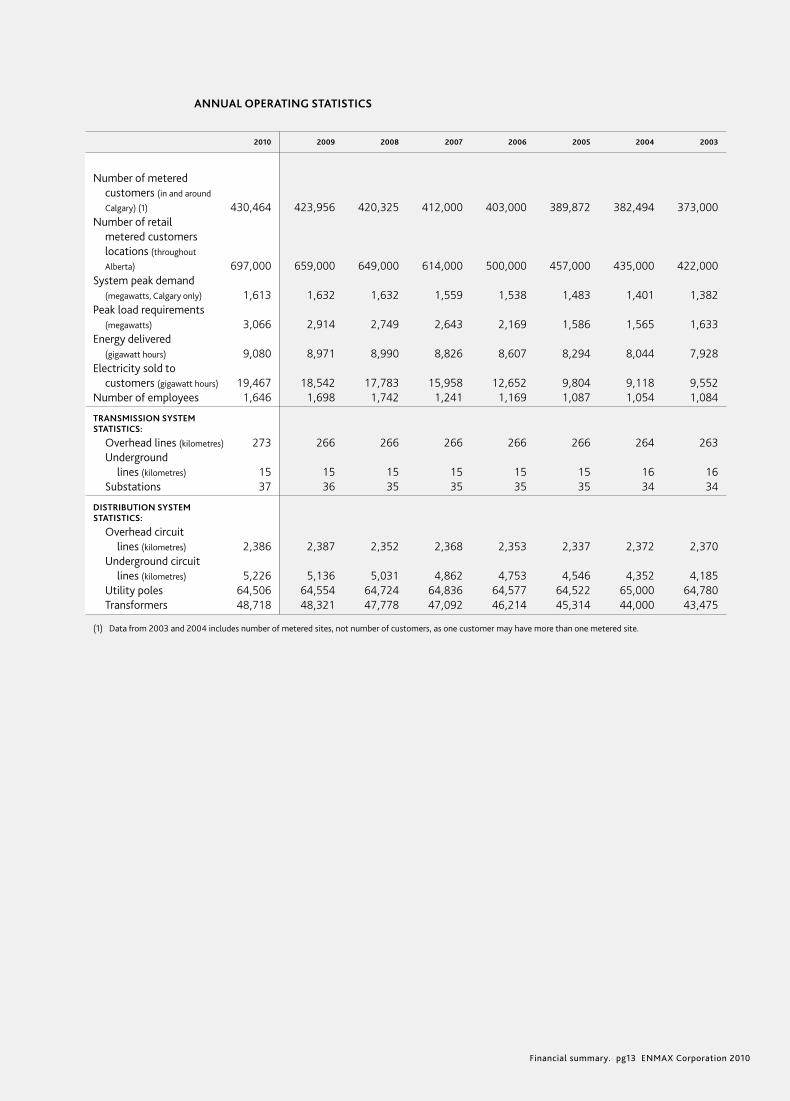
ANNUAL OPERATING STATISTICS
2010 2009 2008 2007 2006 2005 2004 2003
Number of metered customers (in and around
Calgary) (1) 430,464 423,956 420,325 412,000 403,000 389,872 382,494 373,000 Number of retail metered customers locations (throughout
Alberta) 697,000 659,000 649,000 614,000 500,000 457,000 435,000 422,000 System peak demand (megawatts, Calgary only) 1,613 1,632 1,632 1,559 1,538 1,483 1,401 1,382 Peak load requirements (megawatts) 3,066 2,914 2,749 2,643 2,169 1,586 1,565 1,633 Energy delivered (gigawatt hours) 9,080 8,971 8,990 8,826 8,607 8,294 8,044 7,928 Electricity sold to customers (gigawatt hours) 19,467 18,542 17,783 15,958 12,652 9,804 9,118 9,552 Number of employees 1,646 1,698 1,742 1,241 1,169 1,087 1,054 1,084
TRANSMISSION SYSTEM STATISTICS:
Overhead lines (kilometres) 273 266 266 266 266 266 264 263 Underground lines (kilometres) 15 15 15 15 15 15 16 16 Substations 37 36 35 35 35 35 34 34
DISTRIBUTION SYSTEM STATISTICS:
Overhead circuit lines (kilometres) 2,386 2,387 2,352 2,368 2,353 2,337 2,372 2,370 Underground circuit lines (kilometres) 5,226 5,136 5,031 4,862 4,753 4,546 4,352 4,185 Utility poles 64,506 64,554 64,724 64,836 64,577 64,522 65,000 64,780 Transformers 48,718 48,321 47,778 47,092 46,214 45,314 44,000 43,475
(1) Data from 2003 and 2004 includes number of metered sites, not number of customers, as one customer may have more than one metered site.
Management’s discussion and analysis. pg14 ENMAX Corporation 2010
Management’s discussion and analysis (MD&A)
This MD&A, dated March 9, 2011, is a review of the results of operations of ENMAX for the year ended December 31, 2010, compared with the same period in 2009, and of the Corporation’s financial condition and future prospects. This discussion contains forward-looking information that is qualified by reference to and should be read together with, the caution regarding forward-looking statements previously mentioned.
ENMAX’s consolidated financial statements have been prepared in accordance with Canadian Generally Accepted Accounting Principles (GAAP). The consolidated financial statements and MD&A were reviewed by ENMAX’s Audit and Finance Committee and approved by the Board. All amounts are in Canadian dollars unless otherwise specified.
The Corporation reports on certain non-GAAP financial measures such as operating margin and funds from operations that are used by management to evaluate performance of business units and segments. Because non-GAAP financial measures do not have a standardized meaning, the Corporation has defined and recon-ciled them with their nearest GAAP measure. For the reader’s reference, the definition, calculation and reconciliation of consolidated non-GAAP financial measures is provided in Section 5: Non-GAAP Financial Measures.
1 Overview of the business environment
CORPORATE STRATEGY
ENMAX, and its predecessors, have provided Albertans with electricity for over 100 years. ENMAX is a wholly owned subsidiary of The City of Calgary (The City), headquartered in Calgary, Alberta, Canada. ENMAX strives to deliver shareholder value by providing customers with access to state-of-the-art, environmentally sensitive energy solutions across the province of Alberta while maintaining its performance as one of the country’s most reliable electric systems. Its core operations include the regulated transmission and distribu-tion business in and around the city of Calgary through ENMAX Power and the competitive, de-regulated generation and sale of electricity across the province of Alberta through ENMAX Energy. In addition, ENMAX Energy is involved in the sale of natural gas and renewable energy products across Alberta. ENMAX’s objective is to deliver reliable, low-cost energy solutions while providing stable, low-risk earnings to the Shareholder.
ENMAX differentiates itself from its peers and competitors by its vertically-integrated structure of owning its own generation, transmission and distribution assets in addition to being a retail supplier, vast experience within the Alberta marketplace and its proven leadership in the area of developing more environmentally sensitive technologies and processes.
ENMAX measures its success in accomplishing its vision through achievement of the segmented strategies on the following pages.
ENMAX Energy
ENMAX Energy provides electricity, natural gas and renewable energy products to residential, commercial and industrial customers in the deregulated electricity market in Alberta. In addition, it provides customer care, energy management and high speed data and internet services. ENMAX Energy’s core strategy is to grow its business in Alberta with a focus on best available fuel efficient generation within a framework of vertical-integration. This vertical-integration framework (consisting of generation, wholesale markets and retail sales) allows the Corporation to expand its generation portfolio with reduced price volatility as its sales portfolio provides liquidity for generated volumes that otherwise may not be accessible. The generation arm of ENMAX Energy supplies energy through ENMAX’s own wind and gas-fired generation facilities. The whole-sale markets arm balances the Corporation’s day to day energy portfolio needs through management of the wholesale power purchase arrangements (PPAs) and through the purchase and sale of electricity and natural gas into and from the Alberta market. PPAs are similar to contracts and were created pursuant to the Electric Utilities Act (EUA) as part of deregulation of the electricity generating market in Alberta. The PPAs convey rights to the PPA buyer for all, or a portion of, the output from a generation facility for compensation defined in the terms and conditions of the PPA.
Management’s discussion and analysis. pg15 ENMAX Corporation 2010
1 Overview of the business environment (CONTINUED)
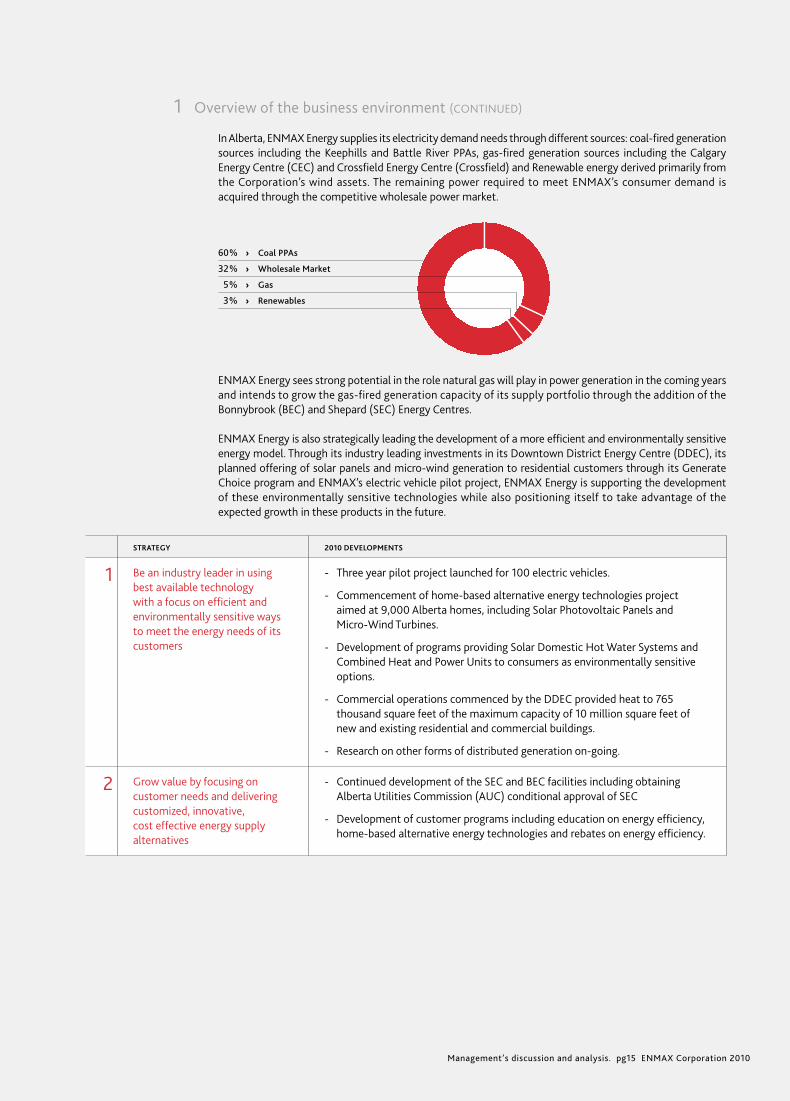
In Alberta, ENMAX Energy supplies its electricity demand needs through different sources: coal-fired generation sources including the Keephills and Battle River PPAs, gas-fired generation sources including the Calgary Energy Centre (CEC) and Crossfield Energy Centre (Crossfield) and Renewable energy derived primarily from the Corporation’s wind assets. The remaining power required to meet ENMAX’s consumer demand is acquired through the competitive wholesale power market.
60% › Coal PPAs
32% › Wholesale Market
5% › Gas
3% › Renewables
ENMAX Energy sees strong potential in the role natural gas will play in power generation in the coming years and intends to grow the gas-fired generation capacity of its supply portfolio through the addition of the Bonnybrook (BEC) and Shepard (SEC) Energy Centres.
ENMAX Energy is also strategically leading the development of a more efficient and environmentally sensitive energy model. Through its industry leading investments in its Downtown District Energy Centre (DDEC), its planned offering of solar panels and micro-wind generation to residential customers through its Generate Choice program and ENMAX’s electric vehicle pilot project, ENMAX Energy is supporting the development of these environmentally sensitive technologies while also positioning itself to take advantage of the expected growth in these products in the future.
STRATEGY 2010 DEVELOPMENTS
1 Be an industry leader in using best available technology with a focus on efficient and environmentally sensitive ways to meet the energy needs of its customers
- Three year pilot project launched for 100 electric vehicles.
- Commencement of home-based alternative energy technologies project aimed at 9,000 Alberta homes, including Solar Photovoltaic Panels and Micro-Wind Turbines.
- Development of programs providing Solar Domestic Hot Water Systems and Combined Heat and Power Units to consumers as environmentally sensitive options.
- Commercial operations commenced by the DDEC provided heat to 765 thousand square feet of the maximum capacity of 10 million square feet of new and existing residential and commercial buildings.
- Research on other forms of distributed generation on-going.
2 Grow value by focusing on customer needs and delivering customized, innovative, cost effective energy supply alternatives
- Continued development of the SEC and BEC facilities including obtaining Alberta Utilities Commission (AUC) conditional approval of SEC
- Development of customer programs including education on energy efficiency, home-based alternative energy technologies and rebates on energy efficiency.

Management’s discussion and analysis. pg16 ENMAX Corporation 2010
Management’s discussion and analysis
1 Overview of the business environment (CONTINUED)
ENMAX Power
ENMAX Power owns, operates and maintains transmission and distribution assets in the Calgary service area. As well, it has the legislated responsibility to provide electricity for customers who have elected to stay with the regulated rate option. ENMAX Power also has some non-regulated businesses which provide engineering, procurement, construction and maintenance services.
ENMAX Power’s core strategy is to continue to provide safe, reliable and cost-effective transmission and distribution services to the city of Calgary while meeting the challenges of a growing and expanding city.
STRATEGY 2010 DEVELOPMENTS
1 Lead regulatory evolution in Alberta with a focus on efficiency and effectiveness.
- The Corporation has successfully operated under the Formula Based Ratemaking (FBR) approach since it was approved in 2009.
- The AUC began an initiative to reform rate-regulation in Alberta and move all electricity and gas distribution companies to performance-based ratemaking by a target date of July 1, 2011. This model will be similar to the model developed by ENMAX Power and approved by the AUC in 2009. Current expectations are that this new rate-making method will not be in place for all utilities until 2013.
2 Maintain performance as one of the country’s most reliable urban electrical systems, while meeting the challenges of Calgary’s expanding transmission and distribution network.
- Retrofitting power lines on major arteries with less combustible materials.
- Continued development of distribution automation infrastructure to reduce severity of service interruptions.
CORPORATE PRIORITIES FOR 2010
Management confirms or sets corporate initiatives each year to advance ENMAX’s strategy, focusing on near term opportunities and challenges. In the 2009 Annual Report, management identified a number of key initiatives for 2010. Updates on these initiatives are as follows:
INITIATIVE UPDATE
1 Retention of existing customer base in Alberta
- ENMAX’s total electricity sales volumes have increased 5% while natural gas volumes have increased 7%. Electricity sales generate three times the revenue of gas sales.
- Customer renewal rates for EasyMax® customers and for corporate and industrial customers exceeded targets in 2010.
2 Improve productivity - Numerous operational efficiencies were identified and implemented in the transmission, distribution and power services areas.
3 Obtain best in class safety ratings - Total recordable injury frequency was 1.47 against a target of 1.55. Total recordable injury frequency is calculated as: (number of lost time injuries + medical aid injuries + illnesses + modified work cases) / exposure rate.
- Lost time injury severity rate was 0.14 against a target of 1.20. Lost time injury severity rate is calculated as: calendar days lost / exposure rate.

Management’s discussion and analysis. pg17 ENMAX Corporation 2010
1 Overview of the business environment (CONTINUED)
INITIATIVE UPDATE
4 Develop and integrate new generating facilities and options
- Crossfield was commissioned in December 2009 and since assuming full operations, this plant has achieved heat rate, availability and outage targets in line with expectations.
- Commercial operations commenced at DDEC in June 2010 and the Corporation is currently in the process of adding to its customer base to maximize the output from the facility.
5 Maintain high regulatory compliance standards
• DuringtheyearENMAXEnergyandENMAXPowereachcompletedandfiledtheir first self certification assessments for compliance with the new Alberta Reliability Standards. Filing’s indicated substantial compliance and action plans to address the minor areas of non-compliance identified.
6 Continue with transmission and distribution capital programs
- The following amounts were incurred in 2010 as part of the transmission and distribution capital programs (in millions):
Residential and non-residential distribution development $16.5Distribution system infrastructure $10.6Distribution automation, asset replacement and system modification projects to ensure reliability of the distribution system and compliance with industry standards and safety codes $25.2Alberta Electric System Operator (AESO) required capital projects $26.7Downtown cable replacement project and other cable replacement projects throughout the city $33.6Construction of substation #47 to ensure reliability and ability to meet the growing load demand in the northeast parts of the city $19.4
7 Commence construction on the West LRT project
- The design phase for the West light rail transit (LRT) project was completed during the year and as at December 31, 2010, the building phase of the project continues.
8 Improve capital resource plan - Developed alternative financing models for major generation projects.
- Completed agreements to sell substantially all of ENMAX Energy’s British Columbia assets.
- Completed $156 million of financing for regulated business.
- Extended bilateral and syndicated bank facilities.
MARKET CHARACTERISTICS
The vertical-integration strategy of the Corporation results in a broad variety of market characteristics applying to the business. These characteristics include fuel supply, wholesale and retail commodity demand, transmission and distribution capacities, electricity prices, spark spreads and environmental awareness. In addition, the Corporation’s construction of large-scale generation projects results in exposure to the avail-ability of construction materials, labour and equipment.

Management’s discussion and analysis. pg18 ENMAX Corporation 2010
Management’s discussion and analysis.
1 Overview of the business environment (CONTINUED)
Most electricity volumes sold in Alberta and electricity volumes distributed in Calgary are not seasonal in nature as they relate to industrial, commercial, institutional customers and small business customers with relatively consistent requirements throughout the year with a potential to peak with extreme hot weather in the summer months. For residential customers, however, electricity demand is highest in the winter and summer months due to operation of furnaces and air conditioners.
Natural gas volumes and prices are correlated with the time of year as a result of weather patterns. Natural gas consumption and prices will increase with extreme weather seen in the winter. As well, natural gas prices can rise in extreme hot weather in the summer as peak electricity demand results in increased gas-fired generation.
In ENMAX’s electricity generating activities, primary fuels include natural gas, coal and wind. The supply of wind is not subject to market factors, but is significantly influenced by weather patterns. The natural gas market has seen average prices increasing slightly from $3.76 per gigajoule (GJ) in the twelve months ended December 31, 2009 to $3.79 per GJ the same period in 2010. ENMAX has a comprehensive hedging program to manage the impact of natural gas prices on near-term operating profits. ENMAX utilizes the retail sales market to provide stability in long-term electricity prices and reduce exposure to market volatility. The coal-fired plants, to which ENMAX owns the right of physical output under PPAs, do not result in exposure to market coal prices. Under the Keephills and Battle River PPAs, the input costs for electricity generated at coal-fired facilities are calculated via a pre-determined formula based on Statistics Canada Indices. These indices include, but are not limited to, cost of labour, cost of mining machinery, and other mining related expenses.
Plant heat rates are the measure of efficiency of a generating facility in converting natural gas into electricity. Market heat rates are a measure of forward power prices divided by forward natural gas prices. The spark spread is the theoretical gross margin of a gas-fired power plant from selling a unit of electricity, having bought the fuel required to produce this unit of electricity. All other costs must be covered from the spark spread. The spark spread then is the difference between market heat rate and plant heat rate multiplied by the gas price. Therefore, spark spread could be considered a better method of articulating an asset’s contri-bution to ENMAX’s profitability than heat rate.
Spark spreads may vary greatly between facilities due to their design and operating requirements. Spark spreads in Alberta have declined over the past five years. Assuming an average Combined Cycle Gas Turbine (CCGT) heat rate of 8 GJ per MWh, market spark spreads increased from an average of $17.76 per MWh in 2009 to $20.45 per MWh in the same period in 2010 due to the moderate recovery in electricity prices from the lows experienced during the economic downturn.
The market price of electricity is a significant factor in a number of areas of the business. Retail prices are set based on current spot prices, average monthly prices and future expected market prices. In 2010, the average flat pool price was $50.77 per megawatt hour (MWh), which is an increase from the $47.84 per MWh average experienced in 2009. Market electricity prices are driven by demand, supply and input costs, as well as other business environment dynamics.
The Alberta electricity market price is generally correlated to the price of natural gas; however during times of scarcity, prices can rise well above marginal cost of production. These fluctuations, up and down, in price signal new investments in the market place and contribute to the return on existing facilities. Demand in the Alberta market is fundamentally driven by the underlying economic activity in the province. With strong growth in the oil sands and related industries ENMAX anticipates robust demand growth to continue.
AVERAGE NATURAL GAS PRICE$/GJ
0
3
6
9
2010 › 3.792009 › 3.762008 › 7.712007 › 6.112006 › 6.19
06 10
AVERAGE FLAT POOL PRICE$/MWh
0
20
40
60
80
100
2010 › 50.772009 › 47.842008 › 89.952007 › 66.842006 › 80.49
06 10

Management’s discussion and analysis. pg19 ENMAX Corporation 2010
1 Overview of the business environment (CONTINUED)
The utility industry is impacted by advancing environmental technologies. Changing government legislation and public perception drive requirements to upgrade existing and build new, more environmentally sensitive generation facilities. In Canada, different levels of government share jurisdiction over environmental affairs; and this is reflected in the environmental laws. This division of power grants both the federal and provincial governments legislative authority over the environment. For instance, provinces have traditionally handled electricity generation, while the Government of Canada is responsible for assuming Canada’s international commitments, such as the Canada-U.S. Air Quality Agreement. The Canadian Environmental Protection Act enables the Minister of the Environment to regulate toxic air emissions, including domestic emissions which may lead to air pollution in other countries. The Act empowers the federal government to establish a system of tradable units when controlling either domestic or international air pollution. It also allows the Minister of the Environment to enter into agreements with provincial governments regarding the execution and admin-istration of some of these responsibilities. This may lead to a cap and trade system to manage greenhouse gas emissions, similar to programs being implemented in other parts of the world. The federal government has indicated that it will not adopt a cap and trade system unless such a system is also adopted by the United States. Instead, the federal government has indicated that it will pass regulation requiring all existing coal-fired generation to physically shut down by the end of the coal-fired unit’s economic life (45 years) or the end of the associated PPA, whichever is longer, unless it can meet the greenhouse gas (GHG) emissions standard of natural gas combined cycle generating unit. These emerging regulations will impact future decisions on new generation facilities in Alberta. Alternative energy and carbon capture technologies are developing. ENMAX has implemented a long-term strategy to further the development of alternative energy technologies.
In early 2010, the Alberta Government requested the AUC complete a Smart Grid strategy review for the Province. This was a follow-up from the Department of Energy (DOE) study in advanced meters. The Corpo-ration participated in this process by contributing both a written submission and participating in the hearing process in October 2010. The final report from the DOE and AUC has not yet been released.
While a general economic slowdown has continued over the last few years, competition for skilled labour, component parts and raw materials remains stretched for building major projects. This competition is more than a local phenomenon. The global demand for energy has increased construction of large scale energy projects worldwide and increased competition for key equipment, as well as led to longer waits to obtain generating components. The current regulatory process for obtaining approval to build generating facilities also requires developers to incur substantial engineering, legal and permitting costs before a project even embarks on the construction phase. Most suppliers of key generating components are resident outside of Canada, which results in additional foreign exchange risks and costs related to managing this foreign exchange exposure. This has an increasingly larger impact to ENMAX with the new SEC and BEC facility projects continuing development.
2 Overall financial performance
SELECTED CONSOLIDATED FINANCIAL INFORMATION
YEAR ENDED DECEMBER 31, 2010 2009
(millions of dollars)
Total revenue 2,404.2 2,354.9Operating margin (1) 644.3 682.6EBITDA (1) 427.0 459.6Income before discontinued operations 181.2 206.6Net earnings 177.8 205.9Total assets 3,882.9 3,744.3Total long-term financial liabilities 1,443.2 1,343.8Funds generated from operations (1) 346.9 361.1Cash provided by operating activities 320.2 283.6
(1) Non-GAAP financial measure. See discussion that follows in Section 5: Non-GAAP Financial Measures.

Management’s discussion and analysis. pg20 ENMAX Corporation 2010
Management’s discussion and analysis.
2 Overall financial performance (CONTINUED)
ENMAX’s consolidated net earnings for the year ended December 31, 2010 have decreased to $177.8 million compared with $205.9 million for the year ended December 31, 2009. This decrease was driven primarily by declines in EBITDA as a result of one-time gains experienced in 2009 not recurring in 2010, including gains on foreign exchange exposures and impacts of rate increases related to prior periods. The decrease in earnings due to these items was offset by an increase in electricity and transmission and distribution margins as the Corporation continues to grow market share within the Alberta marketplace.
ENMAX’s results of operations are not necessarily indicative of future performance due to fluctuating commodity prices and the addition of new generation facilities. Further details on specific operations can be found in Section 3: Business Segment Results.
A reconciliation of earnings before interest and income taxes (EBIT) for the year ended December 31, 2010, as compared with 2009 is as follows:
(millions of dollars)
EBIT for the period ended December 31, 2009 324.4Unusual items included in 2009 results: Rate increases related to prior periods (21.7) Gains from foreign exchange exposures and financial instruments (57.0)
EBIT for the period ended December 31, 2009 excluding unusual items 245.7 Increased / (decreased) margins attributable to: Electricity 23.9 Natural gas (1.4) Transmission and distribution 13.2 Contractual services and other 12.2 Increased expenses: OM&A (1.8) Amortization (30.2)
EBIT for the period ended December 31, 2010 261.6
UNUSUAL ITEMS INCLUDED IN 2009 RESULTS
In 2009, the regulator approved the FBR application, with adjustments, retroactive to January 1, 2007. The regulatory decision generated a revenue increase to retroactively recover costs incurred in 2007 and 2008 in the regulated transmission and distribution businesses in the amount of $23.8 million. Hearing costs are associated with these additional revenues totaled $2.1 million.
During 2009, the Corporation recorded foreign exchange gains of $39.7 million relating to both U.S. dollar and Japanese Yen denominated purchase agreements for certain generation equipment. The Corporation also recorded gains and losses from financial instruments of $22.7 million associated with an interest rate swap on the non-recourse financing acquired with the CEC facility. Finally, the Corporation recorded foreign exchange losses of $5.4 million relating to U.S. dollar denominated futures margin trading account. In the second half of 2009, these financial exposures were substantially hedged, so earnings exposure in 2010 has been minimized.
NORMALIZED EBIT
Electricity margins increased $23.9 million for the year ended December 31, 2010, from $384.5 million in the year ended December 31, 2009. The increased margins were driven primarily by the combination of higher sales volumes in the industrial, commercial and institutional segment and higher sales volumes on variable and month-ahead priced contracts. In addition to this, margins increased as a result of higher settled pool prices in the second quarter of the year. These factors were partly offset by the impact of a higher percentage of total sales volumes being generated by lower margin variable-priced contracts.

Management’s discussion and analysis. pg21 ENMAX Corporation 2010
2 Overall financial performance (CONTINUED)
Natural gas margins decreased $1.4 million for the year ended December 31, 2010, from $7.2 million in 2009. Lower fixed-price sales volumes as a percentage of total sales mix in conjunction with a depressed spot price for natural gas were seen through the year, which had an adverse impact on margins. These factors were offset by an increase in total volumes from new customers from ENMAX Energy’s industrial, commercial and institutional division.
For the year ended December 31, 2010, normal transmission and distribution margins increased $13.2 million over the $167.9 million recorded in 2009, excluding rate increases related to prior periods. Normal transmis-sion and distribution margins have increased due to an increase in tariff and transmission rates and an increase in delivery volumes.
For the year ended December 31, 2010, normal margins from contractual services and other sources increased $12.2 million from the $36.8 million recorded in 2009, excluding $62.4 million in gains from foreign exchange exposures and financial instruments. The increase in normal margins was mainly due to higher residential development activity and Calgary Transit activity, an increase in customer base in the Corporation’s high speed data and internet division and optimization of emissions offsets.
Normal OM&A costs for the year ended December 31, 2010 increased $1.8 million from $215.5 million for the same period in 2009, excluding $7.5 million in 2009 unusual items. Unusual items in 2009 included net realized and unrealized foreign exchange losses prior to exposures being substantially hedged and hearing costs incurred in relation to the retroactive regulatory rate recovery. The increase in normal OM&A costs were driven by higher bad debts expense, higher costs related to maintenance outages at the CEC facility and expenses incurred in relation to a transformer replacement incident. These factors were partially offset by continued cost control initiatives.
Amortization expense for the year ended December 31, 2010 increased $30.2 million from $135.2 million for the same period in 2009. The increase in amortization was primarily a result of incremental Battle River PPA ownership, two additional energy projects achieving commercial operation date (COD) in December 2009 and June 2010, as well as additional transmission and distribution assets being placed into service. Amortiza-tion was also impacted by a review of useful life estimates which changed the amortization rates used by the Corporation for certain assets, as noted in Section 9 of this MD&A, and a write down of IT assets no longer in use. This increase was partially offset by older assets concluding their depreciable lives.
OTHER NET EARNINGS ITEMS
For the year ended December 31, 2010, interest expense increased $8.0 million from $54.0 million for the same period in 2009. The increase was primarily due to debt acquired in relation to the expansion of the transmission and distribution networks and additional general borrowings, in addition to higher financing charges. This increase was partially offset by a decrease in project specific financing and an increase in capi-talized interest. While general borrowings have increased, a portion of the cost of these borrowings are associated with capital projects under construction and therefore capitalized to those projects.
Income tax expense for the year ended December 31, 2010 decreased $45.4 million from $63.8 million in the same period in 2009. This decline was primarily due to a $32.2 million tax provision adjustment recorded in 2009 which did not recur in 2010 and tax effects of the unusual gains from foreign exchange and financial instrument exposures in 2009.
Losses from discontinued operations for the year ended December 31, 2010 increased $2.7 million from a $0.7 million loss in 2009. The increased losses were primarily a result of higher non-capital costs incurred during the completion of the Clowhom project, offset by operating earnings from the commissioning date to year end. Discontinued operations include the results of operations and gains on disposal of the British Columbia assets sold during the year and the results of operations on the British Columbia assets sold subsequent to the year end.

Management’s discussion and analysis. pg22 ENMAX Corporation 2010
Management’s discussion and analysis.
2 Overall financial performance (CONTINUED)
OTHER COMPREHENSIVE INCOME
Other comprehensive income illustrates the Corporation’s earnings under the assumption of full income recognition of gains and losses on securities and derivatives otherwise treated as hedges of future period revenues and expenses. The Corporation utilizes derivatives to hedge its electricity, natural gas, interest rates and foreign exchange exposures. For the year ended December 31, 2010, other comprehensive income totaled a loss of $15.3 million compared with a loss of $11.1 million for the same period in 2009. The loss in the year primarily reflects the decrease in natural gas prices from the previous year.
3 Business segment results
The operating businesses of the Corporation are managed principally in two segments, ENMAX Energy and ENMAX Power. The results of those segments are discussed in the comments that follow.
EBIT
NORMALIZED YEAR ENDED DECEMBER 31 2010 2009 (1)
(millions of dollars)
ENMAX Energy 191.2 184.9ENMAX Power 62.3 61.3Corporate & intersegment eliminations 8.1 (0.5)
EBIT 261.6 245.7
(1) 2009 EBIT have been normalized for the unusual items discussed in Section 2: Overall Financial Performance.
ENMAX ENERGY
Strategy
ENMAX Energy is Alberta’s leading competitive electricity retailer. In addition to electricity, ENMAX Energy provides natural gas, renewable energy and value-added services to residential, commercial and industrial customers throughout Alberta. ENMAX Energy is also involved with the generation of electricity in Alberta. ENMAX Energy controls its physical electricity supply through PPAs and through owned generation capacity. Natural gas is purchased on the wholesale market with terms and conditions to meet the sales commitments made by retail marketing operations and for the operational requirements of its gas-fired generating facilities. Risk management processes and systems are in place to carefully monitor and manage price and commodity risks inherent in the business.
ENMAX Energy produces or has exclusive access to approximately 2,067 MW of electricity generation to supply customer demand. ENMAX Energy contracts low-cost, reliable electricity from the Keephills and Battle River coal-fired facilities. This is complemented by 420 MW of natural gas-fired generation to meet demand through natural gas-fired CEC and Crossfield. Through a subsidiary, it is one of Alberta’s largest investors in renewable energy with 50% ownership of the McBride Lake Wind Farm and 100% ownership of the Taber and Kettles Hill wind farms (Taber and Kettles).
ENMAX Energy is committed to providing its customers with innovative product offerings and flexible solu-tions and facilitates its customers’ education surrounding reduction in their energy consumption. ENMAX Energy offers products and services to meet residential consumers’ needs for flexibility in pricing options and contract terms while retaining the freedom to change suppliers without penalty. ENMAX implemented a new billing system, launched in February 2009, which provided enhancements to the customer enrolment and billing process. ENMAX Energy continuously monitors developments in emerging and proven technologies with a view to considering how these technologies can be used to deliver value-added products and services to its customers.
Management’s discussion and analysis. pg23 ENMAX Corporation 2010
3 Business segment results (CONTINUED)
As a wholesale market participant, PPA buyer and competitive retailer, ENMAX Energy is subject to all of the rules and regulations of the competitive electricity market, including codes of conduct (which establish, among other things, limits on the sharing of information between the regulated and non-regulated business units within ENMAX). As with other market participants, ENMAX Energy’s compliance with the rules is subject to scrutiny by the Market Surveillance Administrator (MSA).
Operating results
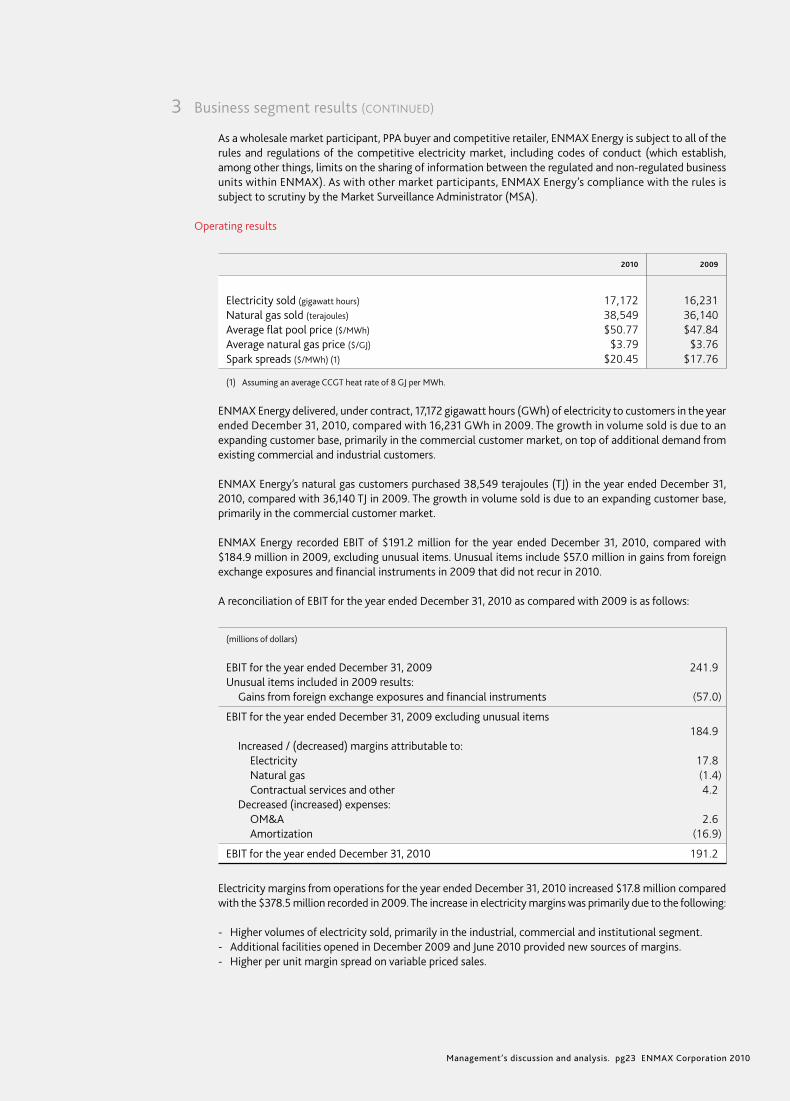
2010 2009
Electricity sold (gigawatt hours) 17,172 16,231Natural gas sold (terajoules) 38,549 36,140Average flat pool price ($/MWh) $50.77 $47.84Average natural gas price ($/GJ) $3.79 $3.76Spark spreads ($/MWh) (1) $20.45 $17.76
(1) Assuming an average CCGT heat rate of 8 GJ per MWh.
ENMAX Energy delivered, under contract, 17,172 gigawatt hours (GWh) of electricity to customers in the year ended December 31, 2010, compared with 16,231 GWh in 2009. The growth in volume sold is due to an expanding customer base, primarily in the commercial customer market, on top of additional demand from existing commercial and industrial customers.
ENMAX Energy’s natural gas customers purchased 38,549 terajoules (TJ) in the year ended December 31, 2010, compared with 36,140 TJ in 2009. The growth in volume sold is due to an expanding customer base, primarily in the commercial customer market.
ENMAX Energy recorded EBIT of $191.2 million for the year ended December 31, 2010, compared with $184.9 million in 2009, excluding unusual items. Unusual items include $57.0 million in gains from foreign exchange exposures and financial instruments in 2009 that did not recur in 2010.
A reconciliation of EBIT for the year ended December 31, 2010 as compared with 2009 is as follows:
(millions of dollars)
EBIT for the year ended December 31, 2009 241.9Unusual items included in 2009 results: Gains from foreign exchange exposures and financial instruments (57.0)
EBIT for the year ended December 31, 2009 excluding unusual items 184.9 Increased / (decreased) margins attributable to: Electricity 17.8 Natural gas (1.4) Contractual services and other 4.2 Decreased (increased) expenses: OM&A 2.6 Amortization (16.9)
EBIT for the year ended December 31, 2010 191.2
Electricity margins from operations for the year ended December 31, 2010 increased $17.8 million compared with the $378.5 million recorded in 2009. The increase in electricity margins was primarily due to the following:
- Higher volumes of electricity sold, primarily in the industrial, commercial and institutional segment.- Additional facilities opened in December 2009 and June 2010 provided new sources of margins.- Higher per unit margin spread on variable priced sales.

Management’s discussion and analysis. pg24 ENMAX Corporation 2010
Management’s discussion and analysis.
3 Business segment results (CONTINUED)
These margin increases were partially offset by the following:
- Lower fixed contract volumes on existing customers and lower fixed contract volumes as a percentage of total volume sales mix.
- Losses on the settlement and dedesignation of hedges as a result of a downward shifting forward curve for both electricity and natural gas.
Natural gas margins were $5.8 million for the year ended December 31, 2010, compared with $7.2 million last year. Lower fixed-price sales volumes as a percentage of total sales mix were seen during the year as customers opted for variable price plans given low market prices. As the majority of volumes during the year were supplied under fixed-price input contracts, there has been a decline in margin from selling these volumes at a lower market price. These margin variances were partially offset by higher volumes as a result of an increase in the number of customer sites, including one large customer in the industrial, commercial and institutional segment and lower fixed fees and pipeline charges.
Normal contractual services margin and other revenues increased $4.2 million in the year ended December 31, 2010 compared to 2009, excluding $62.4 million in gains from unusual foreign exchange exposures and financial instruments. This increase was due to an increase in customer base in the Corporation’s high speed data and internet division.
Normal OM&A expenses from operations decreased $2.6 million in the year ended December 31, 2010 compared to 2009, excluding $5.4 million in losses from unusual foreign exchange exposures. This decrease was primarily attributable to lower staffing, marketing and sponsorship costs as well as lower costs related to the billing system implemented in 2009. These declines were partially offset by higher contractor expense as a result of the COD of two new plants in the past 13 months and higher consulting costs, primarily due to maintenance shutdowns at the CEC facility in the first half of 2010.
ENMAX POWER
Strategy
ENMAX Power’s objective is to maintain the high reliability of its transmission and distribution system, while meeting the challenges of growing infrastructure as Calgary expands. Significant projects to accommodate this growth are expected over the next five years including expenditures to provide new customers with access to the electrical distribution system within the city and major transmission projects required to replace aging infrastructure and handle additional load requirements within the city.
Distribution projects include both residential and non-residential development and system infrastructure required to continue providing safe and reliable service to new and existing customers in an urban environ-ment. Also included are asset replacement and modification required to meet industry standards and safety codes and distribution automation projects.
Major transmission projects required to meet both load growth within Calgary as well as to replace aging infrastructure include the downtown cable replacement, 69 kV south conversion, south source 240 kV trans-mission line, east Calgary line upgrades, generation driven upgrades and new substations and substation upgrades to handle the additional transmission requirements. Several of these projects are already under construction; others will be initiated over the 2011 to 2015 timeframe.
As an owner of transmission and distribution assets, ENMAX Power is subject to regulation by the AUC. ENMAX Power works with the AUC and consumer representatives to identify and act on opportunities to enhance the efficiency of the Alberta regulatory process with a view to ensuring customers in Alberta receive the most cost effective service.

Management’s discussion and analysis. pg25 ENMAX Corporation 2010
3 Business segment results (CONTINUED)
Operating Results
2010 2009
(millions of dollars, unless otherwise stated)
Electricity sold through the Regulated Rate Options (RRO) (gigawatt hours) 2,295 2,311 Distribution volumes (gigawatt hours) 9,080 8,971Distribution system circuit lines (kilometres) 7,612 7,523Transmission system lines (kilometres) 288 281Distribution capital structure (debt: equity) 59%:41% 59%:41%Transmission capital structure (debt: equity) 63%:37% 63%:37%Distribution average rate base $713.0 $649.9Transmission average rate base $157.8 $133.2Local access fees collected on behalf of The City $97.4 $107.6
RRO electricity volumes sold declined slightly from 2,295 GWh in 2010 compared with 2,311 GWh in 2009. This decline was a result of reduced electricity consumption per site in the Calgary service area.
Total electricity consumption in the Calgary service area increased slightly from the prior year with electricity volumes delivered during the year ended December 31, 2010 at 9,080 GWh compared with 8,971 GWh in 2009.
ENMAX Power’s rate base increased for both transmission and distribution due to capital additions during the year.
ENMAX Power’s financial results are driven by tariffs approved by the AUC for regulated transmission, distri-bution, and RRO businesses, as well as earnings from its non-regulated power services business. The regulated segment accounted for 90% of ENMAX Power’s total revenue in the year ended December 31, 2010, compared with 91% in 2009.
ENMAX Power recorded EBIT of $62.3 million in the year ended December 31, 2010, compared with $61.3 million in the same period last year, excluding unusual items. Unusual items include the impact of the rate increase related to prior periods that was realized in 2009 but did not recur in 2010. The net impact of the prior period rate increase in 2009 was $21.7 million, consisting of $23.8 million additional transmission and distribution margins net $2.1 million additional OM&A costs.
A reconciliation of EBIT for the year ended December 31, 2010 as compared with 2009 is as follows:
(millions of dollars)
EBIT for the period ended December 31, 2009 83.0Unusual items included in 2009 results: Rate increases related to prior periods (21.7)
EBIT for the period ended December 31, 2009 excluding unusual items 61.3 Increased margins attributable to: Electricity 6.2 Transmission and distribution 13.2 Contractual services and other 4.0 Increased expenses: OM&A (10.9) Amortization (11.5)
EBIT for the period ended December 31, 2010 62.3
Management’s discussion and analysis. pg26 ENMAX Corporation 2010
Management’s discussion and analysis.
3 Business segment results (CONTINUED)
Electricity margins from RRO customers increased $6.2 million to $12.5 million for the year ended December 31, 2010, compared with $6.3 million in 2009. This increased margin was primarily the result of a higher spread obtained between input costs and the regulated rate. Also impacting the increased RRO margins was the 2009 write-off of stranded wire costs identified on implementation of the new billing system that did not recur in 2010.
Transmission and distribution margins are comprised of amounts charged for wires services, net of electrical grid charges and local access fees. Normal transmission and distribution margins increased $13.2 million to $181.1 million for the year ended December 31, 2010, compared with $167.9 million in 2009, excluding $23.8 million in unusual rate increases related to prior periods. This increase was due primarily to an increase to volumes, site counts and tariff rates.
For the year ended December 31, 2010, margins for contractual services and other were $18.7 million compared with $14.7 million last year. The increased margins were driven by higher activity levels and in new residential and commercial real estate development and Calgary LRT projects. There has been a modest improvement in this activity as the economic slowdown experienced in Calgary in 2009 has not continued into 2010 in the real estate industry. The unregulated segment of the business commenced work in conjunction with the start of construction of the west leg of the LRT system in Calgary, the largest LRT project in decades, which has provided additional margin.
Normal OM&A expenses for the year ended December 31, 2010 increased $10.9 million to $97.4 million, compared with $86.5 million in 2009, excluding $2.1 million of costs related to the 2009 prior period rate increase. This increase was driven primarily by higher bad debt expenses, an increase in staffing costs and charges incurred as a result of a transformer replacement incident. These increases were partly offset by lower costs of the new billing system implemented in 2009.
Amortization for the year ended December 31, 2010 totaled $52.6 million, compared with $41.1 million in 2009. The increased charges were the result of an increase of $132.0 million in the asset base from the previous year, reflecting capital maintenance replacement and expansion of the Calgary and area transmission and distribution system. The amortization related to those new assets put into service was mostly offset by older assets concluding their depreciable lives.
ENMAX CORPORATE (INCLUDING INTERSEGMENT ELIMINATIONS)
ENMAX Corporate provides shared services and financing to ENMAX Power and ENMAX Energy. During the year ended December 31, 2010, EBIT for ENMAX Corporate were $8.1 million compared with a loss of $0.5 million in 2009. The increase in earnings reflects lower OM&A costs due to implementation of cost control measures and higher interest revenue on investments due to higher cash balances throughout the year.
Management’s discussion and analysis. pg27 ENMAX Corporation 2010
4 Selected quarterly financial data
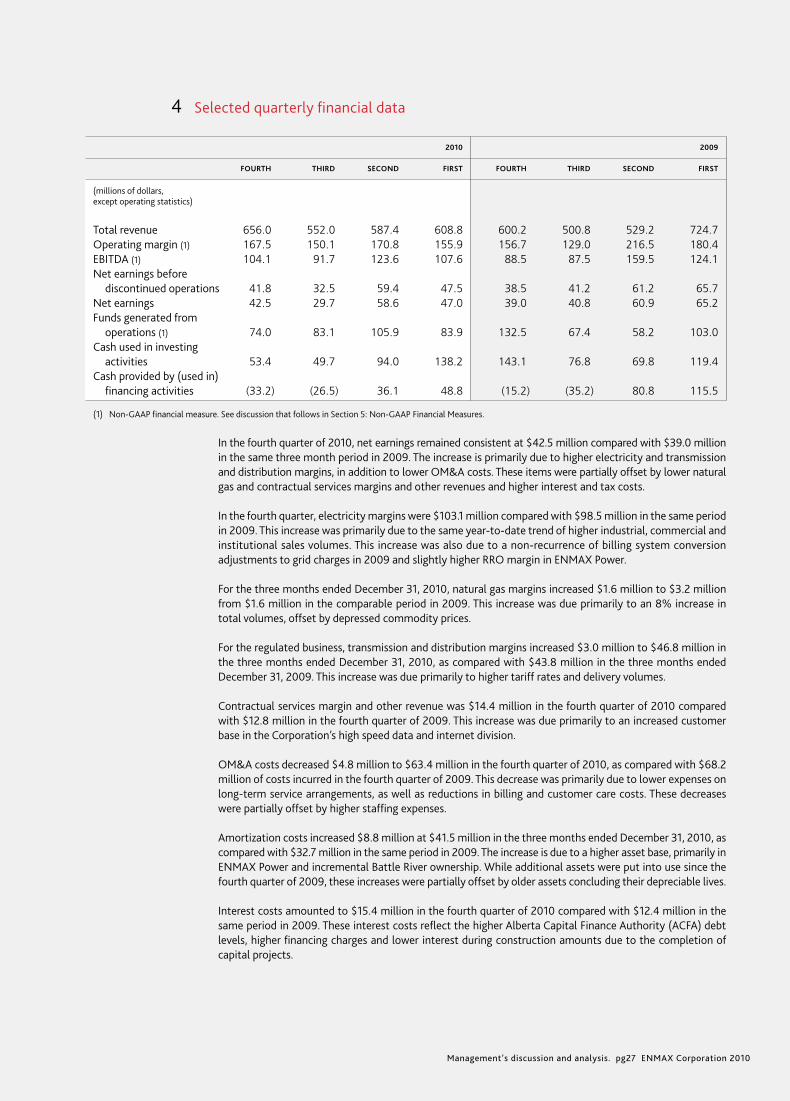
2010 2009
FOURTH THIRD SECOND FIRST FOURTH THIRD SECOND FIRST
(millions of dollars, except operating statistics)
Total revenue 656.0 552.0 587.4 608.8 600.2 500.8 529.2 724.7Operating margin (1) 167.5 150.1 170.8 155.9 156.7 129.0 216.5 180.4EBITDA (1) 104.1 91.7 123.6 107.6 88.5 87.5 159.5 124.1Net earnings before discontinued operations 41.8 32.5 59.4 47.5 38.5 41.2 61.2 65.7Net earnings 42.5 29.7 58.6 47.0 39.0 40.8 60.9 65.2Funds generated from operations (1) 74.0 83.1 105.9 83.9 132.5 67.4 58.2 103.0Cash used in investing activities 53.4 49.7 94.0 138.2 143.1 76.8 69.8 119.4Cash provided by (used in) financing activities (33.2) (26.5) 36.1 48.8 (15.2) (35.2) 80.8 115.5
(1) Non-GAAP financial measure. See discussion that follows in Section 5: Non-GAAP Financial Measures.
In the fourth quarter of 2010, net earnings remained consistent at $42.5 million compared with $39.0 million in the same three month period in 2009. The increase is primarily due to higher electricity and transmission and distribution margins, in addition to lower OM&A costs. These items were partially offset by lower natural gas and contractual services margins and other revenues and higher interest and tax costs.
In the fourth quarter, electricity margins were $103.1 million compared with $98.5 million in the same period in 2009. This increase was primarily due to the same year-to-date trend of higher industrial, commercial and institutional sales volumes. This increase was also due to a non-recurrence of billing system conversion adjustments to grid charges in 2009 and slightly higher RRO margin in ENMAX Power.
For the three months ended December 31, 2010, natural gas margins increased $1.6 million to $3.2 million from $1.6 million in the comparable period in 2009. This increase was due primarily to an 8% increase in total volumes, offset by depressed commodity prices.
For the regulated business, transmission and distribution margins increased $3.0 million to $46.8 million in the three months ended December 31, 2010, as compared with $43.8 million in the three months ended December 31, 2009. This increase was due primarily to higher tariff rates and delivery volumes.
Contractual services margin and other revenue was $14.4 million in the fourth quarter of 2010 compared with $12.8 million in the fourth quarter of 2009. This increase was due primarily to an increased customer base in the Corporation’s high speed data and internet division.
OM&A costs decreased $4.8 million to $63.4 million in the fourth quarter of 2010, as compared with $68.2 million of costs incurred in the fourth quarter of 2009. This decrease was primarily due to lower expenses on long-term service arrangements, as well as reductions in billing and customer care costs. These decreases were partially offset by higher staffing expenses.
Amortization costs increased $8.8 million at $41.5 million in the three months ended December 31, 2010, as compared with $32.7 million in the same period in 2009. The increase is due to a higher asset base, primarily in ENMAX Power and incremental Battle River ownership. While additional assets were put into use since the fourth quarter of 2009, these increases were partially offset by older assets concluding their depreciable lives.
Interest costs amounted to $15.4 million in the fourth quarter of 2010 compared with $12.4 million in the same period in 2009. These interest costs reflect the higher Alberta Capital Finance Authority (ACFA) debt levels, higher financing charges and lower interest during construction amounts due to the completion of capital projects.

Management’s discussion and analysis. pg28 ENMAX Corporation 2010
Management’s discussion and analysis.
4 Selected quarterly financial data (CONTINUED)
For the three months ended December 31, 2010, income tax expenses remained consistent with the previous year at $5.4 million as compared with $4.9 million in the same period in 2009. The slight increase was a result of higher earnings in the taxable business segments.
Gains from discontinued operations, net of tax, amounted to $0.7 million in the fourth quarter of 2010, as compared with $0.5 million in the same period in 2009. The increase is due to a gain on sale made of a specific British Columbia asset in the fourth quarter of 2010.
The Corporation invested $68.9 million in capital projects during the quarter including transmission ($20.1 million) and distribution ($21.4 million) projects, $14.1 million on new generation facilities, $5.9 million on environmental requirements for PPAs and $4.4 million on corporate information technology assets.
The Corporation made $17.8 million of regularly scheduled repayments on its long-term debt and its final $15.5 million dividend installment to The City, which results in payment in full of the 2010 declared dividend of $61.8 million.
The Corporation divested a portion of its generation assets in British Columbia for proceeds of $7.4 million.
5 Non-GAAP financial measures
The Corporation provides non-GAAP financial measures in the MD&A. These measures do not have any standard meaning prescribed by GAAP and may not be comparable to similar measures presented by other companies. The purpose of these financial measures and their reconciliation to GAAP financial measures are shown below. These non-GAAP measures are consistent with the measures used in previous years and quarters, with the exception of ‘Total interest cost’, which has been added during the current year in order to disclose inputs which help form the Corporation’s interest coverage ratios.
OPERATING MARGIN
YEAR ENDED DECEMBER 31, 2010 2009
(millions of dollars)
Electricity margins 408.4 384.5Natural gas margins 5.8 7.2Transmission and distribution margins 181.1 191.7Contractual services margins and other 49.0 99.2
Operating margin (non-GAAP financial measure) 644.3 682.6Deduct: OM&A, Amortization, Interest and Income taxes 463.1 476.0
Net earnings from continuing operations (GAAP financial measure) 181.2 206.6
Operating margins are a useful measure of business performance, as changes in the market price of electricity and natural gas purchased for resale affect both revenue and costs of sales. Operating margin better reflects the profitability of the Corporation’s business than revenue levels alone.

Management’s discussion and analysis. pg29 ENMAX Corporation 2010
5 Non-GAAP financial measures (CONTINUED)
EBITDA
YEAR ENDED DECEMBER 31, 2010 2009
(millions of dollars)
Adjusted EBITDA (non-GAAP financial measure) 425.4 461.4Deduct: EBITDA from discontinued operations (1.6) 1.8
Standardized EBITDA 427.0 459.6Deduct: Amortization 165.4 135.2 Interest 62.0 54.0 Income taxes 18.4 63.8
Net earnings from continuing operations (GAAP financial measure) 181.2 206.6
EBITDA is a useful measure of business performance as management believes it provides an indication of the operating results generated by the Corporation’s primary business activities without consideration as to how those activities are financed, amortized, or how the results are taxed in various business jurisdictions.
FUNDS GENERATED FROM OPERATIONS
YEAR ENDED DECEMBER 31, 2010 2009
(millions of dollars)
Funds generated from operations (non-GAAP financial measure) 346.9 361.1Changes in non-cash working capital (14.2) (66.6)Employee future benefits (12.5) (10.9)
Cash provided by operating activities (GAAP financial measure) 320.2 283.6
Funds generated from operations are used as an additional metric of cash flow without regard to changes in the Corporation’s non-cash working capital.
TOTAL INTEREST COST
YEAR ENDED DECEMBER 31, 2010 2009
(millions of dollars)
Total interest cost (non-GAAP financial measure) 79.3 72.7Ineffective portion of interest rate swaps (0.9) –Capitalized interest (21.3) (20.8)Other non-interest financing costs 4.9 2.1
Interest expense (GAAP financial measure) 62.0 54.0
Total interest cost is used to determine the Corporation’s interest coverage ratios.

Management’s discussion and analysis. pg30 ENMAX Corporation 2010
Management’s discussion and analysis.
6 Financial condition
Significant changes in the Corporation’s financial condition are as follows:
DECEMBER 31, DECEMBER 31, EXPLANATION 2010 2009 $ CHANGE % CHANGE FOR CHANGE
(millions of dollars, except % change)
ASSETS Cash and cash equivalents 65.8 55.7 10.1 18% See Section 7: Liquidity and capital resources
Accounts receivable 499.4 512.3 (12.9) (3%) Impact of lower commodity prices on revenues billed offset by higher regulatory receivables
Other current assets 103.2 99.8 3.4 3% Change in the fair value of short-term derivatives and unrealized hedging assets
Property, plant and equipment 2,273.6 2,054.5 219.1 11% Capital expenditures, net of amortization
Power purchase arrangements 517.0 504.7 12.3 2% Purchase of final 15% interest in Battle River PPA offset by amortization
Other long-term assets 28.0 81.0 (53.0) (65%) Change in the fair value of long-term derivatives and unrealized hedging assets
LIABILITIES AND SHAREHOLDER’S EQUITY
Short-term debt – 18.2 (18.2) (100%) No commercial paper or overdraft outstanding at the end of 2010. See Section 7: Liquidity and capital resources
Accounts payable and accrued liabilities 327.7 314.0 13.7 4% Payables and accruals due to construction projects offset by lower commodity prices
Long-term debt (1) 1,427.7 1,319.8 107.9 8% Long-term ACFA debt obtained in June offset by regularly scheduled debt repayments made
(1) Includes current and long-term amounts.
7 Liquidity and capital resources
CAPITALIZATION
DECEMBER 31, 2010 2009
(millions of dollars)
Total debt (1) 1,427.7 1,338.0Shareholder’s equity Share capital 280.1 280.1 Retained earnings 1,603.4 1,487.4 Accumulated other comprehensive loss (38.3) (23.0)
Total shareholder’s equity 1,845.2 1,744.5
Total capitalization (total debt plus shareholder’s equity) 3,272.9 3,082.5
(1) Includes short-term financing of $nil (2009 – $18.2 million) and current portion of long-term debt of $50.0 million (2009 – $46.1 million). Maturity dates range from January 2011 to June 2035. Excludes debt on assets held for sale.
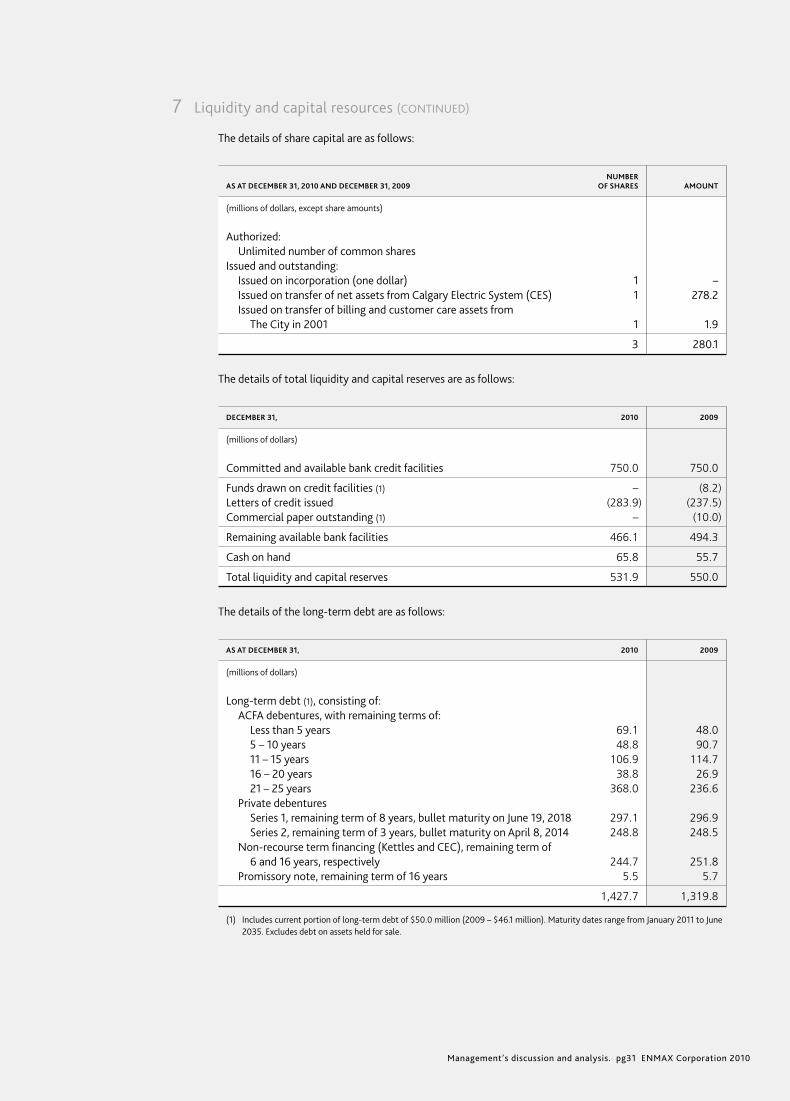
Management’s discussion and analysis. pg31 ENMAX Corporation 2010
7 Liquidity and capital resources (CONTINUED)
The details of share capital are as follows:
NUMBER AS AT DECEMBER 31, 2010 AND DECEMBER 31, 2009 OF SHARES AMOUNT
(millions of dollars, except share amounts)
Authorized: Unlimited number of common sharesIssued and outstanding: Issued on incorporation (one dollar) 1 – Issued on transfer of net assets from Calgary Electric System (CES) 1 278.2 Issued on transfer of billing and customer care assets from The City in 2001 1 1.9
3 280.1
The details of total liquidity and capital reserves are as follows:
DECEMBER 31, 2010 2009
(millions of dollars)
Committed and available bank credit facilities 750.0 750.0
Funds drawn on credit facilities (1) – (8.2)Letters of credit issued (283.9) (237.5)Commercial paper outstanding (1) – (10.0)
Remaining available bank facilities 466.1 494.3
Cash on hand 65.8 55.7
Total liquidity and capital reserves 531.9 550.0
The details of the long-term debt are as follows:
AS AT DECEMBER 31, 2010 2009
(millions of dollars)
Long-term debt (1), consisting of: ACFA debentures, with remaining terms of: Less than 5 years 69.1 48.0 5 – 10 years 48.8 90.7 11 – 15 years 106.9 114.7 16 – 20 years 38.8 26.9 21 – 25 years 368.0 236.6 Private debentures Series 1, remaining term of 8 years, bullet maturity on June 19, 2018 297.1 296.9 Series 2, remaining term of 3 years, bullet maturity on April 8, 2014 248.8 248.5 Non-recourse term financing (Kettles and CEC), remaining term of 6 and 16 years, respectively 244.7 251.8 Promissory note, remaining term of 16 years 5.5 5.7
1,427.7 1,319.8
(1) Includes current portion of long-term debt of $50.0 million (2009 – $46.1 million). Maturity dates range from January 2011 to June 2035. Excludes debt on assets held for sale.
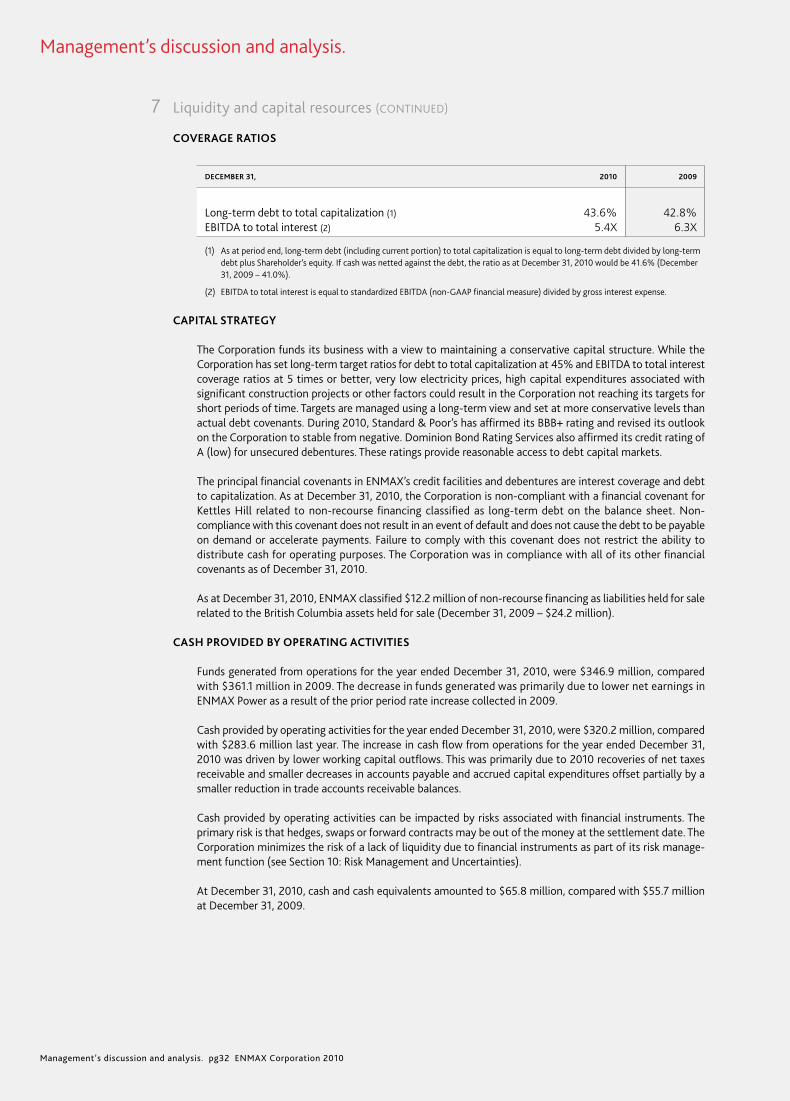
Management’s discussion and analysis. pg32 ENMAX Corporation 2010
Management’s discussion and analysis.
COVERAGE RATIOS
DECEMBER 31, 2010 2009
Long-term debt to total capitalization (1) 43.6% 42.8%EBITDA to total interest (2) 5.4X 6.3X
(1) As at period end, long-term debt (including current portion) to total capitalization is equal to long-term debt divided by long-term debt plus Shareholder’s equity. If cash was netted against the debt, the ratio as at December 31, 2010 would be 41.6% (December 31, 2009 – 41.0%).
(2) EBITDA to total interest is equal to standardized EBITDA (non-GAAP financial measure) divided by gross interest expense.
CAPITAL STRATEGY
The Corporation funds its business with a view to maintaining a conservative capital structure. While the Corporation has set long-term target ratios for debt to total capitalization at 45% and EBITDA to total interest coverage ratios at 5 times or better, very low electricity prices, high capital expenditures associated with significant construction projects or other factors could result in the Corporation not reaching its targets for short periods of time. Targets are managed using a long-term view and set at more conservative levels than actual debt covenants. During 2010, Standard & Poor’s has affirmed its BBB+ rating and revised its outlook on the Corporation to stable from negative. Dominion Bond Rating Services also affirmed its credit rating of A (low) for unsecured debentures. These ratings provide reasonable access to debt capital markets.
The principal financial covenants in ENMAX’s credit facilities and debentures are interest coverage and debt to capitalization. As at December 31, 2010, the Corporation is non-compliant with a financial covenant for Kettles Hill related to non-recourse financing classified as long-term debt on the balance sheet. Non-compliance with this covenant does not result in an event of default and does not cause the debt to be payable on demand or accelerate payments. Failure to comply with this covenant does not restrict the ability to distribute cash for operating purposes. The Corporation was in compliance with all of its other financial covenants as of December 31, 2010.
As at December 31, 2010, ENMAX classified $12.2 million of non-recourse financing as liabilities held for sale related to the British Columbia assets held for sale (December 31, 2009 – $24.2 million).
CASH PROVIDED BY OPERATING ACTIVITIES
Funds generated from operations for the year ended December 31, 2010, were $346.9 million, compared with $361.1 million in 2009. The decrease in funds generated was primarily due to lower net earnings in ENMAX Power as a result of the prior period rate increase collected in 2009.
Cash provided by operating activities for the year ended December 31, 2010, were $320.2 million, compared with $283.6 million last year. The increase in cash flow from operations for the year ended December 31, 2010 was driven by lower working capital outflows. This was primarily due to 2010 recoveries of net taxes receivable and smaller decreases in accounts payable and accrued capital expenditures offset partially by a smaller reduction in trade accounts receivable balances.
Cash provided by operating activities can be impacted by risks associated with financial instruments. The primary risk is that hedges, swaps or forward contracts may be out of the money at the settlement date. The Corporation minimizes the risk of a lack of liquidity due to financial instruments as part of its risk manage-ment function (see Section 10: Risk Management and Uncertainties).
At December 31, 2010, cash and cash equivalents amounted to $65.8 million, compared with $55.7 million at December 31, 2009.
7 Liquidity and capital resources (CONTINUED)

Management’s discussion and analysis. pg33 ENMAX Corporation 2010
INVESTING ACTIVITIES
Capital spending was $383.8 million in the year ended December 31, 2010, a decrease of $95.7 million over last year. Capital projects for the year ended December 31, 2010 included a $132.0 million investment in the transmission and distribution network in Calgary and surrounding area, $155.2 million in construction costs related to Calgary area generation projects and $18.5 million in information technology expansion. The investment in the transmission and distribution network in Calgary allows ENMAX Power to provide more reliable service to existing customer sites and expand its service areas to newly developed parts of the city. The investment in the Calgary area generation projects allows ENMAX Energy to serve its growing customer base with more environmentally sensitive forms of generation. The investment in information technology will allow ENMAX to comply with regulations and effectively operate the business. Investing activities for the year ended December 31, 2010 also included the acquisition of the final 15% incremental interest in the Battle River PPA for a cost of $64.0 million. This purchase will supply ENMAX Energy with additional capacity to serve its customer base.
FINANCING ACTIVITIES
ENMAX repaid $48.1 million of long-term debt in regularly scheduled principal payments during the year ended December 31, 2010, compared with $45.9 million in 2009. These repayments were sourced through operating activities.
During the year ended December 31, 2010, the Corporation obtained $156.0 million of financing from The City through arrangements with the ACFA to fund continued investment relating to the regulated transmis-sion and distribution network in Calgary and surrounding area.
On March 16, 2010, ENMAX declared a dividend for 2010 of $61.8 million to The City, its sole Shareholder. The dividend is $6.8 million more than what was declared in 2009 and was paid in equal quarterly install-ments during 2010. On March 9, 2011, the Corporation declared a dividend of $55.6 million payable to The City in four quarterly installments.
8 Future accounting changes
INTERNATIONAL FINANCIAL REPORTING STANDARDS (IFRS)
On February 13, 2008, the Accounting Standards Board of Canada (AcSB) confirmed the changeover from GAAP to International Financial Reporting Standards (IFRS), as issued by the International Accounting Standards Board (IASB), will be effective for fiscal years beginning on or after January 1, 2011. On September 30, 2010, the AcSB issued an amendment to this directive which allows entities that have activities subject to rate regulation to delay adoption of IFRS until January 1, 2012. The Corporation will be required to apply IFRS in reporting interim and annual consolidated financial statements, including comparative periods, beginning January 1, 2012. While IFRS uses a conceptual framework similar to GAAP, there are still differences in accounting policies.
7 Liquidity and capital resources (CONTINUED)
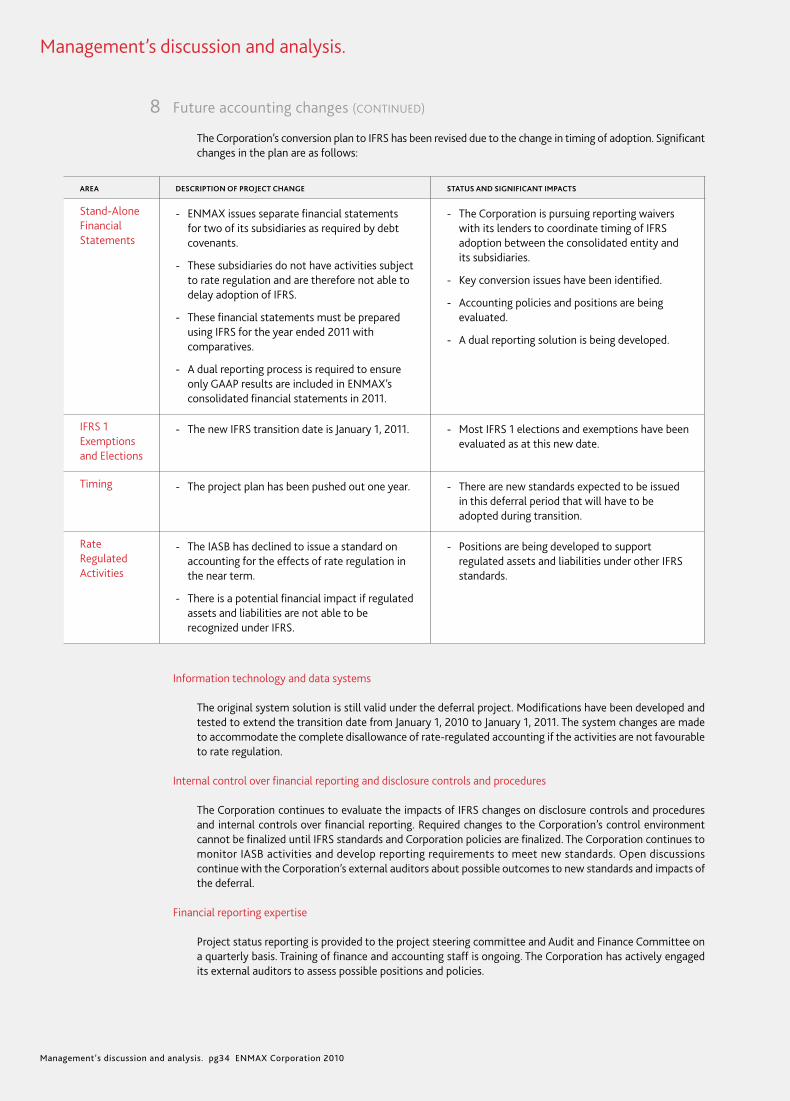
Management’s discussion and analysis. pg34 ENMAX Corporation 2010
Management’s discussion and analysis.
8 Future accounting changes (CONTINUED)
The Corporation’s conversion plan to IFRS has been revised due to the change in timing of adoption. Significant changes in the plan are as follows:
AREA DESCRIPTION OF PROJECT CHANGE STATUS AND SIGNIFICANT IMPACTS
Stand-Alone Financial Statements
- ENMAX issues separate financial statements for two of its subsidiaries as required by debt covenants.
- These subsidiaries do not have activities subject to rate regulation and are therefore not able to delay adoption of IFRS.
- These financial statements must be prepared using IFRS for the year ended 2011 with comparatives.
- A dual reporting process is required to ensure only GAAP results are included in ENMAX’s consolidated financial statements in 2011.
- The Corporation is pursuing reporting waivers with its lenders to coordinate timing of IFRS adoption between the consolidated entity and its subsidiaries.
- Key conversion issues have been identified.
- Accounting policies and positions are being evaluated.
- A dual reporting solution is being developed.
IFRS 1 Exemptions and Elections
- The new IFRS transition date is January 1, 2011. - Most IFRS 1 elections and exemptions have been evaluated as at this new date.
Timing - The project plan has been pushed out one year. - There are new standards expected to be issued in this deferral period that will have to be adopted during transition.
Rate Regulated Activities
- The IASB has declined to issue a standard on accounting for the effects of rate regulation in the near term.
- There is a potential financial impact if regulated assets and liabilities are not able to be recognized under IFRS.
- Positions are being developed to support regulated assets and liabilities under other IFRS standards.
Information technology and data systems
The original system solution is still valid under the deferral project. Modifications have been developed and tested to extend the transition date from January 1, 2010 to January 1, 2011. The system changes are made to accommodate the complete disallowance of rate-regulated accounting if the activities are not favourable to rate regulation.
Internal control over financial reporting and disclosure controls and procedures
The Corporation continues to evaluate the impacts of IFRS changes on disclosure controls and procedures and internal controls over financial reporting. Required changes to the Corporation’s control environment cannot be finalized until IFRS standards and Corporation policies are finalized. The Corporation continues to monitor IASB activities and develop reporting requirements to meet new standards. Open discussions continue with the Corporation’s external auditors about possible outcomes to new standards and impacts of the deferral.
Financial reporting expertise
Project status reporting is provided to the project steering committee and Audit and Finance Committee on a quarterly basis. Training of finance and accounting staff is ongoing. The Corporation has actively engaged its external auditors to assess possible positions and policies.
Management’s discussion and analysis. pg35 ENMAX Corporation 2010
8 Future accounting changes (CONTINUED)
Business activities
The IASB has discontinued deliberation on the introduction of a standard for rate-regulated operations and the recognition of regulatory assets and liabilities. The IASB has not determined what the future project will look like or the timing of this project. The IFRS project team continues to develop plans to support accounting and business processes should rate-regulated accounting be discontinued.
The Corporation continues to evaluate the impact of IFRS on its debt covenants, compensation agreements and dividend policy.
GAAP
The Canadian Institute of Chartered Accountants (CICA) has issued amendments to standards in addition to new standards and abstracts that will be required to be adopted under GAAP for fiscal periods beginning on January 1, 2011. These include: EIC-175 “Multiple Deliverable Revenue Arrangements”, Section 1582 “Business Combinations”, Section 1601 “Consolidated Financial Statements”, Section 1602 “Non-Controlling Interests” and amendments to Sections 1625, 3251 and 3855.
EIC-175 “Multiple Deliverable Revenue Arrangements” is applied prospectively and should be applied to revenue arrangements with multiple deliverables entered into or materially modified in the first annual fiscal period beginning on or after January 1, 2011. This standard was added to address some of the aspects of accounting by a vendor for arrangements under which it will perform multiple revenue generating activities. The Corporation currently has instances where this section applies, most notably ENMAX Envision and ENMAX Energy’s emerging distributed generation business. The Corporation has determined that this change will not have an overall significant impact on the consolidated financial statements of the Corporation in 2011.
CICA Handbook Section 1582 ‘‘Business Combinations’’ is effective for business combinations with an acquisi-tion date after January 1, 2011. This standard was amended to require additional use of fair value measurements, recognition of additional assets and liabilities and increased disclosure. Adopting this standard is expected to have a material effect on the way the Corporation accounts for future business combinations. Entities adopting Section 1582 will also be required to adopt CICA Handbook Sections 1601 ‘‘Consolidated Financial Statements’’ and 1602 ‘‘Non-Controlling Interests’’. These standards will require a change in the measurement of non-controlling interest and will require the change to be presented as part of Shareholder’s equity on the balance sheet. In addition, the income statement of the controlling parent will include 100% of the subsidiary’s results and present the allocation between the controlling interest and non-controlling interest. Currently, the Corporation has no significant non-controlling interest and therefore adoption of these new standards will have no impact. These standards will be effective January 1, 2011, with early adoption permitted. The changes resulting from adopting Section 1582 will be applied prospectively and the changes from adopting Sections 1601 and 1602 will be applied retrospectively.
CICA Handbook Section 1625 “Comprehensive Revaluation of Assets and Liabilities” applies prospectively to comprehensive revaluations of assets and liabilities occurring in fiscal years beginning on or after January 1, 2011. This standard was amended to remove the discussion on non-controlling interest, as this is now being discussed in CICA Handbook Section 1582 “Business Combinations” and CICA Handbook Section 1602 “Non-Controlling Interests.” Fair value measurement is also now discussed in Section 1582. There is no effect on the consolidated financial statements as of January 1, 2011.
CICA Handbook Section 3251 “Equity” applies prospectively to annual and interim consolidated financial statements relating to fiscal years beginning on or after January 1, 2011. This standard was amended requiring companies to present separately changes in equity for the period arising from changes in reserves. An entity must also present separately non-controlling interest as a separate component of equity. Currently, the Corporation has no significant non-controlling interests; therefore, adoption of these new standards will have no impact.

Management’s discussion and analysis. pg36 ENMAX Corporation 2010
Management’s discussion and analysis.
8 Future accounting changes (CONTINUED)
CICA Handbook Section 3855 “Financial Instruments – Recognition and Measurement” applies prospec-tively to annual and interim consolidated financial statements relating to fiscal years beginning on or after January 1, 2011. This standard was amended as follows: clarified application of the effective interest method after a debt instrument has been impaired; clarified when an embedded prepayment option is separated from its host debt instrument for accounting purposes; altered the definitions of a financial asset or financial liability held for trading; provided further guidance concerning the assessment of embedded derivatives upon reclassification of financial assets out of the held for trading category; addressed accounting for foreign exchange gains and losses on a reclassification out of the available for sale category; and finally, addressed reversals of impairment losses previously recognized in net income. The Corporation has assessed the amendments to this section noting that there will be no impact to the Corporation’s financial instruments.
9 Critical accounting estimates
Since a determination of the value of many assets, liabilities, revenues and expenses is dependent upon future events, the preparation of the Corporation’s consolidated financial statements requires the use of estimates and assumptions. Accounting policies have been developed to ensure appropriate implementation and interpretation of accounting rules and complex situations are addressed using careful judgment. Adjust-ments to previous estimates, which will impact net income and could be material, are recorded in the period they become known.
The significant accounting policies adopted by the Corporation are described in note 2 in the Notes to the Consolidated Financial Statements. ENMAX’s critical accounting estimates are related to revenue recogni-tion, allowance for doubtful accounts, amortization expense, asset impairment, asset retirement obligations, provisions for income taxes, employee future benefits and financial instruments. The estimates and assump-tions made in these areas can be highly uncertain at the time the estimate or assumption is made. Different or changing estimates and assumptions could potentially have a material impact on ENMAX’s financial position or results of operations. These critical accounting estimates are described in the following discussion.
REVENUE RECOGNITION
The majority of the Corporation’s revenue is derived from the sale of electricity. The various systems and procedures used by third parties to provide load and settlement data to retailers across the province are required to completely and accurately capture all customer movement, load classification and consumption data. However, by regulation, wire service providers are not required to submit final load settlement data on customer electricity usage until eight months after the month in which such electricity was consumed. There are a number of variables in the calculation of these estimates and the underlying energy settlement processes within the Alberta electric system and the Corporation are complex. These estimates are necessary since the regulatory environment in which the Corporation operates often requires amounts to be recorded at estimated values until finalization and adjustment pursuant to subsequent regulatory decisions, or other regulatory proceedings. Estimates for unbilled consumption averaged $104.8 million (2009 – $99.8 million) at the end of each month and adjustments of estimated revenues to actual billings averaged $2.0 million (2009 – $3.1 million), representing an average of 2% and 3% of the estimates for 2010 and 2009, respec-tively. Reconciliation of settled volumes for 2010 will continue in 2011 based on the timing of receipt of settlement data. Therefore, amounts relating to 2010 represent only the first six months of the year. These estimates affect the accrued electricity revenues and accrued electricity costs of ENMAX Energy.
ALLOWANCE FOR DOUBTFUL ACCOUNTS
The allowance for doubtful accounts reflects an estimate of the accounts receivable that are ultimately expected to be uncollectible. It is based on a number of factors including the aging of accounts receivable, historical write-offs within customer groups, assessments of the collectability of amounts from individual customers and general economic conditions. The Corporation’s allowance account averaged $11.7 million (2009 – $8.3 million). The estimate of the allowance affects ENMAX Energy’s and ENMAX Power’s accounts receivable and OM&A.
Management’s discussion and analysis. pg37 ENMAX Corporation 2010
9 Critical accounting estimates (CONTINUED)
AMORTIZATION EXPENSE
Amortization is an estimate to allocate the cost of an asset over its estimated useful life on a systematic and rational basis. Estimating the appropriate useful lives of assets requires significant judgment and is generally based on estimates of common life characteristics of common assets. The ranges of amortization assump-tions used in measuring the Corporation’s amortization expense are outlined in note 2 in the Notes to the Consolidated Financial Statements.
ASSET IMPAIRMENT
Property, plant and equipment make up a significant portion of the Corporation’s total assets. The majority of those assets are involved in the generation of electricity. The Corporation considers several factors which could indicate an impairment of its assets including significant underperforming operating results, significant changes in the use of the asset and significant negative economic trends. When an indication of impairment is identified, the Corporation is required to estimate the fair value of certain assets. Estimates of fair values for these assets are based on undiscounted cash flow techniques which rely on a number of assumptions such as the amount of future cash flows that will be generated from the asset, expected future prices for inputs and outputs and expected usage of the asset. An impairment loss, if required, would be recorded as the excess of the carrying amount of the asset over its fair value.
ASSET RETIREMENT OBLIGATIONS
Measurement of the Corporation’s asset retirement obligations requires the use of estimates with respect to the amount and timing of asset retirements, the extent of site remediation required, discount rates, inflation rates and related future cash flows. Each individual asset requires a separate analysis of these methodology inputs and thus, quantification of the range of assumptions used would not be meaningful on a cumulative basis.
PROVISION FOR INCOME TAXES
Income taxes and amounts in lieu of income taxes are determined based upon estimates of the Corporation’s current income taxes and estimates of future taxes resulting from temporary tax differences. Future income tax assets are assessed to determine the likelihood that they will be recovered from future taxable income. To the extent that recovery is considered more likely than not, no valuation allowance will be recorded and no charge against income will be required.
EMPLOYEE FUTURE BENEFITS
ENMAX has a defined benefit pension plan and post-retirement benefits that are provided to certain employees. The cost of these benefits recognized in the consolidated financial statements are subject to estimates around many factors including, but not limited to, assumptions of future return on plan assets, retirement age, mortality rates, discount rates, future health care costs, salary escalation rates and claims experiences. The significant actuarial assumptions used in measuring the Corporation’s accrued benefit obli-gation and net benefit plan expense are outlined in note 13 in the Notes to the Consolidated Financial Statements.
FINANCIAL INSTRUMENTS
The fair values of financial instruments are determined and classified into three categories, Level I, II and III. Level I financial instruments are based on quoted market prices and are therefore subject to little estimation and judgment. Level II financial instruments have fair values that are determined using inputs, other than quoted market prices, that are readily observable for the specific asset or liability. These fair values are subject to estimates around determining the observable source to be used and the use of similar inputs for instru-ments that are not regularly traded. Level III financial instruments have fair values that are determined using inputs that are not readily observable. These fair values are subject to estimates embedded in the valuation technique used. Further discussion of the impact of estimates on the fair values of financial instruments can be found in note 6 in the Notes to the Consolidated Financial Statements.

Management’s discussion and analysis. pg38 ENMAX Corporation 2010
Management’s discussion and analysis.
9 Critical accounting estimates (CONTINUED)
INTEREST DURING CONSTRUCTION
Interest during construction is capitalized on a monthly basis on qualifying assets by applying a borrowing rate to the carrying amount of the asset. Qualifying assets are those assets that take a substantial period of time to complete (greater than or equal to six months or that are less than six months but would incur significant borrowing costs).
CHANGES IN CRITICAL ESTIMATES
During the current year, the Corporation undertook amortization studies that enhanced the identification of specific components of certain operational and administrative assets. Accordingly, useful lives for these assets have been changed prospectively in the current year. The impact to the consolidated financial statements is an increase in amortization expense of $5.7 million from what would have been estimated under previous estimations.
CHANGE IN PRESENTATION
ENMAX has restated 2009 natural gas revenues and cost of sales to be consistent with the presentation adopted in 2010. This resulted in an increase in both natural gas revenues and cost of services by $40.7 million with no impact on net earnings.
10 Risk management and uncertainties
ENMAX’s approach to risk management addresses risk exposures across all of the Corporation’s business activities and risk types. After consultation with the Board, management developed and implemented an Enterprise Risk Management (ERM) program in 2008 to identify, analyze, evaluate, treat and communicate the Corporation’s risk exposures in a manner consistent with ENMAX’s business objectives and risk appetite.
ENMAX’s commodity risk exposures are managed within levels approved by the Board and senior management, implemented by management and monitored by personnel in the business units, the Risk Management department and related functional areas. The Board and senior management have assigned accountability for overseeing ENMAX’s risk exposures to committees of the Board and for managing such exposures to individual business units and departments. At a management level, each accountability area is responsible for assessing its assigned risk exposures and implementing risk treatment plans. ENMAX’s Risk Management department coordinates an enterprise risk assessment report and related monitoring process. Risk oversight is delivered through ENMAX’s Risk Management Committee (RMC) and the ENMAX Board of Director’s Enterprise Risk Management Committee (ERMC). The RMC consists of senior management team members. The ERMC is comprised of each Chairperson from ENMAX’s various Board committees, the Chairman of the Board and another Board member who serves as Chairperson of the ERMC. Together, the RMC and ERMC oversee the Corporation’s risk management programs, including the ERM program and monitor ENMAX’s aggregate risk exposure.
The overall risk control environment of the Corporation includes:
- clearly articulated corporate values and code of conduct, which employees are required to review annually,- published enterprise-wide policies in key risk areas such as delegation of authority,- documented commodity trading and position limits,- an internal audit function to test compliance with internal controls and policies,- regular reporting of risk exposures and mitigations to the RMC and ERMC, - the use of industry-accepted tools and methodologies for tracking risk exposures and- a Safety and Ethics HelpLine for employees to anonymously report suspected illegal or unethical behaviour
without fear of retaliation if the employee does not feel comfortable reporting this information directly to the Corporation.
These risk management programs and governance structures are designed to manage and mitigate a number of risk factors affecting the Corporation and its business. These risk factors are discussed in the following commentary.
Management’s discussion and analysis. pg39 ENMAX Corporation 2010
10 Risk management and uncertainties (CONTINUED)
It is not possible to accurately assess the quantifiable impacts of specific risks dependent on the unknown outcome of unlikely future events. As such, ENMAX uses indicative terms in quantifying its risks. These indicative terms are defined as follows:
- low impact <= $5.0 million- moderate = between $5.0 and $25.0 million- significant >= $25.0 million
The following discussion does not consider the result of any interrelationship among the impacts. These impacts are hypothetical and not necessarily indicative of actual future results and should be used with caution.
MARKET RISK
ENMAX has inherent positions in electricity and natural gas commodities arising from owned and controlled supply assets and demand obligations. The Corporation also purchases and sells these commodities in wholesale markets to manage such positions. While ENMAX’s vertically-integrated business model is designed to achieve a balanced portfolio, its electricity and natural gas positions may experience periodic imbalances and result in exposures to price volatility from spot or short-term contract markets.
ENMAX Energy uses derivative instruments, such as swaps and forwards, to manage the Corporation’s exposure to commodity price risk. Financial gains and losses could be recognized as a result of volatility in the market values of these contracts. In the absence of actively quoted market prices and pricing information from external sources, the valuation of these derivative instruments may involve management’s judgment or use of estimates. As a result, changes in the underlying assumptions or use of alternative valuation methods could affect the reported fair value of these contracts. The inability or failure to effectively hedge ENMAX’s energy portfolio and prevent financial losses from derivative instruments could adversely affect the business, results of operations, financial condition or prospects of the Corporation. ENMAX’s hedging strategies control and mitigate these commodity price risks. Occasionally, hedging is ineffective, as it is based upon predictions about future market conditions and may require a minimum level of market liquidity to actively manage positions.
ENMAX Energy utilizes numerous tools to forecast electricity consumption and generation, as well as the pattern of consumption and generation between peak and off-peak hours (load shape). However, it is not possible to hedge all positions every hour. As such, the Corporation is exposed to volume and load shape risk. ENMAX Energy purchases blocks of electricity in advance of consumption in order to minimize exposure to extreme price fluctuations between off-peak and peak hours. In order to do this, ENMAX Energy uses his-torical consumption data to anticipate future load shape. When actual consumption varies from historical trends, the Corporation is exposed to spot market prices as it must either buy the electricity if it is short or sell the electricity if it is long. The Corporation actively manages assets to match generation to consumption volumes and has peaking facilities that allow quick reaction to unexpected supply and demand factors.
ENMAX has implemented an energy risk management program based on leading industry practices to analyze, control and report on commodity price risk exposures. This program includes risk metrics and associated limits, such as open commodity positions and Value at Risk, approved by the Board and senior management. Stress testing is performed regularly to provide additional information on the potential impact of extreme events on ENMAX’s energy portfolio. The energy risk management program is operated by a middle office controls group which is independent of the front office trading floor and the back office accounting and settlement group. The Corporation could have earnings variability which could likely have a low impact as it relates to the sustainability and diversification of its portfolio. Furthermore, a valuation modeling error could produce earnings variability which could also likely have a low impact. Overall commodity price levels have a potential earnings variability which could have a moderate financial impact. Significant earnings variability could also be seen as a result of retail residential and small business and industrial, commercial and institu-tional customer demand volatility and as a result of a collapse of retail margins. A potentially significant earnings impact could result from renewals/acquisitions shortfalls in the retail residential and small business and industrial, commercial and institutional areas.

Management’s discussion and analysis. pg40 ENMAX Corporation 2010
Management’s discussion and analysis.
10 Risk management and uncertainties (CONTINUED)
ENMAX has foreign exchange rate exposures arising from certain procurement and energy commodity trans-acting business activity. ENMAX hedges the majority of its foreign exchange risk exposures as such exposures arise. However, such hedges may not be sufficient to cover potential losses in the event of timing mismatches or extreme foreign exchange rate movements. The sensitivity around foreign exchange rate is discussed in Note 6 of the Notes to the Consolidated Financial Statements.
Changes in interest rates can impact borrowing costs and certain of the revenue streams from the Corporation’s business activity. Substantially all of ENMAX’s long-term debt is currently either fixed-rate amortizing debt, fixed-rate bullet debt or variable debt with linked interest rate swap hedges. This structure effectively mitigates exposure to interest rate fluctuations in the near term. Short-term debt is generally variable rate and long-term debt will need to be replaced at maturity leading to longer term exposure. The sensitivity around interest rates is discussed in note 6 of the Notes to the Consolidated Financial Statements.
Changes in equity prices can impact the value of equity investments held by the Corporation to pursue its business objectives. ENMAX actively monitors and takes actions to mitigate the Corporation’s exposure to equity price fluctuations. The sensitivity around equity prices is discussed in note 6 of the Notes to the Consolidated Financial Statements.
For additional details on ENMAX’s market risk exposures and sensitivities, refer to note 6 in the Notes to the Consolidated Financial Statements.
CREDIT RISK
ENMAX enters into agreements and engages in transactions with a number of external parties, such as suppliers, service providers, retail customers and other counterparties. In such arrangements, exposure exists to coun-terparty credit risks and the risk that one or more counterparties may fail to fulfill their obligations, including paying for or delivery of commodities. These exposure risks are often exacerbated during periods of sustained low commodity prices and tighter credit markets, which are currently being experienced in North America.
ENMAX has implemented a credit risk management program to mitigate its exposures to credit risk. While ENMAX seeks to control credit risk exposure by considering creditworthiness before and after entering into such agreements, monitoring business activity against pre-defined credit limits and obtaining collateral when it is prudent to do so, the Corporation may not be able to identify and avoid all counterparties that are not creditworthy. Defaults by suppliers, service providers, retail customers and other counterparties could adversely affect the business, results of operations, financial condition or prospects of the Corporation.
Management has increased its credit and collections activities to monitor credit risk exposures in light of recent market conditions, and has implemented available measures to protect against any further losses. In specific situations, this includes, but is not limited to, a reduction of credit limits, requests for additional col-lateral, requirements for performance bonds on significant projects or restriction of new transaction terms.
The Corporation’s results could see a low impact in variability as a result of industrial, commercial and insti-tutional customer default. Variability as a result of default by residential or small commercial customers and wholesale customers could also be expected to have a low impact.
For additional details on ENMAX’s credit risk exposures, refer to note 6 in the Notes to the Consolidated Financial Statements.
LIQUIDITY RISK
ENMAX may need to raise additional capital if sources of cash and cash flow from operations are insufficient to fund activities. Such additional capital may not be available when it is needed or on favourable terms for a number of reasons, including changes in market conditions or perceptions of the investment community. The Corporation may be required to post collateral to support certain contracts which were executed to hedge commodity positions. Downgrades to credit ratings by credit rating agencies could affect the Corpo-ration’s ability to access capital on favourable terms and within a desired time frame and could also increase the amount of collateral required to be provided to counterparties. ENMAX actively monitors its cash position and anticipated flows to achieve adequate funding levels. The Corporation communicates regularly with credit rating agencies and the investment community regarding its capital position.

Management’s discussion and analysis. pg41 ENMAX Corporation 2010
10 Risk management and uncertainties (CONTINUED)
ENMAX offers a defined benefit pension plan for qualifying employees. The Corporation’s contributions to the pension plan are based on periodic actuarial valuations, the next of which will be required for December 31, 2012. For accounting purposes as at December 31, 2010, the pension plan had an estimated deficit of $32.6 million ($25.1 million at December 31, 2009). The actual amount of contributions required in the future will depend on future investment returns, changes in benefits and actuarial assumptions. Failure to effectively manage financial resources and related exposures could adversely affect the business, results of operations, financial condition or prospects of the Corporation. To manage this risk, ENMAX’s pension fund engages expert pension managers and has investment policies and procedures in place to set out the invest-ment framework of the funds, including permitted investments and various investment constraints. These policies and procedures are approved annually by the Human Resources Committee of the Board, which also actively monitors the performance of the pension plan.
The Corporation could be exposed to a low impact in earnings variability if its credit rating were to be down-graded one level, covenants were breached on its recourse debt, or insufficient liquidity was experienced. The Corporation is also potentially exposed to a low impact in earnings variability as a result of negative pension asset performance.
For additional details on ENMAX’s liquidity risk exposures, refer to note 6 in the Notes to the Consolidated Financial Statements. For additional details on ENMAX’s pension plan, refer to note 13 in the Notes to the Consolidated Financial Statements.
OPERATIONAL RISK
ENMAX owns, controls or operates a number of electricity generation, transmission and distribution facili-ties. The operation of such facilities involves many risks, including public safety incidents; start-up risks; breakdown or failure of generation; transmission or distribution facilities or pipelines; use of new technology; dependence on a specific fuel source, including the transportation of fuel, impact of unusual or adverse weather conditions (including natural disasters) and performance below expected or contracted levels of output or efficiency. Natural resource operating facilities are subject to weather driven risks such as water and wind availability. The Corporation is also subject to the risk of inadequate or failed internal processes, people and systems within the competitive and regulated businesses, shared services departments and certain outsource service organizations.
Breakdown or failure of a facility may prevent the facility from performing as expected under applicable agreements which, in certain situations, could result in termination of the agreements or incurring a liability for damages. Unanticipated transmission and distribution facility outages can cause interruptions in service. Unanticipated generation facility outages and de-rates can cause periodic imbalances in the Corporation’s electricity and natural gas positions. Weather conditions can materially affect the level of demand for elec-tricity and natural gas, the prices for these commodities and the generation of electricity at certain facilities. In addition, ENMAX’s demand obligations may fluctuate based on commodity prices, season, day and time of use and specific customer requirements.
Events that could result from physical or cyber war, terrorism, civil unrest or vandalism may cause physical damage to ENMAX and its assets and impact the Corporation’s generation, transmission and distribution operations or administrative functions in unpredictable ways. Such impacts may include the inability to produce, transport, transact or deliver electricity or natural gas commodities, significant slowdown in growth or a decline in the economies of Alberta, Canada or North America, delayed economic recovery, or adverse impacts to adequacy and cost of security and insurance.
These operational risks may affect the Corporation’s ability to execute its strategy in an effective and effi-cient manner, degrade the quality of customer service and result in lost revenues and/or increased costs. These risks are actively managed using incentives, site planning, controls, safety, security and insurance programs as well as a number of other measures. Certain critical areas within ENMAX have implemented security measures and emergency response plans. The Corporation continues to develop continuity and disaster recovery plans, including a remote disaster recovery site. In addition, the Corporation has obtained property, business interruption and other insurance coverage to mitigate some of these risk exposures, although such programs and measures may not prevent or cover the occurrence of any or all of these events and the adverse effects they may generate. The outcomes of operational risks could adversely affect the business, results of operations, financial condition or prospects of the Corporation.

Management’s discussion and analysis. pg42 ENMAX Corporation 2010
Management’s discussion and analysis.
10 Risk management and uncertainties (CONTINUED)
The Corporation’s earnings could be moderately impacted by a regulated transmission blackout/brownout, a vehicle accident, failure of metering equipment, or loss of communication services. Generation operations activities (fuel supply shortages / failure of third party services or infrastructure / interruption / human error / labour disruption / hazards to facilities / regulatory filings) could cause significant earnings variability. The Corporation is potentially exposed to significant earnings variability due to a catastrophic failure at a PPA plant (defined as a failure causing a six month outage) and further moderate variability due to the variation in the Annual Incentive Payments to PPA operators. A low impact in earnings variability could also be seen as a result of the non-performance of contracted physical electricity or natural gas by counterparties.
TECHNOLOGICAL RISK
ENMAX utilizes complex technologies in all aspects of the business, from generation through to information technology. Improvements in current technologies and development of new technologies could render certain existing technologies obsolete. Alternative energy technologies such as fuel cells, micro turbines, cogeneration and photovoltaic (solar) cells have become more accessible. As research and development continues on these alternative technologies, they become more economically viable energy sources. As well, newly constructed facilities are able to incorporate more efficient technologies. New laws and environmental regulations can require upgrades to current facilities’ technologies. The Corporation’s ability to interface with customers is managed through extensive billing and customer care information technology systems. New developments in information systems could render these billing and customer care systems obsolete. The Corporation actively monitors regulatory changes and the potential technological impacts of these changes. The Corporation is also investing in the development of advanced alternative technologies in both generating and information systems. An information management failure, an overall operational system failure, failure of aging applications and infrastructure are all events that individually could result in a low impact in earnings variability but combined could result in moderate earnings volatility. Both unauthorized access to obtain confidential information and leakage of sensitive data through unauthorized mobile devices and applications could individually result in moderate earnings variability. Finally, a loss of the data center could result in significant earnings variability.
DEVELOPMENT RISK
ENMAX’s ability to successfully complete generation, transmission and distribution facilities currently under construction, those projects yet to begin construction, or capital improvements to existing facilities in a timely manner, within established budgets, is contingent upon many variables and subject to a variety of risks, some of which are beyond the Corporation’s control. Should any such risks come to bear, the Corporation could be subject to additional costs, delays to the in-service dates of these projects, termination payments under committed contracts and/or the write-off of the investment in the project or improvement. In addition, while ENMAX’s vertically-integrated business model is designed to mitigate exposure to risks (as does its strategy to fix the development costs by contractually fixing the price with contractors), the Corporation may be required to purchase additional electricity or natural gas to fulfill demand obligations until these projects are completed.
The Corporation’s ability to successfully identify, value, evaluate, complete and integrate new acquisition opportunities, organic growth opportunities and major capital projects is subject to risks, including increased competition for acquisition targets, capital and other resources resulting from consolidation of the industry and the performance of the Alberta economy. Such business development challenges could adversely affect the business, results of operations, financial condition or prospects of the Corporation.
ENMAX completes budgeting for capital programs and projects on an annual basis and funding for specific approved capital programs and projects on an ongoing basis. Business units perform risk assessments and develop risk treatment plans for major capital programs and projects. Project performance relative to expec-tations is regularly reported to senior management and the Board and any corrective measures are taken as required. Delays and overspending in the development of capital projects could result in a significant cash flow impact for the Corporation.

Management’s discussion and analysis. pg43 ENMAX Corporation 2010
10 Risk management and uncertainties (CONTINUED)
ENVIRONMENTAL RISK
The Corporation is subject to regulation by federal, provincial and local authorities with regard to air, land and water quality and other environmental matters. The generation, transmission and distribution of elec-tricity results in and requires disposal of certain hazardous materials, which are subject to these laws and regulations. In addition to imposing continuing compliance obligations, these laws and regulations authorize the imposition of substantial penalties for non-compliance, including fines, injunctive relief and other sanctions. New environmental laws and regulations affecting ENMAX’s operations may be adopted and new interpretations of existing laws and regulations could be adopted or become applicable to the Corporation or its facilities, which may substantially increase its environmental expenditures in the future. New facilities or modifications of existing facilities may require new environmental permits or amendments to existing permits. Delays in the environmental permitting process, denials of permit applications and conditions imposed in permits may materially affect the cost and timing of projects. Non-compliance with environ-mental laws and regulations or incurrence of new costs or liabilities could adversely affect the business, results of operations, financial condition or prospects of the Corporation. ENMAX has implemented various programs to manage the Corporation’s environmental risk exposures, many of which focus on prevention of and preparedness for adverse events.
In 2007, the Government of Alberta passed the Climate Change and Emissions Management Act (Alberta) and Alberta’s Specified Gas Emitters Regulation to address the regulation of GHG emissions from certain facilities located in the province. Effective July 1, 2007, facilities emitting more than 100,000 tonnes of GHG per year are required to reduce their emissions intensity from an emissions intensity baseline. The companies responsible for these facilities have been given a number of options to allow them to comply with this re-quirement, including making operational improvements to the facilities, buying eligible offsets to apply against their emissions and contributing to a fund established for the purpose of investing in technology to reduce GHG emissions in the province. ENMAX has taken steps to substantially mitigate these impacts, including acquiring qualified credits from both its wind generation assets and purchases on the wholesale market. The Corporation continues to assess and monitor the implications these changes in legislation may have on its business.
Federal regulations aimed at reducing the level of GHG emissions are expected to come into force in the future. The current federal proposal would see all existing coal-fired generation physically shut down at the end of the coal-fired unit’s economic life (45) years or end of an associated PPA, whichever is longer. As a result, the federal regulation will not result in ENMAX being exposed to compliance costs associated with its ownership of PPAs.
The Corporation mitigates its exposure to environmental regulations by building and acquiring new, cleaner generation capacity; developing innovative alternative energy technologies; purchasing emission reductions offsets; investing in environmentally improved technologies in its supply from power purchase arrangements and developing workplace conservation programs. The Corporation is potentially exposed to moderate earnings variability if it fails to comply with its environmental management system. The Corporation is potentially exposed to further moderate volatility due to each of the following: potential of spills, releases and fire from hazardous materials, as a result of a pandemic and as a result of GHG emissions policy changes.
REGULATORY AND POLITICAL RISK
ENMAX operates in competitive and regulated sectors of the electricity and natural gas industries and is subject to regulation by federal, provincial and municipal governmental regulatory and market authorities. Oversight of industry regulations is provided by the Alberta Department of Energy, AUC, MSA, AESO, the British Columbia Utilities Commission, National Energy Board, North American Electric Reliability Corporation, U.S. Federal Energy Regulatory Commission and other agencies.

Management’s discussion and analysis. pg44 ENMAX Corporation 2010
Management’s discussion and analysis.
10 Risk management and uncertainties (CONTINUED)
The regulatory environment of the electricity and natural gas industries has undergone substantial change as a result of restructuring initiatives at both the provincial and federal levels. These initiatives continue to have significant impacts on the nature of electricity and natural gas production, transportation, trade and consumption and the manner in which participants in the competitive sectors conduct business. Such participants have recently been subjected to increased scrutiny by governments, regulators, capital markets, credit-rating agencies and other stakeholders. This increased scrutiny has led to substantial changes in laws and regulations, including those applicable to the operation of competitive wholesale and retail markets and monitoring of participant behavior. Regulations and regulatory decisions affect the Corporation’s regulated business in a number of areas, including allowed rates of return, industry and rate structure, development and operation of transmission and distribution facilities, acquisition, disposal, depreciation and amortization of facilities and recovery of certain operating costs.
ENMAX’s competitive and regulated businesses are subject to a number of specific regulations established to help ensure that Alberta’s wholesale and retail electricity and natural gas markets operate in a fair, efficient and openly competitive manner. ENMAX Power is a transmission and distribution system owner, an electrical utility and is regulated by the AUC. ENMAX Energy, ENMAX Commercial Energy Marketing and Valeo Power are all affiliated retailers of ENMAX Power and, along with ENMAX Power, must comply with a Code of Conduct regulation, which preserves a level playing field for all retailers, as well as general energy marketing regulations. ENMAX Energy is also subject to regulatory oversight by the AUC for provision of the RRO of ENMAX Power.
ENMAX can neither predict the future municipal, provincial or federal governments nor their policies that may impact the development of regulation over its business or the ultimate effect that any changes to the regulatory environment may have on its business. The regulatory process or specific decisions by a regulator may restrict ENMAX’s ability to grow earnings, recover costs or achieve a targeted rate of return in certain parts of its competitive and regulated businesses, or cause delays in or impact business planning and transactions and increase costs. Non-compliance with laws or regulations or changes to the regulatory environment could adversely impact the business, results of operations, financial condition or prospects of the Corporation.
ENMAX is an active participant in the various regulatory processes that influence the Corporation’s business environment and operations. ENMAX actively monitors business activity that is subject to regulation and has implemented compliance programs to mitigate the Corporation’s regulatory and political risk exposures. The Corporation is potentially exposed to significant financial impact as it relates to changes to existing, as well as new or upcoming policies, protocols, standards, administrative orders or regulations that can have an impact on the Corporation’s activities and operations or do damage to physical assets as a result of terrorism. The Corporation is also potentially exposed to moderate financial impact in regards to regulatory filings and matters related to generation operations.
LEGAL RISK
ENMAX is occasionally subject to costs and other effects of legal and administrative proceedings, settle-ments, investigations, claims and actions, as well as the effect of new or changes in tax laws, rates or policies, accounting standards, securities laws and corporate governance requirements. Non-compliance with existing laws, resolution of legal actions and changes to the legal environment could adversely impact the business, results of operations, financial condition or prospects of the Corporation.
ENMAX reviews and actively monitors business activity that could be subject to public or private legal actions, including changes to certain legislation, contracts with outside parties and incidents or claims allegedly involving the Corporation and has implemented programs to mitigate the Corporation’s legal risk exposures. The Corporation’s earnings variability as it relates to potential employment rights violations which results in union, legal or regulatory action is low impact. However, an incident of material unauthorized communication could cause moderate earnings variability. A breach of material contract or litigation brought against the Corporation could also cause moderate earnings variability, as would a litigation brought against the Corporation for any alleged negligence, defamation, nuisance, or other matters or a material breach of legislation or rules.

Management’s discussion and analysis. pg45 ENMAX Corporation 2010
10 Risk management and uncertainties (CONTINUED)
HUMAN RESOURCES RISK
ENMAX is subject to workforce factors, including loss or retirement of key executives or other employees, availability of and ability to attract, develop and retain qualified personnel, collective bargaining agreements with union employees and performance of key suppliers and service providers. A number of personnel with highly specialized knowledge, skills and experience are required to lead and operate competitive and regu-lated businesses and the Corporation’s shared services departments. Failure to manage human resources risk could adversely affect the business, results of operations, financial condition or prospects of the Corporation. Management has mitigated this risk by implementing a number of programs to attract, develop and retain personnel, including recruiting, career development, recognition and competitive compensation and benefits programs.
ENMAX management believes it has a good relationship with the Corporation’s unions; however, no assurance can be given that successful negotiations will be completed with collective bargaining units on mutually agreeable terms. Difficulties in negotiating these agreements or continuing these programs could lead to higher employee costs, a work stoppage or strike and attraction or retention below expectations. ENMAX has two collective bargaining agreements covering its workforce. As at December 31, 2010, one of these collective bargaining agreements is set to expire December 31, 2011 and one of these collective bargaining agreements had expired and had not yet been renewed for 2011 and going forward. The Corporation’s earnings variability as a result of a lack of entrepreneurial culture, workforce attraction and retention and aging workforce / changing values is potentially moderate. The Corporation also has a low impact exposure in relation to security breach and property theft at its facilities and workplaces. The Corporation has a further moderate exposure in relation to a breakdown in labour relations with either of the two unions.
CORPORATE STRUCTURE RISK
The Corporation conducts a significant amount of business through subsidiaries and joint ventures. The ability to meet and service debt obligations is dependent on the operational results of these investments and their ability to distribute funds to ENMAX. Any restrictions on the ability of these investments to distribute funds to ENMAX may impact ENMAX’s ability to service the corporate debt. A change in the ownership structure of ENMAX could result in low impact earnings variability.
REPORTING/DISCLOSURE RISK
The application of critical accounting policies reflects complex judgments and estimates. These policies include industry-specific accounting applicable to regulated public utilities, accounting for pensions and derivative instruments. The adoption of new GAAP or changes to current accounting policies or interpretations of such policies could adversely affect the business, results of operations, financial condition or prospects of the Corporation. ENMAX has implemented various programs to reinforce the Corporation’s internal control over financial reporting, including periodic assessments of controls by internal and external auditors and review of certain disclosures by senior management and the Board. Transition to IFRS could also adversely affect the reported results of the business and impact the prospects of the Corporation. The Corporation has under-taken a comprehensive project to assess the impacts of IFRS transition and to ensure appropriate controls over financial reporting are maintained through the conversion period and beyond. The risk that errors in consolidated financial statements could cause a loss of credibility with creditors and increase risk of breach of covenants or debt ratings decreasing could potentially have a low impact on earnings variability.
STRATEGIC RISK
ENMAX’s vertically-integrated business model and strategic direction are predicated on certain assump-tions, including the long-term viability of the competitive and regulated businesses, benefits associated with holding each of these businesses within the Corporation, evolution of technology used in the industry and attractiveness of growth opportunities. While management believes these assumptions will remain valid in the future, significant changes to the overall business environment or other factors could cause ENMAX to re-evaluate the Corporation’s business model or strategic direction.
Management’s discussion and analysis. pg46 ENMAX Corporation 2010
Management’s discussion and analysis.
10 Risk management and uncertainties (CONTINUED)
The Corporation has several competitors that operate in the electricity and natural gas markets in which ENMAX serves customers. Competitors vary in size from small companies to large corporations, some of which have significantly greater financial, marketing and procurement resources than ENMAX. ENMAX Energy must also compete with the RRO service provided by various parties throughout Alberta in order to convince customers to select ENMAX Energy as their competitive retailer. Changes to the business environ-ment and failure to attract and retain customers could adversely affect the business, results of operations, financial condition or prospects of the Corporation. The Corporation could potentially see moderate earnings variability as it relates to constraints on its growth targets for market share. The Corporation could also see a low impact on earnings variability related to divesting its holdings in joint ventures on unfavourable terms.
TAX RISK
Prior to January 1, 2001, the Corporation and its subsidiaries were not subject to federal or provincial income taxes based on an exemption for municipally owned corporations in the Income Tax Act (Canada) (ITA). The exemption generally requires corporations be wholly owned by a municipality and substantially all income must be derived from sources within the geographic boundaries of the municipality. Entities that do not meet these requirements are subject to income tax.
The EUA precludes municipally owned corporations competing in the electricity generation business from realizing a tax, subsidy or financing advantage as a result of their association with the municipality. Accord-ingly, ENMAX holds its generation assets in entities that do not qualify for the income tax exemptions noted above.
In 2001, the Government of Alberta introduced a payment in lieu of tax (PILOT) regulation in conjunction with the deregulation of the Alberta utilities industry. The purpose of this regulation was to level the playing field between municipally owned tax-exempt entities and non-tax-exempt organizations participating in the competitive part of the electricity market, by requiring tax-exempt organizations to make a payment in lieu of taxes equal to what they would have had to pay if they were not tax-exempt. This regulation requires municipally owned retailers and municipally owned PPA holders to remit PILOT payments to the Balancing Pool, based on the retail and commodity components of their electricity operations, excluding RRO income. In July 2006, the Government of Alberta amended the PILOT regulations to include RRO income. This amendment was effective January 1, 2007. PILOT regulations do not apply to those entities subject to tax under the ITA.
With the introduction of PILOT regulations in 2001, ENMAX adopted the liability method of accounting for income tax. This change in the Corporation’s tax status resulted in all PILOT related assets (primarily the PPAs) of the Corporation being deemed to be disposed of and immediately reacquired, at fair market value, for tax purposes, effective December 31, 2000. As a result, the Corporation’s tax base of these assets exceeds their net book value resulting in a future income tax asset of $315.3 million being recorded in the consoli-dated financial statements with a corresponding increase in retained earnings. As at December 31, 2010, the future income tax asset remaining related to this balance is $91.5 million.
From June 2005 through January 2011, ENMAX Energy received reassessments and communications from Alberta Finance in respect of the taxation years 2001 through 2006. ENMAX Energy does not agree with the reassessments and has commenced the necessary steps to defend its positions through the formal appeals process. However, ENMAX Energy voluntarily remitted certain amounts to minimize interest and penalties until the issues are resolved. These amounts are recorded as income taxes receivable as at December 31, 2010 and December 31, 2009. ENMAX Energy expects this process to be successful and will evaluate all options should the appeals process result in an unfavourable outcome.
The computation of the Corporation’s provision for income taxes involves tax interpretations, regulations and legislation that are continually changing. The Corporation’s tax filings are subject to audit by taxation authorities. The outcome of such audits may increase the tax liability of the Corporation. Any implementa-tion of incremental taxes or changes to the current legislation could adversely affect the business, results of operations, financial condition or prospects of the Corporation. The Corporation could potentially have significant earnings variability in relation to its reassessments from Alberta Finance in regards to prior year’s returns and other contingent tax liabilities.
Management’s discussion and analysis. pg47 ENMAX Corporation 2010
10 Risk management and uncertainties (CONTINUED)
REPUTATION RISK
ENMAX’s reputation is a highly valued asset. Changes in opinion from the general public, stakeholders and governments could impact the business or prospects of the Corporation. The Corporation takes steps to actively manage this risk by working to maintain positive relations and clear communications with stakeholders such as debt holders and the Corporation’s Shareholder, maintaining a high level of corporate ethics and considering and communicating the public impact of business decisions. The risk of physical harm to a member of the public as a result of the Corporation’s actions has the potential to cause moderate earnings variability. The remaining reputation risks are quantitatively included in other risks discussed in this section.
11 Financial instruments
In conducting its operations, the Corporation uses various instruments including forwards, futures, swaps and options to reduce its market risks.
Forwards – The Corporation uses forwards as a contractual agreement to purchase or sell a specific commodity or financial instrument at a specified price and date in the future with another counterparty. ENMAX enters into forwards to mitigate the impact of volatility in commodity prices and foreign exchange rates. A risk associated with using forwards includes credit risk of the counterparty, as forwards are transacted with a specific counterparty as opposed to a broker/dealer or clearing exchange. This credit risk is managed in the same respect as trade accounts receivable would be as forwards counterparties would be assessed for credit-worthiness in the same process as energy customers. A second risk is that if the quantities and timing of the underlying commodity or cash flow are not identical to the contract entered into, the Corporation will have continued exposure to market risk. The risk is minimized by attempting to match delivery and date terms on all financial forwards entered into. Amounts related to forwards will appear on the income statement in Electricity costs, Natural gas costs and OM&A. The only significant assumptions required in determining fair value of the Corporation’s forward contracts is for long-dated Alberta power purchases and sales, as they are not traded in an active market. Assumptions must be made based on the pricing of the furthest dated active market transactions occurring and the shape of the forward curve into the future in order to derive a fair value price for these long-dated contracts.
Futures – The Corporation uses futures as a contractual agreement to purchase or sell a specific commodity at a specified price and date in the future with a brokerage or clearing exchange. ENMAX enters into futures contracts to mitigate the impact of volatility in commodity prices and foreign exchange rates. Credit risk of the counterparty in futures contracts is close to nil, as futures are transacted with a clearinghouse or clearing exchange that guarantees performance of the contract based on margin posted by other market participants. A second risk is that if the quantities and timing of the underlying commodity or cash flow are not identical to the contract entered into, the Corporation will have continued exposure to market risk. The risk is mini-mized by attempting to match delivery and date terms on all financial forwards entered into. Amounts related to forwards will appear on the income statement in Electricity costs, Natural gas costs and OM&A. Assumptions must be made based on the pricing of the furthest dated active market transactions occurring and the shape of the forward curve into the future in order to derive a fair value price for these long-dated contracts.
Swaps – The Corporation enters into swaps with counterparties to exchange streams of payments over time outlined by specified terms. ENMAX uses commodity, cross-currency and interest rate swaps to mitigate the impact of changes in commodity prices, foreign exchange rates and interest rates. A risk associated with using swaps includes credit risk of the counterparty, as they are transacted with a specific counterparty as opposed to a broker/dealer or clearing exchange. This credit risk is managed in the same respect as trade accounts receivable would be as swap counterparties would be assessed for credit-worthiness in the same process as energy customers. A second risk is that if the quantities and timing of the underlying commodity or cash flow are not identical to the contract entered into, the Corporation will have continued exposure to market risk. The risk is minimized by attempting to match delivery and date terms on all swaps entered into. Amounts related to swaps will appear on the income statement in Electricity costs, Natural gas costs, OM&A and Interest. There are no significant assumptions required when determining the fair value of the Corporation’s option contracts, as they can be valued using active market rates.

Management’s discussion and analysis. pg48 ENMAX Corporation 2010
Management’s discussion and analysis.
11 Financial instruments (CONTINUED)
Options – The Corporation occasionally enters into options with counterparties that give the purchaser the right, but not the obligation, to buy or sell a specific amount of commodity or financial instrument at a fixed price, either at a fixed date or at any time within a specified period. ENMAX periodically uses commodity, cross-currency and interest rate swaps to mitigate the impact of changes in commodity prices, foreign exchange rates and interest rates. A risk of using options is that if the quantities and timing of the underlying commodity or cash flow are not identical to the contract entered into, there will be ineffectiveness and the Corporation will have continued exposure to market risk. Another risk of options is that the writer of an option has a fixed upside (option premium) on the transaction with a significant downside. The purchaser of an option has the additional risk that if the market is static, the option premium will be forfeited at the expi-ration date without any realized upside. These risks are minimized by attempting to match terms of options to offset existing positions which have market risk on all options entered into. Amounts related to options will appear on the income statement in Electricity costs, Natural gas costs, OM&A and Interest. There are no significant assumptions required when determining the fair value of the Corporation’s option contracts, as they can be valued using active market rates.
Refer to note 6 in the Notes to the Consolidated Financial Statements for further information on financial instruments.
OFF-BALANCE SHEET ARRANGEMENTS
The fair value of ENMAX Energy’s contracts-for-differences is determined by estimating the amounts that would have to be received or paid to counterparties to terminate the contracts at December 31, 2010 and December 31, 2009. The following contracts-for-differences were outstanding at the end of the period:
AS AT DECEMBER 31, 2010 2009
NOTIONAL QUANTITY OF OFF-BALANCE SHEET ARRANGEMENTS
Electricity sales 2,153 GW 3,578 GWNatural gas sales 654 TJ 4,077 TJElectricity purchases 1,707 GW 1,863 GWNatural gas purchases 10,981 TJ 27,966 TJ
Notional quantities are not recorded in the consolidated financial statements because these amounts are not exchanged by ENMAX Energy and its counterparties and are not a measure of ENMAX Energy’s exposure. Notional amounts are used only as the basis for calculating payments for certain contracts.
At December 31, 2010, on the basis of electricity and natural gas prices at that date, the estimated cost of settling these economically hedged contracts at the balance sheet date, excluding PPA sales, would be a negative mark-to-market adjustment amounting to $33.8 million (December 31, 2009 – negative adjust-ment of $15.5 million). This amount does not reflect the fact that these contracts will settle at prices in effect at the time of expiration.
12 Transactions with related parties
ENMAX’s related-party transactions comprise both revenues from and expenditures to The City. The City is the sole Shareholder of the Corporation. In the year ended December 31, 2010, transactions with The City amounted to $93.6 million in revenue, compared with $89.7 million in the same period in 2009. The significant components include contract sales of electricity, provision of non-regulated power distribution services and billing and customer care services relating to The City’s utilities departments. In the year ended December 31, 2010, total expenditures for goods and services received from The City were $105.1 million compared with $116.6 million in the same period in 2009. Most of these expenditures were for local access fees for the use of The City’s rights-of-way. The measurement basis used in determining the above values is fair market value; that is, the measurement basis is the same as would be used for a third party arm’s length transaction. Additional details on the Corporation’s transactions with The City can be found in note 25 in the Notes to the Consolidated Financial Statements.

Management’s discussion and analysis. pg49 ENMAX Corporation 2010
13 Controls and procedures
Management’s responsibility for the financial reporting process that produces the consolidated financial statements is described in the Report of Management on page 52 of this report.
ENMAX has a Disclosure and Confidentiality policy which sets out policies and procedures including the mandate of the Certification Committee. The policy was approved by the Board and put into effect in August 2005.
The Interim Chief Executive Officer and the Chief Financial Officer have evaluated the effectiveness of the Corporation’s disclosure controls and procedures as at the end of December 31, 2010. They have concluded that the Corporation’s disclosure controls and procedures are effective.
Management is also responsible for the design of internal controls over financial reporting within the Corpora-tion in order to provide reasonable assurance regarding the reliability of financial reporting and the preparation of consolidated financial statements for external purposes in accordance with GAAP. Management focuses its efforts on areas assessed to have higher risks being revenue accruals, end-user applications and information technology. Management has evaluated the design of the Corporation’s internal controls and procedures over financial reporting, in these areas, as of the end of the period covered by the annual filings and believes the design to be effective to provide such reasonable assurance.
14 Outlook
The discussion in this section is qualified by the caution regarding forward-looking statements at the beginning of the MD&A.
Through-out 2010 and entering into 2011, the power market in Alberta has experienced cyclically low power prices driven by low natural gas prices. The Corporation’s vertically-integrated strategy has allowed it to weather the low power prices through 2010. Increasing demand combined with recent notices of potential cessation of operations at two Alberta-based coal facilities has boosted Alberta current settle electricity prices and forward electricity prices for 2011 and beyond. Fixed price contracts established during the period of lower prices are expected to mute the impact of increasing prices on the Corporation’s commodity margins for 2011.
The Corporation is spending significant effort in the management of its OM&A costs. While additional costs are expected to result from increases in services rendered by third parties under contract and inflation increases on labour and salary costs, it is anticipated that a significant mitigation of these increases will come from productivity improvements and general cost reduction efforts.
As a result of the impacts above, ENMAX expects that net earnings for 2011 will be modestly lower than net earnings levels seen in 2010. This level of earnings and the related operating cash flow is expected to provide a significant amount of financing for the Corporation’s 2011 development plans.
Consolidated financial statements. pg50 ENMAX Corporation 2010
Management’s report
The consolidated financial statements and all the information in the 2010 annual report are the responsibility of management. The financial statements have been prepared in accordance with Canadian Generally Accepted Accounting Principles (GAAP) and management’s best estimates and judgments. The financial and operating information presented in this annual report is consistent with consolidated financial statements and accompanying notes.
Management has prepared the management’s discussion and analysis (MD&A). The MD&A compares the Corporation’s financial performance in 2010 to 2009 and should be read in conjunction with the consoli-dated financial statements and accompanying notes.
ENMAX Corporation has designed and maintains internal controls to safeguard assets and facilitate the preparation of reliable and relevant financial information on a timely basis.
The Board of Directors has appointed an Audit and Finance Committee, which consists of independent directors of the Board, to ensure management fulfills its responsibilities for financial reporting.
The independent external auditors, Deloitte & Touche LLP, have been appointed by the Shareholder to express an opinion on ENMAX’s consolidated financial statements. The accompanying report of Deloitte & Touche LLP outlines the scope of their examination and their opinion on the consolidated financial statements.
CHARLES RUIGROK DAVID HALFORD, CA Interim President and Chief Executive Officer Executive Vice President, Finance and Chief Financial Officer
March 9, 2011
Consolidated financial statements. pg51 ENMAX Corporation 2010
Independent auditor’s report
To the Shareholder of ENMAX Corporation:
We have audited the accompanying consolidated financial statements of ENMAX Corporation, which comprise the consolidated balance sheets as at December 31, 2010 and December 31, 2009, and the consolidated statements of income and comprehensive income, changes in Shareholder’s equity, and cash flows for the years then ended, and a summary of significant accounting policies and other explanatory information.
Management’s Responsibility for the Consolidated Financial Statements
Management is responsible for the preparation and fair presentation of these consolidated financial state-ments in accordance with Canadian generally accepted accounting principles, and for such internal control as management determines is necessary to enable the preparation of consolidated financial statements that are free from material misstatement, whether due to fraud or error.
Auditor’s Responsibility
Our responsibility is to express an opinion on these consolidated financial statements based on our audits. We conducted our audits in accordance with Canadian generally accepted auditing standards. Those standards require that we comply with ethical requirements and plan and perform the audit to obtain reasonable assurance about whether the consolidated financial statements are free from material misstatement.
An audit involves performing procedures to obtain audit evidence about the amounts and disclosures in the consolidated financial statements. The procedures selected depend on the auditor’s judgment, including the assessment of the risks of material misstatement of the consolidated financial statements, whether due to fraud or error. In making those risk assessments, the auditor considers internal control relevant to the entity’s preparation and fair presentation of the consolidated financial statements in order to design audit procedures that are appropriate in the circumstances, but not for the purpose of expressing an opinion on the effectiveness of the entity’s internal control. An audit also includes evaluating the appropriateness of accounting policies used and the reasonableness of accounting estimates made by management, as well as evaluating the overall presentation of the consolidated financial statements.
We believe that the audit evidence we have obtained is sufficient and appropriate to provide a basis for our audit opinion.
Opinion
In our opinion, the consolidated financial statements present fairly, in all material respects, the financial position of ENMAX Corporation as at December 31, 2010 and December 31, 2009, and its operations and its cash flows for the years then ended in accordance with Canadian generally accepted accounting principles.
(signed)
DELOITTE & TOUCHE LLP Chartered Accountants Calgary, Alberta
March 9, 2011

Consolidated financial statements. pg52 ENMAX Corporation 2010
Consolidated balance sheets
AS AT DECEMBER 31 2010 2009
(millions of dollars)
ASSETS Cash and cash equivalents 65.8 55.7 Accounts receivable (notes 6 and 14) 499.4 512.3 Income taxes receivable 34.7 59.6 Future income tax asset (note 8) 7.1 3.1 Other current assets (notes 6 and 7) 103.2 99.8 Assets held for sale (note 9) 110.9 121.5
821.1 852.0 Property, plant and equipment (note 10) 2,273.6 2,054.5 Power purchase arrangements (note 11) 517.0 504.7 Intangible assets (note 12) 113.2 128.7 Goodwill 16.0 16.0 Employee future benefits (note 13) 22.8 18.2 Future income tax asset (note 8) 91.2 89.2 Other long-term assets (notes 6, 7, and 15) 28.0 81.0
TOTAL ASSETS 3,882.9 3,744.3
LIABILITIES
Short-term debt (note 16) – 18.2 Accounts payable and accrued liabilities (notes 6 and 14) 327.7 314.0 Income taxes payable 35.6 49.3 Future income tax liability (note 8) 8.8 2.9 Current portion of long-term debt (notes 6 and 17) 50.0 46.1 Other current liabilities (notes 6 and 7) 77.6 98.2 Liabilities held for sale (note 9) 15.0 32.5
514.7 561.2 Long-term debt (notes 6 and 17) 1,377.7 1,273.7 Future income tax liability (note 8) 79.8 94.8 Other long-term liabilities (notes 6 and 7) 65.5 70.1
2,037.7 1,999.8
SHAREHOLDER’S EQUITY
Share capital (note 18) 280.1 280.1 Retained earnings 1,603.4 1,487.4 Accumulated other comprehensive loss (note 19) (38.3) (23.0)
1,845.2 1,744.5
TOTAL LIABILITIES AND SHAREHOLDER’S EQUITY 3,882.9 3,744.3
Commitments and contingencies (note 20)
See accompanying notes to consolidated financial statements.

Consolidated financial statements. pg53 ENMAX Corporation 2010
Consolidated statements of income and comprehensive income
YEAR ENDED DECEMBER 31 2010 2009
(millions of dollars)
REVENUE (note 5)
Electricity 1,601.6 1,503.8 Natural gas (restated – note 3) 335.6 350.8 Transmission and distribution 360.8 349.4 Contractual services 96.4 79.9 Other 9.8 71.0
TOTAL REVENUE 2,404.2 2,354.9
COST OF SERVICES PROVIDED (note 5)
Electricity 1,193.2 1,119.3 Natural gas (restated – note 3) 329.8 343.6 Local access fees and grid charges 179.7 157.7 Contractual services 57.2 51.7 Operations, maintenance and administration 217.3 223.0
TOTAL COST OF SERVICES PROVIDED 1,977.2 1,895.3
427.0 459.6 Amortization 165.4 135.2 Interest (note 21) 62.0 54.0 Current income taxes (note 8) 26.2 11.4 Future income taxes (note 8) (7.8) 52.4
NET EARNINGS FROM CONTINUING OPERATIONS 181.2 206.6Loss from discontinued operations, net of tax (note 9) (3.4) (0.7)
NET EARNINGS 177.8 205.9
OTHER COMPREHENSIVE LOSS, NET OF TAX
Unrealized gains (losses) on available for sale financial assets arising during the year, includes future income tax benefit of $0.1 (2009 – $0.3 expense) (0.6) 1.8 Realized losses on available for sale financial assets transferred to net earnings in the current year, includes future income tax expense of $0.2 (2009 – $nil) 1.0 0.2 Unrealized losses on derivatives designated as cash flow hedges, includes future income tax benefit of $5.0 (2009 – $4.3 expense) (60.7) (37.6) Realized losses on derivatives designated as cash flow hedges in prior periods transferred to net earnings in current year, includes future income tax benefit of $1.9 (2009 – $0.1 expense) 45.0 24.5
Other comprehensive loss, net of tax (15.3) (11.1)
COMPREHENSIVE INCOME 162.5 194.8
See accompanying notes to consolidated financial statements.

Consolidated financial statements. pg54 ENMAX Corporation 2010
Consolidated statements of shareholder’s equity
ACCUMULATED OTHER SHARE RETAINED COMPREHENSIVE CAPITAL EARNINGS INCOME TOTAL
(millions of dollars)
BALANCE, JANUARY 1, 2009 280.1 1,336.5 (11.9) 1,604.7 Net earnings – 205.9 – 205.9 Dividends – (55.0) – (55.0) Other comprehensive loss including future income tax expense of $4.7 (note 19) – – (11.1) (11.1)
BALANCE, DECEMBER 31, 2009 280.1 1,487.4 (23.0) 1,744.5 Net earnings – 177.8 – 177.8 Dividends – (61.8) – (61.8) Other comprehensive loss including future income tax benefit of $6.8 (note 19) – – (15.3) (15.3)
BALANCE, DECEMBER 31, 2010 280.1 1,603.4 (38.3) 1,845.2
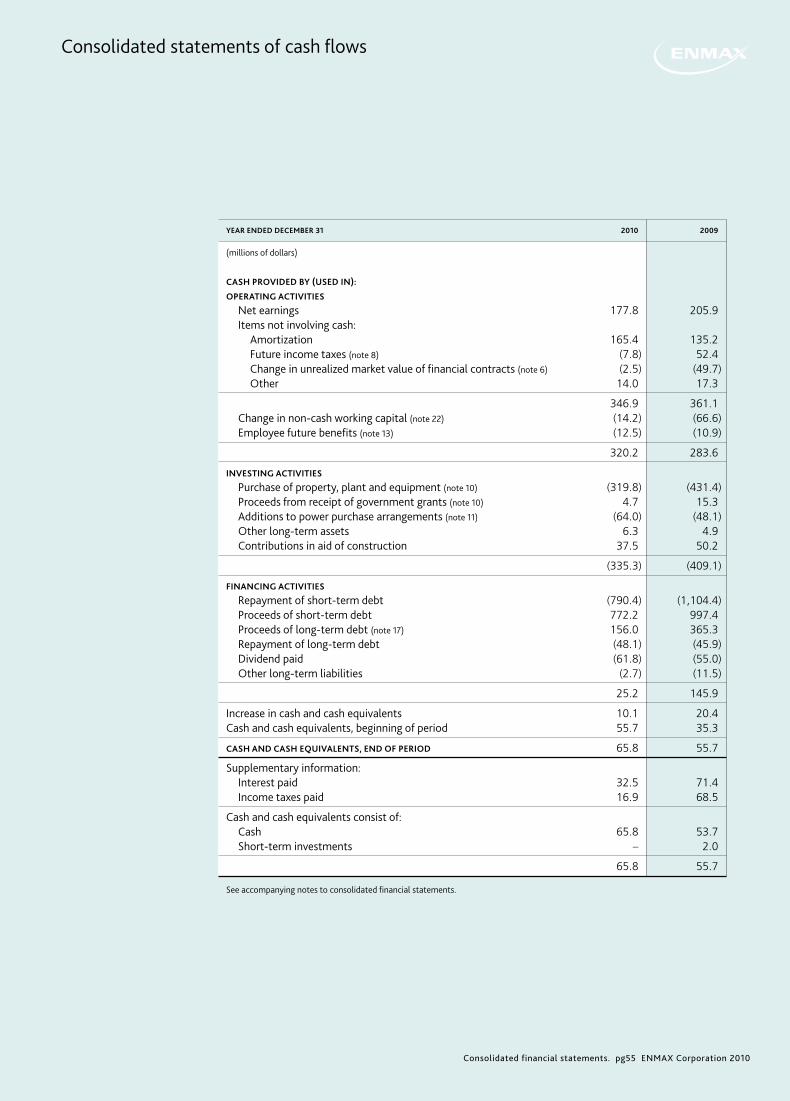
Consolidated financial statements. pg55 ENMAX Corporation 2010
Consolidated statements of cash flows
YEAR ENDED DECEMBER 31 2010 2009
(millions of dollars)
CASH PROVIDED BY (USED IN):
OPERATING ACTIVITIES
Net earnings 177.8 205.9 Items not involving cash: Amortization 165.4 135.2 Future income taxes (note 8) (7.8) 52.4 Change in unrealized market value of financial contracts (note 6) (2.5) (49.7) Other 14.0 17.3
346.9 361.1 Change in non-cash working capital (note 22) (14.2) (66.6) Employee future benefits (note 13) (12.5) (10.9)
320.2 283.6
INVESTING ACTIVITIES
Purchase of property, plant and equipment (note 10) (319.8) (431.4) Proceeds from receipt of government grants (note 10) 4.7 15.3 Additions to power purchase arrangements (note 11) (64.0) (48.1) Other long-term assets 6.3 4.9 Contributions in aid of construction 37.5 50.2
(335.3) (409.1)
FINANCING ACTIVITIES
Repayment of short-term debt (790.4) (1,104.4) Proceeds of short-term debt 772.2 997.4 Proceeds of long-term debt (note 17) 156.0 365.3 Repayment of long-term debt (48.1) (45.9) Dividend paid (61.8) (55.0) Other long-term liabilities (2.7) (11.5)
25.2 145.9
Increase in cash and cash equivalents 10.1 20.4Cash and cash equivalents, beginning of period 55.7 35.3
CASH AND CASH EQUIVALENTS, END OF PERIOD 65.8 55.7
Supplementary information: Interest paid 32.5 71.4 Income taxes paid 16.9 68.5
Cash and cash equivalents consist of: Cash 65.8 53.7 Short-term investments – 2.0
65.8 55.7
See accompanying notes to consolidated financial statements.

Notes to consolidated financial statements. pg56 ENMAX Corporation 2010
Notes to consolidated financial statements
1 Description of the business
ENMAX, a wholly owned subsidiary of The City, was incorporated under the Business Corporations Act (Alberta) in July 1997. The Corporation was formed to carry on the electric utility transmission and distribution operations previously carried on by the Calgary Electric System (CES), a former department of The City, in contemplation of the emerging deregulated electric industry in Alberta. As such, operations of the Corporation began on January 1, 1998, with the transfer of substantially all of the assets and liabilities of the CES by The City into the Corporation at net book value for consideration of one common share issued to The City.
The Corporation operates in two segments representing separately managed business units, each of which offers different products and services.
ENMAX ENERGY
ENMAX Energy is an operating segment established to carry out all non-regulated energy supply and retail functions through various legal entities and affiliated companies.
ENMAX POWER
ENMAX Power is primarily a regulated segment established to carry out electricity transmission and distribution service functions and the regulated-rate option retail function through various legal entities and affiliated companies. ENMAX Power also provides non-regulated engineering, procurement, construction and mainte-nance services.
2 Significant accounting policies
BASIS OF PRESENTATION
The consolidated financial statements have been prepared by management in accordance with GAAP. The consolidated financial statements include the accounts of the Corporation and its subsidiaries, as well as its proportionate share of the accounts of its joint ventures.
The assets and liabilities, results of operations and cash flows of the subsidiaries are included in the consoli-dated financial statements of the Corporation.
All inter-company accounts and transactions have been eliminated, except as described in note 14.
MEASUREMENT UNCERTAINTY
The preparation of the Corporation’s consolidated financial statements, in accordance with GAAP, requires management to make estimates that affect the reported amounts of revenues, expenses, assets and liabilities as well as the disclosure of contingent assets and liabilities at the financial statement date.
On January 1, 2001, the Alberta retail electricity marketplace opened to retail competition. The various systems and procedures used by third parties to provide load and settlement data to retailers across the province are required to completely and accurately capture all customer movement, load classification and consumption data. However, by regulation, wire service providers are not required to submit final load settlement data on customer electricity usage until eight months after the month in which such electricity was consumed. The data and associated processes and systems are used by the Corporation to estimate electricity revenues and costs, including unbilled consumption. The Corporation’s estimation procedures will not necessarily detect errors in underlying data provided by industry participants including wire service providers and load settle-ment agents. Any changes to electricity revenues and costs arising from these estimation processes will be accounted for as a change in estimate in the period they occur.
For determining potential impairment, the Corporation is required to estimate the fair values of certain assets. Estimates of fair values are based on undiscounted cash flow techniques which rely on a number of assumptions, such as the amount of future cash flows that will be generated from the asset, expected future prices for inputs and outputs and expected usage of the asset.

Notes to consolidated financial statements. pg57 ENMAX Corporation 2010
The allowance for doubtful accounts reflects an estimate of the accounts receivable that are ultimately expected to be uncollectible. It is based on a number of factors, including the aging of accounts receivable, historical write-offs within customer groups, assessments of the collectability of amounts from individual customers and general economic conditions.
Amortization is an estimate to allocate the cost of an asset over its estimated useful life on a systematic and rational basis. Estimating the appropriate useful lives of assets requires significant judgment and is based on estimates of useful life characteristics of common assets.
Measurement of the Corporation’s asset retirement obligations requires the use of estimates with respect to the amount and timing of asset retirements the extent of site remediation required and related future cash flows, inflation rates and discount rates.
Income taxes and amounts in lieu of income taxes are determined based upon estimates of the Corporation’s current income taxes and estimates of future taxes resulting from temporary tax differences. Future income tax assets are assessed to determine the likelihood that they will be recovered from future taxable income. To the extent that recovery is not considered more likely than not, a valuation allowance will be recorded and charged against income in the period that the allowance is created or revised.
Certain estimates are necessary since the regulatory environment in which the Corporation operates often requires amounts to be recorded at estimated values until finalization and adjustment, pursuant to subse-quent regulatory decisions, or other regulatory proceedings.
Certain financial instruments are recorded at fair value. These fair values can be subject to estimates of inputs other than quoted market prices, future prices, expected cash flows, and discount rates.
ENMAX has a defined benefit pension plan and post-retirement benefits that are provided to certain employees. The cost of these benefits recognized in the financial statements are subject to estimates around many factors including, but not limited to, assumptions of future return on plan assets, retirement age, mortality rates, discount rates, future health care costs, salary escalation rates, and claims experiences.
Adjustments to previous estimates, which will impact net income and could be material, are recorded in the period they become known.
CASH AND CASH EQUIVALENTS
Cash and cash equivalents consist of cash on hand balances with banks and investments in money market instruments with maturities within three months from the date of acquisition.
INVENTORY
Inventory is comprised of excess gas supply which has not been consumed in the generation of electricity and items held for resale. Inventory is valued at the lower of cost and net realizable value. Cost is determined using the weighted average cost method for all gas inventories and merchandise held for resale and the first-in-first-out method is applied to products held for lease. Cost includes direct materials, and where applicable, direct labour costs and overhead charges incurred in bringing the inventories to their present location and condition. Net realizable value is determined as the expected selling price less all estimated costs to completion and costs to be incurred in marketing, selling and distribution.
PROPERTY, PLANT AND EQUIPMENT (PPE)
PPE are recorded at cost, which includes direct labour, material, equipment charges, directly attributable overhead and interest during construction (IDC). IDC is capitalized on a monthly basis on qualifying assets by applying a borrowing rate to the carrying amount of the asset. Qualifying assets are those assets that take a substantial period of time to complete (greater than or equal to six months) or of such substantial value that would incur significant borrowing costs over a shorter period of time.
The Corporation classifies all major future components of its electricity transmission and distribution system infrastructure as PPE. These items are not amortized until they are placed into service.
2 Significant accounting policies (CONTINUED)
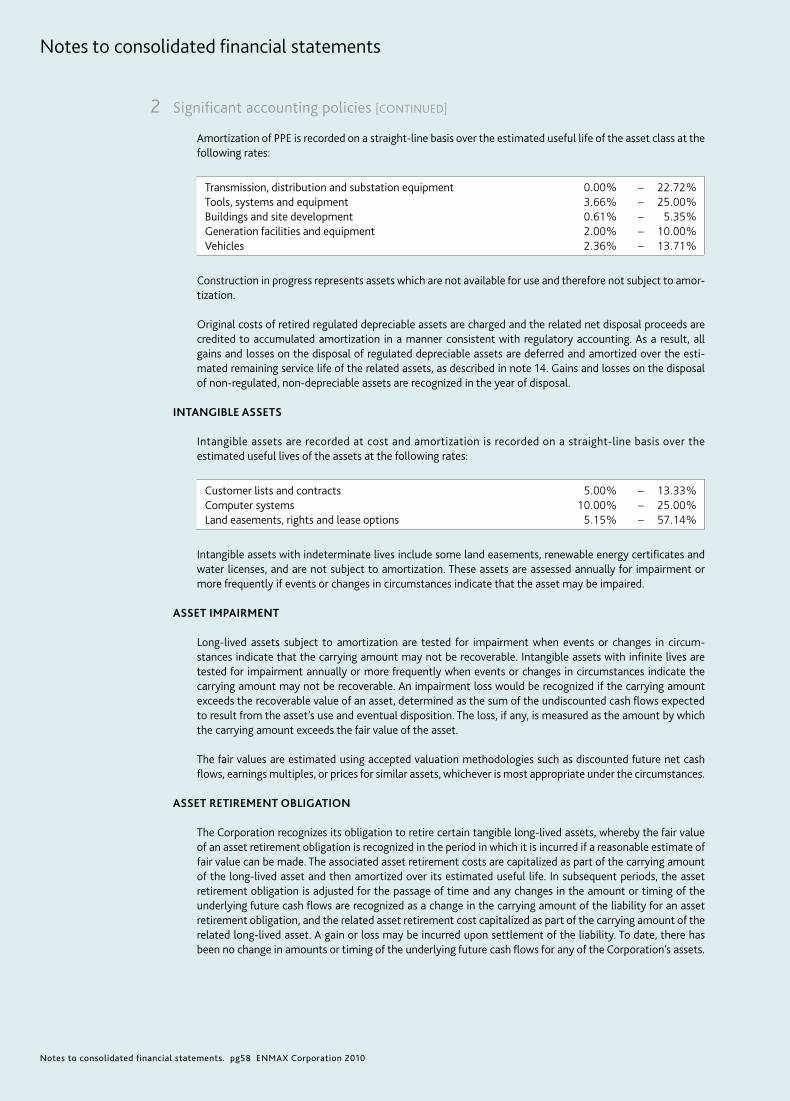
Notes to consolidated financial statements. pg58 ENMAX Corporation 2010
Notes to consolidated financial statements
2 Significant accounting policies [CONTINUED]
Amortization of PPE is recorded on a straight-line basis over the estimated useful life of the asset class at the following rates:
Transmission, distribution and substation equipment 0.00% – 22.72%Tools, systems and equipment 3.66% – 25.00%Buildings and site development 0.61% – 5.35%Generation facilities and equipment 2.00% – 10.00%Vehicles 2.36% – 13.71%
Construction in progress represents assets which are not available for use and therefore not subject to amor-tization.
Original costs of retired regulated depreciable assets are charged and the related net disposal proceeds are credited to accumulated amortization in a manner consistent with regulatory accounting. As a result, all gains and losses on the disposal of regulated depreciable assets are deferred and amortized over the esti-mated remaining service life of the related assets, as described in note 14. Gains and losses on the disposal of non-regulated, non-depreciable assets are recognized in the year of disposal.
INTANGIBLE ASSETS
Intangible assets are recorded at cost and amortization is recorded on a straight-line basis over the estimated useful lives of the assets at the following rates:
Customer lists and contracts 5.00% – 13.33%Computer systems 10.00% – 25.00%Land easements, rights and lease options 5.15% – 57.14%
Intangible assets with indeterminate lives include some land easements, renewable energy certificates and water licenses, and are not subject to amortization. These assets are assessed annually for impairment or more frequently if events or changes in circumstances indicate that the asset may be impaired.
ASSET IMPAIRMENT
Long-lived assets subject to amortization are tested for impairment when events or changes in circum-stances indicate that the carrying amount may not be recoverable. Intangible assets with infinite lives are tested for impairment annually or more frequently when events or changes in circumstances indicate the carrying amount may not be recoverable. An impairment loss would be recognized if the carrying amount exceeds the recoverable value of an asset, determined as the sum of the undiscounted cash flows expected to result from the asset’s use and eventual disposition. The loss, if any, is measured as the amount by which the carrying amount exceeds the fair value of the asset.
The fair values are estimated using accepted valuation methodologies such as discounted future net cash flows, earnings multiples, or prices for similar assets, whichever is most appropriate under the circumstances.
ASSET RETIREMENT OBLIGATION
The Corporation recognizes its obligation to retire certain tangible long-lived assets, whereby the fair value of an asset retirement obligation is recognized in the period in which it is incurred if a reasonable estimate of fair value can be made. The associated asset retirement costs are capitalized as part of the carrying amount of the long-lived asset and then amortized over its estimated useful life. In subsequent periods, the asset retirement obligation is adjusted for the passage of time and any changes in the amount or timing of the underlying future cash flows are recognized as a change in the carrying amount of the liability for an asset retirement obligation, and the related asset retirement cost capitalized as part of the carrying amount of the related long-lived asset. A gain or loss may be incurred upon settlement of the liability. To date, there has been no change in amounts or timing of the underlying future cash flows for any of the Corporation’s assets.

Notes to consolidated financial statements. pg59 ENMAX Corporation 2010
2 Significant accounting policies [CONTINUED]
At December 31, 2010, and 2009, the Corporation’s asset retirement obligations relate to costs associated with the removal and decommissioning of its fibre optic network, generating assets and proportionate share of jointly owned assets. The expected remediation liabilities approximate to $9.1 million and has been discounted using a credit-adjusted discount rates ranging from 5.36% – 8.77%. The undiscounted liabilities amount to $86.6 million and are expected to settle from 2033 to 2056.
The Corporation has an obligation to decommission its electricity transmission and distribution assets in Alberta. Due to the timing and cost of such future decommissioning activities being unknown, these costs are not reasonably estimated. Accordingly, the Corporation is unable to estimate the fair value of this asset retirement obligation and has not recorded this in the consolidated financial statements. The obligation will be recorded when sufficient information is available to reasonably estimate the settlement date and the cost and method of settlement.
CONTRIBUTIONS IN AID OF CONSTRUCTION
Under various statutory requirements and agreements with customers and developers, the Corporation receives contributions in aid of construction (CIAC) in the form of cash contributions. Such contributions are recorded as a reduction of PPE and amortized on the same basis as, and offset the amortization charge for, the assets to which they relate.
GOVERNMENT GRANTS
Government grants are accounted for using the capital approach. Under this method, amounts received have been deducted from the carrying amount of the related assets. Government grants are not recognized until there is reasonable assurance that the Corporation will comply with the conditions attached to them and that the grants will be received. Government grants have been received by the Corporation for the purchases of certain items of PPE.
POWER PURCHASE ARRANGEMENTS (PPAs)
The cost to acquire the PPAs has been recorded on the consolidated balance sheet as a long-term asset. The cost is amortized on a straight-line basis to amortization expense over the life of the arrangements.
GOODWILL
Goodwill, which represents the excess of purchase price over fair value of net assets acquired, is annually assessed for impairment. Goodwill and all other assets and liabilities have been allocated to the Corpora-tion’s segments, referred to as reporting units. To assess impairment, the fair value of each reporting unit is determined and compared to the book value of the reporting unit. If the fair value of the reporting unit is less than the book value, then a second test is performed to determine the amount of the impairment. The amount of the impairment is determined by deducting the fair value of the reporting unit’s assets and liabilities from the fair value of the reporting unit to determine the implied fair value of goodwill and comparing that amount to the book value of the reporting unit’s goodwill. Any excess of the book value of goodwill over the implied fair value of goodwill is the impairment amount.
REVENUE RECOGNITION
Revenues are recognized on an accrual basis as services are provided and include an estimate of fees for services provided but not yet billed. For ENMAX Power’s billable construction projects, revenue is recognized on the percentage of completion basis. All revenues are reviewed for collectability and only recognized when collection is reasonably assured.
INCOME TAX
The Corporation and its subsidiaries are municipally owned and are generally not subject to federal and provincial income taxes. Those subsidiaries that do not meet the criteria for municipal exemption are taxable under the ITA. The Corporation also records income tax expense based on a regulation to the Alberta EUA that requires tax exempt, municipally owned entities to make PILOT on certain portions of their operations. These PILOT payments are made to the Balancing Pool of Alberta.

Notes to consolidated financial statements. pg60 ENMAX Corporation 2010
Notes to consolidated financial statements
2 Significant accounting policies [CONTINUED]
ENMAX uses the liability method of accounting for income taxes and PILOT. Under this method, current income taxes are recognized for the estimated income taxes payable or recoverable for the current year. Future income tax assets and liabilities are recognized for the future tax consequences attributable to temporary (or timing) differences between the financial statement carrying amounts of existing assets and liabilities and their respective tax bases. Future income tax assets and liabilities are measured using enacted or substantively enacted rates of tax expected to apply to taxable income in the years in which those temporary differences are expected to be recovered or settled. The effect of a change in tax rates on future tax assets and liabilities is recognized in income in the period that includes the date of enactment or substantive enactment.
FINANCIAL INSTRUMENTS
The financial instruments of the Corporation include held-for-trading instruments, loans and receivables, available-for-sale instruments and other financial liabilities.
Cash and cash equivalents are classified as held-for-trading instruments and are recorded at fair value. Accounts receivable are classified as loans and receivables and are recorded initially at fair value and subse-quently carried at amortized cost with interest and other income earned from these financial assets recorded in other revenue. Short-term debt, long-term debt, customer guarantee deposits, dividends payable and accounts payable and accrued liabilities are classified as other financial liabilities and are recorded initially at fair value and subsequently carried at amortized cost using the effective interest method. Investments in equity instruments are classified as available-for-sale instruments and are carried at fair value with changes to fair value recorded through other comprehensive income. Investments in equity instruments that do not have a quoted market price in an active market are measured at cost. Derivatives such as swaps, futures, options and forwards are classified as held-for-trading instruments and are recorded at their fair value with changes in fair value recorded through income. However, if these derivatives are designated as hedging items, they are accounted for as described in the Hedges section of this note.
Held-for-trading items are required to be classified as such due to their nature as a derivative or are items held for the purpose of selling or repurchasing in the near term. Available-for-sale items are non-derivative financial assets that do not fit into any of the other classes of financial assets.
The Corporation uses an allowance for doubtful accounts to reduce the carrying amount of accounts receivables that are impaired. This allowance is based on a number of factors including the aging of accounts receivable, historical write-offs within customer groups, assessments of the collectibility of amounts from individual customers and general economic conditions. Write-offs are determined using similar techniques and by reviewing significant amounts on a case-by-case basis.
Other financial assets are reviewed for impairment by comparing their carrying value to fair value. An impair-ment loss is recorded in earnings during the period in which the fair value falls below the carrying value, and such decline is other than temporary.
The Corporation has a procurement contract denominated in Japanese Yen. As this foreign currency is not a common transaction currency of the Corporation, the Corporation’s policy is to account for this embedded foreign currency derivative separately from the underlying host contract.
Transaction costs that are directly attributable to the issuance of financial liabilities are netted against the fair value initially recognized. These costs are subsequently expensed to earnings using the effective interest rate method.
HEDGES
In conducting its business, the Corporation uses derivatives and other financial instruments, including forward contracts, swaps, options and contracts-for-differences to manage its exposure to certain market risks. Certain derivatives are designated as hedging instruments for accounting purposes when meeting certain effective-ness and documentation requirements at inception of the hedging relationship and on an ongoing basis. Effectiveness is measured with reference to the risk management objective and strategy for the hedged item.

Notes to consolidated financial statements. pg61 ENMAX Corporation 2010
2 Significant accounting policies [CONTINUED]
Cash flow hedges are used to manage the variability of cash flows resulting from the purchase and sale of electricity and natural gas as well as foreign exchange. For cash flow hedges, changes in the fair value of the effective portion of the hedging derivative are accumulated in other comprehensive income and recognized in net earnings during the periods when the cash flows of the hedged item is realized. Gains and losses on cash flow hedges are reclassified immediately to net earnings when the hedged item is sold or terminated early or when a hedged anticipated transaction is no longer probable. Changes in fair value due to ineffec-tiveness of hedges, as well as changes in fair value of non-hedge derivatives are recorded in earnings under cost of services provided. Changes in fair value of de-designated or discontinued hedges are recorded in earnings under cost of services provided from the date of de-designation or discontinuation. The unrealized changes in fair value recorded prior to de-designation or discontinuation are reclassified from accumulated other comprehensive income to earnings when the relating hedged item is recognized in earnings.
FOREIGN CURRENCY TRANSLATION
The Corporation’s consolidated financial statements are presented in Canadian dollars, which is the func-tional currency of the Corporation and all of its subsidiaries.
Foreign currency transactions are translated into the functional currency using the exchange rates prevailing at the dates of the transactions. Foreign exchange gains and losses resulting from the settlement of such transactions and from the translation at year-end exchange rates of monetary items and liabilities de-nominated in foreign currencies are recognized in the income statement, except when deferred in equity as qualifying cash flow hedges.
Foreign exchange gains are recorded in other income on the consolidated statements of income. Foreign exchange losses are presented on the consolidated statements of income within OM&A.
EMPLOYEE BENEFIT PLANS
The Corporation sponsors pension plans that contain both defined benefit and defined contribution provisions. The cost of defined benefit pensions and other post-employment benefits earned by employees is actuarially determined using the projected benefit method pro-rated on service and management’s best estimate of expected plan investment performance, salary escalation, retirement ages of employees and expected health care costs. Pension plan assets are measured at fair market value. For the purpose of calculating the expected return on plan assets for the net benefit cost, a market-related value is used.
The market-related value of assets is calculated based on the average of the adjusted market value of assets for the current and three preceding years. The adjusted market values are determined from the preceding three year-end market values accumulated to the end of the fiscal year in question using net contributions less distributions and assumed investment return. Adjustments arising from plan amendments are amortized on a straight-line basis over the average remaining service lifetime of employees active at the date of amendment. The excess of the cumulative, unamortized net actuarial gain or loss over 10% of the greater of the benefit obligation and the fair value of plan assets at the beginning of the year is amortized over the average remaining service lifetime of the active employees.
EMISSION CREDITS AND ALLOWANCES
Effective July 1, 2007, the Climate Change and Emissions Management Amendment Act (CCEMA Act) was enacted into law in Alberta. The Act establishes baseline emission intensity levels for each large generating facility, and emissions over this baseline are subject to a surcharge. Changes in law provisions in the Corporation’s PPAs have the potential to expose the Corporation to significant portions of these compliance costs (note 20). The Corporation’s accounting policy for emission credits and allowances, which will form part of the compliance cost, is described below.
Purchased emission allowances are recorded on the consolidated balance sheet, as part of intangible assets, at historical cost and are carried at the lower of weighted average cost and net realizable value. Allowances granted to the Corporation or internally generated from approved projects are accounted for as intangible assets.
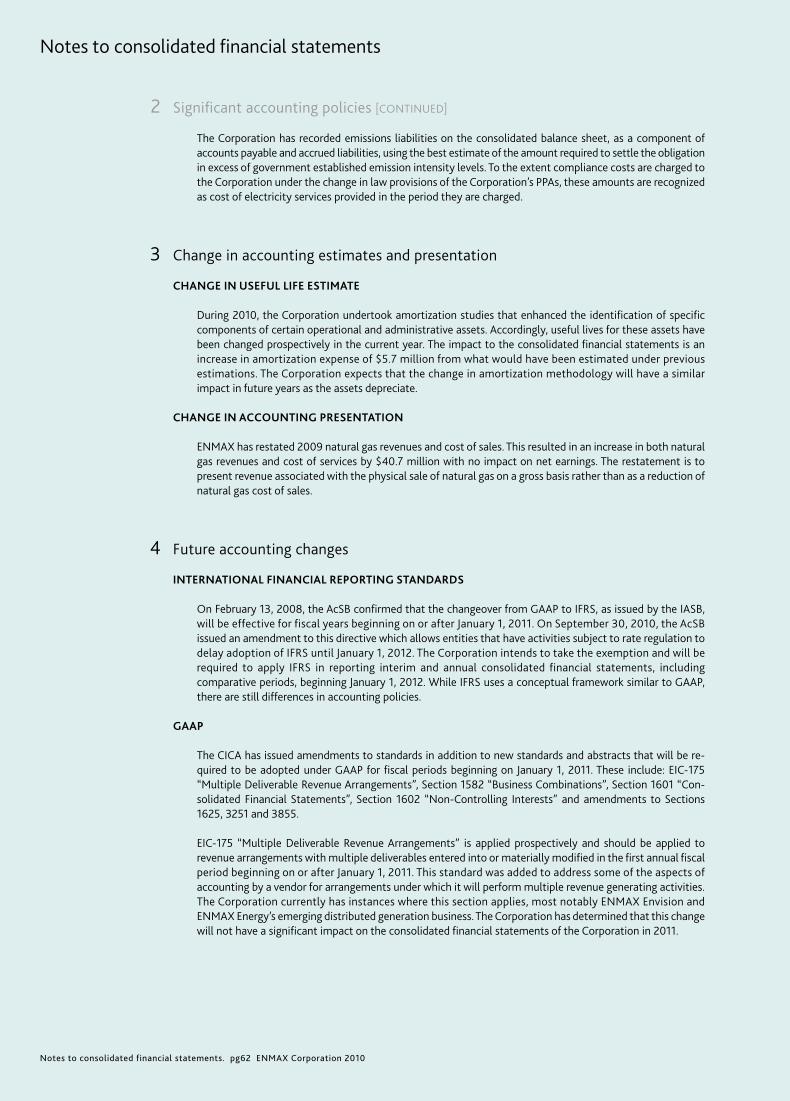
Notes to consolidated financial statements. pg62 ENMAX Corporation 2010
Notes to consolidated financial statements
2 Significant accounting policies [CONTINUED]
The Corporation has recorded emissions liabilities on the consolidated balance sheet, as a component of accounts payable and accrued liabilities, using the best estimate of the amount required to settle the obligation in excess of government established emission intensity levels. To the extent compliance costs are charged to the Corporation under the change in law provisions of the Corporation’s PPAs, these amounts are recognized as cost of electricity services provided in the period they are charged.
3 Change in accounting estimates and presentation
CHANGE IN USEFUL LIFE ESTIMATE
During 2010, the Corporation undertook amortization studies that enhanced the identification of specific components of certain operational and administrative assets. Accordingly, useful lives for these assets have been changed prospectively in the current year. The impact to the consolidated financial statements is an increase in amortization expense of $5.7 million from what would have been estimated under previous estimations. The Corporation expects that the change in amortization methodology will have a similar impact in future years as the assets depreciate.
CHANGE IN ACCOUNTING PRESENTATION
ENMAX has restated 2009 natural gas revenues and cost of sales. This resulted in an increase in both natural gas revenues and cost of services by $40.7 million with no impact on net earnings. The restatement is to present revenue associated with the physical sale of natural gas on a gross basis rather than as a reduction of natural gas cost of sales.
4 Future accounting changes
INTERNATIONAL FINANCIAL REPORTING STANDARDS
On February 13, 2008, the AcSB confirmed that the changeover from GAAP to IFRS, as issued by the IASB, will be effective for fiscal years beginning on or after January 1, 2011. On September 30, 2010, the AcSB issued an amendment to this directive which allows entities that have activities subject to rate regulation to delay adoption of IFRS until January 1, 2012. The Corporation intends to take the exemption and will be required to apply IFRS in reporting interim and annual consolidated financial statements, including comparative periods, beginning January 1, 2012. While IFRS uses a conceptual framework similar to GAAP, there are still differences in accounting policies.
GAAP
The CICA has issued amendments to standards in addition to new standards and abstracts that will be re-quired to be adopted under GAAP for fiscal periods beginning on January 1, 2011. These include: EIC-175 “Multiple Deliverable Revenue Arrangements”, Section 1582 “Business Combinations”, Section 1601 “Con-solidated Financial Statements”, Section 1602 “Non-Controlling Interests” and amendments to Sections 1625, 3251 and 3855.
EIC-175 “Multiple Deliverable Revenue Arrangements” is applied prospectively and should be applied to revenue arrangements with multiple deliverables entered into or materially modified in the first annual fiscal period beginning on or after January 1, 2011. This standard was added to address some of the aspects of accounting by a vendor for arrangements under which it will perform multiple revenue generating activities. The Corporation currently has instances where this section applies, most notably ENMAX Envision and ENMAX Energy’s emerging distributed generation business. The Corporation has determined that this change will not have a significant impact on the consolidated financial statements of the Corporation in 2011.

Notes to consolidated financial statements. pg63 ENMAX Corporation 2010
4 Future accounting changes (CONTINUED)
CICA Handbook Section 1582 ‘‘Business Combinations’’ is effective for business combinations with an acqui-sition date after January 1, 2011. This standard was amended to require additional use of fair value measure-ments, recognition of additional assets and liabilities and increased disclosure. Adopting this standard is expected to have a material effect on the way the Corporation accounts for future business combinations. Entities adopting Section 1582 will also be required to adopt CICA Handbook Sections 1601 ‘‘Consolidated Financial Statements’’ and 1602 ‘‘Non-Controlling Interests’’. These standards will require a change in the measurement of non-controlling interest and will require the change to be presented as part of Shareholder’s equity on the balance sheet. In addition, the income statement of the controlling parent will include 100% of the subsidiary’s results and present the allocation between the controlling interest and non-controlling interest. Currently, the Corporation has no significant non-controlling interest and therefore adoption of these new standards will have no impact. These standards will be effective January 1, 2011, with early adoption permitted. The changes resulting from adopting Section 1582 will be applied prospectively, and the changes from adopting Sections 1601 and 1602 will be applied retrospectively.
CICA Handbook Section 1625 “Comprehensive Revaluation of Assets and Liabilities” applies prospectively to comprehensive revaluations of assets and liabilities occurring in fiscal years beginning on or after January 1, 2011. This standard was amended to remove the discussion on non-controlling interest, as this is now being discussed in CICA Handbook Section 1582 “Business Combinations” and CICA Handbook Section 1602 “Non-Controlling Interests”. Fair value measurement is also now discussed in Section 1582. There is no effect on the consolidated financial statements as of January 1, 2011.
CICA Handbook Section 3251 “Equity” applies prospectively to annual and interim consolidated financial statements relating to fiscal years beginning on or after January 1, 2011. This standard was amended requiring companies to present separately changes in equity for the period arising from changes in reserves. An entity must also present separately non-controlling interest as a separate component of equity. Currently, the Corporation has no significant non-controlling interests; therefore, adoption of these new standards will have no impact.
CICA Handbook Section 3855 “Financial Instruments – Recognition and Measurement” applies prospec-tively to annual and interim consolidated financial statements relating to fiscal years beginning on or after January 1, 2011. This standard was amended as follows: clarified application of the effective interest method after a debt instrument has been impaired; clarified when an embedded prepayment option is separated from its host debt instrument for accounting purposes; altered the definitions of a financial asset or financial liability held for trading; provided further guidance concerning the assessment of embedded derivatives upon reclassification of financial assets out of the held for trading category; addressed accounting for foreign exchange gains and losses on a reclassification out of the available for sale category; and finally, addressed reversals of impairment losses previously recognized in net income. The Corporation has assessed the amendments to this section noting that there will be no impact to the Corporation’s consolidated financial statements.
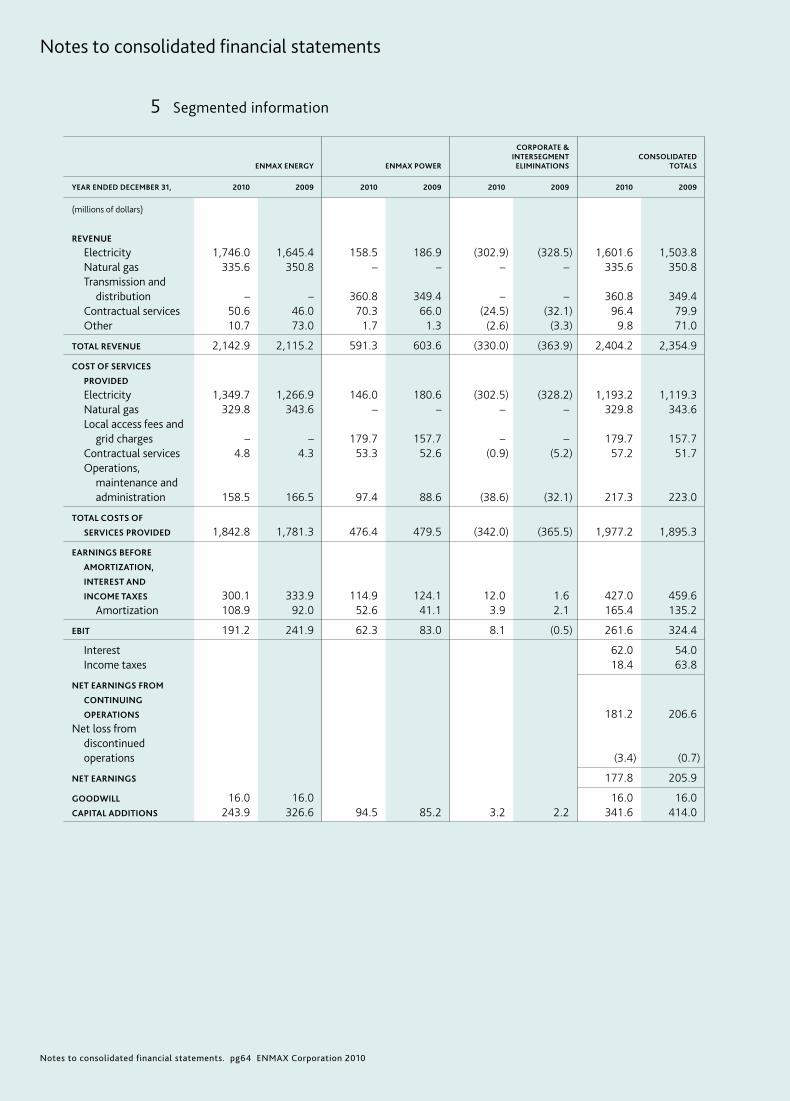
Notes to consolidated financial statements. pg64 ENMAX Corporation 2010
Notes to consolidated financial statements
5 Segmented information
CORPORATE & INTERSEGMENT CONSOLIDATED ENMAX ENERGY ENMAX POWER ELIMINATIONS TOTALS
YEAR ENDED DECEMBER 31, 2010 2009 2010 2009 2010 2009 2010 2009
(millions of dollars)
REVENUE
Electricity 1,746.0 1,645.4 158.5 186.9 (302.9) (328.5) 1,601.6 1,503.8 Natural gas 335.6 350.8 – – – – 335.6 350.8 Transmission and distribution – – 360.8 349.4 – – 360.8 349.4 Contractual services 50.6 46.0 70.3 66.0 (24.5) (32.1) 96.4 79.9 Other 10.7 73.0 1.7 1.3 (2.6) (3.3) 9.8 71.0
TOTAL REVENUE 2,142.9 2,115.2 591.3 603.6 (330.0) (363.9) 2,404.2 2,354.9
COST OF SERVICES
PROVIDED
Electricity 1,349.7 1,266.9 146.0 180.6 (302.5) (328.2) 1,193.2 1,119.3 Natural gas 329.8 343.6 – – – – 329.8 343.6 Local access fees and grid charges – – 179.7 157.7 – – 179.7 157.7 Contractual services 4.8 4.3 53.3 52.6 (0.9) (5.2) 57.2 51.7 Operations, maintenance and administration 158.5 166.5 97.4 88.6 (38.6) (32.1) 217.3 223.0
TOTAL COSTS OF
SERVICES PROVIDED 1,842.8 1,781.3 476.4 479.5 (342.0) (365.5) 1,977.2 1,895.3
EARNINGS BEFORE
AMORTIZATION,
INTEREST AND
INCOME TAXES 300.1 333.9 114.9 124.1 12.0 1.6 427.0 459.6 Amortization 108.9 92.0 52.6 41.1 3.9 2.1 165.4 135.2
EBIT 191.2 241.9 62.3 83.0 8.1 (0.5) 261.6 324.4
Interest 62.0 54.0 Income taxes 18.4 63.8
NET EARNINGS FROM
CONTINUING
OPERATIONS 181.2 206.6Net loss from discontinued operations (3.4) (0.7)
NET EARNINGS 177.8 205.9
GOODWILL 16.0 16.0 16.0 16.0CAPITAL ADDITIONS 243.9 326.6 94.5 85.2 3.2 2.2 341.6 414.0

Notes to consolidated financial statements. pg65 ENMAX Corporation 2010
SEGMENTED TOTAL ASSETS
AS AT DECEMBER 31, 2010 2009
(millions of dollars)
ENMAX Energy 2,635.2 2,524.5ENMAX Power 1,157.7 1,068.7Corporate and eliminations 90.0 151.1
3,882.9 3,744.3
6 Financial instruments, hedges and risk management
OVERVIEW OF RISK MANAGEMENT
ENMAX is exposed to market risk, credit risk and liquidity risk. The Corporation’s strategy, policies and controls are designed to ensure that the risks it assumes and other related risks comply with regulatory requirements, ENMAX’s internal objectives and its risk tolerance. Risks are managed within limits approved by the Board of Directors and applied by senior management. The following table summarizes the risk associated with the Corporation’s financial instruments and derivatives outstanding as at December 31, 2010:
MEASURED INITIALLY AT FAIR VALUE AND SUBSEQUENTLY AT COST OR AMORTIZED COST
INITIALLY AND SUBSEQUENTLY MEASURED AT FAIR VALUE
ACCOUNTS RECEIVABLE
ACCOUNTS
PAYABLE
SHORT-TERM DEBT AND
LONG-TERM DEBT
CASH AND CASH
EQUIVALENTS
INVESTMENTS
ELECTRICITY AND NATURAL GAS DERIVATIVES
MARKET RISK
- Commodity prices - Foreign exchange - Interest rate - Equity price risk
CREDIT RISK LIQUIDITY RISK
MARKET RISK
ENMAX builds and acquires energy infrastructure assets and enters into energy supply contracts to meet its demand obligations, purchases and sells commodities in North American markets both for resale and to manage market risk associated with generation output, enters transactions denominated in foreign currencies (U.S. dollars and Japanese Yen) and borrows funds over short- and long-term time horizons. These activities expose ENMAX to market risk from changes in commodity prices, foreign exchange rates and interest rates which affect the Corporation’s earnings and the value of associated financial instruments it holds.
ENMAX uses various contractual agreements and financial instruments to manage its energy portfolio and market risk exposures including, but not limited to, the following:
- PPAs – contractual agreements to convey rights for the PPA buyer to all, or a portion of, the electricity from a generation facility for suitable compensation, as defined under the respective terms and conditions of each agreement. ENMAX has entered into PPAs for electricity from the units at the Keephills and Battle River coal-fired generation facilities.
- Swaps – contractual agreements between two parties to exchange streams of payments over time according to specified terms. ENMAX enters into commodity, cross-currency and interest rate swaps to mitigate the impact of changes in commodity prices, foreign exchange rates and interest rates.
- Forwards and futures – contractual agreements to purchase or sell a specific commodity or financial instrument at a specified price and date in the future. ENMAX enters into forwards and futures to mitigate the impact of volatility in commodity prices and foreign exchange rates.
5 Segmented information (CONTINUED)

Notes to consolidated financial statements. pg66 ENMAX Corporation 2010
Notes to consolidated financial statements
6 Financial instruments, hedges and risk management (CONTINUED)
- Options – contractual agreements to convey the right, but not the obligation, for the purchaser to buy or sell a specific amount of a commodity or financial instrument at a fixed price, either at a fixed date or at any time within a specified period. Occasionally, ENMAX enters into option agreements to mitigate the impact of changes in commodity prices, foreign exchange rates and interest rates.
COMMODITY PRICE RISK
ENMAX has inherent positions in electricity and natural gas commodities arising from its owned and controlled supply assets and its demand obligations. While ENMAX’s vertically-integrated business model is designed to achieve a balanced portfolio, its electricity and natural gas positions experience periodic imbalances resulting in exposures to price volatility from spot or short-term contract markets. The Corporation purchases and sells electricity and natural gas commodities in the wholesale market to mitigate the risk exposures arising from such positions.
While the Corporation does not engage in speculative financial instrument trading, it uses various hedging strategies executed within a controlled environment to mitigate these commodity price risks, including the use of derivatives instruments such as swaps and forwards. However, hedging does not guard against all risks and is not always effective as it is based upon predictions about future market conditions. ENMAX could recognize financial losses as a result of volatility in the market values of these contracts.
RISK ANALYSIS AND CONTROL
ENMAX manages its exposure to energy risk on a portfolio basis, which includes asset positions arising from its interests in generation facilities, liability positions arising from its commitments to its customers and transacting positions arising from its hedging activities.
SENSITIVITY ANALYSIS ON MARKET RISKS
The analysis below represents the effect of market risks (interest rate risk, foreign currency exchange risk, commodity price risk and equity price risk) on the Corporation’s results as those risks apply to derivative financial instruments. Non-derivative financial instruments are recorded at cost. The carrying amounts of non-derivative financial instruments are not affected by changes in market variables, whereas carrying amounts of derivative financial instruments are affected by market variables.
The following table reflects the sensitivity of the fair value of outstanding derivative instruments to reasonably possible changes in the markets of derivative financial instruments. Market interest rates impact interest rate swaps. Foreign currency exchange rates impact commodity derivatives and foreign currency hedge contracts. Forward prices of natural gas and electricity impact commodity derivatives. Market value of equity invest-ments impacts those instruments carried at fair value.
Certain assumptions have been made in arriving at the sensitivity analysis. These assumptions are as follows:
- The same fair value methodologies have been used as were used to obtain actual fair values in the fair values section of this note.
- Changes in the fair value of derivative instruments that are effective cash flow hedges are recorded in other comprehensive income.
- Changes in the fair value of derivative instruments that are not designated as hedges, that are fair value hedges or that are ineffective cash flow hedges are recorded in earnings.
- Foreign currency balances, principal and notional amounts are based on amounts as at December 31, 2010.
- Interest rate sensitivities are based on a combination of the Canadian Dealer Offered Rate (CDOR) and the London Interbank Offered Rate (LIBOR) with an assumption that LIBOR is equal to CDOR plus 0.001%.
- Sensitivities are exclusive of any potential income tax impacts.
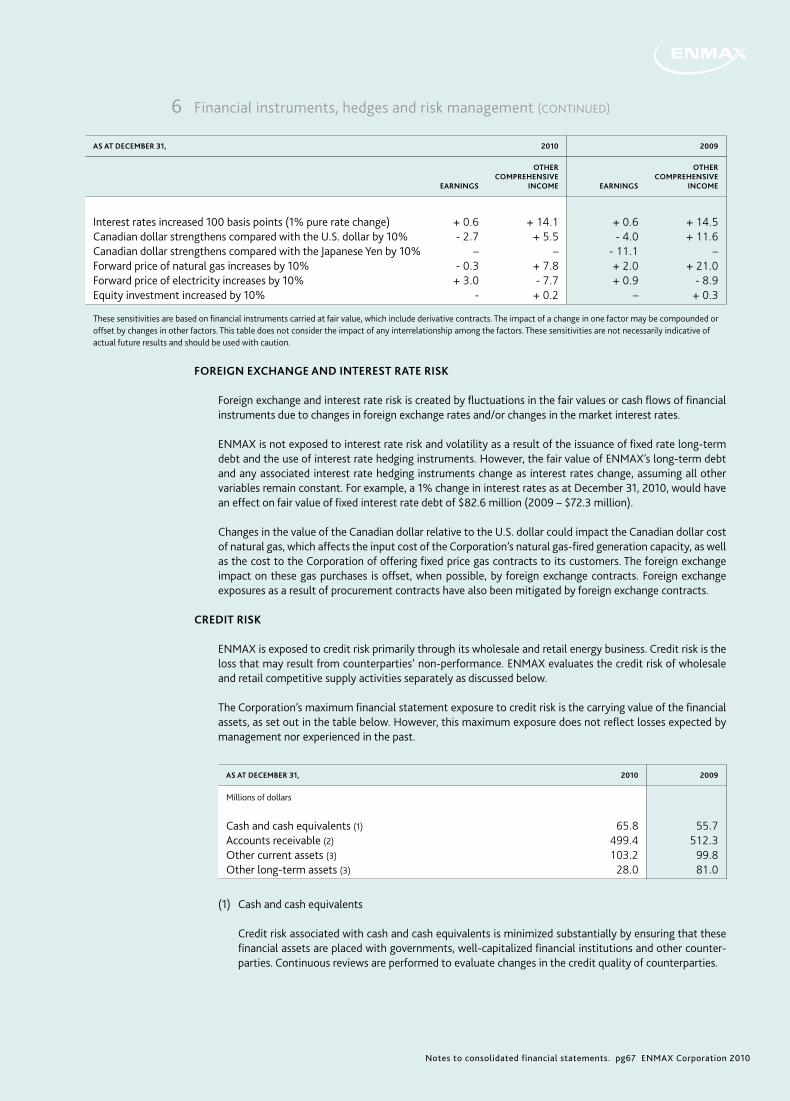
Notes to consolidated financial statements. pg67 ENMAX Corporation 2010
AS AT DECEMBER 31, 2010 2009
OTHER OTHER COMPREHENSIVE COMPREHENSIVE EARNINGS INCOME EARNINGS INCOME
Interest rates increased 100 basis points (1% pure rate change) + 0.6 + 14.1 + 0.6 + 14.5Canadian dollar strengthens compared with the U.S. dollar by 10% - 2.7 + 5.5 - 4.0 + 11.6Canadian dollar strengthens compared with the Japanese Yen by 10% – – - 11.1 –Forward price of natural gas increases by 10% - 0.3 + 7.8 + 2.0 + 21.0Forward price of electricity increases by 10% + 3.0 - 7.7 + 0.9 - 8.9Equity investment increased by 10% - + 0.2 – + 0.3
These sensitivities are based on financial instruments carried at fair value, which include derivative contracts. The impact of a change in one factor may be compounded or offset by changes in other factors. This table does not consider the impact of any interrelationship among the factors. These sensitivities are not necessarily indicative of actual future results and should be used with caution.
FOREIGN EXCHANGE AND INTEREST RATE RISK
Foreign exchange and interest rate risk is created by fluctuations in the fair values or cash flows of financial instruments due to changes in foreign exchange rates and/or changes in the market interest rates.
ENMAX is not exposed to interest rate risk and volatility as a result of the issuance of fixed rate long-term debt and the use of interest rate hedging instruments. However, the fair value of ENMAX’s long-term debt and any associated interest rate hedging instruments change as interest rates change, assuming all other variables remain constant. For example, a 1% change in interest rates as at December 31, 2010, would have an effect on fair value of fixed interest rate debt of $82.6 million (2009 – $72.3 million).
Changes in the value of the Canadian dollar relative to the U.S. dollar could impact the Canadian dollar cost of natural gas, which affects the input cost of the Corporation’s natural gas-fired generation capacity, as well as the cost to the Corporation of offering fixed price gas contracts to its customers. The foreign exchange impact on these gas purchases is offset, when possible, by foreign exchange contracts. Foreign exchange exposures as a result of procurement contracts have also been mitigated by foreign exchange contracts.
CREDIT RISK
ENMAX is exposed to credit risk primarily through its wholesale and retail energy business. Credit risk is the loss that may result from counterparties’ non-performance. ENMAX evaluates the credit risk of wholesale and retail competitive supply activities separately as discussed below.
The Corporation’s maximum financial statement exposure to credit risk is the carrying value of the financial assets, as set out in the table below. However, this maximum exposure does not reflect losses expected by management nor experienced in the past.
AS AT DECEMBER 31, 2010 2009
Millions of dollars
Cash and cash equivalents (1) 65.8 55.7Accounts receivable (2) 499.4 512.3Other current assets (3) 103.2 99.8Other long-term assets (3) 28.0 81.0
(1) Cash and cash equivalents
Credit risk associated with cash and cash equivalents is minimized substantially by ensuring that these financial assets are placed with governments, well-capitalized financial institutions and other counter-parties. Continuous reviews are performed to evaluate changes in the credit quality of counterparties.
6 Financial instruments, hedges and risk management (CONTINUED)
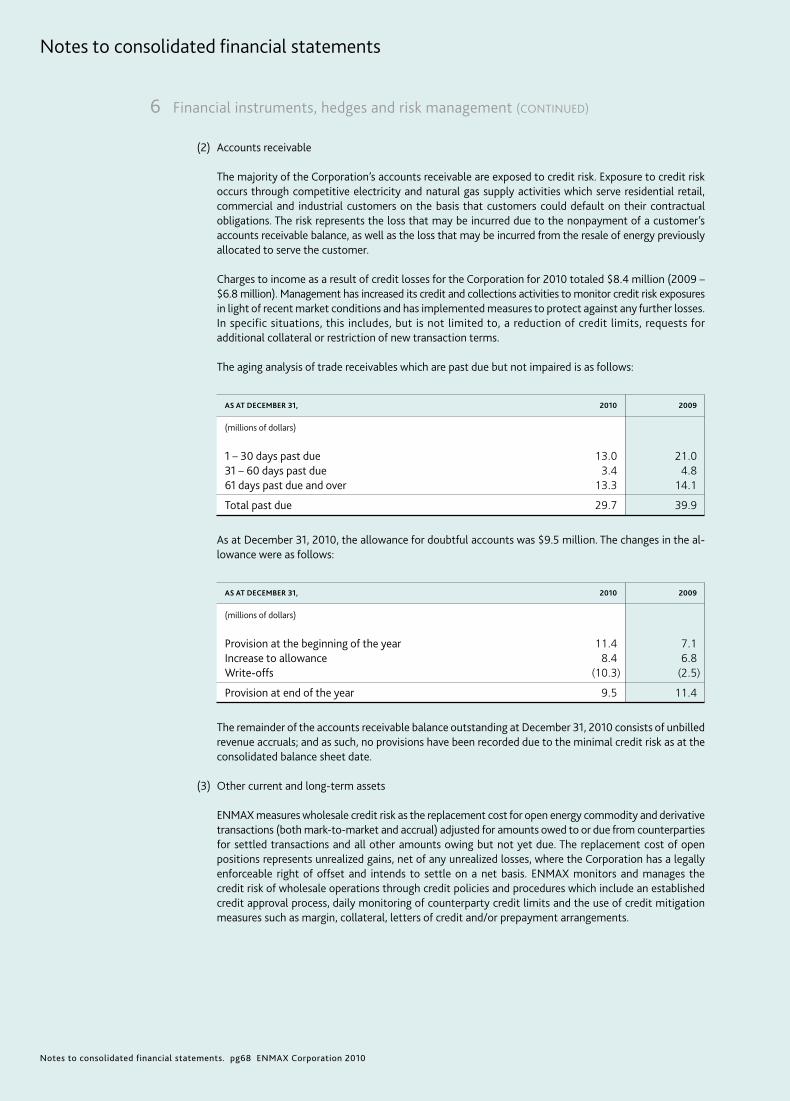
Notes to consolidated financial statements. pg68 ENMAX Corporation 2010
Notes to consolidated financial statements
6 Financial instruments, hedges and risk management (CONTINUED)
(2) Accounts receivable
The majority of the Corporation’s accounts receivable are exposed to credit risk. Exposure to credit risk occurs through competitive electricity and natural gas supply activities which serve residential retail, commercial and industrial customers on the basis that customers could default on their contractual obligations. The risk represents the loss that may be incurred due to the nonpayment of a customer’s accounts receivable balance, as well as the loss that may be incurred from the resale of energy previously allocated to serve the customer.
Charges to income as a result of credit losses for the Corporation for 2010 totaled $8.4 million (2009 – $6.8 million). Management has increased its credit and collections activities to monitor credit risk exposures in light of recent market conditions and has implemented measures to protect against any further losses. In specific situations, this includes, but is not limited to, a reduction of credit limits, requests for additional collateral or restriction of new transaction terms.
The aging analysis of trade receivables which are past due but not impaired is as follows:
AS AT DECEMBER 31, 2010 2009
(millions of dollars)
1 – 30 days past due 13.0 21.031 – 60 days past due 3.4 4.861 days past due and over 13.3 14.1
Total past due 29.7 39.9
As at December 31, 2010, the allowance for doubtful accounts was $9.5 million. The changes in the al-lowance were as follows:
AS AT DECEMBER 31, 2010 2009
(millions of dollars)
Provision at the beginning of the year 11.4 7.1Increase to allowance 8.4 6.8Write-offs (10.3) (2.5)
Provision at end of the year 9.5 11.4
The remainder of the accounts receivable balance outstanding at December 31, 2010 consists of unbilled revenue accruals; and as such, no provisions have been recorded due to the minimal credit risk as at the consolidated balance sheet date.
(3) Other current and long-term assets
ENMAX measures wholesale credit risk as the replacement cost for open energy commodity and derivative transactions (both mark-to-market and accrual) adjusted for amounts owed to or due from counterparties for settled transactions and all other amounts owing but not yet due. The replacement cost of open positions represents unrealized gains, net of any unrealized losses, where the Corporation has a legally enforceable right of offset and intends to settle on a net basis. ENMAX monitors and manages the credit risk of wholesale operations through credit policies and procedures which include an established credit approval process, daily monitoring of counterparty credit limits and the use of credit mitigation measures such as margin, collateral, letters of credit and/or prepayment arrangements.
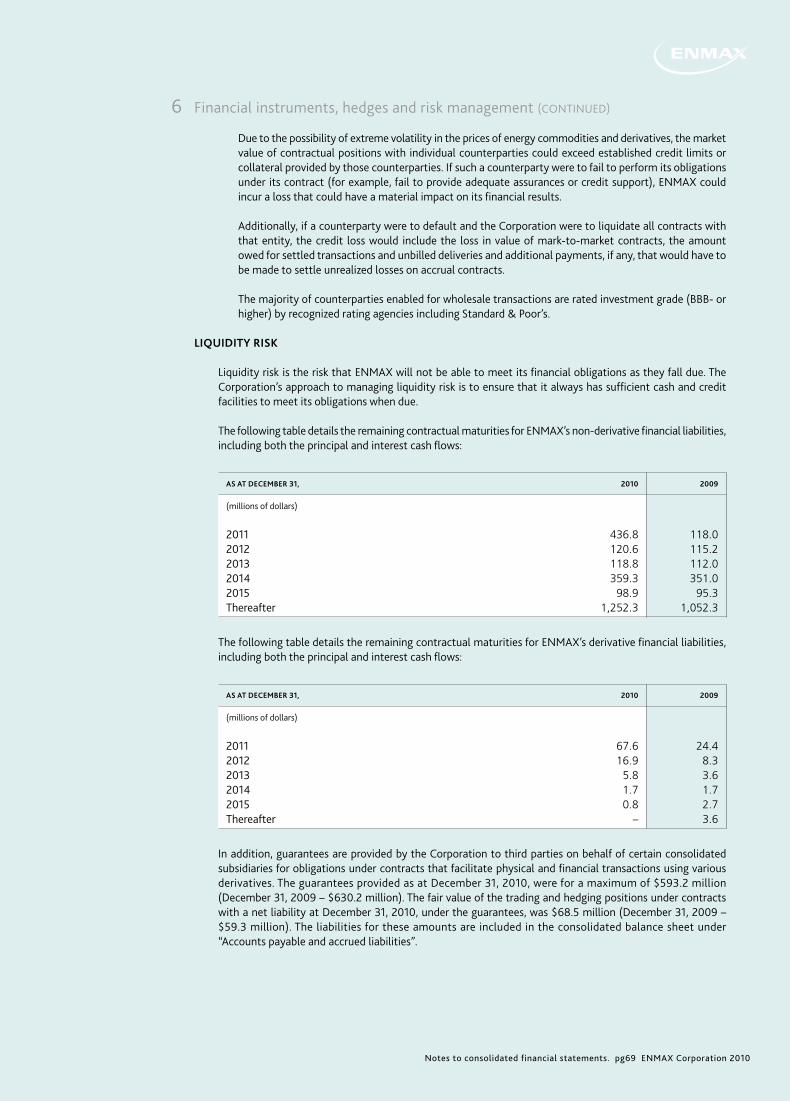
Notes to consolidated financial statements. pg69 ENMAX Corporation 2010
Due to the possibility of extreme volatility in the prices of energy commodities and derivatives, the market value of contractual positions with individual counterparties could exceed established credit limits or collateral provided by those counterparties. If such a counterparty were to fail to perform its obligations under its contract (for example, fail to provide adequate assurances or credit support), ENMAX could incur a loss that could have a material impact on its financial results.
Additionally, if a counterparty were to default and the Corporation were to liquidate all contracts with that entity, the credit loss would include the loss in value of mark-to-market contracts, the amount owed for settled transactions and unbilled deliveries and additional payments, if any, that would have to be made to settle unrealized losses on accrual contracts.
The majority of counterparties enabled for wholesale transactions are rated investment grade (BBB- or higher) by recognized rating agencies including Standard & Poor’s.
LIQUIDITY RISK
Liquidity risk is the risk that ENMAX will not be able to meet its financial obligations as they fall due. The Corporation’s approach to managing liquidity risk is to ensure that it always has sufficient cash and credit facilities to meet its obligations when due.
The following table details the remaining contractual maturities for ENMAX’s non-derivative financial liabilities, including both the principal and interest cash flows:
AS AT DECEMBER 31, 2010 2009
(millions of dollars)
2011 436.8 118.02012 120.6 115.22013 118.8 112.02014 359.3 351.02015 98.9 95.3Thereafter 1,252.3 1,052.3
The following table details the remaining contractual maturities for ENMAX’s derivative financial liabilities, including both the principal and interest cash flows:
AS AT DECEMBER 31, 2010 2009
(millions of dollars)
2011 67.6 24.42012 16.9 8.32013 5.8 3.62014 1.7 1.72015 0.8 2.7Thereafter – 3.6
In addition, guarantees are provided by the Corporation to third parties on behalf of certain consolidated subsidiaries for obligations under contracts that facilitate physical and financial transactions using various derivatives. The guarantees provided as at December 31, 2010, were for a maximum of $593.2 million (December 31, 2009 – $630.2 million). The fair value of the trading and hedging positions under contracts with a net liability at December 31, 2010, under the guarantees, was $68.5 million (December 31, 2009 – $59.3 million). The liabilities for these amounts are included in the consolidated balance sheet under “Accounts payable and accrued liabilities”.
6 Financial instruments, hedges and risk management (CONTINUED)

Notes to consolidated financial statements. pg70 ENMAX Corporation 2010
Notes to consolidated financial statements
6 Financial instruments, hedges and risk management (CONTINUED)
The Corporation has also provided guarantees on behalf of certain consolidated subsidiaries for obligations to perform and make payments under various other contracts. The amount guaranteed under these contracts at December 31, 2010, was a maximum of $708.7 million (December 31, 2009 – $346.7 million).
As at December 31, 2010, the Corporation is non-compliant with a financial covenant for Kettles Hill related to non-recourse financing classified as long-term debt on the balance sheet. Non-compliance with this covenant does not result in an event of default and does not cause the debt to be payable on demand or accelerate payments. Failure to comply with this covenant does not restrict the ability to distribute cash for operating purposes. The Corporation was in compliance with all of its other financial covenants as of December 31, 2010.
Management typically forecasts cash flows for a period of 12 months and beyond to identify financing requirements. These requirements are then addressed through a combination of committed credit facilities and access to capital markets, as discussed in note 23 to these consolidated financial statements.
NON-DERIVATIVE FINANCIAL ASSETS AND LIABILITIES
Cash, cash equivalents and restricted cash are recorded at fair market value. Fair values for accounts receivable, short-term debt, accounts payable and accrued liabilities are not materially different from their carrying amounts due to their short-term nature.
The fair value of the Corporation’s long-term debt was estimated based on quoted market prices for the same or similar debt instruments. When such information was not available, future payments of interest and principal were discounted at estimated interest rates that were made available to ENMAX for comparable credit-rated entities to the Corporation.
The carrying amounts and fair values of the long-term debt are as follows:
AS AT DECEMBER 31, 2010 2009
CARRYING FAIR CARRYING FAIR AMOUNT VALUE AMOUNT VALUE
(millions of dollars)
Long-term debt (1), consisting of: Debentures, with remaining terms of: Less than 5 years 69.1 75.1 48.0 51.0 6 – 10 years 48.8 59.0 90.7 99.6 11 – 15 years 106.9 115.3 114.7 122.5 16 – 20 years 38.8 35.6 26.9 28.3 21 – 25 years 368.0 403.1 236.6 247.4Private debentures Series 1 (6.15%) 297.1 330.3 296.9 322.3 Series 2 (5.85%) 248.8 271.2 248.5 270.5Non-recourse term financing (Kettles and CEC) 244.7 254.5 251.8 262.0Promissory note 5.5 5.4 5.7 5.4
1,427.7 1,549.5 1,319.8 1,409.0
(1) Includes current portion of $50.0 million (December 31, 2009 – $46.1 million). Maturity dates range from January 2011 to June 2035.
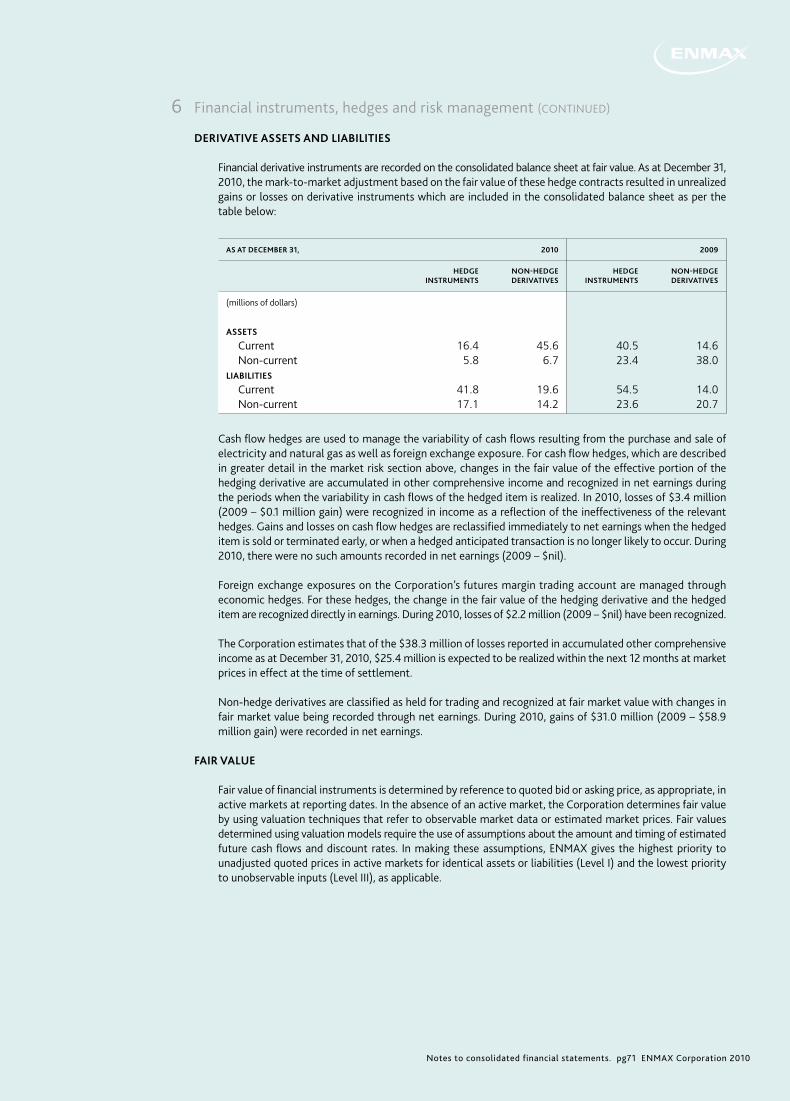
Notes to consolidated financial statements. pg71 ENMAX Corporation 2010
DERIVATIVE ASSETS AND LIABILITIES
Financial derivative instruments are recorded on the consolidated balance sheet at fair value. As at December 31, 2010, the mark-to-market adjustment based on the fair value of these hedge contracts resulted in unrealized gains or losses on derivative instruments which are included in the consolidated balance sheet as per the table below:
AS AT DECEMBER 31, 2010 2009
HEDGE NON-HEDGE HEDGE NON-HEDGE INSTRUMENTS DERIVATIVES INSTRUMENTS DERIVATIVES
(millions of dollars)
ASSETS
Current 16.4 45.6 40.5 14.6 Non-current 5.8 6.7 23.4 38.0LIABILITIES
Current 41.8 19.6 54.5 14.0 Non-current 17.1 14.2 23.6 20.7
Cash flow hedges are used to manage the variability of cash flows resulting from the purchase and sale of electricity and natural gas as well as foreign exchange exposure. For cash flow hedges, which are described in greater detail in the market risk section above, changes in the fair value of the effective portion of the hedging derivative are accumulated in other comprehensive income and recognized in net earnings during the periods when the variability in cash flows of the hedged item is realized. In 2010, losses of $3.4 million (2009 – $0.1 million gain) were recognized in income as a reflection of the ineffectiveness of the relevant hedges. Gains and losses on cash flow hedges are reclassified immediately to net earnings when the hedged item is sold or terminated early, or when a hedged anticipated transaction is no longer likely to occur. During 2010, there were no such amounts recorded in net earnings (2009 – $nil).
Foreign exchange exposures on the Corporation’s futures margin trading account are managed through economic hedges. For these hedges, the change in the fair value of the hedging derivative and the hedged item are recognized directly in earnings. During 2010, losses of $2.2 million (2009 – $nil) have been recognized.
The Corporation estimates that of the $38.3 million of losses reported in accumulated other comprehensive income as at December 31, 2010, $25.4 million is expected to be realized within the next 12 months at market prices in effect at the time of settlement.
Non-hedge derivatives are classified as held for trading and recognized at fair market value with changes in fair market value being recorded through net earnings. During 2010, gains of $31.0 million (2009 – $58.9 million gain) were recorded in net earnings.
FAIR VALUE
Fair value of financial instruments is determined by reference to quoted bid or asking price, as appropriate, in active markets at reporting dates. In the absence of an active market, the Corporation determines fair value by using valuation techniques that refer to observable market data or estimated market prices. Fair values determined using valuation models require the use of assumptions about the amount and timing of estimated future cash flows and discount rates. In making these assumptions, ENMAX gives the highest priority to unadjusted quoted prices in active markets for identical assets or liabilities (Level I) and the lowest priority to unobservable inputs (Level III), as applicable.
6 Financial instruments, hedges and risk management (CONTINUED)
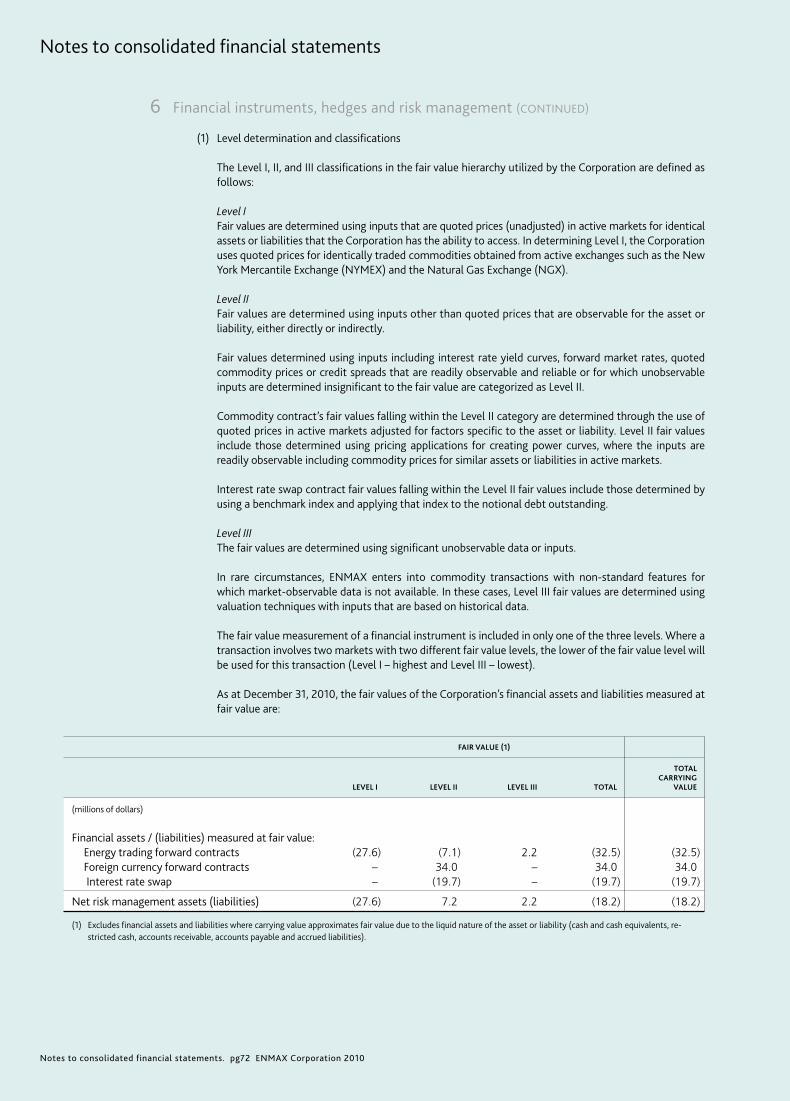
Notes to consolidated financial statements. pg72 ENMAX Corporation 2010
Notes to consolidated financial statements
6 Financial instruments, hedges and risk management (CONTINUED)
(1) Level determination and classifications
The Level I, II, and III classifications in the fair value hierarchy utilized by the Corporation are defined as follows:
Level I Fair values are determined using inputs that are quoted prices (unadjusted) in active markets for identical
assets or liabilities that the Corporation has the ability to access. In determining Level I, the Corporation uses quoted prices for identically traded commodities obtained from active exchanges such as the New York Mercantile Exchange (NYMEX) and the Natural Gas Exchange (NGX).
Level II Fair values are determined using inputs other than quoted prices that are observable for the asset or
liability, either directly or indirectly.
Fair values determined using inputs including interest rate yield curves, forward market rates, quoted commodity prices or credit spreads that are readily observable and reliable or for which unobservable inputs are determined insignificant to the fair value are categorized as Level II.
Commodity contract’s fair values falling within the Level II category are determined through the use of quoted prices in active markets adjusted for factors specific to the asset or liability. Level II fair values include those determined using pricing applications for creating power curves, where the inputs are readily observable including commodity prices for similar assets or liabilities in active markets.
Interest rate swap contract fair values falling within the Level II fair values include those determined by using a benchmark index and applying that index to the notional debt outstanding.
Level III The fair values are determined using significant unobservable data or inputs.
In rare circumstances, ENMAX enters into commodity transactions with non-standard features for which market-observable data is not available. In these cases, Level III fair values are determined using valuation techniques with inputs that are based on historical data.
The fair value measurement of a financial instrument is included in only one of the three levels. Where a transaction involves two markets with two different fair value levels, the lower of the fair value level will be used for this transaction (Level I – highest and Level III – lowest).
As at December 31, 2010, the fair values of the Corporation’s financial assets and liabilities measured at fair value are:
FAIR VALUE (1)
TOTAL CARRYING LEVEL I LEVEL II LEVEL III TOTAL VALUE
(millions of dollars)
Financial assets / (liabilities) measured at fair value: Energy trading forward contracts (27.6) (7.1) 2.2 (32.5) (32.5) Foreign currency forward contracts – 34.0 – 34.0 34.0 Interest rate swap – (19.7) – (19.7) (19.7)
Net risk management assets (liabilities) (27.6) 7.2 2.2 (18.2) (18.2)
(1) Excludes financial assets and liabilities where carrying value approximates fair value due to the liquid nature of the asset or liability (cash and cash equivalents, re-stricted cash, accounts receivable, accounts payable and accrued liabilities).
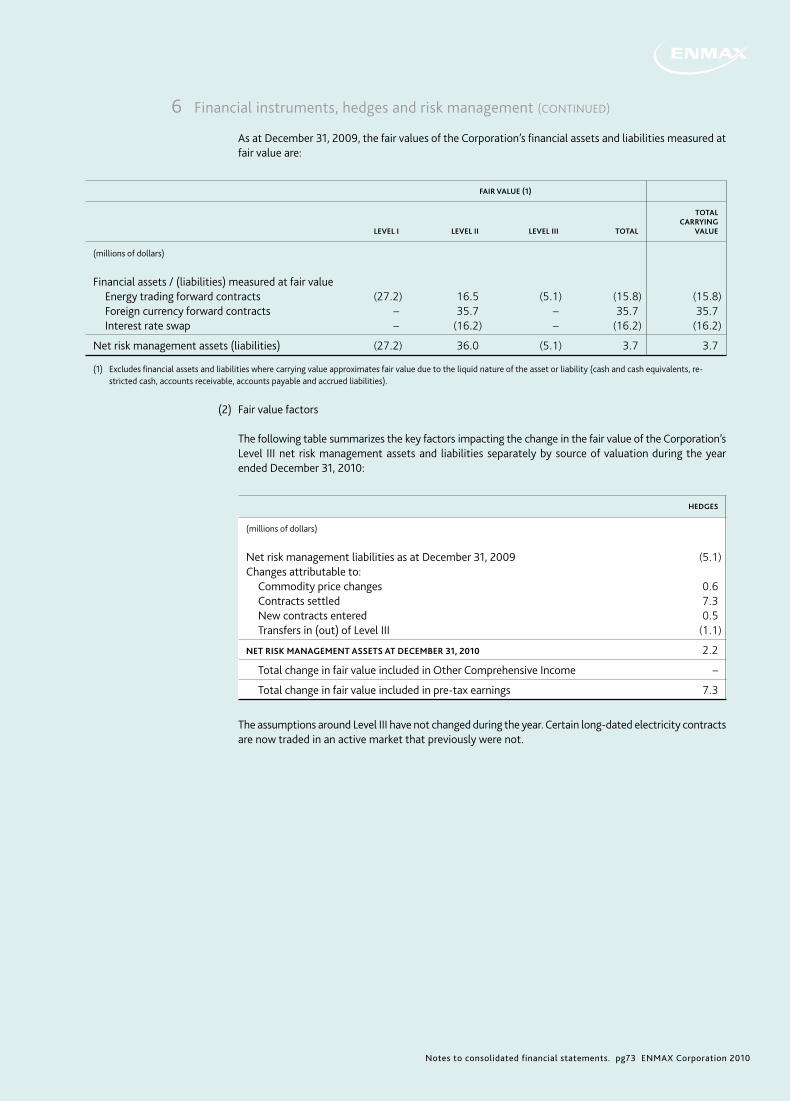
Notes to consolidated financial statements. pg73 ENMAX Corporation 2010
As at December 31, 2009, the fair values of the Corporation’s financial assets and liabilities measured at fair value are:
FAIR VALUE (1)
TOTAL CARRYING LEVEL I LEVEL II LEVEL III TOTAL VALUE
(millions of dollars)
Financial assets / (liabilities) measured at fair value Energy trading forward contracts (27.2) 16.5 (5.1) (15.8) (15.8) Foreign currency forward contracts – 35.7 – 35.7 35.7 Interest rate swap – (16.2) – (16.2) (16.2)
Net risk management assets (liabilities) (27.2) 36.0 (5.1) 3.7 3.7
(1) Excludes financial assets and liabilities where carrying value approximates fair value due to the liquid nature of the asset or liability (cash and cash equivalents, re-stricted cash, accounts receivable, accounts payable and accrued liabilities).
(2) Fair value factors
The following table summarizes the key factors impacting the change in the fair value of the Corporation’s Level III net risk management assets and liabilities separately by source of valuation during the year ended December 31, 2010:
HEDGES
(millions of dollars)
Net risk management liabilities as at December 31, 2009 (5.1)Changes attributable to: Commodity price changes 0.6 Contracts settled 7.3 New contracts entered 0.5 Transfers in (out) of Level III (1.1)
NET RISK MANAGEMENT ASSETS AT DECEMBER 31, 2010 2.2
Total change in fair value included in Other Comprehensive Income –
Total change in fair value included in pre-tax earnings 7.3
The assumptions around Level III have not changed during the year. Certain long-dated electricity contracts are now traded in an active market that previously were not.
6 Financial instruments, hedges and risk management (CONTINUED)

Notes to consolidated financial statements. pg74 ENMAX Corporation 2010
Notes to consolidated financial statements
7 Other assets and liabilities
AS AT DECEMBER 31, 2010 2009
(millions of dollars)
OTHER CURRENT ASSETS
Prepaid expenses 40.3 44.1 Hedge instruments 16.4 40.5 Non-hedge derivatives 45.6 14.6 Inventory 0.9 0.6
103.2 99.8
OTHER LONG-TERM ASSETS
Non-hedge derivatives 6.7 38.0 Hedge instruments 5.8 23.4 Restricted cash 5.2 6.6 Shares in other companies 3.8 7.6 Deferred costs 3.8 4.0 Other 2.7 1.4
28.0 81.0
OTHER CURRENT LIABILITIES
Hedge instruments 41.8 54.5 Non-hedge derivative 19.6 14.0 Deposits 13.2 12.8 Deferred revenue 3.0 16.9
77.6 98.2
OTHER LONG-TERM LIABILITIES
Hedge instruments 17.1 23.6 Non-hedge derivative 14.2 20.7 Asset retirement obligation 9.1 7.4 Long-term payables 13.5 14.3 Deferred revenue 11.6 4.0 Other – 0.1
65.5 70.1
8 Income taxes
RECONCILIATION OF INCOME TAX EXPENSE
AS AT DECEMBER 31, 2010 2009
(millions of dollars)
Earnings before income taxes from continuing operations 199.6 270.4Income not subject to taxes (134.6) (164.7)
65.0 105.7Federal and provincial tax rate 28.0% 29.0%
Expected income tax expense 18.2 30.7Non-deductible expenses 0.7 0.4Adjustment for future tax reversal and other estimate revisions (0.5) 32.7
Income taxes on continuing operations 18.4 63.8

Notes to consolidated financial statements. pg75 ENMAX Corporation 2010
FUTURE INCOME TAX ASSET
The tax effects of temporary differences and loss carry-forwards that give rise to significant portions of the Corporation’s future income tax asset and future income tax liability are presented below:
AS AT DECEMBER 31, 2010 2009
(millions of dollars)
Future income tax asset: Power purchase arrangements (1) 80.4 89.3 PPE – differences in net book value and undepreciated capital cost 0.1 – Cumulative eligible capital 7.4 8.4 Other 1.7 1.4 Loss carry-forwards 12.8 0.3 Unrealized derivative (2.7) – Other comprehensive income (1.4) (7.1)
98.3 92.3Less current portion (7.1) (3.1)
91.2 89.2Future income tax liability: PPE – differences in net book value and undepreciated capital cost 94.5 101.4 Cumulative eligible capital 4.1 5.0 Loss carry-forwards (10.1) (12.3) Mark-to-market liability 2.0 5.8 Other (1.9) (2.2)
88.6 97.7Less current portion (8.8) (2.9)
79.8 94.8
Net future income tax asset 9.7 (5.4)
(1) Under PILOT, certain assets of the Corporation were deemed to be disposed of and reacquired at fair market value for tax purposes on December 31, 2000. This resulted in tax values in excess of book value for these assets.
The Corporation has loss carry-forwards that will be used to offset taxes in future years. These loss carry-forwards expire as follows:
AS AT DECEMBER 31, 2010
(millions of dollars)
2015 1.22026 1.52027 17.52028 21.82029 26.22030 23.8
92.0
8 Income taxes (CONTINUED)

Notes to consolidated financial statements. pg76 ENMAX Corporation 2010
Notes to consolidated financial statements
9 Assets held for sale
During 2010, ENMAX completed the sale transactions for certain of its British Columbia assets including interest in the EnPower and Culliton Creek assets. The sale of the remaining British Columbia assets, which consists of the Clowhom and Furry Creek hydro facilities, closed on February 8 and 14, 2011 respectively. As such, the assets and liabilities of this disposal group have been reclassified as current assets held for sale and current liabilities held for sale on the consolidated balance sheet. Operating results related to these assets and liabilities have been included in net loss from discontinued operations on the consolidated statements of earnings and comprehensive income.
Net loss from discontinued operations is comprised of the following:
AS AT DECEMBER 31, 2010 2009
(millions of dollars)
REVENUE
Electricity 7.2 3.7 Other 1.8 0.2
TOTAL REVENUE 9.0 3.9
COST OF SERVICES PROVIDED
Electricity 0.3 0.3 Operations, maintenance and administration 10.3 1.8
COST OF SERVICES PROVIDED 10.6 2.1
(1.6) 1.8 Amortization 0.1 1.2 Interest 1.7 1.8 Income taxes – (0.5)
NET LOSS FROM DISCONTINUED OPERATIONS (3.4) (0.7)
The assets and liabilities of the asset group held for sale is comprised of the following:
AS AT DECEMBER 31, 2010 2009
Millions of dollars
ASSETS
Cash and cash equivalents 1.6 0.9 Accounts receivable 0.3 1.4 Property plant and equipment 107.2 113.7 Intangible assets 1.2 3.3 Future income tax asset – – Other long-term assets 0.6 2.2
TOTAL ASSETS 110.9 121.5
LIABILITIES Accounts payable and accrued liabilities 0.1 6.3 Current portion of long-term debt 0.6 0.8 Long-term debt 11.6 23.4 Future income tax liability 1.1 – Other long-term liabilities 1.6 2.0
TOTAL LIABILITIES 15.0 32.5
The non-recourse financing represents the Corporation’s share, through its subsidiary ENMAX Green Power Inc., of loans for the Furry Creek project. Of the $14.9 million originally assumed with Furry Creek, the balance outstanding at December 31, 2010 was $12.2 million (2009 – $12.6 million) which bears interest at a fixed rate of 7.3%, payable monthly, maturing in June 2024. The Furry Creek non-recourse financing has been reclassified to “Liabilities held for sale” on the consolidated balance sheet as a current liability, as the non-recourse financing on this asset is currently classified as held for sale.

Notes to consolidated financial statements. pg77 ENMAX Corporation 2010
10 Property, plant and equipment
ACCUMULATED NET BOOK COST AMORTIZATION VALUE
(millions of dollars)
AS AT DECEMBER 31, 2010 Transmission, distribution and substation equipment 1,551.4 (514.1) 1,037.3 Capital spares and other 21.0 – 21.0 Tools, systems and equipment 146.1 (70.3) 75.8 Construction in progress 333.0 – 333.0 Buildings and site development 157.8 (46.7) 111.1 Generation facilities and equipment 1,026.3 (112.3) 914.0 Land 31.8 – 31.8 Vehicles 27.3 (18.3) 9.0
3,294.7 (761.7) 2,533.0
Government grants (20.0) 0.3 (19.7) Contributions in aid of construction (318.5) 78.8 (239.7)
2,956.2 (682.6) 2,273.6
AS AT DECEMBER 31, 2009 Transmission, distribution and substation equipment 1,380.7 (489.6) 891.1 Capital spares and other 22.2 – 22.2 Tools, systems and equipment 137.1 (67.8) 69.3 Construction in progress 242.9 – 242.9 Buildings and site development 154.5 (38.4) 116.1 Generation facilities and equipment 960.4 (77.9) 882.5 Land 30.2 – 30.2 Vehicles 24.7 (12.0) 12.7
2,952.7 (685.7) 2,267.0 Contributions in aid of construction (281.0) 68.5 (212.5)
2,671.7 (617.2) 2,054.5
GOVERNMENT GRANTS
On October 7, 2008, the Corporation and The City entered into an infrastructure funding agreement for the construction of the DDEC. Funding of $10.0 million was received by the Corporation from the Alberta Provincial Government and an additional $10.0 million from the Federal Government of Canada. The DDEC began operations in 2010 and the grants have been deducted from the carrying amount of the assets in PPE. The grants are being amortized over the life of the asset. For the year ended December 31, 2010, amortiza-tion of $0.3 million was recognized on the grants.
11 Power purchase arrangements (PPAs)
Under the Keephills PPA, which was acquired in 2000 for $247.7 million and expires December 2020, the Corporation owns the rights to the physical output of two electrical generating units. In June 2006, the Corporation purchased a 55% interest in the Battle River PPA, which expires December 2020, for $345.4 million. On each of January 1, 2007, 2008 and 2009 the Corporation purchased an additional 10% interest with the final 15% interest being purchased in 2010 for the Battle River PPA for $59.0 million, $53.6 million, $48.1 million and $64.0 million respectively. As of January 1, 2010, the Corporation owned 100% of the Battle River PPA.

Notes to consolidated financial statements. pg78 ENMAX Corporation 2010
Notes to consolidated financial statements
ACCUMULATED NET BOOK COST AMORTIZATION VALUE
(millions of dollars)
AS AT DECEMBER 31, 2010 Battle River 570.1 (152.9) 417.2 Keephills 247.7 (147.9) 99.8
817.8 (300.8) 517.0
AS AT DECEMBER 31, 2009 Battle River 506.1 (111.2) 394.9 Keephills 247.7 (137.9) 109.8
753.8 (249.1) 504.7
12 Intangible assets
ACCUMULATED NET BOOK COST AMORTIZATION VALUE
(millions of dollars)
AS AT DECEMBER 31, 2010 Customer lists and contracts 20.0 (11.4) 8.6 Computer systems 235.0 (141.2) 93.8 Land easements, rights and lease options 3.2 (2.4) 0.8 Land and mineral rights – – – Renewable energy certificates and water licenses 13.4 (3.4) 10.0
271.6 (158.4) 113.2
AS AT DECEMBER 31, 2009 Customer lists and contracts 20.0 (9.3) 10.7 Computer systems 234.5 (128.4) 106.1 Land easements, rights and lease options 3.2 (2.1) 1.1 Land and mineral rights 0.5 – 0.5 Renewable energy certificates and water licenses 12.4 (2.1) 10.3
270.6 (141.9) 128.7
13 Employee future benefits
The Corporation has a registered pension plan that covers substantially all employees and includes both defined benefit (DB) and defined contribution (DC) provisions. The DB provisions provide a pension based on years of service and highest average earnings over five consecutive years of employment. DB pension benefits under the registered plan will increase annually by 60% of the Consumer Price Index for Alberta. Under the DC provisions, employer contributions are based on the participating members’ pensionable earnings and contribution levels.
11 Power purchase arrangements (PPAs) (CONTINUED)
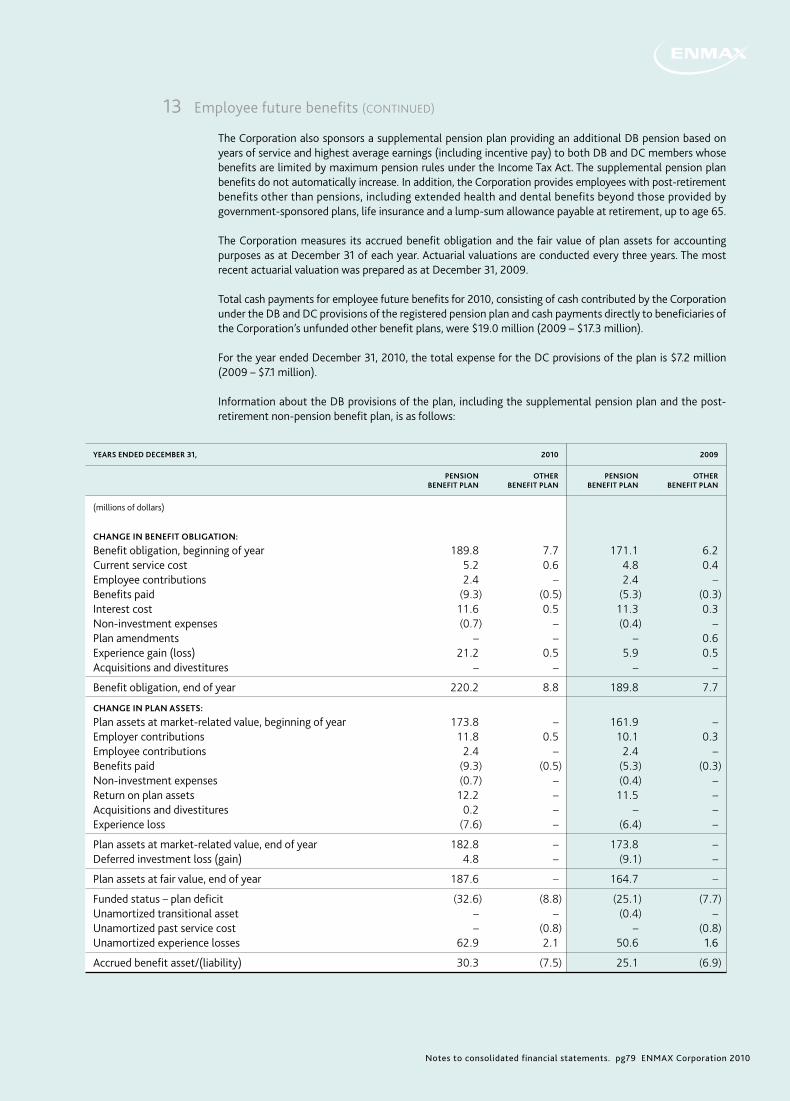
Notes to consolidated financial statements. pg79 ENMAX Corporation 2010
The Corporation also sponsors a supplemental pension plan providing an additional DB pension based on years of service and highest average earnings (including incentive pay) to both DB and DC members whose benefits are limited by maximum pension rules under the Income Tax Act. The supplemental pension plan benefits do not automatically increase. In addition, the Corporation provides employees with post-retirement benefits other than pensions, including extended health and dental benefits beyond those provided by government-sponsored plans, life insurance and a lump-sum allowance payable at retirement, up to age 65.
The Corporation measures its accrued benefit obligation and the fair value of plan assets for accounting purposes as at December 31 of each year. Actuarial valuations are conducted every three years. The most recent actuarial valuation was prepared as at December 31, 2009.
Total cash payments for employee future benefits for 2010, consisting of cash contributed by the Corporation under the DB and DC provisions of the registered pension plan and cash payments directly to beneficiaries of the Corporation’s unfunded other benefit plans, were $19.0 million (2009 – $17.3 million).
For the year ended December 31, 2010, the total expense for the DC provisions of the plan is $7.2 million (2009 – $7.1 million).
Information about the DB provisions of the plan, including the supplemental pension plan and the post-retirement non-pension benefit plan, is as follows:
YEARS ENDED DECEMBER 31, 2010 2009
PENSION OTHER PENSION OTHER BENEFIT PLAN BENEFIT PLAN BENEFIT PLAN BENEFIT PLAN
(millions of dollars)
CHANGE IN BENEFIT OBLIGATION:
Benefit obligation, beginning of year 189.8 7.7 171.1 6.2Current service cost 5.2 0.6 4.8 0.4Employee contributions 2.4 – 2.4 –Benefits paid (9.3) (0.5) (5.3) (0.3)Interest cost 11.6 0.5 11.3 0.3Non-investment expenses (0.7) – (0.4) –Plan amendments – – – 0.6Experience gain (loss) 21.2 0.5 5.9 0.5Acquisitions and divestitures – – – –
Benefit obligation, end of year 220.2 8.8 189.8 7.7
CHANGE IN PLAN ASSETS: Plan assets at market-related value, beginning of year 173.8 – 161.9 –Employer contributions 11.8 0.5 10.1 0.3Employee contributions 2.4 – 2.4 –Benefits paid (9.3) (0.5) (5.3) (0.3)Non-investment expenses (0.7) – (0.4) –Return on plan assets 12.2 – 11.5 –Acquisitions and divestitures 0.2 – – –Experience loss (7.6) – (6.4) –
Plan assets at market-related value, end of year 182.8 – 173.8 –Deferred investment loss (gain) 4.8 – (9.1) –
Plan assets at fair value, end of year 187.6 – 164.7 –
Funded status – plan deficit (32.6) (8.8) (25.1) (7.7)Unamortized transitional asset – – (0.4) –Unamortized past service cost – (0.8) – (0.8)Unamortized experience losses 62.9 2.1 50.6 1.6
Accrued benefit asset/(liability) 30.3 (7.5) 25.1 (6.9)
13 Employee future benefits (CONTINUED)
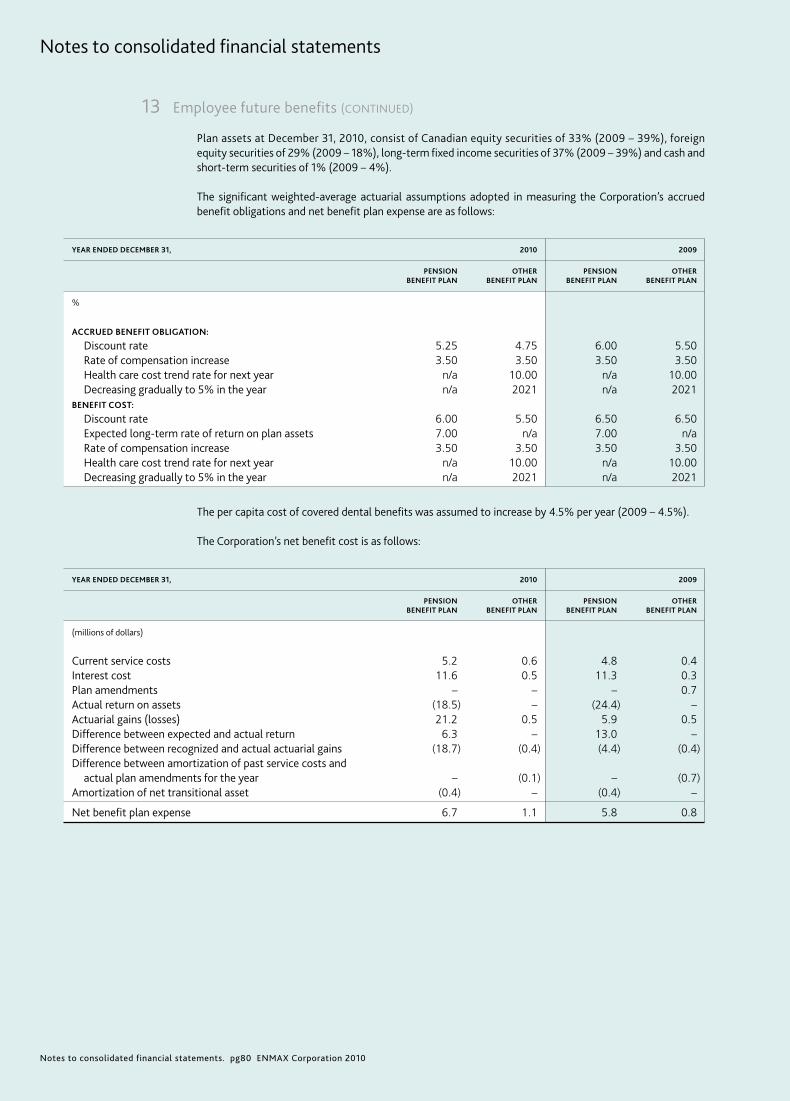
Notes to consolidated financial statements. pg80 ENMAX Corporation 2010
Notes to consolidated financial statements
Plan assets at December 31, 2010, consist of Canadian equity securities of 33% (2009 – 39%), foreign equity securities of 29% (2009 – 18%), long-term fixed income securities of 37% (2009 – 39%) and cash and short-term securities of 1% (2009 – 4%).
The significant weighted-average actuarial assumptions adopted in measuring the Corporation’s accrued benefit obligations and net benefit plan expense are as follows:
YEAR ENDED DECEMBER 31, 2010 2009
PENSION OTHER PENSION OTHER BENEFIT PLAN BENEFIT PLAN BENEFIT PLAN BENEFIT PLAN
%
ACCRUED BENEFIT OBLIGATION: Discount rate 5.25 4.75 6.00 5.50 Rate of compensation increase 3.50 3.50 3.50 3.50 Health care cost trend rate for next year n/a 10.00 n/a 10.00 Decreasing gradually to 5% in the year n/a 2021 n/a 2021BENEFIT COST: Discount rate 6.00 5.50 6.50 6.50 Expected long-term rate of return on plan assets 7.00 n/a 7.00 n/a Rate of compensation increase 3.50 3.50 3.50 3.50 Health care cost trend rate for next year n/a 10.00 n/a 10.00 Decreasing gradually to 5% in the year n/a 2021 n/a 2021
The per capita cost of covered dental benefits was assumed to increase by 4.5% per year (2009 – 4.5%).
The Corporation’s net benefit cost is as follows:
YEAR ENDED DECEMBER 31, 2010 2009
PENSION OTHER PENSION OTHER BENEFIT PLAN BENEFIT PLAN BENEFIT PLAN BENEFIT PLAN
(millions of dollars)
Current service costs 5.2 0.6 4.8 0.4Interest cost 11.6 0.5 11.3 0.3Plan amendments – – – 0.7Actual return on assets (18.5) – (24.4) –Actuarial gains (losses) 21.2 0.5 5.9 0.5Difference between expected and actual return 6.3 – 13.0 –Difference between recognized and actual actuarial gains (18.7) (0.4) (4.4) (0.4)Difference between amortization of past service costs and actual plan amendments for the year – (0.1) – (0.7)Amortization of net transitional asset (0.4) – (0.4) –
Net benefit plan expense 6.7 1.1 5.8 0.8
13 Employee future benefits (CONTINUED)
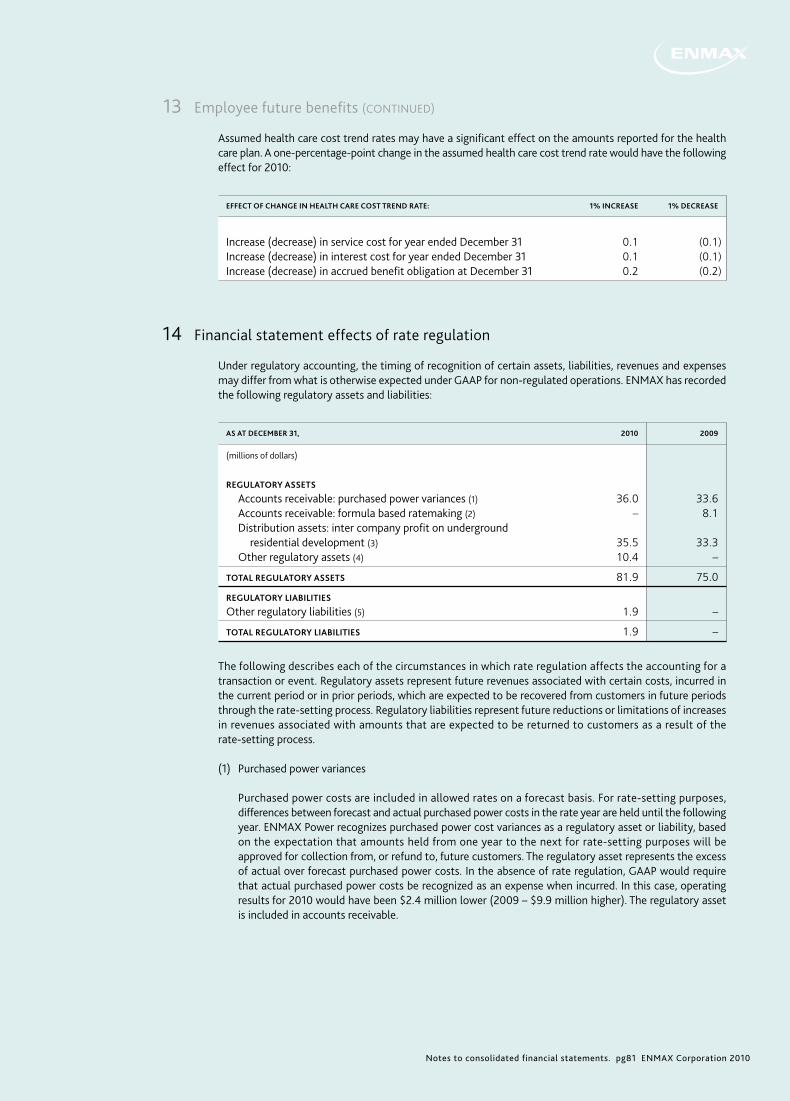
Notes to consolidated financial statements. pg81 ENMAX Corporation 2010
Assumed health care cost trend rates may have a significant effect on the amounts reported for the health care plan. A one-percentage-point change in the assumed health care cost trend rate would have the following effect for 2010:
EFFECT OF CHANGE IN HEALTH CARE COST TREND RATE: 1% INCREASE 1% DECREASE
Increase (decrease) in service cost for year ended December 31 0.1 (0.1)Increase (decrease) in interest cost for year ended December 31 0.1 (0.1)Increase (decrease) in accrued benefit obligation at December 31 0.2 (0.2)
14 Financial statement effects of rate regulation
Under regulatory accounting, the timing of recognition of certain assets, liabilities, revenues and expenses may differ from what is otherwise expected under GAAP for non-regulated operations. ENMAX has recorded the following regulatory assets and liabilities:
AS AT DECEMBER 31, 2010 2009
(millions of dollars)
REGULATORY ASSETS Accounts receivable: purchased power variances (1) 36.0 33.6 Accounts receivable: formula based ratemaking (2) – 8.1 Distribution assets: inter company profit on underground residential development (3) 35.5 33.3 Other regulatory assets (4) 10.4 –
TOTAL REGULATORY ASSETS 81.9 75.0
REGULATORY LIABILITIES Other regulatory liabilities (5) 1.9 –
TOTAL REGULATORY LIABILITIES 1.9 –
The following describes each of the circumstances in which rate regulation affects the accounting for a transaction or event. Regulatory assets represent future revenues associated with certain costs, incurred in the current period or in prior periods, which are expected to be recovered from customers in future periods through the rate-setting process. Regulatory liabilities represent future reductions or limitations of increases in revenues associated with amounts that are expected to be returned to customers as a result of the rate-setting process.
(1) Purchased power variances
Purchased power costs are included in allowed rates on a forecast basis. For rate-setting purposes, differences between forecast and actual purchased power costs in the rate year are held until the following year. ENMAX Power recognizes purchased power cost variances as a regulatory asset or liability, based on the expectation that amounts held from one year to the next for rate-setting purposes will be approved for collection from, or refund to, future customers. The regulatory asset represents the excess of actual over forecast purchased power costs. In the absence of rate regulation, GAAP would require that actual purchased power costs be recognized as an expense when incurred. In this case, operating results for 2010 would have been $2.4 million lower (2009 – $9.9 million higher). The regulatory asset is included in accounts receivable.
13 Employee future benefits (CONTINUED)

Notes to consolidated financial statements. pg82 ENMAX Corporation 2010
Notes to consolidated financial statements.
(2) Regulatory decision
ENMAX Power applied to the AUC to have rates set under a FBR approach. On March 25, 2009, the regulator approved the application with adjustments, retroactive to January 1, 2009. ENMAX Power recorded $16.6 million of transmission and distribution receivables reflecting the impact of the decision. ENMAX Power commenced collection of this receivable on July 1, 2009, with the full amount being collected as at December 31, 2010.
(3) Inter-company profit on underground residential development
Distribution assets for the regulated operations of ENMAX Power include intercompany profit relating to construction work performed by an ENMAX subsidiary. Such profit is deemed for regulatory purposes to be realized to the extent that the transfer price is recognized for rate-making purposes by the regulator and included in the capital cost. In the absence of rate regulation, GAAP would require that intercompany profits be eliminated upon consolidation. The impact on current period earnings for 2010 would be a reduction of $2.2 million (2009 – $2.6 million) representing the profit on these services. The balances for PPE and retained earnings at December 31, 2010, would further be reduced by $35.5 million (December 31, 2009 – $33.3 million).
(4) Other regulatory assets
Other regulatory assets primarily relate to AUC flow-through items and other costs that will be collected from customers via future rates.
(5) Other regulatory liabilities
Other regulatory liabilities primarily relates to items that will be refunded to customers via future rates.
For certain of the regulatory items identified above, the expected recovery or settlement period, or like-lihood of recovery or settlement, is affected by risks and uncertainties relating to the ultimate authority of the regulator in determining the item’s treatment for rate-setting purposes. For example, ENMAX’s treatment of purchased power costs is dependent on the continued use of an automatic adjustment mechanism for regulatory purposes and would require reconsideration if the regulator decided to discontinue the use of this mechanism or to require ENMAX Power to absorb cost variances in a particular year. Similarly, there is a risk that the regulator may disallow a portion of certain costs incurred in the current period for recovery through future rates or disagree with the proposed recovery period.
OTHER ITEMS AFFECTED BY RATE REGULATION
Current regulations exclude transmission, distribution and rate regulated electricity sales earnings from corporate income taxes, although rate regulated electricity sales are subject to PILOT. Accordingly, ENMAX Power has not recognized current or future corporate income taxes on tax exempt earnings. In the event regulations change, it would be expected that when these amounts became payable, they would be recovered through future rate revenues. In the absence of rate regulation, GAAP requires the recognition of current and future income tax liabilities and future tax assets.
Gains and losses on the disposal and retirement of regulated depreciable assets are deferred and amortized over the estimated remaining service life of similar assets, through a charge to accumulated amortization equal to the net book value of the disposed or retired asset. In the absence of rate regulation, under GAAP, the difference between the proceeds and net book value would be charged or credited to earnings in the period the asset is disposed of or retired. The amount deferred from current period earnings for the year ended December 31, 2010, was a $12.4 million loss (2009 – $4.7 million loss) representing the gain and losses on disposals and retirements of regulated assets.
14 Financial statement effects of rate regulation (CONTINUED)
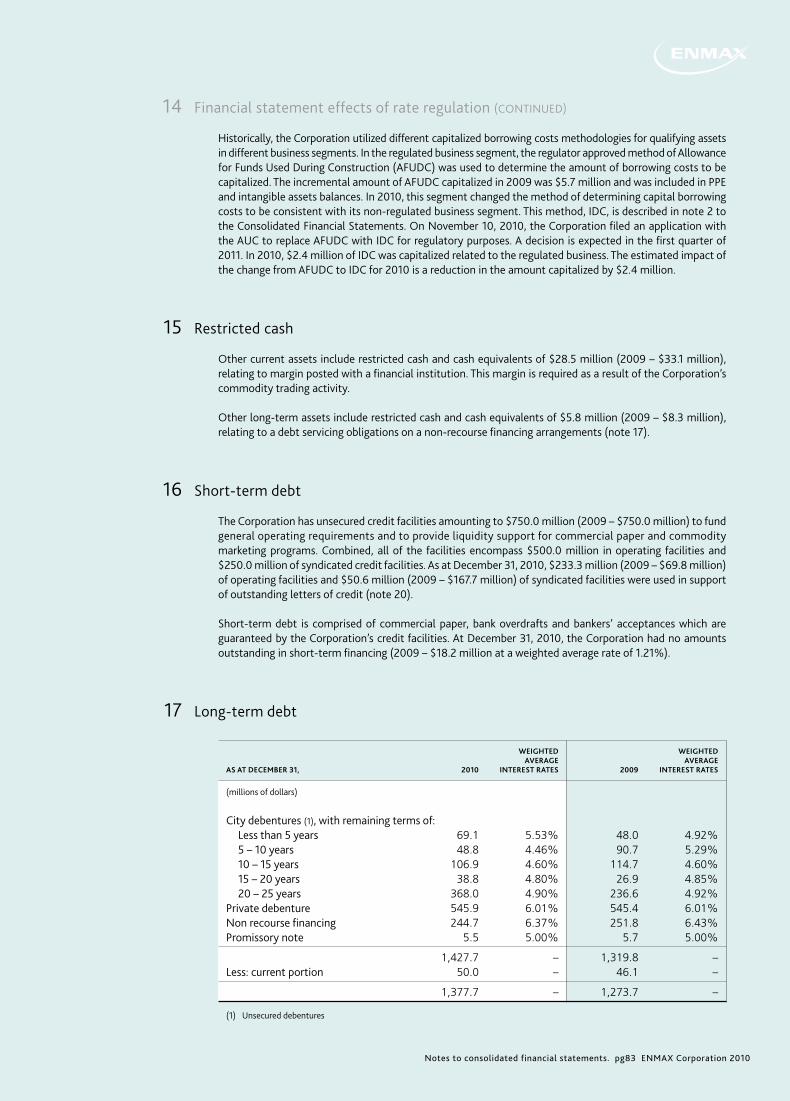
Notes to consolidated financial statements. pg83 ENMAX Corporation 2010
Historically, the Corporation utilized different capitalized borrowing costs methodologies for qualifying assets in different business segments. In the regulated business segment, the regulator approved method of Allowance for Funds Used During Construction (AFUDC) was used to determine the amount of borrowing costs to be capitalized. The incremental amount of AFUDC capitalized in 2009 was $5.7 million and was included in PPE and intangible assets balances. In 2010, this segment changed the method of determining capital borrowing costs to be consistent with its non-regulated business segment. This method, IDC, is described in note 2 to the Consolidated Financial Statements. On November 10, 2010, the Corporation filed an application with the AUC to replace AFUDC with IDC for regulatory purposes. A decision is expected in the first quarter of 2011. In 2010, $2.4 million of IDC was capitalized related to the regulated business. The estimated impact of the change from AFUDC to IDC for 2010 is a reduction in the amount capitalized by $2.4 million.
15 Restricted cash
Other current assets include restricted cash and cash equivalents of $28.5 million (2009 – $33.1 million), relating to margin posted with a financial institution. This margin is required as a result of the Corporation’s commodity trading activity.
Other long-term assets include restricted cash and cash equivalents of $5.8 million (2009 – $8.3 million), relating to a debt servicing obligations on a non-recourse financing arrangements (note 17).
16 Short-term debt
The Corporation has unsecured credit facilities amounting to $750.0 million (2009 – $750.0 million) to fund general operating requirements and to provide liquidity support for commercial paper and commodity marketing programs. Combined, all of the facilities encompass $500.0 million in operating facilities and $250.0 million of syndicated credit facilities. As at December 31, 2010, $233.3 million (2009 – $69.8 million) of operating facilities and $50.6 million (2009 – $167.7 million) of syndicated facilities were used in support of outstanding letters of credit (note 20).
Short-term debt is comprised of commercial paper, bank overdrafts and bankers’ acceptances which are guaranteed by the Corporation’s credit facilities. At December 31, 2010, the Corporation had no amounts outstanding in short-term financing (2009 – $18.2 million at a weighted average rate of 1.21%).
17 Long-term debt
WEIGHTED WEIGHTED AVERAGE AVERAGE AS AT DECEMBER 31, 2010 INTEREST RATES 2009 INTEREST RATES
(millions of dollars)
City debentures (1), with remaining terms of: Less than 5 years 69.1 5.53% 48.0 4.92% 5 – 10 years 48.8 4.46% 90.7 5.29% 10 – 15 years 106.9 4.60% 114.7 4.60% 15 – 20 years 38.8 4.80% 26.9 4.85% 20 – 25 years 368.0 4.90% 236.6 4.92%Private debenture 545.9 6.01% 545.4 6.01%Non recourse financing 244.7 6.37% 251.8 6.43%Promissory note 5.5 5.00% 5.7 5.00%
1,427.7 – 1,319.8 –Less: current portion 50.0 – 46.1 –
1,377.7 – 1,273.7 –
(1) Unsecured debentures
14 Financial statement effects of rate regulation (CONTINUED)

Notes to consolidated financial statements. pg84 ENMAX Corporation 2010
Notes to consolidated financial statements.
CITY DEBENTURES
Debentures were initially issued by The City on behalf of the CES pursuant to City bylaw authorizations prior to January 1, 1998. Pursuant to the Master Agreement between the Corporation and The City, the debentures were included in the assumed liabilities upon transfer of substantially all of the assets and liabilities of the CES from The City to the Corporation at January 1, 1998. In accordance with a debt management service level agreement between the Corporation and The City, The City continues to administer the new and existing debentures on behalf of the Corporation.
On June 15, 2010, the Corporation obtained $156.0 million of 5, 10, 20, and 25-year debentures from The City through arrangements with the ACFA (June 2009 – $116.9 million in 5, 10, 20 and 25-year debentures). Interest on the debentures is compounded semi-annually as follows: $2.5 million, which matures in June 2015, at 2.83%; $2.1 million, maturing in June 2020, at 3.76%; $13.1 million, maturing in June 2030, at 4.50%; and the remaining $138.3 million of the debt, which matures in June 2035, at 4.70%. The funds were used for capital expenditures in ENMAX Power only and not in the Corporation’s non-regulated businesses.
The Corporation is required to reimburse The City for all principal repayments and interest payments with respect to the debentures on the same day as The City disburses the payments to the debt holders. In addition, the Corporation is required to pay a loan guarantee and administration fee to The City of 0.25% on the average monthly outstanding debenture balance held by The City on behalf of the Corporation.
PRIVATE DEBENTURES
No private debentures were issued in 2010 (2009 – $250.0 million). The private debentures bear interest at rates of 5.85% – 6.15%, payable semi-annually. The debenture for $250.0 million matures on April 8, 2014, and the debenture for $300.0 million on June 19, 2018.
NON-RECOURSE FINANCING
AS AT DECEMBER 31, 2010 2009
PRINCIPAL MATURITY AVERAGE PRINCIPAL MATURITY AVERAGE DATE OUTSTANDING DATE INTEREST RATE OUTSTANDING DATE INTEREST RATE
(millions of dollars)
CEC 224.9 Sep. 2026 6.42% 232.1 Sep. 2026 6.47%Kettles 19.8 Dec. 2016 5.86% 19.7 Dec. 2016 5.90%
244.7 6.37% 251.8 6.43%Less: current portion 7.3 7.2
237.4 244.6
The non-recourse financing represents the Corporation’s loans, through subsidiaries, for the Kettles and CEC projects. Of the $44.2 million originally assumed with the Kettles acquisition, the balance outstanding at December 31, 2010, was $19.8 million (2009 – $19.7 million), which bears interest at a fixed rate of 5.86%, payable monthly, maturing in December 2016. As at December 31, 2010, ENMAX is non-compliant with a financial covenant for Kettles Hill related to non-recourse financing classified as long-term debt on the balance sheet (note 6). Of the $240.3 million originally assumed with the CEC acquisition, the balance outstanding at December 31, 2010, was $224.9 million (2009 – $232.1 million), which was effectively fixed to an interest rate of 6.75% using an interest rate swap which was also acquired as part of the acquisition. The CEC debt is payable quarterly and matures in September 2026.
17 Long-term debt (CONTINUED)

Notes to consolidated financial statements. pg85 ENMAX Corporation 2010
PROMISSORY NOTE
The promissory note was issued in the fourth quarter of 2006 and represents an amortizing loan from The Board of Trustees of Westwind School Division No. 74, acting as agent for the Wind Participation Consortium (WPC), which is comprised of three school divisions. The 20-year note, in the amount of $6.3 million, bears interest at a fixed rate of 5% and is repayable in monthly installments. The Corporation provided a fixed charge over two wind turbines located at Taber, Alberta, as security for the loan. Concurrent with execution of the loan, WPC executed a 20-year electricity services agreement with ENMAX Energy.
PRINCIPAL REPAYMENTS
The required repayments of principal on the long-term debt at December 31, 2010, are as follows:
(millions of dollars)
2011 50.02012 49.42013 48.82014 297.82015 46.4Thereafter 935.3
18 Share capital
NUMBER OF SHARES AMOUNT
(millions of dollars except share amounts)
AUTHORIZED:
Unlimited number of common sharesIssued and outstanding: Issued on incorporation 1 – Issued on transfer of net assets from CES (note 1) 1 278.2 Issued on transfer of billing and customer care assets from The City in 2001 1 1.9
3 280.1
19 Accumulated other comprehensive income
AS AT DECEMBER 31, 2010 2009
(millions of dollars)
Unrealized losses on available-for-sale financial assets (1.2) (1.7)Unrealized losses on derivatives designated as cash flow hedges (37.1) (21.3)
Accumulated other comprehensive losses, including a future income tax expense of $0.3 million (2009 – expense of $7.1 million) (38.3) (23.0)
17 Long-term debt (CONTINUED)
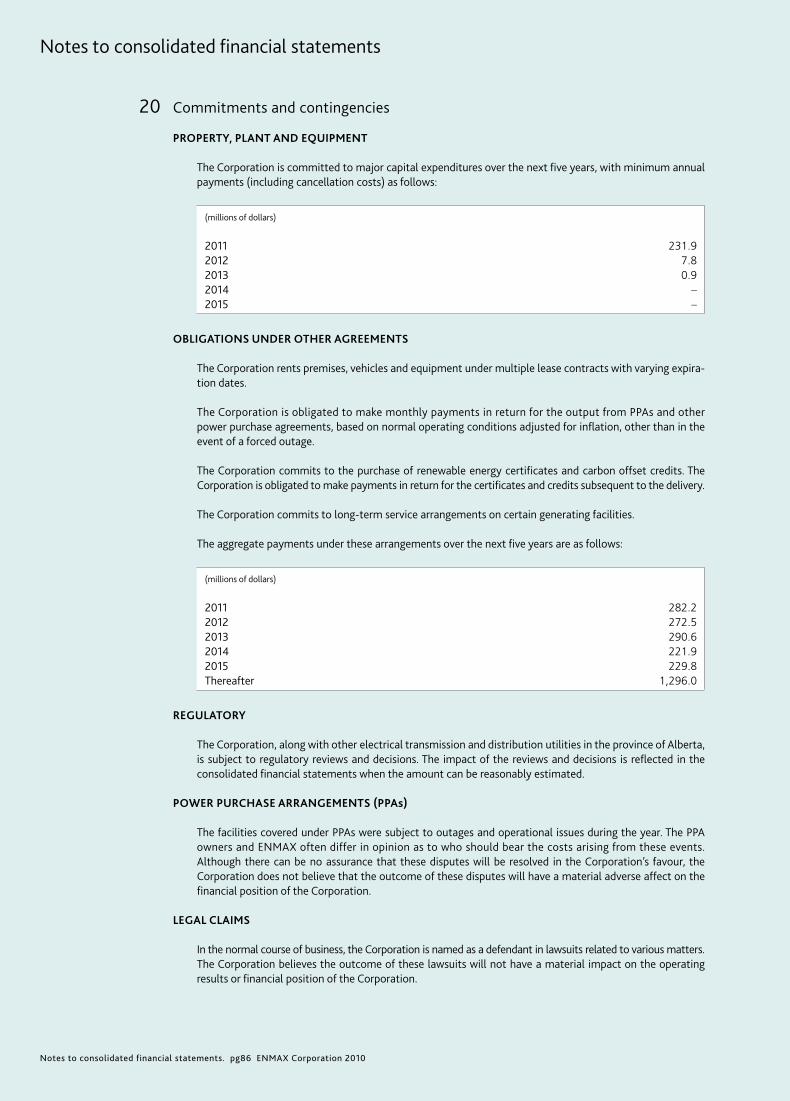
Notes to consolidated financial statements. pg86 ENMAX Corporation 2010
Notes to consolidated financial statements
20 Commitments and contingencies
PROPERTY, PLANT AND EQUIPMENT
The Corporation is committed to major capital expenditures over the next five years, with minimum annual payments (including cancellation costs) as follows:
(millions of dollars)
2011 231.92012 7.82013 0.92014 –2015 –
OBLIGATIONS UNDER OTHER AGREEMENTS
The Corporation rents premises, vehicles and equipment under multiple lease contracts with varying expira-tion dates.
The Corporation is obligated to make monthly payments in return for the output from PPAs and other power purchase agreements, based on normal operating conditions adjusted for inflation, other than in the event of a forced outage.
The Corporation commits to the purchase of renewable energy certificates and carbon offset credits. The Corporation is obligated to make payments in return for the certificates and credits subsequent to the delivery.
The Corporation commits to long-term service arrangements on certain generating facilities.
The aggregate payments under these arrangements over the next five years are as follows:
(millions of dollars)
2011 282.22012 272.52013 290.62014 221.92015 229.8Thereafter 1,296.0
REGULATORY
The Corporation, along with other electrical transmission and distribution utilities in the province of Alberta, is subject to regulatory reviews and decisions. The impact of the reviews and decisions is reflected in the consolidated financial statements when the amount can be reasonably estimated.
POWER PURCHASE ARRANGEMENTS (PPAs)
The facilities covered under PPAs were subject to outages and operational issues during the year. The PPA owners and ENMAX often differ in opinion as to who should bear the costs arising from these events. Although there can be no assurance that these disputes will be resolved in the Corporation’s favour, the Corporation does not believe that the outcome of these disputes will have a material adverse affect on the financial position of the Corporation.
LEGAL CLAIMS
In the normal course of business, the Corporation is named as a defendant in lawsuits related to various matters. The Corporation believes the outcome of these lawsuits will not have a material impact on the operating results or financial position of the Corporation.

Notes to consolidated financial statements. pg87 ENMAX Corporation 2010
INCOME TAX
Alberta Finance, Tax and Revenue Administration (Alberta Finance) is responsible for assessing the income tax returns filed under the PILOT regulation of the EUA which became effective January 1, 2001.
The Corporation regularly reviews the potential for adverse outcomes in respect of tax matters and believes it has adequate provisions for these tax matters. Tax provisions are adjusted, positively or negatively, for changes in estimates and assessments by tax authorities in the period in which they are more likely than not to have an impact on the financial results.
ENVIRONMENTAL
Provincial regulations aimed at reducing the levels of GHG emissions took effect July 2007. These changes in law due to the change of law provisions in ENMAX Energy’s PPAs and Tolling Agreements expose ENMAX Energy to the associated compliance costs.
For the year ended December 31, 2010, the consolidated financial statements include a charge to earnings in the amount of $24.5 million (2009 – $24.2 million), included in costs of electricity services provided, relating to estimated compliance costs under the provincial GHG regulations for ENMAX Energy’s interests in coal and natural gas-fired generation facilities through its PPAs and owned assets. Compliance payments are due to the plant owners by June 30 of the year following the compliance. ENMAX Energy has taken steps, including acquiring qualified offset credits from both its wind generation assets and purchases on the wholesale market, to mitigate impacts of the GHG regulations.
LETTERS OF CREDIT
In the normal course of operations, letters of credit are issued to facilitate the extension of sufficient credit for counterparties having credit exposure to the Corporation or its subsidiaries. As at December 31, 2010, the Corporation had issued letters of credit amounting to $283.9 million (December 31, 2009 – $237.5 million).
DIRECTOR/OFFICER INDEMNIFICATIONS
Under its bylaws, the Corporation indemnifies individuals who have acted at the Corporation’s request to be a director and/or officer of the Corporation and/or one or more of its direct and indirect subsidiaries, to the extent permitted by law, against any and all damages, liabilities, costs, charges or expenses suffered or incurred by the individuals as a result of their service. The claims covered by such indemnifications are subject to statutory or other legal restrictions and limitation periods. The nature of the indemnification agreements prevents the Corporation from making a reasonable estimate of the maximum potential amount it could be required to pay to beneficiaries of such indemnification agreements. The Corporation has purchased various insurance policies to reduce the risks associated with the indemnification.
OTHER INDEMNIFICATIONS
In the ordinary course of business, the Corporation and its subsidiaries enter into contracts which contain indemnification provisions, such as purchase and sale contracts, service agreements, intellectual property licensing agreements, purchases and sales of assets and equipment, joint venture agreements, operating agreements and leasing and land use arrangements. In such contracts, the Corporation may indemnify counter-parties to the contracts if certain events occur, such as undisclosed liabilities, changes in financial condition and loss caused by the actions of third parties or as a result of litigation or other claims by third parties. These indemnification provisions will vary based upon the contract. In most cases, there are no pre-determined amounts or limits included in these indemnification provisions and the occurrence of contingent events that will trigger payment under them is difficult to predict. Therefore, the maximum potential future amount the Corporation could be required to pay cannot be estimated.
20 Commitments and contingencies (CONTINUED)

Notes to consolidated financial statements. pg88 ENMAX Corporation 2010
Notes to consolidated financial statements
21 Interest
AS AT DECEMBER 31, 2010 2009
(millions of dollars)
Interest on long-term debt 79.1 71.2Short-term interest and other financing charges 4.2 3.6Less: allowance for funds used during construction and capitalized interest (21.3) (20.8)
62.0 54.0
22 Change in non-cash working capital
YEAR ENDED AT DECEMBER 31, 2010 2009
Millions of dollars
Accounts receivable (6.2) 33.7Inventory – 0.3Income taxes receivable 24.9 (39.2)Other current assets 13.4 (23.3)Accounts payable and accrued liabilities (1.6) (42.0)Other current liabilities (31.0) 1.9Income taxes payable (13.7) 2.0
(14.2) (66.6)
23 Capital management
The Corporation’s objectives when managing capital are: (i) to maintain a flexible capital structure which optimizes corporate liquidity as well as the cost of capital at acceptable risk, (ii) to manage capital in a manner which balances the interests of stakeholders and (iii) to meet regulatory requirements for certain operations subject to rate regulation.
The Corporation’s management considers its capital structure to consist of net debt and Shareholder’s equity. Net debt is comprised of long-term debt, including current portions, less cash and cash equivalents. The capital structure is as follows:
AS AT DECEMBER 31, 2010 2009
(millions of dollars)
Long-term debt (1) 1,427.7 1,319.8Less: cash and cash equivalents 65.8 55.7
NET DEBT 1,361.9 1,264.1Shareholder’s equity 1,845.2 1,744.5
TOTAL CAPITAL 3,207.1 3,008.6
(1) Includes current portion of $50.0 million (2009 – $46.1 million). Maturity dates range from January 2015 to June 2035.
The Corporation manages its consolidated capital structure through prudent levels of borrowing, cash flow forecasting, working capital management and adjustments to these measures in light of changes in eco-nomic conditions and the risk characteristics for both its regulated and non-regulated operations. Certain components of ENMAX Power’s operations are regulated by the AUC, which permits a return on a deemed capital structure. The Corporation manages ENMAX Power’s capital structure such that it is consistent with the deemed capital structure in order to achieve the returns allowed by the regulator.
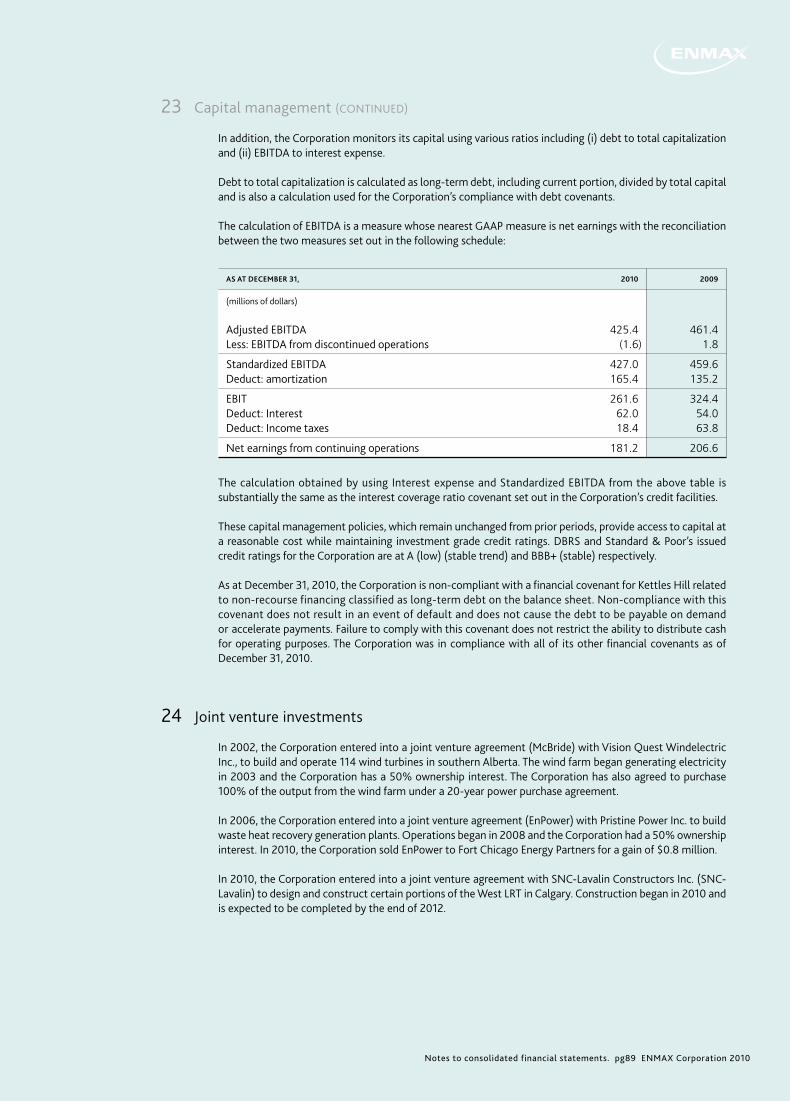
Notes to consolidated financial statements. pg89 ENMAX Corporation 2010
In addition, the Corporation monitors its capital using various ratios including (i) debt to total capitalization and (ii) EBITDA to interest expense.
Debt to total capitalization is calculated as long-term debt, including current portion, divided by total capital and is also a calculation used for the Corporation’s compliance with debt covenants.
The calculation of EBITDA is a measure whose nearest GAAP measure is net earnings with the reconciliation between the two measures set out in the following schedule:
AS AT DECEMBER 31, 2010 2009
(millions of dollars)
Adjusted EBITDA 425.4 461.4Less: EBITDA from discontinued operations (1.6) 1.8
Standardized EBITDA 427.0 459.6Deduct: amortization 165.4 135.2
EBIT 261.6 324.4Deduct: Interest 62.0 54.0Deduct: Income taxes 18.4 63.8
Net earnings from continuing operations 181.2 206.6
The calculation obtained by using Interest expense and Standardized EBITDA from the above table is substantially the same as the interest coverage ratio covenant set out in the Corporation’s credit facilities.
These capital management policies, which remain unchanged from prior periods, provide access to capital at a reasonable cost while maintaining investment grade credit ratings. DBRS and Standard & Poor’s issued credit ratings for the Corporation are at A (low) (stable trend) and BBB+ (stable) respectively.
As at December 31, 2010, the Corporation is non-compliant with a financial covenant for Kettles Hill related to non-recourse financing classified as long-term debt on the balance sheet. Non-compliance with this covenant does not result in an event of default and does not cause the debt to be payable on demand or accelerate payments. Failure to comply with this covenant does not restrict the ability to distribute cash for operating purposes. The Corporation was in compliance with all of its other financial covenants as of December 31, 2010.
24 Joint venture investments
In 2002, the Corporation entered into a joint venture agreement (McBride) with Vision Quest Windelectric Inc., to build and operate 114 wind turbines in southern Alberta. The wind farm began generating electricity in 2003 and the Corporation has a 50% ownership interest. The Corporation has also agreed to purchase 100% of the output from the wind farm under a 20-year power purchase agreement.
In 2006, the Corporation entered into a joint venture agreement (EnPower) with Pristine Power Inc. to build waste heat recovery generation plants. Operations began in 2008 and the Corporation had a 50% ownership interest. In 2010, the Corporation sold EnPower to Fort Chicago Energy Partners for a gain of $0.8 million.
In 2010, the Corporation entered into a joint venture agreement with SNC-Lavalin Constructors Inc. (SNC-Lavalin) to design and construct certain portions of the West LRT in Calgary. Construction began in 2010 and is expected to be completed by the end of 2012.
23 Capital management (CONTINUED)

Notes to consolidated financial statements. pg90 ENMAX Corporation 2010
Notes to consolidated financial statements
Summarized financial information of the Corporation’s proportionate share of the joint ventures’ assets, operations and cash flows are as follows:
AS AT AND FOR THE YEAR ENDED DECEMBER 31, 2010 2009
SNC-LAVALIN MCBRIDE ENPOWER (1) TOTAL MCBRIDE ENPOWER (1) TOTAL
(millions of dollars)
BALANCE SHEET Cash and cash equivalents 1.2 – – 1.2 – 0.3 0.3 Accounts receivable 0.9 – – 0.9 0.6 0.4 1.0 Other current assets – – – – – 0.1 0.1 Property, plant and equipment – 37.0 – 37.0 39.2 14.6 53.8 Future income taxes asset (liability) – – – – – 0.1 0.1 Other long-term assets – – – – – 0.5 0.5 Accounts payable (0.3) – – (0.3) – (0.1) (0.1) Current portion of long-term debt – – – – – (0.3) (0.3) Other current liabilities (1.6) – – (1.6) – – – Long-term debt – – – – (11.4) (11.4) Other long-term liabilities – (0.5) – (0.5) (0.5) – (0.5)
Proportionate share in net assets of joint ventures 0.2 36.5 – 36.7 39.3 4.2 43.5
INCOME STATEMENT EARNINGS Revenue 2.7 7.0 1.9 11.6 7.9 1.8 9.7 Costs and expenses (2.4) (2.1) (0.7) (5.2) (2.9) (0.6) (3.5) Amortization (0.1) (2.1) – (2.2) (1.7) (0.6) (2.3) Interest – – (0.7) (0.7) – – – Income taxes recovery (expenses) – – (0.1) (0.1) – 0.1 0.1
Proportionate share in net earnings of joint venture 0.2 2.8 0.4 3.4 3.3 0.7 4.0
CASH FLOWS Operating activities 1.3 5.6 0.7 7.6 4.9 0.1 5.0 Investing activities (0.1) – 15.2 15.1 – – – Financing activities – (5.6) (16.2) (21.8) (4.9) (2.7) (7.6)
Proportionate share in the increase in cash and cash equivalents of joint venture 1.2 – (0.3) 0.9 – (2.6) (2.6)
(1) EnPower has been reclassified to held for sale on the consolidated balance sheet and as discontinued operations on the consolidated income statement as at December 31, 2009. On December 1, 2010, the sales transaction of EnPower was completed.
25 Related party transactions
Total revenues received from The City for the year ended December 31, 2010, were $93.6 million (2009 – $89.7 million). Revenues include contract sales of electricity, provision of non-regulated power distribution services and billing and customer care services relating to The City’s utilities departments.
Amounts owing to the Corporation from The City for services provided are as follows:
AS AT DECEMBER 31, 2010 2009
(millions of dollars)
Total receivable from The City 22.6 25.6
24 Joint venture investments. (CONTINUED)

Notes to consolidated financial statements. pg91 ENMAX Corporation 2010
Total expenditures for goods and services received from The City for the year ended December 31, 2010, were $105.1 million (2009 – $116.6 million). Expenditures include local access fees for use of The City’s rights-of-way.
The Corporation is required to pay an administration fee to The City of 0.25% of the average monthly out-standing City debenture balance. For the year ended December 31, 2010, the amount paid was $1.5 million (2009 – $1.2 million).
Included in accounts payable are amounts owed to The City as follows:
AS AT DECEMBER 31, 2010 2009
(millions of dollars)
Goods and services received 0.2 0.4Local access fees 8.3 8.4
Total payable to The City 8.5 8.8
Transactions between the Corporation and The City have been recorded at the exchange amounts. Exchange amounts are the amounts as outlined by the contracts in effect between the Corporation and The City.
26 Comparative figures
Certain comparative figures have been reclassified to conform to the current period’s presentation.
27 Subsequent events
In February 2011, the sale of the remaining British Columbia assets was completed with Veresen Inc. (formerly Fort Chicago Energy Partners L.P.). On February 8, 2011, the sale of the Clowhom facility was completed and on February 14, 2011, the sale of Furry Creek was completed.
On March 9, 2011, the Corporation declared a dividend of $55.6 million payable to The City in quarterly installments in 2011.
25 Related party transactions (CONTINUED)
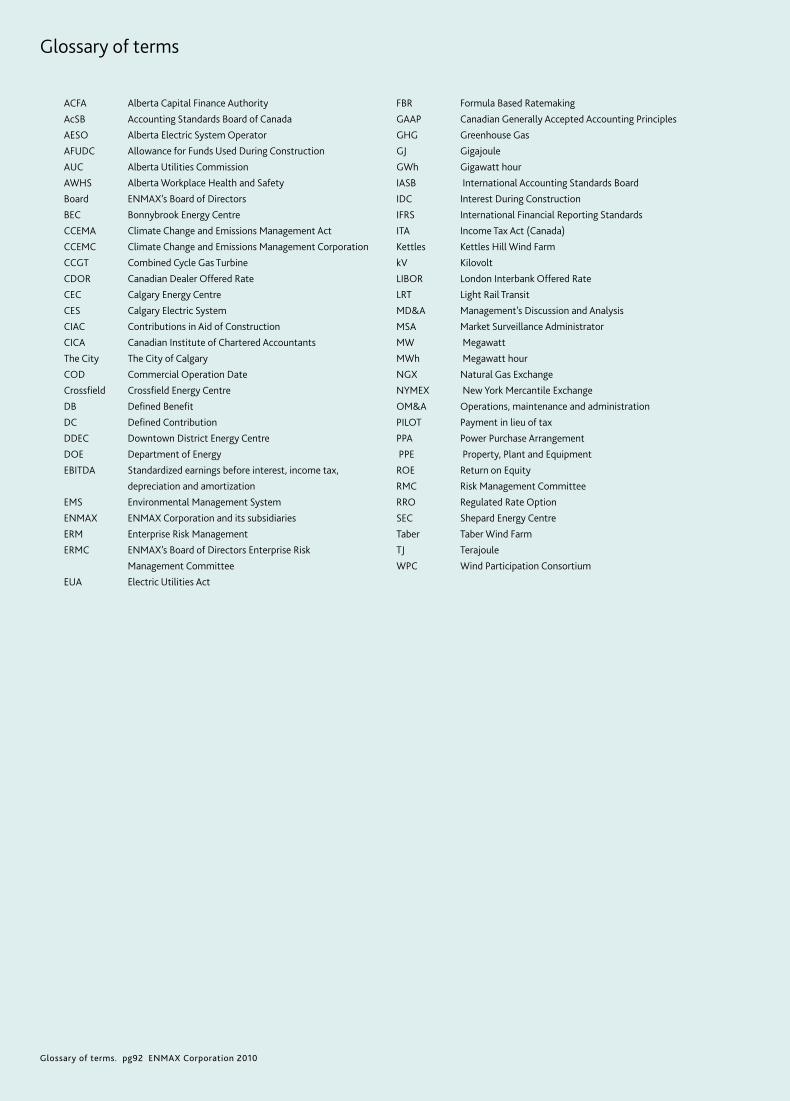
Glossary of terms. pg92 ENMAX Corporation 2010
Glossary of terms
ACFA Alberta Capital Finance Authority
AcSB Accounting Standards Board of Canada
AESO Alberta Electric System Operator
AFUDC Allowance for Funds Used During Construction
AUC Alberta Utilities Commission
AWHS Alberta Workplace Health and Safety
Board ENMAX’s Board of Directors
BEC Bonnybrook Energy Centre
CCEMA Climate Change and Emissions Management Act
CCEMC Climate Change and Emissions Management Corporation
CCGT Combined Cycle Gas Turbine
CDOR Canadian Dealer Offered Rate
CEC Calgary Energy Centre
CES Calgary Electric System
CIAC Contributions in Aid of Construction
CICA Canadian Institute of Chartered Accountants
The City The City of Calgary
COD Commercial Operation Date
Crossfield Crossfield Energy Centre
DB Defined Benefit
DC Defined Contribution
DDEC Downtown District Energy Centre
DOE Department of Energy
EBITDA Standardized earnings before interest, income tax,
depreciation and amortization
EMS Environmental Management System
ENMAX ENMAX Corporation and its subsidiaries
ERM Enterprise Risk Management
ERMC ENMAX’s Board of Directors Enterprise Risk
Management Committee
EUA Electric Utilities Act
FBR Formula Based Ratemaking
GAAP Canadian Generally Accepted Accounting Principles
GHG Greenhouse Gas
GJ Gigajoule
GWh Gigawatt hour
IASB International Accounting Standards Board
IDC Interest During Construction
IFRS International Financial Reporting Standards
ITA Income Tax Act (Canada)
Kettles Kettles Hill Wind Farm
kV Kilovolt
LIBOR London Interbank Offered Rate
LRT Light Rail Transit
MD&A Management’s Discussion and Analysis
MSA Market Surveillance Administrator
MW Megawatt
MWh Megawatt hour
NGX Natural Gas Exchange
NYMEX New York Mercantile Exchange
OM&A Operations, maintenance and administration
PILOT Payment in lieu of tax
PPA Power Purchase Arrangement
PPE Property, Plant and Equipment
ROE Return on Equity
RMC Risk Management Committee
RRO Regulated Rate Option
SEC Shepard Energy Centre
Taber Taber Wind Farm
TJ Terajoule
WPC Wind Participation Consortium

Corporate information.
Our corporate headquarters are located at:› 141 - 50 Avenue S.E. Calgary, Alberta T2G 4S7
You can contact our reception at:› Phone: (403) 514-3000 Fax: (403) 514-3365
We have a retail storefront in Calgary located at:› City of Calgary Municipal Building 3rd Floor, 800 Macleod Trail S.E. Calgary, Alberta T2P 2M5
We have a retail storefront in Red Deer located at:› 100 Red Deer Professional Building 4808 Ross Street Red Deer, Alberta T4N 1X5
Our Edmonton Office is located at:› Kingsway Mall Suite 290 109 Street & Princess Elizabeth Avenue Edmonton, Alberta T5G 3A6
Please direct financial inquiries to:› Charles Ruigrok
Interim President and Chief Executive Officer (403) 514-3050
› David Halford, CA Executive Vice President, Finance and Chief Financial Officer (403) 514-3000
Please direct media inquiries to:› Ian Todd
Vice President, Government and Media Relations (403) 514-2196
Shopping for retail energy offers?› The latest prices and packages are listed on our
website at enmax.com or by calling toll-free across Alberta at 310-2010.
› You can choose any retailer listed at www.ucahelps.gov.ab.ca or at (403) 310-4822. Electricity delivery to your home or business is not affected by your choice of retailer.
Interested in employment at ENMAX?› Visit our website at enmax.com/careers.
Find out more about corporate responsibility at ENMAX:
› Visit our website at enmax.com/cr
Learn more about smarter energy options:› Smart choices start here. Visit generatechoice.ca.
Join our Facebook group at facebook.com/generatechoice
Follow us on Twitter at twitter.com/generatechoice
Additional information relating to ENMAX can be found at enmax.com.

Related Documents