Globalization of Natural Gas Markets Working Papers WP-GG-17 Corporate Strategies along the LNG Value Added Chain - An Empirical Analysis of the Determinants of Vertical Integration Sophia Rüster and Anne Neumann September, 2006 Chair of Energy Economics and German Institute for Public Sector Management Economic Research Dresden University of Technology

Welcome message from author
This document is posted to help you gain knowledge. Please leave a comment to let me know what you think about it! Share it to your friends and learn new things together.
Transcript

Globalization of Natural Gas Markets Working Papers
WP-GG-17
Corporate Strategies along the LNG Value
Added Chain - An Empirical Analysis of the
Determinants of Vertical Integration
Sophia Rüster and Anne Neumann
September, 2006
Chair of Energy Economics and German Institute for Public Sector Management Economic Research Dresden University of Technology
II
Corporate Strategies along the LNG Value Added Chain
An Empirical Analysis of the Determinants of Vertical Integration
Sophia Ruester1 and Anne Neumann
Correspondent author: Sophia Rüster Dresden University of Technology Dpt. of Business and Economics Chair of Energy Economics and Public Sector Management D-01062 Dresden Germany Phone: +49-351-463-39769 Fax: +49-351-463-39763 Mail: [email protected] URL: www.ee2.biz
Abstract This study analyzes corporate strategies in the emerging global LNG market. In particular, we provide an empirical analysis of the determinants driving companies towards increasing vertical integration. Our hypothesis is that high transaction costs along the LNG value added chain induce a higher degree of vertical integration. This hypothesis is tested by implementing ordered response models. To explain determinants of vertical integration in the LNG industry we derive proxy variables by using explicit project data on 85 LNG (importing and exporting) projects worldwide. The transaction cost attributes asset specificity, uncertainty and frequency are measured. Additionally, we include industry and firm characteristics into the analysis. Our results show that players active in LNG export projects are characterized by a higher degree of vertical integration than those situated on the importing side of the value chain. The extent of investments in specific assets has a positive impact on the degree of vertical integration and the level of vertical integration has increased significantly with start up dates of projects since 2002. Private companies’ degree of vertical integration exceeds the degree of vertical integration of state-owned entities. Players tend to be more integrated with rising firm size and frequency of transactions in the LNG industry. We show that for value chains situated in the Atlantic Basin (in contrast to the Pacific Basin) the degree of vertical integration is higher. This is particularly the case for value chains connecting to European instead of North American import markets. Keywords: liquefied natural gas, vertical integration, LNG value chain, corporate strategies JEL-Codes: D23, L22, L95
1 This study is based on the Diploma Thesis of Ruester (2006). We thank Christian von Hirschhausen (Dresden University of Technology), Karsten Neuhoff (University of Cambridge), participants of a seminar at Groupe Réseaux Jean Monnet (University Paris Sud), participants of the 1st Enerday Workshop 2006 (Dresden University of Technology), participants of the ESNIE Summer School 2006 in Cargèse, and participants of the 29th IAEE International Conference held in Potsdam for helpful comments and suggestions. The usual disclaimer applies.
III
Table of Contents
Abstract
Table of Contents
List of Figures
List of Tables
Abbreviations
Executive Summary
1 Introduction
2 The (Liquefied) Natural Gas Sector and Corporate Strategies
2.1 Liquefied Natural Gas Business – From Infant towards Maturing Industry
2.2 Natural Gas Importing Regions – A Focus on Liquefied Natural Gas
2.3 Changing Corporate Strategies – Integrated Companies, Tollers, and New Entrants
3 Transaction Costs: A Literature Survey
4 Data and Methodology
5 Estimation Results and Interpretation
5.1 World Dataset
5.2 Atlantic Basin Dataset
6 Conclusions
References
Appendices
II
III
IV
IV
V
1
3
5
6
13
24
28
30
36
36
38
40
42
IV
List of Figures
Figure 1: The LNG value chain 6 Figure 2: Costs of gas, oil, and coal transportation 7 Figure 3: Capital costs for different LNG value chains 8 Figure 4: Average train capacities of new built liquefaction facilities 9 Figure 5: LNG vessel capacity development 9 Figure 6: Average costs per new built MTPA liquefaction capacity 10 Figure 7: Supply structure of different natural gas importing regions 14 Figure 8: Development of LNG import capacities worldwide until 2010 15 Figure 9: Country matrix measuring capacity development and LNG dependency 22 Figure 10: Choice of an Organizational Structure Dependent on Transaction Attributes 32 Figure 11: Influence on the likelihood or degree of vertical integration 40
List of Tables
Table 1: LNG imports by country 2005 14 Table 2: Existing U.S. LNG import terminals 16 Table 3: Existing European LNG import facilities 18 Table 4: European LNG import facilities (under construction or planned) 19 Table 5: Interpretation of the country matrix 23 Table 6: Global players' activities along the LNG value chain 25 Table 7: Exogenous Variables 34 Table 8: Descriptive Statistics Original Data 34 Table 9: Correlation Matrix Independent Variables 35 Table 10: Results ordered probit model (world dataset) 36 Table 11: Expectation-prediction table (world dataset) 38 Table 12: Results ordered probit model (Atlantic Basin sub-sample) 39 Table 13: Prediction table ordered response model (Atlantic Basin sub-sample) 39
V
Abbreviations
°C degree Celsius
°F degree Fahrenheit
bcf/d billion cubic feet per day
bcm billion cubic meter
bcm/a billion cubic meter per year
BG British Gas
bn billion
c.i.f. cost, insurance, freight
cm cubic meter
EDF Electricité de France
EIA Energy Information Administration
EU European Union
FERC Federal Energy Regulatory Commission
f.o.b. free on board
GDF Gaz de France
GDP gross domestic product
IEA International Energy Agency
IEEJ Institute of Energy Economics Japan
km kilometer
LNG liquefied natural gas
MARAD U.S. Maritime Administration
MBtu million British thermal units
MJ mega joule
MMscf/d million standard cubic feet per day
mn million
mtpa million tons per year
MWh mega Watt hour
n.a. not available
NBP National Balancing Point United Kingdom
OLS ordinary least squares
tba to be announced
TPA Third party access
UK United Kingdom
U.S. United States

1
Executive Summary Transportation of natural gas via LNG has been around for 40 years, but it is only now that it
increasingly gains in importance. According to IEA (2005b) natural gas demand will reach a share of
25% of total energy demand in 2030. This development is driven by several factors, ranging from
supply security to environmental concerns. In times of rising energy needs worldwide and expected
competition between demand regions – new (Asian) importers with strong economic growth enter the
stage – security of supply issues are on the political agenda.
The past five years have seen the development from an “infant” towards a “maturing” LNG industry.
Even if LNG technologies enabled transport over longer distances, shipping remained expensive and
markets therefore regional in nature in the “old world”. Most of the infrastructure along LNG value
chains remained under state control; trade was based on inflexible bilateral long-term contracts with
take-or-pay and destination clauses. Transport capacity was assigned to dedicated import and export
projects and routes. Fostered by increasing natural gas demand, investments in LNG infrastructure
grew rapidly during the 1990s. Today, LNG has turned from being an expensive and only regionally
traded fuel to a globally traded source of energy with rapidly diminishing cost. LNG plays an
increasing role in the energy supply of all major coastal countries such as the United States, the UK,
Spain, South Korea, India or China. The number of countries and companies participating in the
industry rises continuously. The Middle East, accounting for more than 40% of worldwide proven
natural gas reserves, will become the largest LNG exporting region and currently evolves to a swing
producer; deliveries to European as well as Asian markets are feasible without a significant difference
in (transportation) cost.
Changes in the institutional framework have moved the industry away from monopolistic structures
towards competition, thus stipulating fundamental changes in the organizational behavior of market
participants. Increasing competition, mirrored by functioning spot markets, a gain in contract
flexibility and increasing international trade, put traditional players (incumbents) under pressure.
Recent years have been characterized by integration and strategic partnerships becoming a common
corporate behavior in the industry. Global oil and natural gas producing companies as well as original
distributors heavily engage in all stages of the value chain of LNG production. Cornot-Gandolphe
(2005) and Iniss (2004) indicate that the coexistence of long- and short-term trading activities is
increasingly accompanied by vertical integration in the LNG industry. But we also observe a number
of new entrants into the market, currently mainly in North America, where the natural gas market is
characterized by functioning competition.
Based on a dataset constructed using detailed information about 85 LNG projects worldwide, we
analyze the determinants of vertical integration in the LNG industry under a transaction cost view. We
confirm our main hypothesis that increasing transaction costs lead to a higher degree of vertical
integration. Additionally, we show that the occurrence of investments in specific assets has a positive
impact on the degree of vertical integration. Players tend to integrate more strongly if highly
2
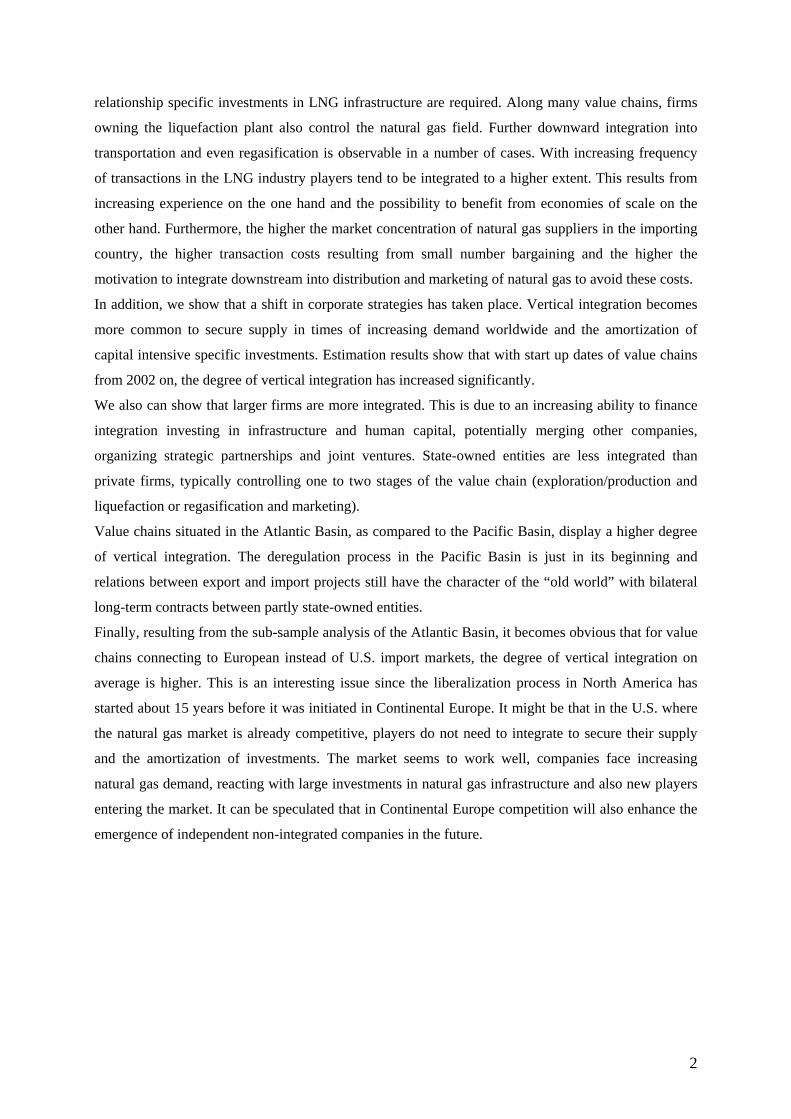
relationship specific investments in LNG infrastructure are required. Along many value chains, firms
owning the liquefaction plant also control the natural gas field. Further downward integration into
transportation and even regasification is observable in a number of cases. With increasing frequency
of transactions in the LNG industry players tend to be integrated to a higher extent. This results from
increasing experience on the one hand and the possibility to benefit from economies of scale on the
other hand. Furthermore, the higher the market concentration of natural gas suppliers in the importing
country, the higher transaction costs resulting from small number bargaining and the higher the
motivation to integrate downstream into distribution and marketing of natural gas to avoid these costs.
In addition, we show that a shift in corporate strategies has taken place. Vertical integration becomes
more common to secure supply in times of increasing demand worldwide and the amortization of
capital intensive specific investments. Estimation results show that with start up dates of value chains
from 2002 on, the degree of vertical integration has increased significantly.
We also can show that larger firms are more integrated. This is due to an increasing ability to finance
integration investing in infrastructure and human capital, potentially merging other companies,
organizing strategic partnerships and joint ventures. State-owned entities are less integrated than
private firms, typically controlling one to two stages of the value chain (exploration/production and
liquefaction or regasification and marketing).
Value chains situated in the Atlantic Basin, as compared to the Pacific Basin, display a higher degree
of vertical integration. The deregulation process in the Pacific Basin is just in its beginning and
relations between export and import projects still have the character of the “old world” with bilateral
long-term contracts between partly state-owned entities.
Finally, resulting from the sub-sample analysis of the Atlantic Basin, it becomes obvious that for value
chains connecting to European instead of U.S. import markets, the degree of vertical integration on
average is higher. This is an interesting issue since the liberalization process in North America has
started about 15 years before it was initiated in Continental Europe. It might be that in the U.S. where
the natural gas market is already competitive, players do not need to integrate to secure their supply
and the amortization of investments. The market seems to work well, companies face increasing
natural gas demand, reacting with large investments in natural gas infrastructure and also new players
entering the market. It can be speculated that in Continental Europe competition will also enhance the
emergence of independent non-integrated companies in the future.
3
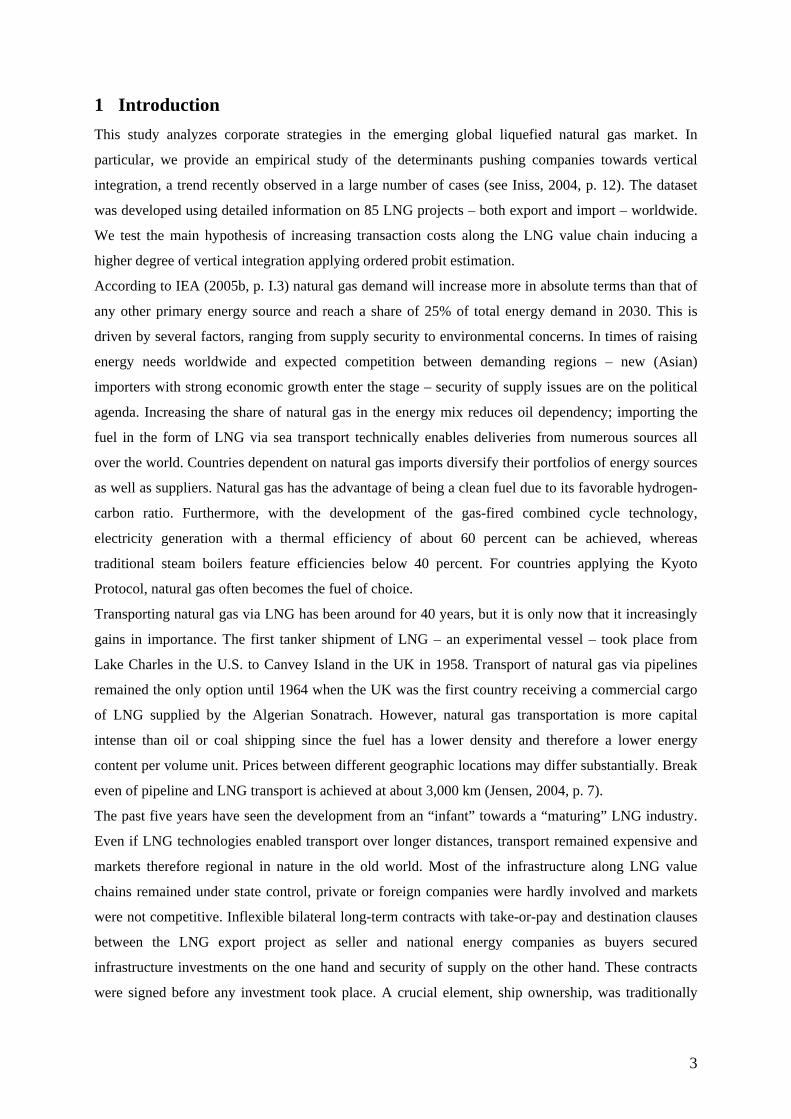
1 Introduction This study analyzes corporate strategies in the emerging global liquefied natural gas market. In
particular, we provide an empirical study of the determinants pushing companies towards vertical
integration, a trend recently observed in a large number of cases (see Iniss, 2004, p. 12). The dataset
was developed using detailed information on 85 LNG projects – both export and import – worldwide.
We test the main hypothesis of increasing transaction costs along the LNG value chain inducing a
higher degree of vertical integration applying ordered probit estimation.
According to IEA (2005b, p. I.3) natural gas demand will increase more in absolute terms than that of
any other primary energy source and reach a share of 25% of total energy demand in 2030. This is
driven by several factors, ranging from supply security to environmental concerns. In times of raising
energy needs worldwide and expected competition between demanding regions – new (Asian)
importers with strong economic growth enter the stage – security of supply issues are on the political
agenda. Increasing the share of natural gas in the energy mix reduces oil dependency; importing the
fuel in the form of LNG via sea transport technically enables deliveries from numerous sources all
over the world. Countries dependent on natural gas imports diversify their portfolios of energy sources
as well as suppliers. Natural gas has the advantage of being a clean fuel due to its favorable hydrogen-
carbon ratio. Furthermore, with the development of the gas-fired combined cycle technology,
electricity generation with a thermal efficiency of about 60 percent can be achieved, whereas
traditional steam boilers feature efficiencies below 40 percent. For countries applying the Kyoto
Protocol, natural gas often becomes the fuel of choice.
Transporting natural gas via LNG has been around for 40 years, but it is only now that it increasingly
gains in importance. The first tanker shipment of LNG – an experimental vessel – took place from
Lake Charles in the U.S. to Canvey Island in the UK in 1958. Transport of natural gas via pipelines
remained the only option until 1964 when the UK was the first country receiving a commercial cargo
of LNG supplied by the Algerian Sonatrach. However, natural gas transportation is more capital
intense than oil or coal shipping since the fuel has a lower density and therefore a lower energy
content per volume unit. Prices between different geographic locations may differ substantially. Break
even of pipeline and LNG transport is achieved at about 3,000 km (Jensen, 2004, p. 7).
The past five years have seen the development from an “infant” towards a “maturing” LNG industry.
Even if LNG technologies enabled transport over longer distances, transport remained expensive and
markets therefore regional in nature in the old world. Most of the infrastructure along LNG value
chains remained under state control, private or foreign companies were hardly involved and markets
were not competitive. Inflexible bilateral long-term contracts with take-or-pay and destination clauses
between the LNG export project as seller and national energy companies as buyers secured
infrastructure investments on the one hand and security of supply on the other hand. These contracts
were signed before any investment took place. A crucial element, ship ownership, was traditionally
4
embedded in these contracts; with transportation capacity thus dedicated to special import and export
projects and routes.
Fostered by increasing natural gas demand, investments in LNG infrastructure grew rapidly during the
1990s. Liquefied natural gas has turned from being an expensive and only regionally traded fuel to a
globally traded source of energy with rapidly diminishing cost. Today, LNG plays an increasing role
in the energy supply of all major coastal countries such as the United States, the UK, Spain, South
Korea, India or China. The number of countries and companies participating in the industry rises
continuously. For a survey of the globalizing LNG market see Jensen (2004). Making large volumes
of natural gas accessible for importing regions, bulky investments in asset specific infrastructure along
the whole value chain remain a crucial issue. During the last five years 46 billion cubic meters (bcm)
of regasification capacity started operation worldwide (11.3% of today’s capacity), an additional 140
bcm are expected to come on stream until 2010. The Middle East, accounting for more than 40% of
worldwide proven natural gas reserves, will become the largest LNG exporting region and currently
evolves to a swing producer; deliveries to European as well as Asian markets are feasible without a
significant difference in (transportation) cost.
Changes in the institutional framework have moved the industry away from monopolistic structures
towards competition thus stipulating fundamental changes in the organizational behavior of market
participants. Increasing competition, mirrored by functioning spot markets, a gain in contract
flexibility and increasing international trade, put traditional players (incumbents) under pressure.
Recent years have been characterized by integration and strategic partnerships becoming a common
corporate behavior in the industry. Global oil and natural gas producing companies as well as original
distributors heavily engage in all stages of the value chain of LNG production. Export projects, a long
time dominated by state-owned entities, are increasingly developed by private oil and gas companies.
Former (European) monopolists of natural gas are facing their traditional markets challenged by the
intrusion of oil and gas majors integrating downstream into import markets. Vertical integration in
response to market deregulation features several drivers: upstream producers aiming to benefit from
downstream margins, ownership of transportation capacities to exploit arbitraging possibilities, and
distribution and power companies moving upstream to ensure margins and security of supply in times
of increasing demand worldwide. Several publications (e.g. Cornot-Gandolphe (2005), Iniss (2004))
focus on activities in LNG trade in the Atlantic Basin and indicate that coexistence of long- and short-
term trading activities is increasingly accompanied by vertical integration in the LNG industry. Nissen
(2006) describes the commercial model of LNG trade.
However, vertical integration, strategic partnerships and mergers lead to an industry in which a small
number of large and powerful players are active. Jensen (2004, p. 4) argues that in the developing
global LNG market “super majors” will play an important role. Vertical integration along the value
chain limits competition at the horizontal level thus counteracting liberalization efforts in downstream
markets.
5
A large number of empirical case studies examine firms’ motivation to choose alternative institutions
of governance and determinants of vertical integration in different industries, such as Monteverde and
Teece (1982), Masten (1984), and Klein (1988) focusing on make-or-buy decisions in the
manufacturing sector. The work of Joskow (1985), discussing coal fired power plants in the U.S.,
distinguishes between different situations leading to coal procurement on spot markets, based on long-
term contracts or through vertical integration. An in-depth overview on existing empirical work is
provided by Klein (2004). All mentioned case studies explain vertical integration by institutional
factors basically represented by proxy variables for transaction costs, industry- and firm characteristics
and other exogenous factors.
This study is placed in the continuation of this literature analyzing the determinants of vertical
integration in the LNG industry from the perspective of transaction cost economics. The main
hypothesis of increasing transaction costs along the LNG value chain (mainly due to increasing asset
specificity and uncertainty) leading to a higher degree of vertical integration is tested applying ordered
response models. The main findings are consistent with theory. It can be shown that investments in
specific infrastructure have a positive impact on the likelihood of vertical integration. The extent of
vertical integration has increased significantly with project start up dates later than 2002, which can
possibly be explained as firms’ response to changes in the institutional environment due to the
liberalization of natural gas markets. Furthermore, private companies’ degree of vertical integration
exceeds the one of state-owned entities. With rising firm size and frequency of transactions in the
LNG industry players tend to be more integrated, which is explained by the increasing capability of
financing integration and benefits from experience and economies of scale. Furthermore, we show that
for value chains situated in the Atlantic Basin (in contrast to the Pacific Basin) the degree of vertical
integration is higher. This is particularly the case for value chains connecting to European instead of
North American import markets.
The remainder of this study is organized as follows: Section 2 provides a technical overview on the
development of the LNG industry, discusses different characteristics of three main natural gas
importing regions worldwide, and analyzes actual corporate strategies. Section 3 summarizes the
theoretical framework. Section 4 describes the dataset and introduces the econometric methodology. In
Section 5 estimation results for the whole world dataset as well as a sub-sample focusing on Atlantic
Basin value chains are presented and interpreted before Section 6 concludes.
2 The (Liquefied) Natural Gas Sector and Corporate Strategies This section describes the (liquefied) natural gas sector and corporate strategies. It points out varying
characteristics of different natural gas importing regions worldwide: the competitive U.S. market,
European countries currently liberalizing the industry, and Asian markets which are strongly
6
dependent on LNG imports and where liberalization is slow. Evolving corporate strategies resulting
from changing industry structures are discussed.
2.1 Liquefied Natural Gas Business – From Infant towards a Maturing Industry
The following paragraphs describe the LNG value chain, focusing on technical issues, cost structure
and economic improvements; and discus changes in this (currently enormously expanding) industry.
2.1.1 Liquefied natural gas value chain
LNG is an odorless, colorless, non-corrosive, and non-toxic cryogenic liquid. It consists to around 90
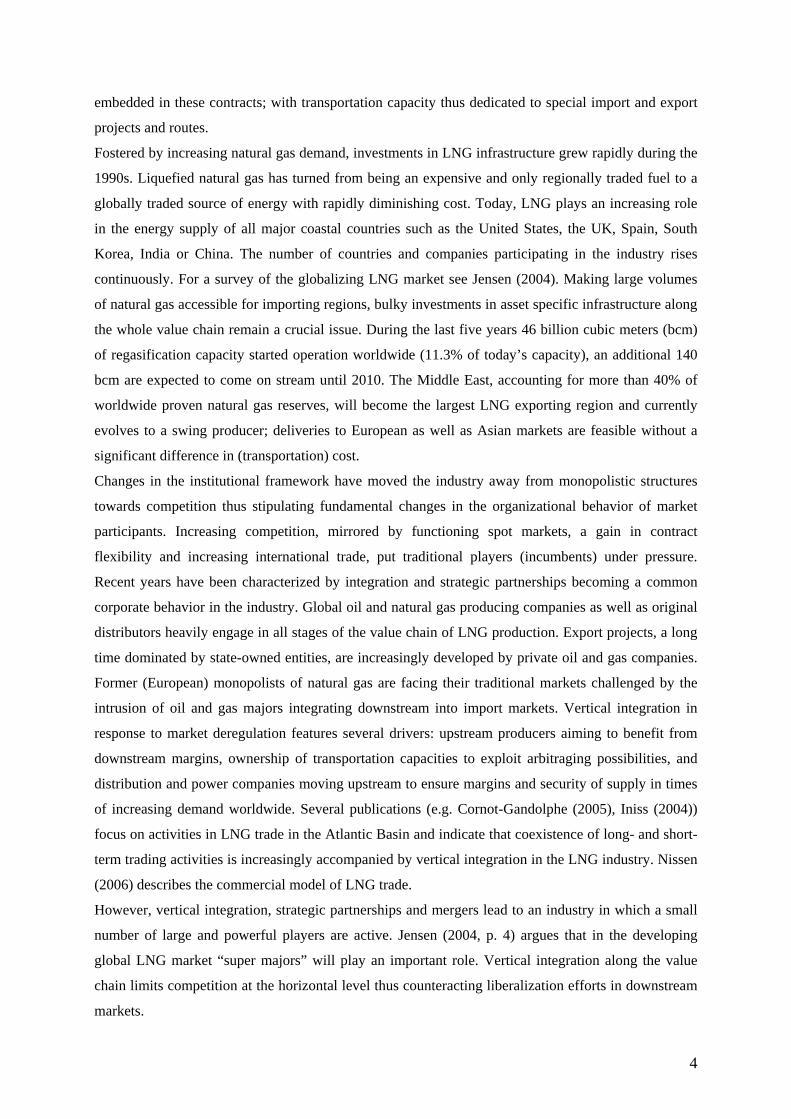
percent of methane (e.g. Abu Dhabi 87.1%, Alaska 99.72%, see Appendix 1). Figure 1 depicts the
LNG value chain consisting of five stages, from field development in export regions over liquefaction,
transportation, and regasification to sales and marketing of natural gas in the importing country.2
Figure 1: The LNG value chain
Following exploration and production from onshore or offshore fields (stage 1), natural gas is
transported per pipelines to the liquefaction facility,3 where it has to be pre-treated. Natural gas liquids
and all components that would freeze under cryogenic temperatures (propane, butane, ethane, carbon
dioxide, and water) have to be removed. Under atmospheric pressure using a cooling process, the gas
is cooled down to 111K (-161°C or -259°F), thus becoming liquid and shrinking to about 1/600th of its
original volume (stage 2).4 This process takes place in a unit called “train”; a liquefaction plant in
general consists of several parallel trains whose capacity is determined and limited by the size of
available compressors. Liquefied natural gas is loaded into specially constructed vessels, containing
complex cooling and insulation systems which are essential to keep the gas liquid. Today, two types of
tankers are common, Moss design (spherical tanks) and Membrane design (tanks in the form of the
cargo). Typical size of a ship is about 138,000 cm; larger designs up to 250,000 cm are currently under 2 Other authors define the LNG value chain as consisting only of three stages; exploration and production are seen as part of the liquefaction project, sales and marketing are eliminated (see e.g. IEEJ, 2003, p. 8). 3 Pipelines from the field to a liquefaction plant are considered as part of the “liquefaction project”, so are storage tanks, loading equipment and other operational facilities. 4 Among different methods to liquefy natural gas, today, the LNG market is dominated by two technologies. For Air Products’ Pre-Cooled Mixed Refrigerant Process (82% of all existing terminals, see Simmons, 2006, p. 45) propane is used for pre-cooling. A process using a mixture of nitrogen, methane, ethane and propane realizes liquefaction. A self-built cryogenic heat exchanger is employed. Philipps developed the Optimized Cascade Process (13%) in which natural gas passes through a cascade of three cooling processes using propane, ethylene and methane as refrigerants. A simple aluminum plate fin component serves as heat exchanger. A technology still new on the market is the one Linde and Statoil developed for the Snovhit terminal in Norway using a cascade process, with a mixture of refrigerants liquefying the gas in every stage.
Exploration & Production
Liquefaction Transport Sales Regasification

7
investigation. LNG is shipped to its destination country (stage 3); the gas vaporizing during transport
is used to fuel the ship. At import terminals, LNG is converted to its original state of aggregation
through a heating process (stage 4). Storage tanks are used to enable a more continuous flow into the
pipeline grid and to cover peak demand.5 Finally, after pressure regulation, natural gas is fed into the
national pipeline grid and sold (stage 5) to marketers, distributors or directly to power producers and
large industrial consumers. In some instances, LNG is transported in its liquid state by truck to single
consumers (e.g. from the U.S. to Mexico).
Natural gas transportation is much more expensive than oil or coal shipping since the fuel has a lower
density and therefore a lower energy content per volume unit. Prices between different geographic
locations may differ substantially. Whereas gas pipelines benefit strongly from economies of scale,
LNG projects require large fixed investments specific infrastructure. For shorter distances pipelines
are more economic, for longer distances LNG is economically feasible. The following figure
illustrates the development of costs of natural gas, oil and coal transportation with raising distances
between exporter and importer.
Figure 2: Costs of gas, oil, and coal transportation
Source: Jensen (2004, p. 7)
Investment costs within the five stages vary significantly, with the largest share induced by the
liquefaction project. The typical structure described by EIA (2003, p. 42) is exploration and
production accounting for 15-20% of the total costs of the LNG value chain; liquefaction for 30-45%;
5 Whereas liquefaction facilities usually run at full capacity, what is necessary to amortize these capital intensive investments, regasification plants often do not so, they may also serve as strategic supply sources to cover seasonal demand spikes. For example, in cold winter periods, different countries like Spain and South Korea purchase extra cargoes above volumes contracted in long-term agreements on a spot basis.

8
shipping for 10-30%; and regasification and distribution finally for 15-25%. Concrete values depend
on different driving factors like the distance between exporting and importing region, employed
technologies, or traded volumes.
Figure 3 compares detailed cost structures for value chains from different exporting countries to
importers in the Atlantic and Pacific Basin. It shows that transportation costs vary strongly with the
distance and have a significant influence on the price of LNG; this is in contrast to oil or coal trade,
where transportation expenses have only a marginal influence on the price. Exploration and production
costs are very similar for all examples. Regasification and distribution have the lowest impact on total
capital costs of an LNG value chain.6
Figure 3: Capital costs for different LNG value chains
0
1,000
2,000
3,000
4,000
5,000
6,000
7,000
T rinidad to U.S.(brown-field)
Indonesia toJapan (green-
field)
Nigeria to U.S.(green-field)
Qatar to U.S.(brown-field)
Bolivia to U.S.(green-field)
CA
PEX
in m
illio
n U
SD
E&P Liquefaction T ransport Regasification & Distribution
Source: Jensen (2003, p. 3)
2.1.2 Economics along the LNG value chain
During the last years, significant cost reductions along all stages of the value chain were realized.
Whereas in 1990 investment costs per mtpa liquefaction capacity were about US $500, in 2002 this
amount decreased to US $200 (EIA, 2003, p. 42). Over-design was reduced and benefits from large
economies of scale in liquefaction due to the shift from steam-driven to gas-turbine-driven
compressors and increasing size of gas turbines were realized. The first liquefaction trains had a
capacity of 1.1 mtpa (Arzew in Algeria), today trains with a capacity of around 4 mtpa are common,
and even the construction of units with 7.8 mtpa is planned. Economies of scale of two 4 mtpa trains
reduce liquefaction cost of an 8 mtpa green-field project with four 2 mtpa units by nearly 30%; a
6 Assumptions (Jensen, 2004, p. 6): two 3.3 mtpa liquefaction trains, a field investment of US $3.85 per annual MBtu, pipelines between fields and liquefaction facility are part of the „liquefaction project“. For the last value chain with deliveries from Bolivia to the U.S., liquefaction cost are significantly higher than for other projects, because a pipeline from Bolivia through Chile or Peru to the Pacific coast – treated as part of the liquefaction facility – would have to be constructed.
9
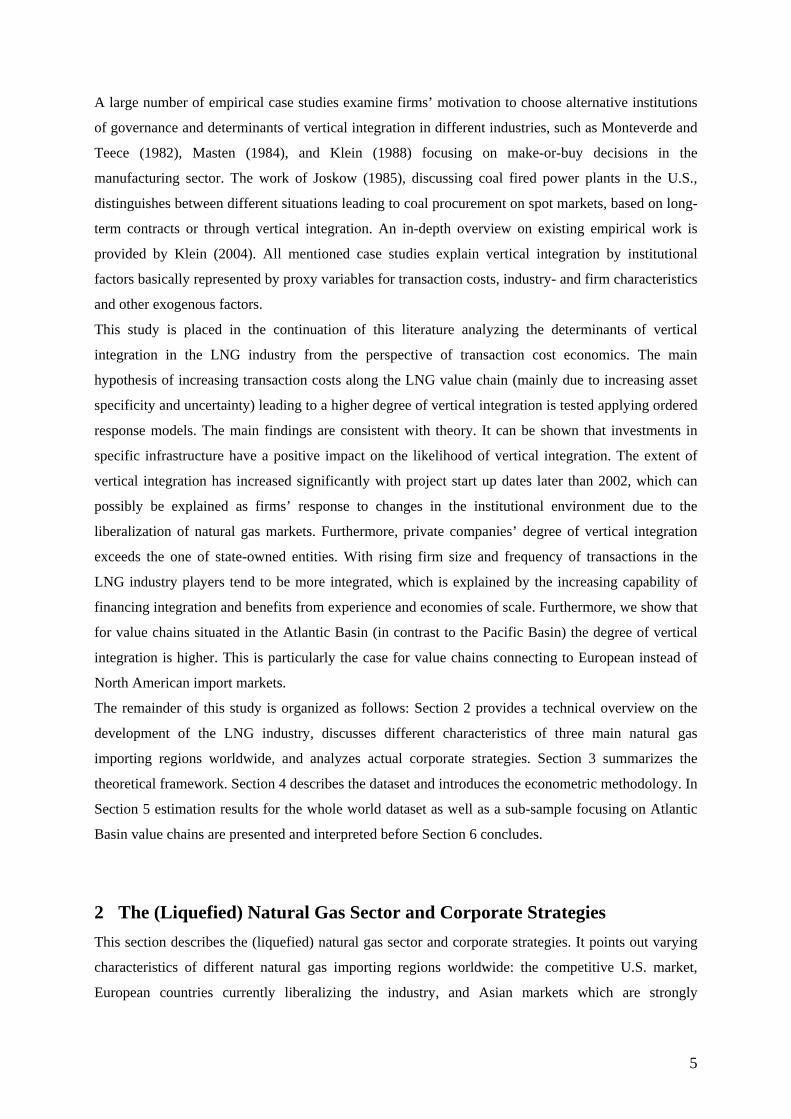
further increase to one 7.5 mtpa unit leads to an additional cost reduction by another 20% (Jensen,
2003, p. 31). Figure 4 shows average liquefaction train capacities which came on stream since 1964
and which are expected to start operation until 2010. The figure emphasizes the trend of increasing
train size.
Figure 4: Average train capacities of new built liquefaction facilities
0,00
1,00
2,00
3,00
4,00
5,00
6,00
7,00
1964
1070
1974
1978
1982
1984
1989
1993
1995
1998
2000
2003
2005
2007
2009
mtp
a
Source: Own illustration based on publicly available sources
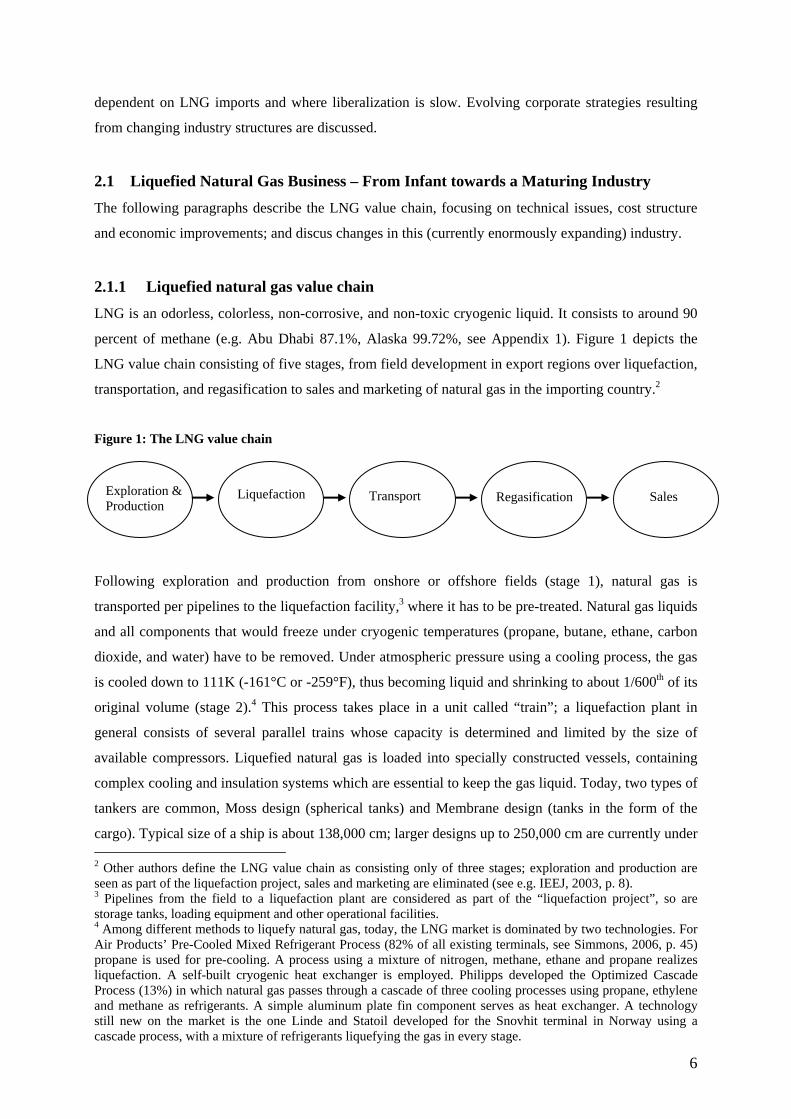
Tanker costs have fallen from US $280 million in the 1980s to US $155 million in 2003 (EIA, 2003, p.
42). Shipyards gain in experience and an increasing number of shipyards are capable of constructing
LNG vessels, thus enhancing competition. The construction of larger ships lowers average transport
costs per unit and makes deliveries over longer distances more economic.
Figure 5: LNG vessel capacity development
0
50,000
100,000
150,000
200,000
250,000
300,000
1970 1975 1980 1985 1990 1995 2000 2005 2010
capa
city
in c
m
Source: Own illustration based on Colton Company (2006)
10
Figure 5 shows that following ten years of smaller vessels with a capacity of 50,000 to 75,000 cm,
about 30 years ships of 130,000 to 140,000 cm have become common. Currently, large vessels with a
capacity of 210,000 to 250,000 cm are under investigation. A mixture of large-scale, mid-scale as well
as very small-scale ships will be employed for future LNG trade.7
On the importing side of the value chain, economies of scale especially due to larger but fewer storage
tanks could be achieved. Furthermore, for liquefaction as well as regasification projects the
construction of brown-field units (expansions of already existing liquefaction or regasification plants)
is much expensive than green-field facilities. In addition, construction costs are minimized using a
competitive bidding process to choose the less expensive EPC (engineering, procurement,
construction) contractor. However, resulting from rising steel prices due to increasing demand
worldwide, especially in Asian countries, tanker and LNG plant construction costs stopped declining
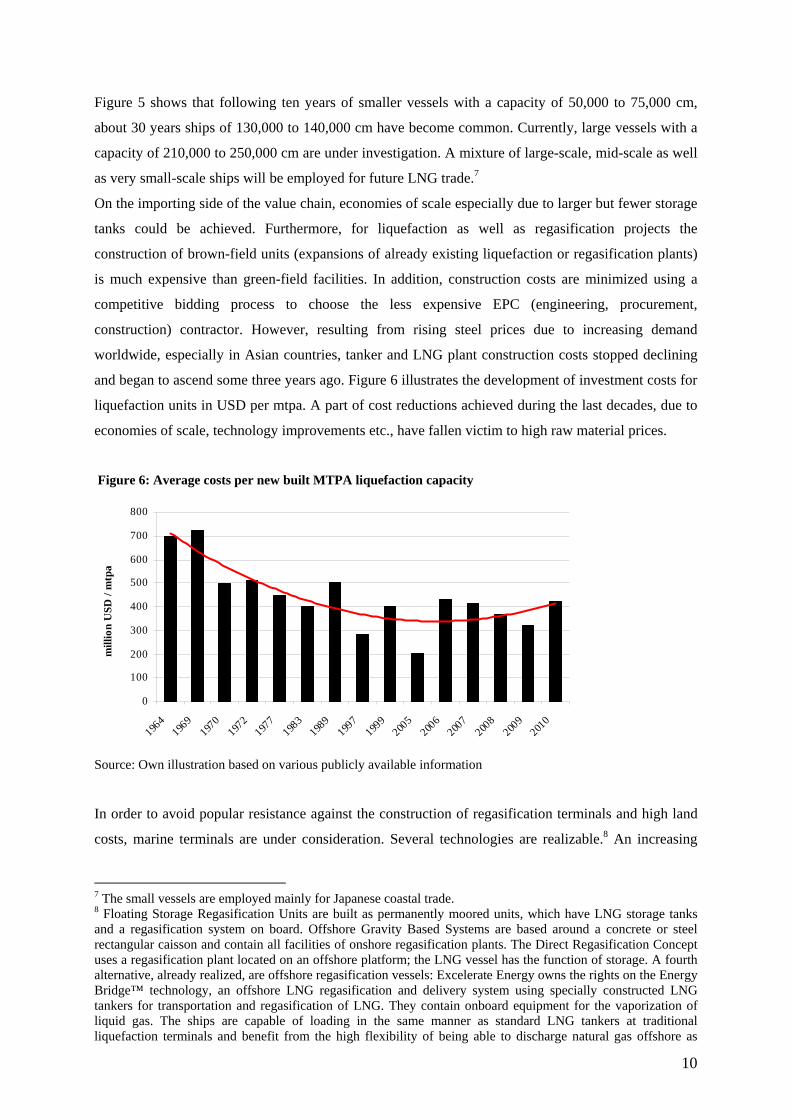
and began to ascend some three years ago. Figure 6 illustrates the development of investment costs for
liquefaction units in USD per mtpa. A part of cost reductions achieved during the last decades, due to
economies of scale, technology improvements etc., have fallen victim to high raw material prices.
Figure 6: Average costs per new built MTPA liquefaction capacity
0
100
200
300
400
500
600
700
800
1964
1969
1970
1972
1977
1983
1989
1997
1999
2005
2006
2007
2008
2009
2010
mill
ion
USD
/ m
tpa
Source: Own illustration based on various publicly available information
In order to avoid popular resistance against the construction of regasification terminals and high land
costs, marine terminals are under consideration. Several technologies are realizable.8 An increasing
7 The small vessels are employed mainly for Japanese coastal trade. 8 Floating Storage Regasification Units are built as permanently moored units, which have LNG storage tanks and a regasification system on board. Offshore Gravity Based Systems are based around a concrete or steel rectangular caisson and contain all facilities of onshore regasification plants. The Direct Regasification Concept uses a regasification plant located on an offshore platform; the LNG vessel has the function of storage. A fourth alternative, already realized, are offshore regasification vessels: Excelerate Energy owns the rights on the Energy Bridge™ technology, an offshore LNG regasification and delivery system using specially constructed LNG tankers for transportation and regasification of LNG. They contain onboard equipment for the vaporization of liquid gas. The ships are capable of loading in the same manner as standard LNG tankers at traditional liquefaction terminals and benefit from the high flexibility of being able to discharge natural gas offshore as
11
development of offshore natural gas fields has also led to a discussion about floating liquefaction
platforms on the upstream side of the value chain. These have the advantage of avoiding long distance
pipelines connecting offshore fields with onshore gas processing and liquefaction plants.9
2.1.3 From infant towards a maturing LNG industry
Since the last decade of the 20th century, substantial structural changes are under way in the LNG
industry. Traded volumes increase rapidly, new players – countries as well as companies – enter the
stage and market conditions are modified due to ongoing liberalization processes. The following
paragraph describes the infant and the currently developing maturity LNG industry. Jensen (2004, p.
49) refers to the “traditional risk-averse, contract dependent model” and the “free market, trading
model”, terms summarizing the characteristics of these two periods very well.
In the old world – or as we call it “infant LNG industry” – three major (liquefied) natural gas trading
regions existed: the market around Canada and the U.S. in North America, deliveries from North
Africa and Russia to Europe, and Pacific Basin trade. Even if trade over longer distances was
technically feasible, sea transport remained expensive and markets therefore regional in nature. The
traditional situation was characterized by inflexible long-term contracts with a duration of about 20 to
25 years. These contracts were rigid sales-and-purchase agreements, typically containing a destination
clause preventing buyers from re-selling imported gas to third parties, high take-or-pay provisions
(around 90% of the contracted volume (IEA, 1998, p. 83)), and price escalating clauses. Sellers had
the guarantee of an efficient use of their capital intensive liquefaction facilities, but flexible deliveries
were hardly possible.10 Ship ownership generally was embedded in these bilateral contracts. Ships
were dedicated to certain routes for the whole contract duration and the LNG typically traded ex ship
(c.i.f. agreements) with the supplier being responsible for transportation. Along these well defined
value chains investments were front-end loaded, revenue generation could not start before every
element was completed.
Since the mid 1990s changes are under way in world natural gas markets, a “maturing LNG industry”
has started to develop. Fostered by increasing natural gas demand, investments in LNG infrastructure
grew rapidly. Exporting and importing countries expanded their capacities; more and more countries
entered the industry.11 As described above, significant cost reductions along the whole value chain
were realized, the distance over which economic deliveries are possible is rising.
vapor, but also onshore as liquid at conventional LNG receiving terminals. The first offshore terminal using this technology, Excelerate’s Gulf Gateway, is operating since March 2005. 9 Shell proposed such a terminal for the Sunrise project in Australia. 10 One exemption realizing a number of flexible cargoes are Pacific Basin exporters; Korea’s Kogas purchased some cargos additional to its existing long-term contracts to cover seasonal peak demand (e.g. from Qatar). 11 Four green-field export projects (22 mtpa) and seven expansions (32.4 mtpa) were realized since 1999, an additional 49 mtpa liquefaction capacity is under construction. Eight green-field regasification projects (30 mtpa) and three expansions (14 mtpa) were realized, an additional 54.4 mtpa are under construction. A large number of LNG projects are proposed. New countries like China are expected to enter the industry.

12
Deregulation of natural gas sectors is a driving factor for changing corporate behavior in the natural
gas business. During the 1980s, the U.S. was the first country which deregulated its natural gas
industry to enhance competition; Canada and the UK followed soon. In these countries, competition is
well advanced. Natural gas spot markets develop; the fuel is traded at several hubs. Europe followed
about 15 years later with the Gas Directive 98/30/EC, repealed in 2003 by 2003/55/EC. As a result of
liberalization, margins of LNG production move downstream (see Ellis et al., 1999, p. 298).
Inflexible contracts can not survive in competitive import markets. Hence, contracts become more
flexible, even if long-term contracts remain part of the risk management in LNG infrastructure
investments. All suppliers to the European Union have to eliminate destination clauses (Jensen, 2004,
p. 22). Contract duration as well as Take-or-Pay-provisions decrease (Neumann and Hirschhausen,
2006). More volumes today are traded free on board, rather than ex ship, to be more flexible in the
choice of the destination country.12 An increasing amount of LNG is traded under short-term contracts
outside the scope of existing long-term contracts. They are particularly important to cover higher
demand of countries with many gas-fired power plants during cold winter months. Spain, the U.S. and
South Korea are main destinations for actual spot deliveries. Spot cargoes in 1992 represented about
1.3% of whole LNG trade, in 2005 spot trade accounted for 11%. Futures trade evolves in competitive
markets (IEA, 1998, p. 28) as part of the risk management. In some cases (e.g. NLNG 4&5/Nigeria;
Qalhat 3/Oman) the construction of LNG plants even starts before all capacity is contracted.
Players active in the LNG industry respond to this changing market environment. Global oil producing
companies heavily engage in production, liquefaction, transport, and also regasification of LNG.
Private oil and gas companies joined the long-established state-owned entities in export projects. In
import markets former (European) monopolists of natural gas are facing their traditional markets at
stake by the intrusion of those oil and gas majors, integrating downstream to benefit from marginal
rents in the natural gas industry. On the other side, traditional downstream players integrate upstream,
control transport capacities and even get access to liquefaction plants and natural gas reserves in order
to minimize risks and secure their supply. Independent power producers investing in gas-fired power
plants evolve becoming potential new buyers of LNG.
Nissen (2004) describes the evolving “commercial LNG model” where players control capacities in all
stages along the value chain, participating in different export projects, owning undedicated transport
capacity and controlling multiple import facility access. Thus, they are able to use these capacities
flexible and benefit from arbitrage. There exists a number of liquefaction plants – so called “tolling
facilities” (e.g. ELNG in Egypt/Idku or SEGAS in Egypt/Damietta) – only selling the service of
liquefaction, storage and loading. In that case natural gas producers rather than export projects become
the seller. On the importing side, the U.S. company Cheniere Energy plans to construct four
regasification plants that sell the service of regasification to LNG importers.
12 Tokyo Gas and Tepco in Japan have renegotiated a Malaysian contract to provide for a portion of the volume to be supplied f.o.b. rather than ex ship.
13
A number of vessels are not dedicated to special routes anymore; different players – for example the
British Gas Group – order own uncommitted ships. At the end of 2005, 27 vessels were operating
without any dedication and nine vessels were ordered by private oil and gas majors (CERA, 2006, p.
2). A second-hand market for vessels has emerged since the 1990s.13
Oil-linkage of natural gas prices is currently heavily debated since oil-linked prices are a poor
indicator of the value of gas in a gas-to-gas competitive market. In Japan for example, during the
1970s, when the first LNG long-term contracts were signed, oil accounted for 73% of power
generation. Therefore, Japanese natural gas prices traditionally are linked to the Japanese Customs
Clearing price (IEEJ, 2005, p. 26). Today, less than 10% of the electricity is generated with oil as fuel.
Therefore, a gas market indicator would be more suitable, like it is in the U.S. for certain contracts the
Henry Hub price. But in many cases oil-price-linkage remains because the contracting parties do not
find any better alternative.
A world market for LNG is developing. The Middle East evolves to a swing producer from where
deliveries to European as well as Asian markets are possible without a significant (transport) cost
difference. Jensen (2003, p. 10) states that “for a business that was for a long time sufficiently
fragmented geographically that the concept of a world gas market was unthinkable, LNG is now
seeing the first elements of interregional gas price competition.” A number of cargoes have already
been re-routed to higher value markets. Inflexible long-term contracts and short-term agreements will
co-exist. Following Jensen (2003, p. 10) it is argued that the “ultimate shape of the LNG system will
be a synthesis of the traditional (thesis) and the new (antithesis).”
2.2 Natural Gas Importing Regions – A Focus on Liquefied Natural Gas
Varying pre-conditions and development of LNG trade in the Atlantic and the Pacific Basins continue
to affect import volumes, pricing systems, and contract terms. This chapter provides an overview on
the three major natural gas importing regions worldwide.
2.2.1 Overview
During the 1980s and early 1990s, in the Atlantic Basin indigenous natural gas supplies and imports
via pipeline were sufficient to cover demand; therefore, LNG capacities grew relatively slowly. Still
today, LNG has to compete with domestic supplies and pipeline imports. In contrast, natural gas
importing countries in the Pacific Basin like Japan, South Korea or Taiwan do not have large (or even
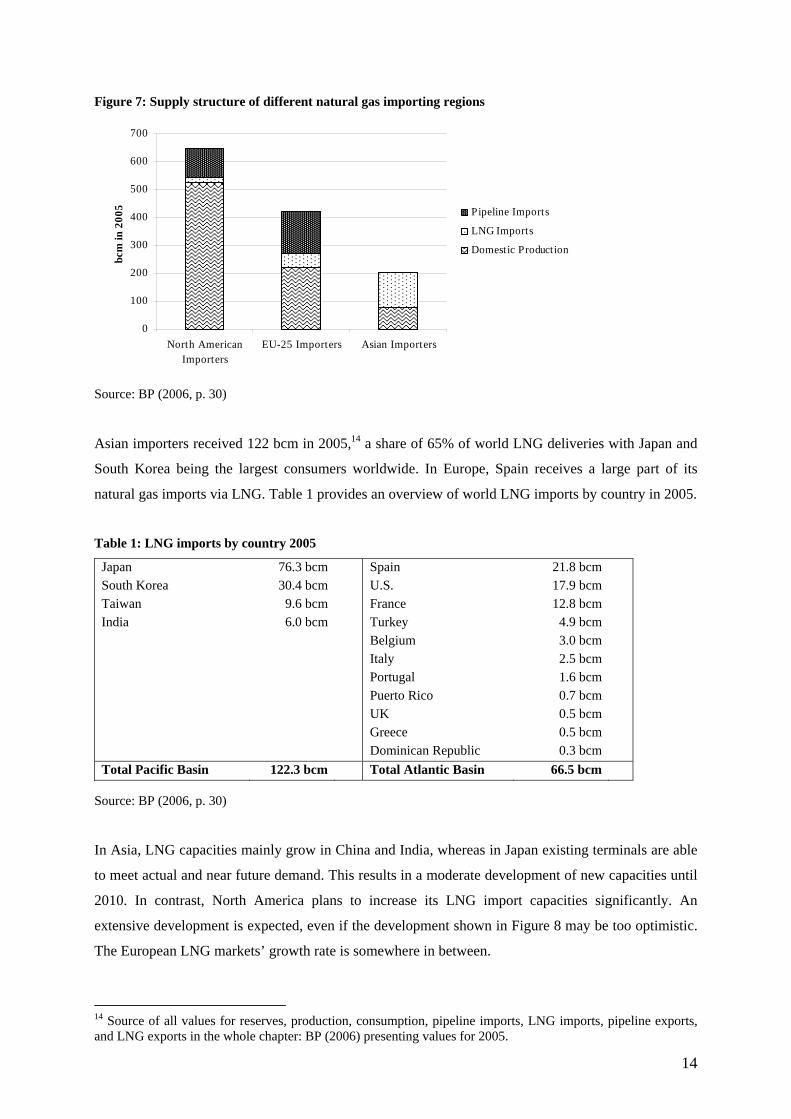
no) domestic supply and no pipeline sources and strongly depend on LNG imports. Figure 7 depicts
structural differences of natural gas supply situations in the three LNG importing regions North
America, Europe and Asia.
13 Vessels have a life time of about 40 years, the typical long-term contract has a duration of about 20 years. Marathon/ConocoPhilipps renegotiated in 1994 the contract between U.S. and Japan. They increased volumes and decided to employ new larger tankers. Hence, both original tankers were idled and purchased by BG.
14
Figure 7: Supply structure of different natural gas importing regions
0
100
200
300
400
500
600
700
North AmericanImporters
EU-25 Importers Asian Importers
bcm
in 2
005 Pipeline Imports
LNG Imports
Domestic Production
Source: BP (2006, p. 30)
Asian importers received 122 bcm in 2005,14 a share of 65% of world LNG deliveries with Japan and
South Korea being the largest consumers worldwide. In Europe, Spain receives a large part of its
natural gas imports via LNG. Table 1 provides an overview of world LNG imports by country in 2005.
Table 1: LNG imports by country 2005
Japan South Korea Taiwan India
76.3 bcm 30.4 bcm
9.6 bcm 6.0 bcm
Spain U.S. France Turkey Belgium Italy Portugal Puerto Rico UK Greece Dominican Republic
21.8 bcm 17.9 bcm 12.8 bcm
4.9 bcm 3.0 bcm 2.5 bcm 1.6 bcm 0.7 bcm 0.5 bcm 0.5 bcm 0.3 bcm
Total Pacific Basin 122.3 bcm Total Atlantic Basin 66.5 bcm Source: BP (2006, p. 30)
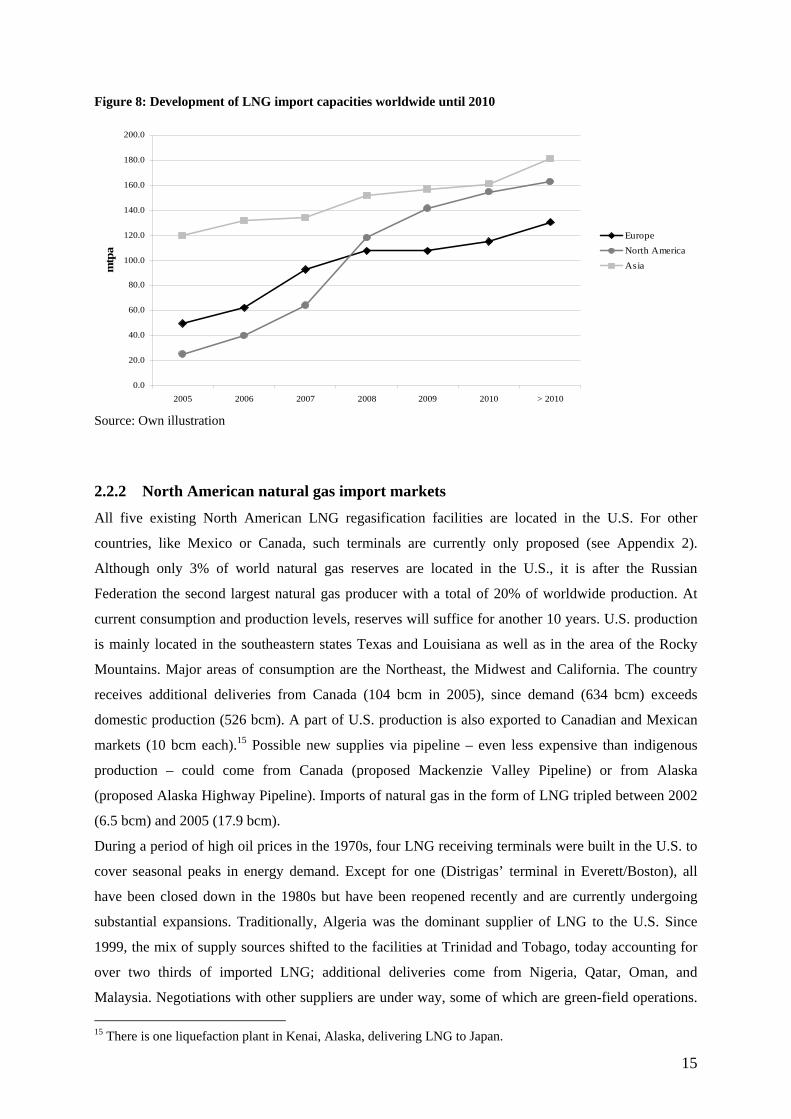
In Asia, LNG capacities mainly grow in China and India, whereas in Japan existing terminals are able
to meet actual and near future demand. This results in a moderate development of new capacities until
2010. In contrast, North America plans to increase its LNG import capacities significantly. An
extensive development is expected, even if the development shown in Figure 8 may be too optimistic.
The European LNG markets’ growth rate is somewhere in between.
14 Source of all values for reserves, production, consumption, pipeline imports, LNG imports, pipeline exports, and LNG exports in the whole chapter: BP (2006) presenting values for 2005.
15
Figure 8: Development of LNG import capacities worldwide until 2010
0.0
20.0
40.0
60.0
80.0
100.0
120.0
140.0
160.0
180.0
200.0
2005 2006 2007 2008 2009 2010 > 2010
mtp
a
EuropeNorth AmericaAsia
Source: Own illustration
2.2.2 North American natural gas import markets
All five existing North American LNG regasification facilities are located in the U.S. For other
countries, like Mexico or Canada, such terminals are currently only proposed (see Appendix 2).
Although only 3% of world natural gas reserves are located in the U.S., it is after the Russian
Federation the second largest natural gas producer with a total of 20% of worldwide production. At
current consumption and production levels, reserves will suffice for another 10 years. U.S. production
is mainly located in the southeastern states Texas and Louisiana as well as in the area of the Rocky
Mountains. Major areas of consumption are the Northeast, the Midwest and California. The country
receives additional deliveries from Canada (104 bcm in 2005), since demand (634 bcm) exceeds
domestic production (526 bcm). A part of U.S. production is also exported to Canadian and Mexican
markets (10 bcm each).15 Possible new supplies via pipeline – even less expensive than indigenous
production – could come from Canada (proposed Mackenzie Valley Pipeline) or from Alaska
(proposed Alaska Highway Pipeline). Imports of natural gas in the form of LNG tripled between 2002
(6.5 bcm) and 2005 (17.9 bcm).
During a period of high oil prices in the 1970s, four LNG receiving terminals were built in the U.S. to
cover seasonal peaks in energy demand. Except for one (Distrigas’ terminal in Everett/Boston), all
have been closed down in the 1980s but have been reopened recently and are currently undergoing
substantial expansions. Traditionally, Algeria was the dominant supplier of LNG to the U.S. Since
1999, the mix of supply sources shifted to the facilities at Trinidad and Tobago, today accounting for
over two thirds of imported LNG; additional deliveries come from Nigeria, Qatar, Oman, and
Malaysia. Negotiations with other suppliers are under way, some of which are green-field operations. 15 There is one liquefaction plant in Kenai, Alaska, delivering LNG to Japan.
16
LNG imports have risen steadily even though capacity utilization with 55% is still modest (Simmons
et al., 2005, p. 21). There is a general consensus that LNG imports will continue to increase. Domestic
production as well as imports from other sources (e.g. Canadian pipeline gas) are declining. The first
newly build terminal started operation in 2005 with the delivery of a first cargo from Malaysia.
Excelerate’s “Gulf Gateway Energy Bridge” is located about 116 miles offshore the Louisiana coast.16
Natural gas is transported via the Sea Robin Pipe and the Blue Water Pipe and comes ashore on the
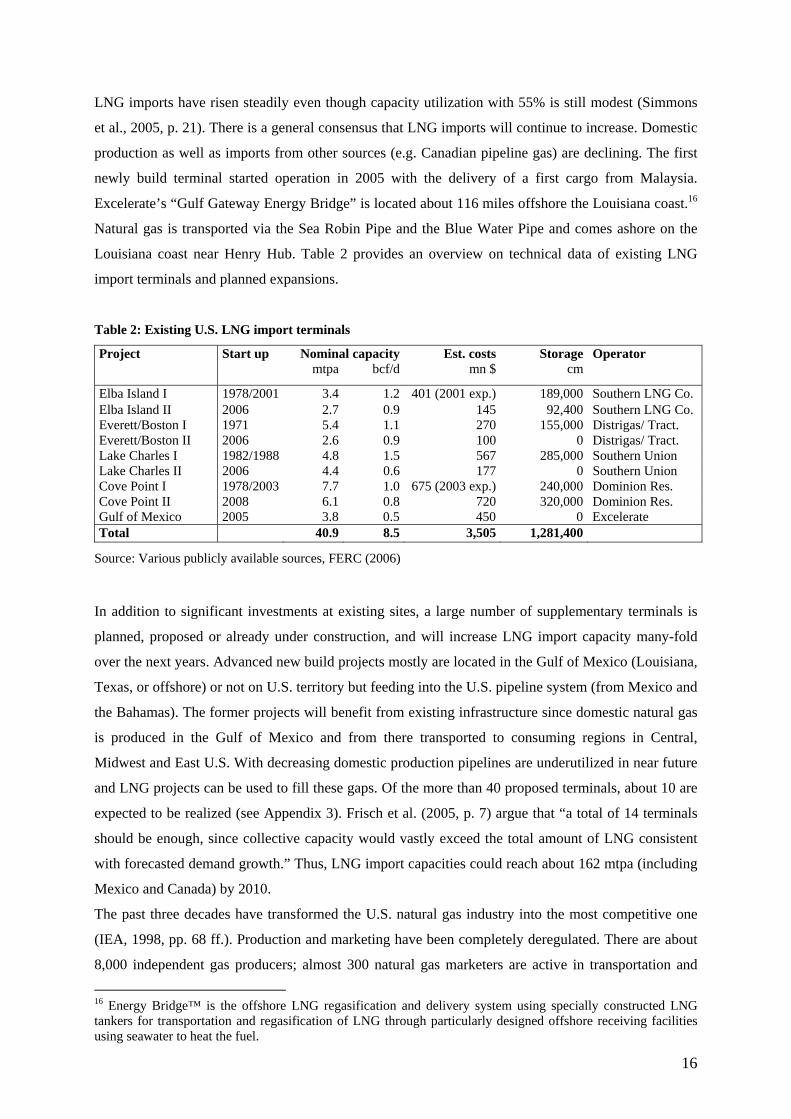
Louisiana coast near Henry Hub. Table 2 provides an overview on technical data of existing LNG
import terminals and planned expansions.
Table 2: Existing U.S. LNG import terminals
Project Start up Nominal capacity Est. costs Storage Operator mtpa bcf/d mn $ cm
Elba Island I 1978/2001 3.4 1.2 401 (2001 exp.) 189,000 Southern LNG Co. Elba Island II 2006 2.7 0.9 145 92,400 Southern LNG Co. Everett/Boston I 1971 5.4 1.1 270 155,000 Distrigas/ Tract. Everett/Boston II 2006 2.6 0.9 100 0 Distrigas/ Tract. Lake Charles I 1982/1988 4.8 1.5 567 285,000 Southern Union Lake Charles II 2006 4.4 0.6 177 0 Southern Union Cove Point I 1978/2003 7.7 1.0 675 (2003 exp.) 240,000 Dominion Res. Cove Point II 2008 6.1 0.8 720 320,000 Dominion Res. Gulf of Mexico 2005 3.8 0.5 450 0 Excelerate Total 40.9 8.5 3,505 1,281,400
Source: Various publicly available sources, FERC (2006) In addition to significant investments at existing sites, a large number of supplementary terminals is
planned, proposed or already under construction, and will increase LNG import capacity many-fold
over the next years. Advanced new build projects mostly are located in the Gulf of Mexico (Louisiana,
Texas, or offshore) or not on U.S. territory but feeding into the U.S. pipeline system (from Mexico and
the Bahamas). The former projects will benefit from existing infrastructure since domestic natural gas
is produced in the Gulf of Mexico and from there transported to consuming regions in Central,
Midwest and East U.S. With decreasing domestic production pipelines are underutilized in near future
and LNG projects can be used to fill these gaps. Of the more than 40 proposed terminals, about 10 are
expected to be realized (see Appendix 3). Frisch et al. (2005, p. 7) argue that “a total of 14 terminals
should be enough, since collective capacity would vastly exceed the total amount of LNG consistent
with forecasted demand growth.” Thus, LNG import capacities could reach about 162 mtpa (including
Mexico and Canada) by 2010.
The past three decades have transformed the U.S. natural gas industry into the most competitive one
(IEA, 1998, pp. 68 ff.). Production and marketing have been completely deregulated. There are about
8,000 independent gas producers; almost 300 natural gas marketers are active in transportation and
16 Energy Bridge™ is the offshore LNG regasification and delivery system using specially constructed LNG tankers for transportation and regasification of LNG through particularly designed offshore receiving facilities using seawater to heat the fuel.
17
sales. Significant restructuring of the industry started in the 1970s, with the Natural Gas Policy Act
removing wellhead ceiling prices in 1978. Based on a number of FERC Orders transportation and
asset services were unbundled and open access was introduced.17 Traditionally, LNG terminals were
considered to be part of the transportation system, and thus subject to an open-access service under
Section 7c of the Natural Gas Act. Since the “Hackberry Decision” in 2002 LNG import facilities are
treated as “supply sources” rather than part of the transportation grid, open access no longer has to be
provided.
2.2.3 European natural gas import markets
European countries18 control only about three percent of world natural gas reserves. Consumption with
423 bcm (in 2005) exceeds own production (206 bcm) more than twice. Hence, import dependency is
very strong and is expected to increase further due to increasing primary energy demand,
environmental concerns and growing power production based on natural gas as fuel (IEA, 2006).
The network of high-pressure interstate pipelines carries gas from supply areas, situated mainly in the
North Sea, Eurasia, and North Africa. Main foreign deliveries come from Russia (151.3 bcm in 2005),
Algeria (38.1 bcm), Libya (4.5 bcm) and Iran (4.3 bcm). Indigenous production takes place in Norway
(79.5 bcm), the Netherlands (46.8 bcm), and the UK (9.7 bcm), with the last slowly developing from a
net exporter to a net importer as declining reserves face increasing demand since 2000. Domestic
production covers a part of demand in Austria, Belgium, Denmark, France, and Germany. Different
major interstate pipeline projects have been completed during the last decade.19 A certain number of
projects are proposed (see Appendix 5). These would enable further supplies from producing regions
for example in Norway (Orman Lange to UK), Russia (NEGP to Germany) or Turkey (Nabucco to
Austria). The degree of sponsors’ diversity increases, incumbent transmission system operators are
accompanied by international oil and gas majors, private gas producers as well as power companies.
Liquefied natural gas plays an important role to meet European energy demand. In 2005, nearly 12%
of the natural gas coming from foreign producers was imported in the form of LNG. Today, 12 LNG
regasification facilities with a total nominal capacity of about 50 mtpa are operational and able to send
69.3 billion cubic meters per year (bcm/a) of natural gas into national pipeline grids. Europe receives
LNG imports from Algeria (with deliveries of 6.6 bcm in 2004), Nigeria (4.8 bcm), and Qatar (3.9
bcm), followed by the states of Oman, Libya, the United Arab Emirate and Malaysia. Future supplies
will also include deliveries from Egypt (to France and Italy) and other exporting countries in the
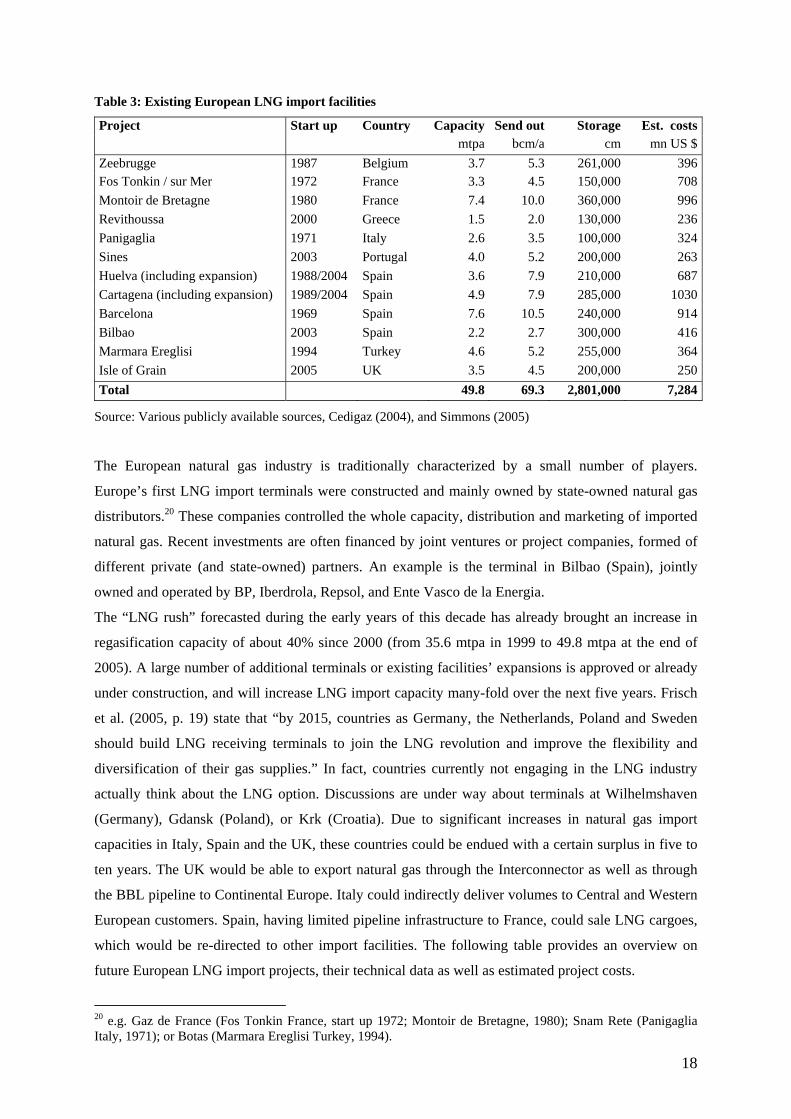
Atlantic Basin and the region of the Middle East. The following table provides an overview on
existing terminals, corresponding technical data, and estimated project costs.
17 Order 380 (1984), Order 436 (1985), Order 636 (1992), Order 637 (2000) 18 Europe refers to the EU-25. 19 E.g. the Interconnector (UK/Belgium), the BBL Pipeline (Netherlands/UK), the Greenstream (Libya/Italy) or the Euskadour Natural Gas Pipeline (Spain to France).
18
Table 3: Existing European LNG import facilities
Project Start up Country Capacity Send out Storage Est. costs mtpa bcm/a cm mn US $Zeebrugge 1987 Belgium 3.7 5.3 261,000 396Fos Tonkin / sur Mer 1972 France 3.3 4.5 150,000 708Montoir de Bretagne 1980 France 7.4 10.0 360,000 996Revithoussa 2000 Greece 1.5 2.0 130,000 236Panigaglia 1971 Italy 2.6 3.5 100,000 324Sines 2003 Portugal 4.0 5.2 200,000 263Huelva (including expansion) 1988/2004 Spain 3.6 7.9 210,000 687Cartagena (including expansion) 1989/2004 Spain 4.9 7.9 285,000 1030Barcelona 1969 Spain 7.6 10.5 240,000 914Bilbao 2003 Spain 2.2 2.7 300,000 416Marmara Ereglisi 1994 Turkey 4.6 5.2 255,000 364Isle of Grain 2005 UK 3.5 4.5 200,000 250Total 49.8 69.3 2,801,000 7,284
Source: Various publicly available sources, Cedigaz (2004), and Simmons (2005)
The European natural gas industry is traditionally characterized by a small number of players.
Europe’s first LNG import terminals were constructed and mainly owned by state-owned natural gas
distributors.20 These companies controlled the whole capacity, distribution and marketing of imported
natural gas. Recent investments are often financed by joint ventures or project companies, formed of
different private (and state-owned) partners. An example is the terminal in Bilbao (Spain), jointly
owned and operated by BP, Iberdrola, Repsol, and Ente Vasco de la Energia.
The “LNG rush” forecasted during the early years of this decade has already brought an increase in
regasification capacity of about 40% since 2000 (from 35.6 mtpa in 1999 to 49.8 mtpa at the end of
2005). A large number of additional terminals or existing facilities’ expansions is approved or already
under construction, and will increase LNG import capacity many-fold over the next five years. Frisch
et al. (2005, p. 19) state that “by 2015, countries as Germany, the Netherlands, Poland and Sweden
should build LNG receiving terminals to join the LNG revolution and improve the flexibility and
diversification of their gas supplies.” In fact, countries currently not engaging in the LNG industry
actually think about the LNG option. Discussions are under way about terminals at Wilhelmshaven
(Germany), Gdansk (Poland), or Krk (Croatia). Due to significant increases in natural gas import
capacities in Italy, Spain and the UK, these countries could be endued with a certain surplus in five to
ten years. The UK would be able to export natural gas through the Interconnector as well as through
the BBL pipeline to Continental Europe. Italy could indirectly deliver volumes to Central and Western
European customers. Spain, having limited pipeline infrastructure to France, could sale LNG cargoes,
which would be re-directed to other import facilities. The following table provides an overview on
future European LNG import projects, their technical data as well as estimated project costs.
20 e.g. Gaz de France (Fos Tonkin France, start up 1972; Montoir de Bretagne, 1980); Snam Rete (Panigaglia Italy, 1971); or Botas (Marmara Ereglisi Turkey, 1994).
19
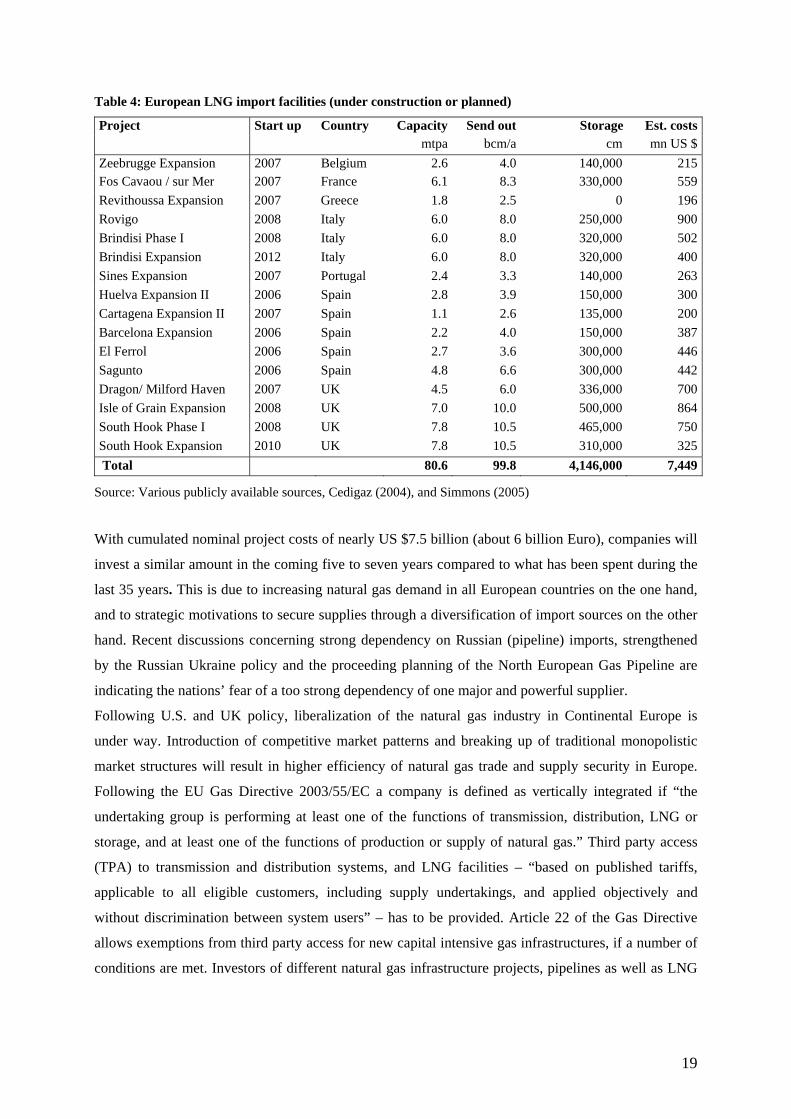
Table 4: European LNG import facilities (under construction or planned)
Project Start up Country Capacity Send out Storage Est. costs mtpa bcm/a cm mn US $Zeebrugge Expansion 2007 Belgium 2.6 4.0 140,000 215Fos Cavaou / sur Mer 2007 France 6.1 8.3 330,000 559Revithoussa Expansion 2007 Greece 1.8 2.5 0 196Rovigo 2008 Italy 6.0 8.0 250,000 900Brindisi Phase I 2008 Italy 6.0 8.0 320,000 502Brindisi Expansion 2012 Italy 6.0 8.0 320,000 400Sines Expansion 2007 Portugal 2.4 3.3 140,000 263Huelva Expansion II 2006 Spain 2.8 3.9 150,000 300Cartagena Expansion II 2007 Spain 1.1 2.6 135,000 200Barcelona Expansion 2006 Spain 2.2 4.0 150,000 387El Ferrol 2006 Spain 2.7 3.6 300,000 446Sagunto 2006 Spain 4.8 6.6 300,000 442Dragon/ Milford Haven 2007 UK 4.5 6.0 336,000 700Isle of Grain Expansion 2008 UK 7.0 10.0 500,000 864South Hook Phase I 2008 UK 7.8 10.5 465,000 750South Hook Expansion 2010 UK 7.8 10.5 310,000 325 Total 80.6 99.8 4,146,000 7,449
Source: Various publicly available sources, Cedigaz (2004), and Simmons (2005)
With cumulated nominal project costs of nearly US $7.5 billion (about 6 billion Euro), companies will
invest a similar amount in the coming five to seven years compared to what has been spent during the
last 35 years. This is due to increasing natural gas demand in all European countries on the one hand,
and to strategic motivations to secure supplies through a diversification of import sources on the other
hand. Recent discussions concerning strong dependency on Russian (pipeline) imports, strengthened
by the Russian Ukraine policy and the proceeding planning of the North European Gas Pipeline are
indicating the nations’ fear of a too strong dependency of one major and powerful supplier.
Following U.S. and UK policy, liberalization of the natural gas industry in Continental Europe is
under way. Introduction of competitive market patterns and breaking up of traditional monopolistic
market structures will result in higher efficiency of natural gas trade and supply security in Europe.
Following the EU Gas Directive 2003/55/EC a company is defined as vertically integrated if “the
undertaking group is performing at least one of the functions of transmission, distribution, LNG or
storage, and at least one of the functions of production or supply of natural gas.” Third party access
(TPA) to transmission and distribution systems, and LNG facilities – “based on published tariffs,
applicable to all eligible customers, including supply undertakings, and applied objectively and
without discrimination between system users” – has to be provided. Article 22 of the Gas Directive
allows exemptions from third party access for new capital intensive gas infrastructures, if a number of
conditions are met. Investors of different natural gas infrastructure projects, pipelines as well as LNG

20
import facilities, have extensively made use of this article.21 National regulatory authorities decide
upon regulation methods applied to transmission, distribution, third-party access, and LNG facilities
resulting in varying regulatory regimes between countries.22 Former European monopolists, active in
pipeline operation as well as distribution and marketing of natural gas, have formed independent
transport utilities to meet the obligations resulting from the EU Gas Directive 2003/55/EC and
implemented national laws. Unbundling of competitive and monopolistic elements of the value-added
chain has been realized. However, there are mainly incumbents participating in the industry. Appendix
7 provides an overview on main owners and operators of European national transmission pipelines.
2.2.4 Asian natural gas import markets
The major form of primary energy used in Asian countries is coal, especially in China and India,
which are strongly dependent on domestic cheap coal for power production. Even though the share of
coal in the energy mix of China decreased since the mid 1990s, nominal values are expected to
continue to rise. Increasing the diversification of energy sources as well as diminishing green-house
gas emissions to meet Kyoto protocol obligations are main drivers for an increase of natural gas’ share
in the energy mix. During the 1980s, Asian economies grew rapidly. The currency crisis, starting 1997
in Thailand, determined a temporary stagnation in economic growth resulting also in decreasing
energy consumption. However, the countries picked up very quickly and today are the regions which
show the highest growth rates in primary energy as well as natural gas demand. Currently, a
liberalization process of natural gas and electric power industries is introduced in Japan, South Korea
and Taiwan. Trading environment changes substantially.
Main natural gas importing countries in the Asia-Pacific region are Japan, South Korea, and India.
China and the Philippines are likely to follow soon. Only 1.7% of worldwide reserves are located
within China and India, whereas other countries house none at all. The gap between domestic
production of 80 bcm and consumption of 190 bcm in 2005 reveals the strong import dependency of
the whole region. A characteristic issue influencing natural gas supply policy is that until today, no
major foreign source is connected with these countries via pipeline. A summary of existing and
proposed interstate pipelines can be found in Appendix 8. In the next decade, pipeline deliveries could
come from Russia. Discussions are under way to connect Japan, China, and South Korea with the
Sakhalin fields and Eastern Siberia.23 Today, imports are delivered in the form of LNG from Australia,
Indonesia, Malaysia and the area of the Middle East. From these terminals pipelines deliver regasified
natural gas to power plants, industrial users and main consuming regions which are mainly situated in 21 E.g. the BBL Interconnector between Balgzand (Netherlands) and Bacton (UK), Isle of Grain LNG terminal (UK), Milford Haven LNG terminals (UK), Rovigo LNG terminal (Italy), Brindisi LNG terminal (Italy). 22 We find standard regulated TPA (e.g. Spain), regulated TPA with an enhanced rate of return to compensate for higher risks (e.g. Belgium), specific TPA (e.g. Italy), or exemptions based on Article 22 (see Appendix 6). 23 China has an agreement with Russia to proceed with natural gas development in East Siberia; the supplier wants Japan and South Korea to be involved to reduce project risk. Concerning Sakhalin 1, the Russian oil and gas project which is strongly supported by the Japanese government, Japanese utilities decided in 2002 to realize the Sakhalin 2 LNG project and to postpone the potential pipeline to the post 2010 period.
21
coastal areas. No long pipeline connections have to be built, hence, the natural gas system is more a
collection of smaller “islands” of consumption than a real network.
Japan receives more than 40 percent of worldwide LNG deliveries (76.3 bcm in 2005) and thus forms
the largest importing country. It started LNG imports with its first terminal Negishi in 1969 receiving
deliveries from Alaska. Today, 23 terminals are operating with a total capacity of 77 mtpa. Three new
plants are planned. Since the early 1990s, Japan’s energy policy follows the “3Es”: “economic
efficiency”, “environmental protection”, and “energy security” (see IEEJ, 2004, p. 1). The ongoing
liberalization process, based on the Gas and Electric Utility Laws (introduced in 1995, further
amended in 1999/2000) encourages significant market changes. City-gas companies launch into
supply to large consumers; foreign firms, traders and large industrial users move towards electricity
retailing; natural gas distributors start activities in power production (Tokyo Gas, Osaka Gas); power
producers in gas sales (e.g. Tohoku Electric Power or Kansai Electric Power).
South Korea joined the industry in 1986 with currently four operating terminals (in total 30 mtpa) and
today representing the second largest LNG importer (30.4 bcm in 2004). Regasified LNG today is
delivered not only to industrial but also to private end-consumers. Gas-fired power plants are used to
cover seasonal peaks in cold winter periods; hence, natural gas demand is highly volatile. Deliveries
under short-term agreements as well as spot cargoes therefore play an important role. The government
plans to unbundle both state-owned monopolies Kepco (electricity generation) and Kogas (natural gas
wholesaler), to privatize certain assets like a number of power plants, and to introduce open access to
pipelines as well as LNG terminals.
Potential suppliers to India, already importing LNG, and China, entering soon, are concerned about the
countries’ ability to pay for LNG in hard currency. The economic level of these countries is much
lower than those of Japan, South Korea, and Taiwan when entering LNG business.24 India plans about
10 new LNG facilities, mainly in combination with power production, situated at the West coast since
electricity generation in the East is based on cheap domestic coal. Currently subsidized electricity
tariffs may lead to a situation in which customers are unable to pay the price for purchased quantities.
China is constructing a terminal at Guangdong, which is expected to come on stream in 2006. Three
additional facilities are proposed. An interesting issue is that the supply contract has another structure
than traditional Asian contracts. Oil linkage has been reduced from 85 to only 30%; hence, decreasing
price volatility is expected. Natural gas is mainly used for power production and industrial consumers.
The Chinese Petroleum Corporation is furthermore responsible for LNG imports and wholesale natural
gas supplies in Taiwan. Taipower, the state-owned power producer, is the major LNG customer.
Asian LNG prices are less competitive than European since Asia strongly depends on deliveries in the
form of LNG and importers are willing to pay the “Asian Risk Premium” (IEEJ, 2004, p. 3) of about
US 1$/MBtu. Japanese contracts are linked to crude oil prices (Japanese Customs Clearing price).
24 GDP per capita China and India (in 1990 price): < $1,000 whereas for existing Asian importers: $3,000-10,000
22
India has fixed prices without any linkage to other fuels, which are subsidized by the state. For LNG
import prices see Appendix 9.
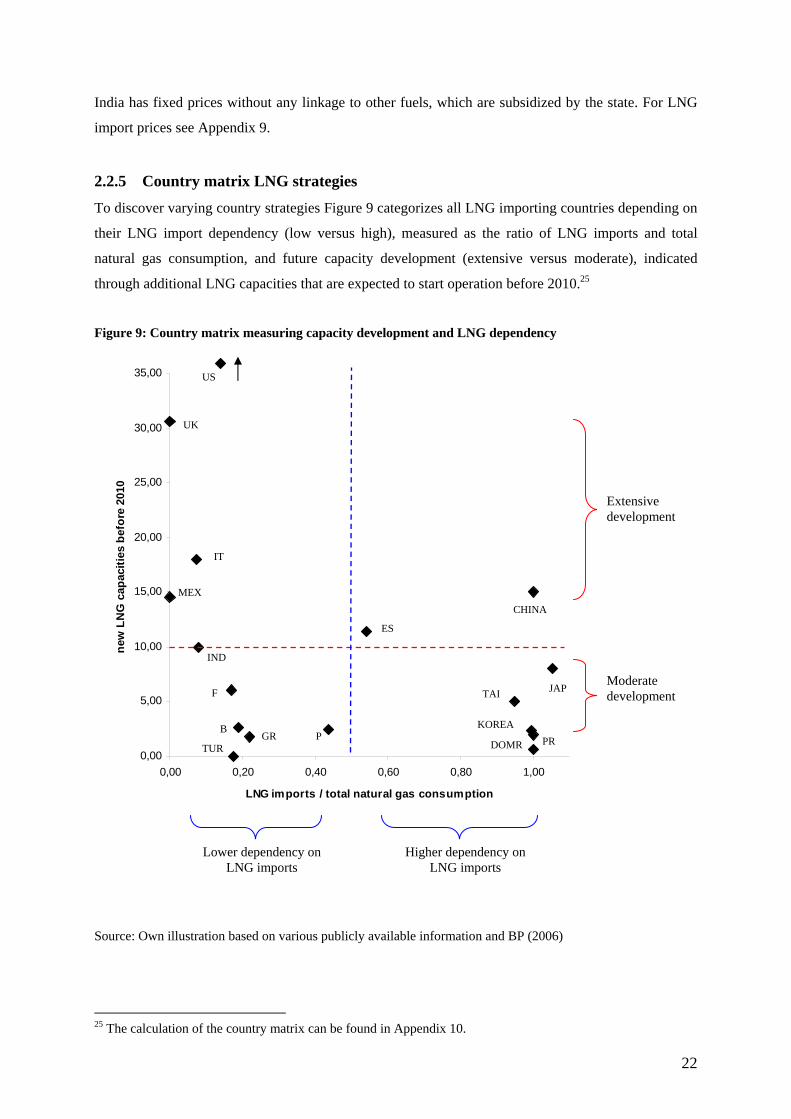
2.2.5 Country matrix LNG strategies
To discover varying country strategies Figure 9 categorizes all LNG importing countries depending on
their LNG import dependency (low versus high), measured as the ratio of LNG imports and total
natural gas consumption, and future capacity development (extensive versus moderate), indicated
through additional LNG capacities that are expected to start operation before 2010.25
Figure 9: Country matrix measuring capacity development and LNG dependency
0,00
5,00
10,00
15,00
20,00
25,00
30,00
35,00
0,00 0,20 0,40 0,60 0,80 1,00
LNG imports / total natural gas consumption
new
LN
G c
apac
ities
bef
ore
2010
Source: Own illustration based on various publicly available information and BP (2006)
25 The calculation of the country matrix can be found in Appendix 10.
Extensive development
Moderate development
Lower dependency on LNG imports
Higher dependency on LNG imports
B
F
GR
IT
P
ES
TUR
UK
PR
MEX
US
CHINA
IND
JAP
KOREA
DOMR
TAI

23
Table 5: Interpretation of the country matrix
Lower dependency on LNG import Higher dependency on LNG imports
Extensive capacity development
Italy, UK, U.S., Mexico
Diversification of supply sources
Domestic production may decline (especially UK, U.S.)
Exports of the imported LNG planned, function of transit countries (except U.S.)
Spain, China
High potential
Dependency will continue to increase, if suppliers remain the same, but it can be expected that the (natural) LNG dependency will be met with diversifica-tion of supply sources.
Moderate capacity development
Belgium, France, Greece, Portugal, Turkey, India
Saturated market or potential not recognized
This category also includes countries like Germany, Poland or Croatia discussing potential LNG receiving terminals
Puerto Rico, Dominican Republic, Japan, Taiwan, South Korea
Saturated market
Increase in LNG capacities only to an extent to meet demand increase
Source: Own illustration
Four country types can be distinguished following a categorization on LNG dependency and future
capacity development.
• Firstly, there are countries (like Italy, UK, or the U.S.) that have access to pipeline natural gas
and/or domestic production. Hence, LNG import dependency is relatively low. Although, they
plan huge investments in additional regasification capacities. Such a strategy can have
different motivations. Through a policy of diversification, energy supply security is increased.
Furthermore, different countries’ natural gas production declines (e.g. UK). To cover demand,
new supplies are necessary. Some of those countries also plan exports of surplus volumes to
third countries. An example is Italy, which may serve as a transit country to mid- and western
European consuming regions.
• Secondly, there are countries that have diversified natural gas supply sources but do not plan
to invest in significant additional capacity (e.g. Belgium, France). Markets may be saturated.
Besides, a functioning interstate trade of natural gas can substitute own LNG import terminals,
countries may benefit from capacity increases and a diversification of supply sources in
neighboring areas. All countries not involved in the LNG business yet (like Germany or
Poland) do also fall under this category.
• Thirdly, different countries being strongly dependent on LNG imports do not plan to invest in
a large number of new plants (e.g. Japan). The LNG industry is well developed; natural gas is
often employed as fuel for power generation. Existing regasification plants are able to meet
actual demand. Expansions only serve to meet natural demand increase.
• And finally, different countries, strongly dependent on LNG imports and heavily investing in
LNG infrastructure (e.g. China) with a high future potential can be identified. They do not
24
have access to major natural gas resources via pipeline and only limited domestic production.
Significant expansions in LNG import capacities are mainly required to meet increasing
demand (above world average). Natural gas serves mainly as fuel for power production.
2.3 Changing Corporate Strategies – Integrated Companies, Tollers, and New
Entrants
In times of a changing institutional environment in the natural gas sector and a rapidly increasing
industry, one observes global players active in the LNG industry following a strategy of vertical
integration along the whole value chain. In fact, this is only one part of the observed development,
whereas another part is the emergence of new non-integrated players in North American markets. In
Japan, power producers enter the LNG industry to secure their supply. Jensen (2003, p. 36) states that
“the synthesis of traditional LNG practices and a theoretical competitive market may well not yield in
the same industry structure in all regions, nor is it likely to produce one corporate model that can be
successful for all companies.” The following paragraph describes different corporate strategies and
presents case studies of (non-) integrated companies and new entrants.
2.3.1 Vertically integrated companies
Traditional long-term contracts did not require vertical integration in the sense of capacity ownership.
However, with ongoing liberalization and increasing demand worldwide global oil producing
companies heavily engage in production, liquefaction, transport, and also downstream regasification
and marketing of LNG. Private oil and gas companies join long-established state-owned entities in
exporting countries securing low cost sources and connecting the fuel to high value markets,
integrating downstream to benefit from marginal rents in the natural gas industry. In contrast,
traditional downstream players integrate upstream, control transport capacities and secure access to
liquefaction plants and reserves, to ensure supplies in times of a developing competition between
importing regions. Global super majors diversify their portfolios by integrating along the whole value
chain and into export and import regions worldwide. In general, smaller companies are active more
regionally (e.g. Union Fenosa mainly in the Mediterranean area). Integrated players consider LNG
terminals as part of the value added chain, and therefore do not have high incentives in renting out
spare capacity to potential competitors. Examples of companies integrating vertically are the British
Gas Group or BP from the upstream side, and Gaz de France or the SUEZ Group from the
downstream side. Table 6 shows activities of integrated global players in the LNG business.
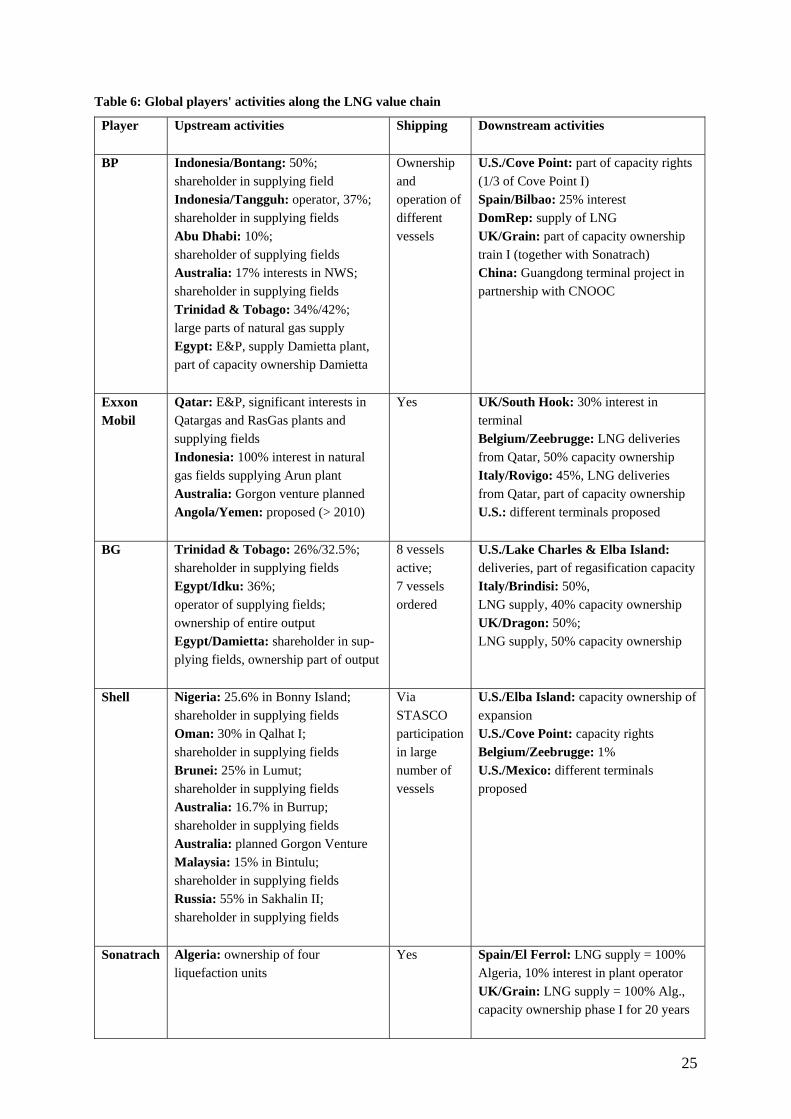
25
Table 6: Global players' activities along the LNG value chain
Player Upstream activities
Shipping Downstream activities
BP
Indonesia/Bontang: 50%; shareholder in supplying field Indonesia/Tangguh: operator, 37%; shareholder in supplying fields Abu Dhabi: 10%; shareholder of supplying fields Australia: 17% interests in NWS; shareholder in supplying fields Trinidad & Tobago: 34%/42%; large parts of natural gas supply Egypt: E&P, supply Damietta plant, part of capacity ownership Damietta
Ownership and operation of different vessels
U.S./Cove Point: part of capacity rights (1/3 of Cove Point I) Spain/Bilbao: 25% interest DomRep: supply of LNG UK/Grain: part of capacity ownership train I (together with Sonatrach) China: Guangdong terminal project in partnership with CNOOC
Exxon Mobil
Qatar: E&P, significant interests in Qatargas and RasGas plants and supplying fields Indonesia: 100% interest in natural gas fields supplying Arun plant Australia: Gorgon venture planned Angola/Yemen: proposed (> 2010)
Yes UK/South Hook: 30% interest in terminal Belgium/Zeebrugge: LNG deliveries from Qatar, 50% capacity ownership Italy/Rovigo: 45%, LNG deliveries from Qatar, part of capacity ownership U.S.: different terminals proposed
BG
Trinidad & Tobago: 26%/32.5%; shareholder in supplying fields Egypt/Idku: 36%; operator of supplying fields; ownership of entire output Egypt/Damietta: shareholder in sup-plying fields, ownership part of output
8 vessels active; 7 vessels ordered
U.S./Lake Charles & Elba Island: deliveries, part of regasification capacity Italy/Brindisi: 50%, LNG supply, 40% capacity ownership UK/Dragon: 50%; LNG supply, 50% capacity ownership
Shell Nigeria: 25.6% in Bonny Island; shareholder in supplying fields Oman: 30% in Qalhat I; shareholder in supplying fields Brunei: 25% in Lumut; shareholder in supplying fields Australia: 16.7% in Burrup; shareholder in supplying fields Australia: planned Gorgon Venture Malaysia: 15% in Bintulu; shareholder in supplying fields Russia: 55% in Sakhalin II; shareholder in supplying fields
Via STASCO participation in large number of vessels
U.S./Elba Island: capacity ownership of expansion U.S./Cove Point: capacity rights Belgium/Zeebrugge: 1% U.S./Mexico: different terminals proposed
Sonatrach
Algeria: ownership of four liquefaction units
Yes Spain/El Ferrol: LNG supply = 100% Algeria, 10% interest in plant operator UK/Grain: LNG supply = 100% Alg., capacity ownership phase I for 20 years

26
Chevron Texaco
Australia: 16.7% in NWS; shareholder in supplying fields Australia: participation in planned Gorgon Venture Angola/Nigeria/Venezuela: proposed plants
Yes U.S.: different terminals proposed Mexico: terminal proposed
Gaz de France
Egypt/Idku: E&P, 5% interest in liquefaction train I, ownership of the entire output of train I Norway/Snovhit: 12%; shareholder in supplying fields
Yes France/Fos sur Mer: operator, 100% capacity ownership France/Montoir: operator, 100% capacity ownership France/Fos Cavaou: operator, 66.7% capacity ownership India: 10% interest in Petronet LNG
ENI
Egypt/Damietta: E&P, 40% interest in liquefaction plant Nigeria/Bonny Island: E&P, gas supply, 10.4% interest (through Agip), part of capacity ownership
No Italy/Panigaglia: most of capacity Portugal/Sines: 33.34% interest Spain: 50% interest in Union Fenosa Gas Group, 21.0% interest in El Ferrol terminal, 42.5% interest in Sagunto terminal
Union Fenosa
Egypt/Damietta: 40% ownership of facility, part of capactiy ownership Oman/Qalhat II: 8% shareholder
Yes Spain/Sagunto: 42.5% interest, gas to power plants planned by Union Fenosa Spain/El Ferrol: 21% interest in operator, part of gas to own power plants
SUEZ Trinidad: 10% in train I and IV
Yes Belgium: 99% in Zeebrugge terminal U.S./Everett: ownership and operation Bahamas: plant proposed Mexico: plant proposed
Repsol YPF
Trinidad: 20%/25% in Point Fortin Iran/Libya/Bolivia: proposed plants
Yes
Spain/Bilbao: 25% interest U.S.: LNG supply
Source: Various publicly available sources
Vertical integration does not stop at the stage of marketing and sales of natural gas. In Spain for
example, there are different projects (e.g. Barcelona or Bilbao), where companies owning the
regasification facility are also operating a nearby gas-fired power plant fed with natural gas imported
through the LNG terminal. In Japan, different power producers like Tokyo Electric operate LNG
import terminals to secure their supply. LNG plants in Puerto Rico and the Dominican Republic have
been constructed at the same time as related power plants. Hence, the phenomenon of vertical
integration stepping into the electricity generation sector becomes more and more common. For this
analysis the value chain is limited to the five stages described above, further activities of players are
eliminated and remain subject to potential further research.
27
2.3.2 Non-integrated companies
A number of (new) players in the industry follow a strategy of non-integration, treating an LNG
terminal as merchant investment and offering service to whoever wants to make use of it. There exist a
number of liquefaction plants – so called “tolling facilities” (e.g. ELNG (Idku) or SEGAS (Damietta)
both in Egypt) – selling the service of liquefaction, storage and loading. Instead of the export project,
natural gas producers become sellers. For a detailed discussion of tolling facilities see Nissen (2004).
Also on the importing side, players plan to construct regasification plants selling the service of
regasification to LNG importers. The emergence of such quasi-open access regimes seems to suggest
that exclusive rights for the upstream business of the investing party are not always a prerequisite for
investment.
An example for a non-integrated company is Cheniere Energy focusing on selling LNG import
terminal capacity to third parties. The company has development projects for four large LNG
receiving terminals in the U.S.26 Capacities of these tolling facilities would be contracted to third
companies signing long-term agreements securing the right to use regasification capacity. Hence, LNG
sellers will have access to the U.S. market and natural gas buyers to global supplies of LNG. The
Freeport (Texas/U.S.) facility seems to be the most advanced, and it is characteristic for the strategy. It
is a very large facility, with 1.5 Bcf/d (15 bcm/a) in the first stage (2008), and another 2.5 Bcf/d (25
bcm/a) scheduled for an expansion (~2012). Cheniere has assured connection to Texas’ intrastate gas
pipeline network by constructing a 3.3 miles long pipeline. Marketing agreements of LNG throughput
capacity are already acquired by Conoco Phillips Company (10 bcm/a) and the Dow Chemical
Company (5 bcm/a).
2.3.3 New entrants
New players – mainly evolving in the U.S. where the natural gas market is competitive – follow
different business models when entering the LNG import industry.
Excelerate Energy’s newcomer strategy in the LNG market indicates that given the prevailing market
conditions and a favorable institutional environment in North America, significant investments in
LNG infrastructure may be forthcoming. Excelerate Energy was founded in 2003 to develop LNG
import facilities in the U.S. The Company is sponsored by George B. Kaiser, owner of Kaiser-Francis
Oil Company, and has thus a sound financial background. A major innovation was the purchase of the
rights to the Energy Bridge™ offshore shipboard regasification technology from El Paso Corporation,
including the company’s Gulf Gateway deepwater port. Construction of the Gulf Gateway deepwater
port, the first offshore LNG import terminal and the first one owned and operated by Excelerate,
started in August 2004 and was completed only 6 months later. Natural gas is transported through the
Sea Robin and Blue Water Pipelines to the Louisiana coast near Henry Hub, providing direct access to
26 Freeport, TX (1.5 Bcf/d, + 2.5 Bcf/d extension planned), Sabine, LA (2.6 Bcf/d + expansion plan of another 1.4 Bcf/d), Corpus Christi, TX (2.6 Bcf/d), and Creole Trail, LA (3.3 Bcf/d).
28
downstream markets. Excelerate has developed several contracts with natural gas sellers (such as
Chevron Texaco). Based on this early success, Excelerate is developing further LNG import facility
projects: the Northeast Gateway deepwater port (13 miles offshore Massachusetts), a deepwater port
off the coast of Northern California and the Southeast Gateway to deliver natural gas to Florida.
Parallel to the development of LNG terminals Excelerate also began to extend its upstream activities.
Given the new on-board regasification technology, integrating into transportation is a logical step:
Excelerate obtained stakes in four vessels, two of them already operating and two more being under
construction (delivery 2006/2008; owned by Exmar and Excelerate). Further upstream, Excelerate is
negotiating a deal for natural gas deliveries from Egypt’s Idku liquefaction facility.
Gulf Coast LNG Partners, L.P. is a limited partnership formed to develop Calhoun LNG at Port
Lavaca (Texas/U.S.). Financing is secured by Haddington Ventures,27 realizing investments in
midstream energy companies based on private equity funds. The Calhoun LNG import terminal would
have a capacity of up to 1 bcf/d; two storage tanks with 160,000 cm each are planned. Port Lavaca was
selected since the investors can use already existing deepwater port infrastructure and large industrial
end-users are demanding natural gas in the immediate area. Furthermore, major natural gas pipelines
are in close proximity. The project is still in the FERC permitting process but could come on stream
after a three-year construction phase in 2010.
Golar LNG is an independent LNG shipping operator focusing on LNG vessels. The company charters
out vessels for about 30 years. During recent years, Golar purchased a number of cargoes and started
activities in LNG trading under free-on-board agreements. It plans to invest in liquefaction and
regasification capacities and is also active in the development of offshore floating regasification units.
This is a case of a player originally situated in the mid-stream stage planning to integrate upstream as
well as downstream.
The cases of Excelerate, Gulf Coast LNG and Golar LNG show that merchant entry into the capital-
intensive LNG business is possible. New entrants emerge in the North American import market, which
is already competitive. We assume that with the ongoing deregulation process in Continental Europe,
corporate strategies will change to that in the future, when competition will be at acceptable levels,
also in these countries independent companies will enter the LNG industry.
3 Transaction Costs: A Literature Survey In order to empirically test the hypothesis of increasing transaction costs inducing a higher degree of
vertical integration we can follow two main streams of literature. Since there exists no uniform theory
of vertical integration as pointed out by Joskow (2003), we will identify different motivations of firms
to prefer the internal form of organization as opposed to others. Two pole governance structures 27 Haddington Energy Partners II, LP is a private equity fund run by Haddington Ventures, LLC created to invest in midstream energy sector companies focused on gathering, separation, processing, treating, compression, storage, and transmission within United States.
29
(market and hierarchy) exist where in between hybrid forms of governance, like complex contracts or
partial ownership arrangements, are possible.
Transaction cost economics finds its origin in Coase’s theory of the firm (1937) and has been
developed further by contributions from Williamson (1971, 1983, etc.), and Klein, Crawford and
Alchian (1978). Coase (1937) was the first economist, thinking about costs that accompany exchange
relationships on markets and introduced the concept of transaction costs.28 He studies the emergence
and scope of firms resulting from costs of using the market. But “why, if by organizing one can
eliminate certain costs and in fact reduce the cost of production, are there any market transactions at
all? Why is not all production carried by one big firm?” (Coase, 1937, p. 392). He specifies two reasons.
Firstly, additional internal costs arise with every transaction organized within a firm, and secondly, the
entrepreneur’s capability of making the best use of factors of production decreases. Following
transaction cost economics, asset specificity, uncertainty, and frequency of transactions are the main
drivers influencing the extent of arising transaction costs.29 The hold-up problem – arising from a high
level of relationship-specific investments in uncertain environments with players characterized by
bounded rationality – results in costly ex post bargaining, inefficient ex-ante investment levels and
decreasing efficiency. Organizing transactions within the own hierarchy avoids these problems by
internalizing arising quasi rents in the firm. However, internal organization of every additional
transaction results in increasing bureaucracy costs. Strong empirical evidence supporting the
transaction cost approach and its ability to explain the determinants of vertical integration has been
found since the 1980s.
Following the more formal property rights approach, incentives to integrate vertically are generated by
the advantage of possessing residual rights of control over assets in cases where specific investments
have to be realized. According to Grossman and Hart (1986), defining ownership as the possession of
these residual rights, bargaining power over ex post distribution of surplus inhibits positive investment
incentives. Vertical integration is worthwhile if it is too costly to list all specific rights in a contract
and if one party’s investment decision is of major importance. Furthermore, highly complementary
assets should be under joint ownership (e.g. mine mouth plants and coal mines, as confirmed
empirically by Joskow, 1985) whereas independent assets should be separately owned. Only a few
studies provide empirical evidence, yet.30
28 About 30 years Coase’s work attracted little attention, but with the development of the new institutional economics during the 1960s and 1970s it became one of the most cited articles. 29 Investments in specific assets are defined as “durable investments that are undertaken in support of particular transactions, the opportunity cost of which investments is much lower in best alternative uses or by alternative users should the original transaction be prematurely terminated” (Williamson 1985, p. 55). Williamson (1983) defines five types of specificity: site specificity, physical asset specificity, dedicated assets, human asset specificity, and intangible assets. 30 Whinston (2001) discusses whether empirical literature confirming transaction cost theory does deliver any evidence for the property rights approach. Predictions of the two approaches differ substantially. To formulate testable hypothesis for the property rights theory a lot of information about the trading environment, in general not documented in transaction cost analysis, would be necessary. Therefore, existing empirical studies in general do not provide evidence for both approaches due to the lack of information; mainly on the extent of non-contractible investments (Whinston, 2001, p. 187).

30
Several other industrial organization approaches conclude that market imperfections such as the
existence of market power, barriers to entry, price discrimination, and asymmetric information are
possible drivers for vertical integration. However, vertical integration is not only an answer to market
power but potentially creates market power by gaining control over different stages of a value chain as
pointed out by Joskow (2005). Stigler (1951) develops a life-cycle theory of vertical integration.
Empirical analyses investigating a firm’s motivation to choose alternative institutions of governance in
different industries have a long-standing history. A large number of empirical case studies, such as
Klein (1988), Monteverde and Teece (1982), and Masten (1984), examine firms’ motivations to
integrate vertically rather than to choose market exchange.31 Klein (2004) provides an in-depth
overview of empirical studies on the choice of organizational structures. He distinguishes between
qualitative case studies, quantitative studies focusing on a single industry and cross sectional studies.
Whereas empirical analysis in its early stages typically focused on the manufacturing sector and the
impact of investments in specific physical assets on corporate behavior, later work also discuses the
importance of human assets and extend the analysis to numerous industries. A rise in the prominence
of a transaction cost approach of vertical integration was observed during the 1980s. First empirical
work based on the property rights theory followed about 15 years later (e.g. Baker et al., 2004). We
place ourselves in the continuation of this literature by analyzing the determinants of vertical
integration in the LNG industry from the perspective of transaction cost economics. Our hypothesis is
that increasing transaction costs along the LNG value chain (mainly due to increasing asset specificity
and uncertainty) lead to a higher degree of vertical integration.
4 Data and Methodology We compiled a dataset on the LNG industry from various publicly available information and expert
interviews. It comprises detailed information on capacities, supply sources, ownership structures,
investment costs, financing structures and expansion plans of liquefaction and regasification projects
as well as wide data on the LNG world tanker fleet and vessels currently in the order books of
shipyards. Negotiated contracts have been analyzed concerning supplying facilities, contracting
partners, volumes, and contract duration. Actual exchange relationships from the natural gas well over
liquefaction, transportation, and regasification to marketing of the natural gas in the importing country
are identified out of 60 import and 25 export projects worldwide. For instance, BP participates in the
Point Fortin project in Trinidad and Tobago delivering LNG mainly to terminals in the U.S. and Spain.
On the importing side, BP secures quantities of LNG to be delivered to the Bilbao regasification plant
in Spain with supplies basically stemming from Trinidad and Abu Dhabi. Natural gas deliveries to
Point Fortin liquefaction train I originate from a field of which BP is the sole owner. Expansion trains
31 All mentioned case studies explain vertical integration by institutional factors basically represented by proxy variables for transaction costs, industry or other exogenous characteristics.
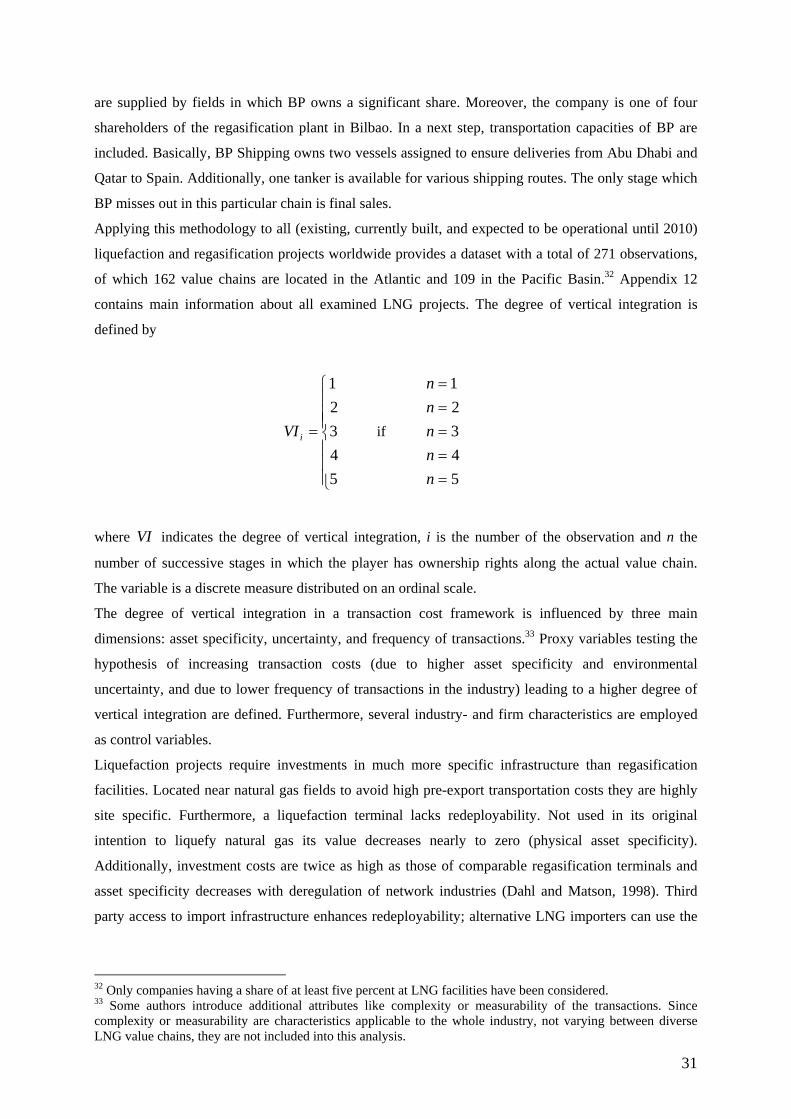
31
are supplied by fields in which BP owns a significant share. Moreover, the company is one of four
shareholders of the regasification plant in Bilbao. In a next step, transportation capacities of BP are
included. Basically, BP Shipping owns two vessels assigned to ensure deliveries from Abu Dhabi and
Qatar to Spain. Additionally, one tanker is available for various shipping routes. The only stage which
BP misses out in this particular chain is final sales.
Applying this methodology to all (existing, currently built, and expected to be operational until 2010)
liquefaction and regasification projects worldwide provides a dataset with a total of 271 observations,
of which 162 value chains are located in the Atlantic and 109 in the Pacific Basin.32 Appendix 12
contains main information about all examined LNG projects. The degree of vertical integration is
defined by
⎪⎪⎪
⎩
⎪⎪⎪
⎨
⎧
=
5 4 3 2 1
iVI if
54321
=====
nnnnn
where VI indicates the degree of vertical integration, i is the number of the observation and n the
number of successive stages in which the player has ownership rights along the actual value chain.
The variable is a discrete measure distributed on an ordinal scale.
The degree of vertical integration in a transaction cost framework is influenced by three main
dimensions: asset specificity, uncertainty, and frequency of transactions.33 Proxy variables testing the
hypothesis of increasing transaction costs (due to higher asset specificity and environmental
uncertainty, and due to lower frequency of transactions in the industry) leading to a higher degree of
vertical integration are defined. Furthermore, several industry- and firm characteristics are employed
as control variables.
Liquefaction projects require investments in much more specific infrastructure than regasification
facilities. Located near natural gas fields to avoid high pre-export transportation costs they are highly
site specific. Furthermore, a liquefaction terminal lacks redeployability. Not used in its original
intention to liquefy natural gas its value decreases nearly to zero (physical asset specificity).
Additionally, investment costs are twice as high as those of comparable regasification terminals and
asset specificity decreases with deregulation of network industries (Dahl and Matson, 1998). Third
party access to import infrastructure enhances redeployability; alternative LNG importers can use the
32 Only companies having a share of at least five percent at LNG facilities have been considered. 33 Some authors introduce additional attributes like complexity or measurability of the transactions. Since complexity or measurability are characteristics applicable to the whole industry, not varying between diverse LNG value chains, they are not included into this analysis.
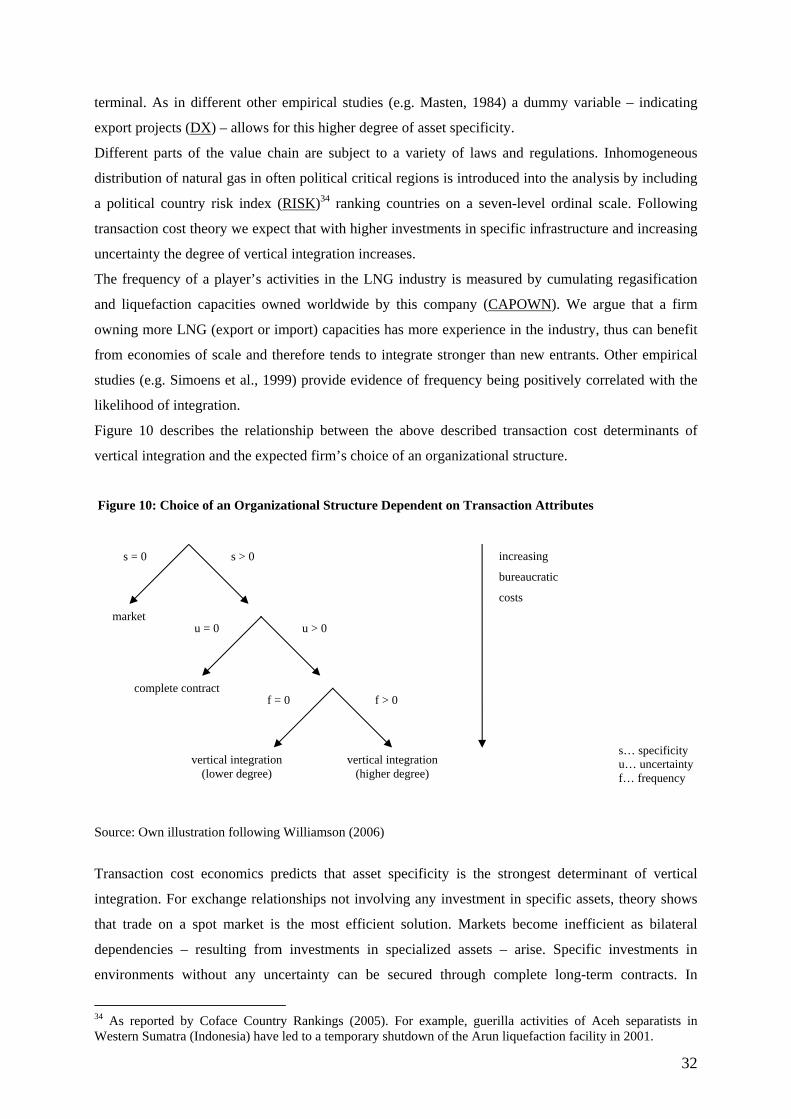
32
terminal. As in different other empirical studies (e.g. Masten, 1984) a dummy variable – indicating
export projects (DX) – allows for this higher degree of asset specificity.
Different parts of the value chain are subject to a variety of laws and regulations. Inhomogeneous
distribution of natural gas in often political critical regions is introduced into the analysis by including
a political country risk index (RISK)34 ranking countries on a seven-level ordinal scale. Following
transaction cost theory we expect that with higher investments in specific infrastructure and increasing
uncertainty the degree of vertical integration increases.
The frequency of a player’s activities in the LNG industry is measured by cumulating regasification
and liquefaction capacities owned worldwide by this company (CAPOWN). We argue that a firm
owning more LNG (export or import) capacities has more experience in the industry, thus can benefit
from economies of scale and therefore tends to integrate stronger than new entrants. Other empirical
studies (e.g. Simoens et al., 1999) provide evidence of frequency being positively correlated with the
likelihood of integration.
Figure 10 describes the relationship between the above described transaction cost determinants of
vertical integration and the expected firm’s choice of an organizational structure.
Figure 10: Choice of an Organizational Structure Dependent on Transaction Attributes
Source: Own illustration following Williamson (2006)
Transaction cost economics predicts that asset specificity is the strongest determinant of vertical
integration. For exchange relationships not involving any investment in specific assets, theory shows
that trade on a spot market is the most efficient solution. Markets become inefficient as bilateral
dependencies – resulting from investments in specialized assets – arise. Specific investments in
environments without any uncertainty can be secured through complete long-term contracts. In
34 As reported by Coface Country Rankings (2005). For example, guerilla activities of Aceh separatists in Western Sumatra (Indonesia) have led to a temporary shutdown of the Arun liquefaction facility in 2001.
s = 0
u = 0 u > 0
s > 0
f > 0 f = 0
market
complete contract
vertical integration (higher degree)
vertical integration (lower degree)
increasing
bureaucratic
costs
s… specificity u… uncertainty f… frequency
33
contrast, the existence of uncertainty results in vertical integration being more efficient than long-term
contracts. Frequency of transactions in the industry, defined as experience leading to the availability of
specific knowledge, staff, and economies of scale, is assumed to have a positive impact on the degree
of vertical integration. However, the more integrated a firm, the higher are additional bureaucracy
costs occurred through internal organization. This leads to a trade-off between costs and benefits of
integration.
First success of efforts of introducing competition into the natural gas industry (not only within
Europe) since the late 1990s is evident. Monopolistic market structures have been (partially) broken
up allowing new players to enter the market. Works of Ohanian (1994), Lieberman (1991), or Rosés
(2005) indicate that market concentration as a measurement of transaction costs resulting from a small
number bargaining problem has a significant positive influence on the degree of vertical integration.
Following this argumentation and taking into account restructuring efforts underway in Europe the
Herfindahl-Hirschman Index for the importing market (HHI) is included as independent variable. We
argue that the higher the persistent HHI in a country the fewer the number of alternative LNG buyers,
thus the higher transaction costs resulting from small number bargaining and therefore the higher the
degree of vertical integration to avoid these costs.
International LNG trade has only picked up since the late 1990s. We introduce a dummy variable
(D2002) identifying project start up dates before 2002, hence, allowing for structural changes in the
LNG industry. This enables the examination of the impact of a changing market environment due to
the liberalization of Continental European natural gas markets on corporate behavior.
A dummy variable (ATLANTIC) is used to allow for differences in corporate strategies resulting from
regional factors, varying between Atlantic markets (deliveries to Europe and North America), where
natural gas hubs are evolving and Pacific (Asian) markets where importers are strongly dependent on
LNG imports. For the analysis of a sub-sample including value chains situated in the Atlantic Basin
only, an additional dummy indicates value chains connecting to European instead of North American
import markets (EUR) to investigate if there are significant differences between the European market
and the competitive U.S. market.
Two additional variables accounting for differences in firm characteristic are included. The dummy
(ST) separates state-owned entities from private firms. The value of firms’ assets in million US$
(ASSETS) is used as a proxy for firm size, expecting that larger firms tend to be more integrated since
balance sheets enable the financing of integration. Furthermore, other papers show a positive influence
of firm size, often expressed by the assets value, on the likelihood or degree of vertical integration
(e.g. Anderson et al., 1984, Ohanian, 1994).
Table 7 summarizes explanatory variables and the expected influence on the degree of vertical
integration.
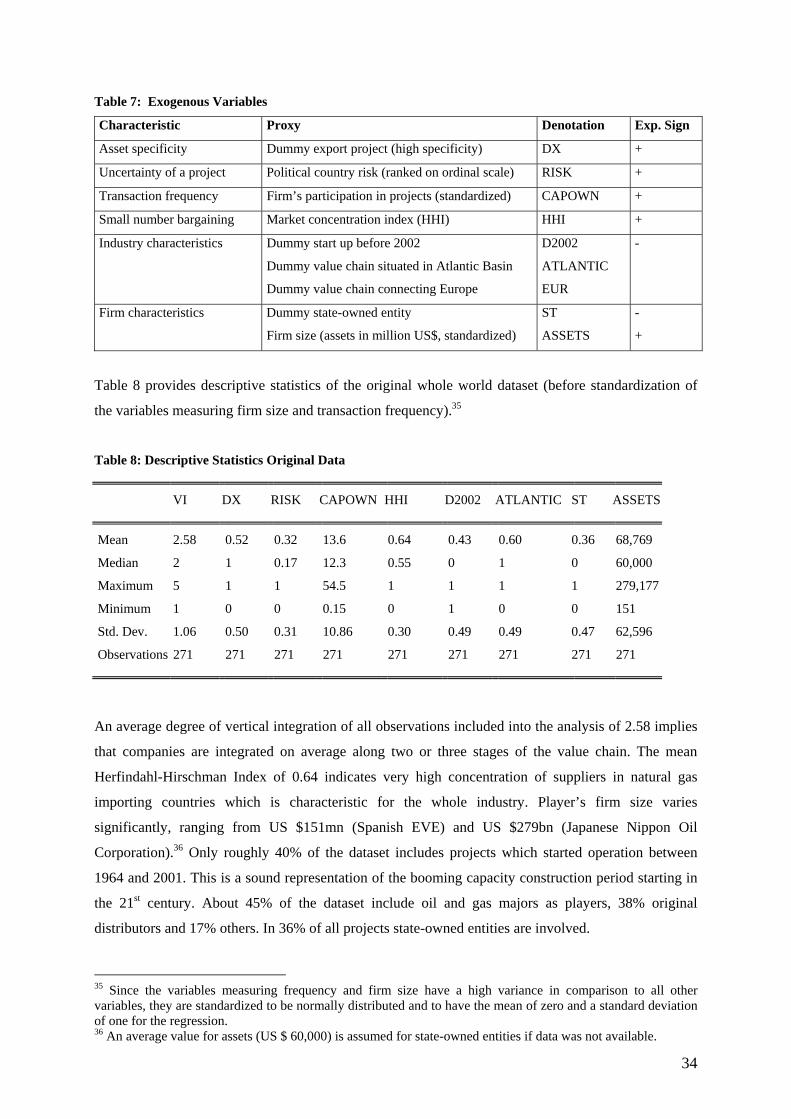
34
Table 7: Exogenous Variables
Characteristic Proxy Denotation Exp. Sign
Asset specificity Dummy export project (high specificity) DX +
Uncertainty of a project Political country risk (ranked on ordinal scale) RISK +
Transaction frequency Firm’s participation in projects (standardized) CAPOWN +
Small number bargaining Market concentration index (HHI) HHI +
Industry characteristics Dummy start up before 2002
Dummy value chain situated in Atlantic Basin
Dummy value chain connecting Europe
D2002
ATLANTIC
EUR
-
Firm characteristics Dummy state-owned entity
Firm size (assets in million US$, standardized)
ST
ASSETS
-
+
Table 8 provides descriptive statistics of the original whole world dataset (before standardization of
the variables measuring firm size and transaction frequency).35
Table 8: Descriptive Statistics Original Data
VI DX RISK CAPOWN HHI D2002 ATLANTIC ST ASSETS
Mean 2.58 0.52 0.32 13.6 0.64 0.43 0.60 0.36 68,769
Median 2 1 0.17 12.3 0.55 0 1 0 60,000
Maximum 5 1 1 54.5 1 1 1 1 279,177
Minimum 1 0 0 0.15 0 1 0 0 151
Std. Dev. 1.06 0.50 0.31 10.86 0.30 0.49 0.49 0.47 62,596
Observations 271 271 271 271 271 271 271 271 271
An average degree of vertical integration of all observations included into the analysis of 2.58 implies
that companies are integrated on average along two or three stages of the value chain. The mean
Herfindahl-Hirschman Index of 0.64 indicates very high concentration of suppliers in natural gas
importing countries which is characteristic for the whole industry. Player’s firm size varies
significantly, ranging from US $151mn (Spanish EVE) and US $279bn (Japanese Nippon Oil
Corporation).36 Only roughly 40% of the dataset includes projects which started operation between
1964 and 2001. This is a sound representation of the booming capacity construction period starting in
the 21st century. About 45% of the dataset include oil and gas majors as players, 38% original
distributors and 17% others. In 36% of all projects state-owned entities are involved.
35 Since the variables measuring frequency and firm size have a high variance in comparison to all other variables, they are standardized to be normally distributed and to have the mean of zero and a standard deviation of one for the regression. 36 An average value for assets (US $ 60,000) is assumed for state-owned entities if data was not available.

35
The correlation matrix in Table 9 exhibits some insights into the general relationships between
different variables. Political country risk and export projects are strongly positively correlated,
supporting the hypothesis of LNG exporting regions often being characterized by a certain political
instability. Large companies seem to own more liquefaction and regasification capacities, since they
are able to finance these capital intensive investments. Moreover, one can observe market
concentration in importing countries in the Pacific Basin exceeding the one in the Atlantic Basin.
State-owned entities control the natural gas sector of Asian countries, mainly China, South Korea, and
Taiwan whereas private firms and new entrants are active in North America and Europe.
Table 9: Correlation Matrix Independent Variables
DX CAPOWN RISK HHI D2002 ST ATLANTIC ASSETS
DX 1.000 0.152 0.441 0.315 0.135 0.001 0.080 0.366
CAPOWN 1.000 0.095 0.092 0.194 0.083 -0.021 0.353
RISK 1.000 0.126 0.052 0.219 -0.000 0.137
HHI 1.000 0.205 0.142 -0.393 0.165
D2002 1.000 0.051 -0.188 -0.030
ST 1.000 0.140 -0.372
ATLANTIC 1.000 -0.050
ASSETS 1.000
Having defined the degree of vertical integration as a discrete measure distributed on an ordinal scale
we apply an ordered probit model.37 For the analysis of the world dataset the degree of vertical
integration is explained by different exogenous variables as presented below:
i
iWorld
uATLANTICASSETSSTDHHIRISKCAPOWNDXVI
+++
++++++=
87
654321, 2002ββ
ββββββα
and for the analysis of the sub-set including only value chains situated in the Atlantic Basin the degree
of vertical integration is explained by:
i
iAtlantic
uEURASSETSSTDHHIRISKCAPOWNDXVI
+++
++++++=
87
654321, 2002ββ
ββββββα
37 For ordered response models the dependent variable is modeled by considering a latent variable that depends on certain exogenous variables. One distinguishes between ordered logit and ordered probit models, dependent on whether the error term is distributed logistically or normally. For this analysis, an ordered probit model is employed. Estimation is based on a maximum likelihood procedure.
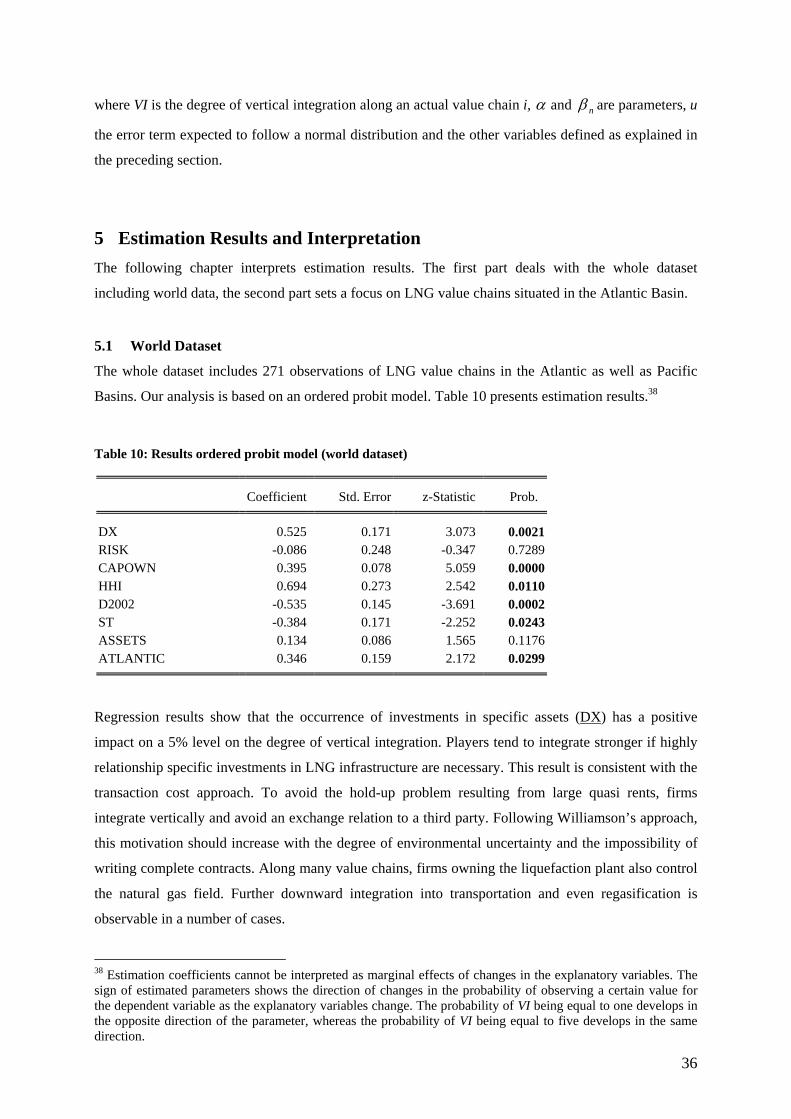
36
where VI is the degree of vertical integration along an actual value chain i, α and nβ are parameters, u
the error term expected to follow a normal distribution and the other variables defined as explained in
the preceding section.
5 Estimation Results and Interpretation The following chapter interprets estimation results. The first part deals with the whole dataset
including world data, the second part sets a focus on LNG value chains situated in the Atlantic Basin.
5.1 World Dataset
The whole dataset includes 271 observations of LNG value chains in the Atlantic as well as Pacific
Basins. Our analysis is based on an ordered probit model. Table 10 presents estimation results.38
Table 10: Results ordered probit model (world dataset)
Coefficient Std. Error z-Statistic Prob.
DX 0.525 0.171 3.073 0.0021RISK -0.086 0.248 -0.347 0.7289CAPOWN 0.395 0.078 5.059 0.0000HHI 0.694 0.273 2.542 0.0110D2002 -0.535 0.145 -3.691 0.0002ST -0.384 0.171 -2.252 0.0243ASSETS 0.134 0.086 1.565 0.1176ATLANTIC 0.346 0.159 2.172 0.0299
Regression results show that the occurrence of investments in specific assets (DX) has a positive
impact on a 5% level on the degree of vertical integration. Players tend to integrate stronger if highly
relationship specific investments in LNG infrastructure are necessary. This result is consistent with the
transaction cost approach. To avoid the hold-up problem resulting from large quasi rents, firms
integrate vertically and avoid an exchange relation to a third party. Following Williamson’s approach,
this motivation should increase with the degree of environmental uncertainty and the impossibility of
writing complete contracts. Along many value chains, firms owning the liquefaction plant also control
the natural gas field. Further downward integration into transportation and even regasification is
observable in a number of cases.
38 Estimation coefficients cannot be interpreted as marginal effects of changes in the explanatory variables. The sign of estimated parameters shows the direction of changes in the probability of observing a certain value for the dependent variable as the explanatory variables change. The probability of VI being equal to one develops in the opposite direction of the parameter, whereas the probability of VI being equal to five develops in the same direction.
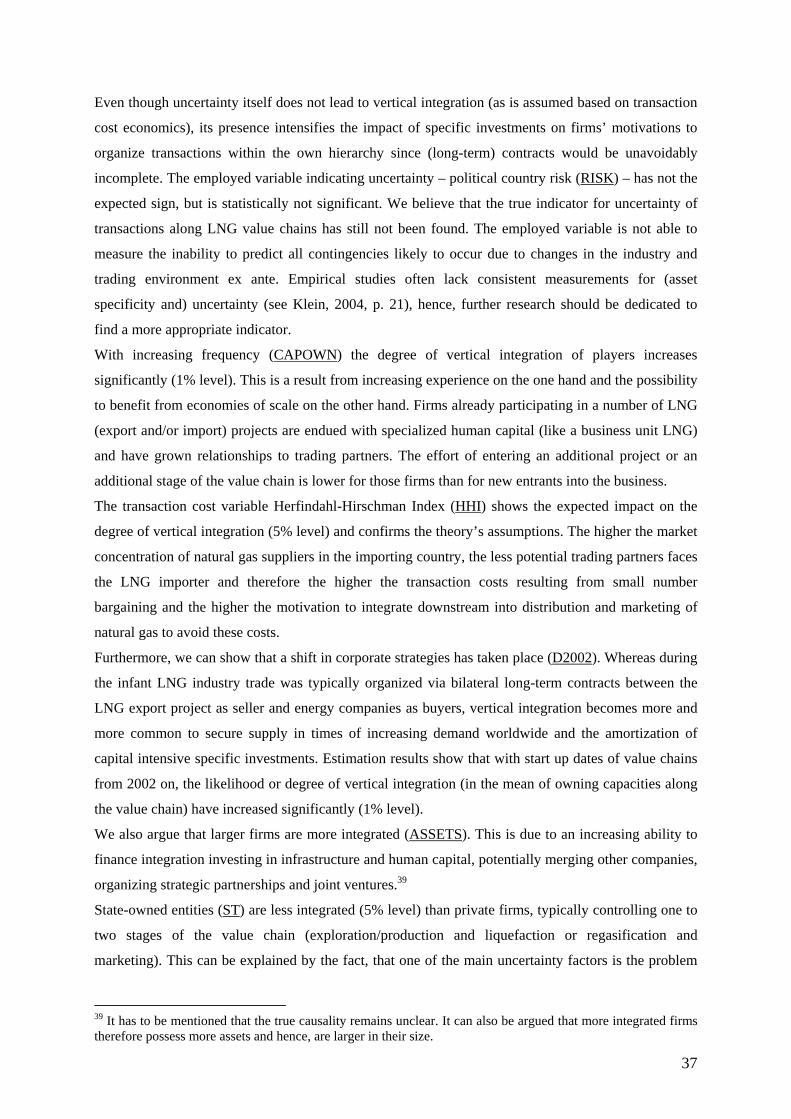
37
Even though uncertainty itself does not lead to vertical integration (as is assumed based on transaction
cost economics), its presence intensifies the impact of specific investments on firms’ motivations to
organize transactions within the own hierarchy since (long-term) contracts would be unavoidably
incomplete. The employed variable indicating uncertainty – political country risk (RISK) – has not the
expected sign, but is statistically not significant. We believe that the true indicator for uncertainty of
transactions along LNG value chains has still not been found. The employed variable is not able to
measure the inability to predict all contingencies likely to occur due to changes in the industry and
trading environment ex ante. Empirical studies often lack consistent measurements for (asset
specificity and) uncertainty (see Klein, 2004, p. 21), hence, further research should be dedicated to
find a more appropriate indicator.
With increasing frequency (CAPOWN) the degree of vertical integration of players increases
significantly (1% level). This is a result from increasing experience on the one hand and the possibility
to benefit from economies of scale on the other hand. Firms already participating in a number of LNG
(export and/or import) projects are endued with specialized human capital (like a business unit LNG)
and have grown relationships to trading partners. The effort of entering an additional project or an
additional stage of the value chain is lower for those firms than for new entrants into the business.
The transaction cost variable Herfindahl-Hirschman Index (HHI) shows the expected impact on the
degree of vertical integration (5% level) and confirms the theory’s assumptions. The higher the market
concentration of natural gas suppliers in the importing country, the less potential trading partners faces
the LNG importer and therefore the higher the transaction costs resulting from small number
bargaining and the higher the motivation to integrate downstream into distribution and marketing of
natural gas to avoid these costs.
Furthermore, we can show that a shift in corporate strategies has taken place (D2002). Whereas during
the infant LNG industry trade was typically organized via bilateral long-term contracts between the
LNG export project as seller and energy companies as buyers, vertical integration becomes more and
more common to secure supply in times of increasing demand worldwide and the amortization of
capital intensive specific investments. Estimation results show that with start up dates of value chains
from 2002 on, the likelihood or degree of vertical integration (in the mean of owning capacities along
the value chain) have increased significantly (1% level).
We also argue that larger firms are more integrated (ASSETS). This is due to an increasing ability to
finance integration investing in infrastructure and human capital, potentially merging other companies,
organizing strategic partnerships and joint ventures.39
State-owned entities (ST) are less integrated (5% level) than private firms, typically controlling one to
two stages of the value chain (exploration/production and liquefaction or regasification and
marketing). This can be explained by the fact, that one of the main uncertainty factors is the problem
39 It has to be mentioned that the true causality remains unclear. It can also be argued that more integrated firms therefore possess more assets and hence, are larger in their size.
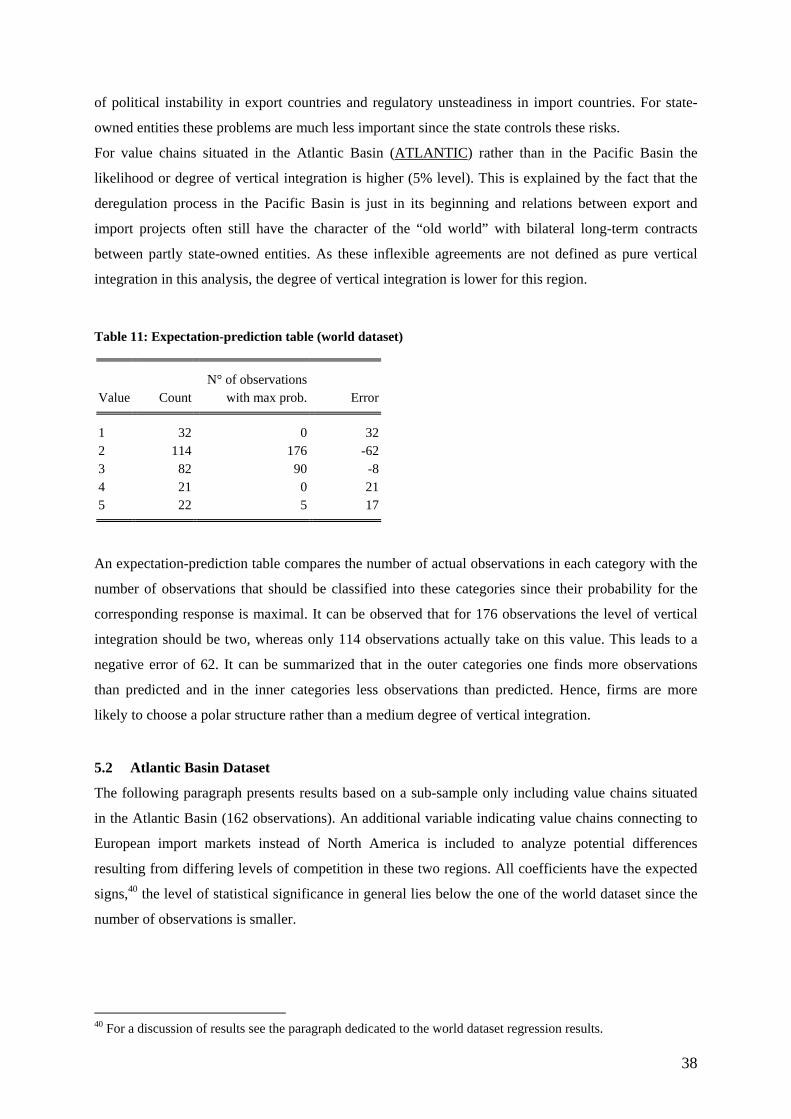
38
of political instability in export countries and regulatory unsteadiness in import countries. For state-
owned entities these problems are much less important since the state controls these risks.
For value chains situated in the Atlantic Basin (ATLANTIC) rather than in the Pacific Basin the
likelihood or degree of vertical integration is higher (5% level). This is explained by the fact that the
deregulation process in the Pacific Basin is just in its beginning and relations between export and
import projects often still have the character of the “old world” with bilateral long-term contracts
between partly state-owned entities. As these inflexible agreements are not defined as pure vertical
integration in this analysis, the degree of vertical integration is lower for this region.
Table 11: Expectation-prediction table (world dataset)
N° of observations Value Count with max prob. Error
1 32 0 322 114 176 -623 82 90 -84 21 0 215 22 5 17
An expectation-prediction table compares the number of actual observations in each category with the
number of observations that should be classified into these categories since their probability for the
corresponding response is maximal. It can be observed that for 176 observations the level of vertical
integration should be two, whereas only 114 observations actually take on this value. This leads to a
negative error of 62. It can be summarized that in the outer categories one finds more observations
than predicted and in the inner categories less observations than predicted. Hence, firms are more
likely to choose a polar structure rather than a medium degree of vertical integration.
5.2 Atlantic Basin Dataset
The following paragraph presents results based on a sub-sample only including value chains situated
in the Atlantic Basin (162 observations). An additional variable indicating value chains connecting to
European import markets instead of North America is included to analyze potential differences
resulting from differing levels of competition in these two regions. All coefficients have the expected
signs,40 the level of statistical significance in general lies below the one of the world dataset since the
number of observations is smaller.
40 For a discussion of results see the paragraph dedicated to the world dataset regression results.
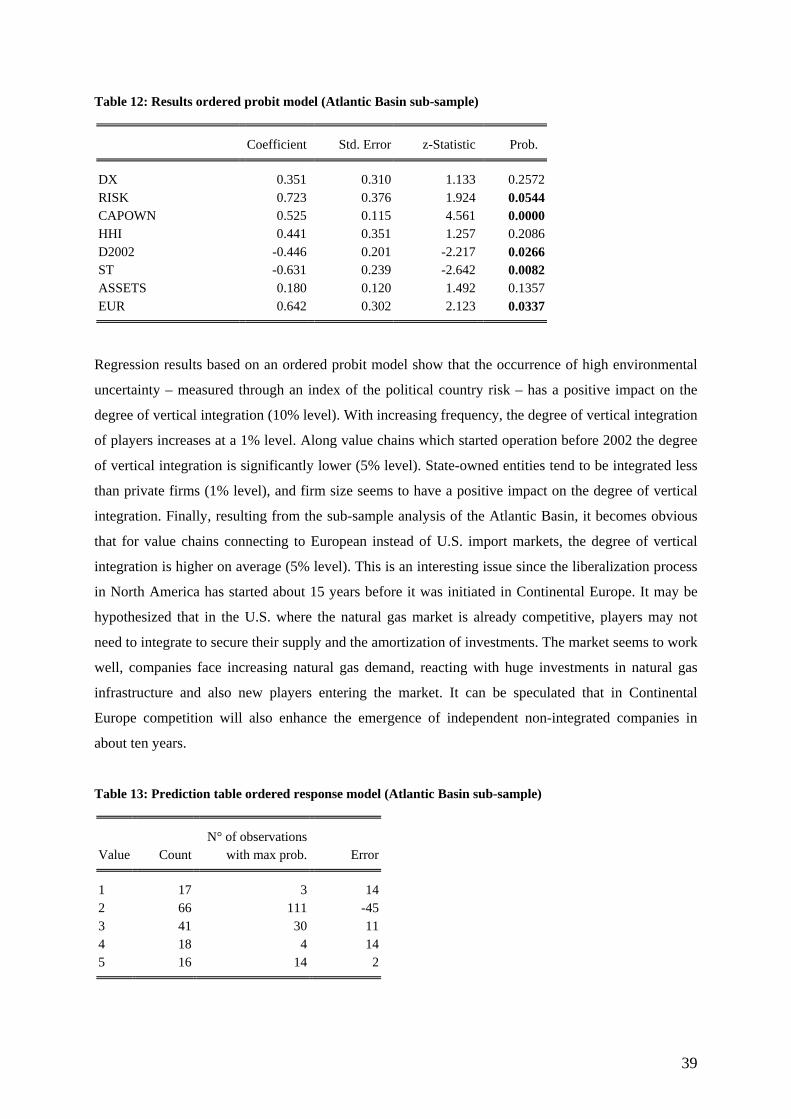
39
Table 12: Results ordered probit model (Atlantic Basin sub-sample)
Coefficient Std. Error z-Statistic Prob.
DX 0.351 0.310 1.133 0.2572RISK 0.723 0.376 1.924 0.0544CAPOWN 0.525 0.115 4.561 0.0000HHI 0.441 0.351 1.257 0.2086D2002 -0.446 0.201 -2.217 0.0266ST -0.631 0.239 -2.642 0.0082ASSETS 0.180 0.120 1.492 0.1357EUR 0.642 0.302 2.123 0.0337
Regression results based on an ordered probit model show that the occurrence of high environmental
uncertainty – measured through an index of the political country risk – has a positive impact on the
degree of vertical integration (10% level). With increasing frequency, the degree of vertical integration
of players increases at a 1% level. Along value chains which started operation before 2002 the degree
of vertical integration is significantly lower (5% level). State-owned entities tend to be integrated less
than private firms (1% level), and firm size seems to have a positive impact on the degree of vertical
integration. Finally, resulting from the sub-sample analysis of the Atlantic Basin, it becomes obvious
that for value chains connecting to European instead of U.S. import markets, the degree of vertical
integration is higher on average (5% level). This is an interesting issue since the liberalization process
in North America has started about 15 years before it was initiated in Continental Europe. It may be
hypothesized that in the U.S. where the natural gas market is already competitive, players may not
need to integrate to secure their supply and the amortization of investments. The market seems to work
well, companies face increasing natural gas demand, reacting with huge investments in natural gas
infrastructure and also new players entering the market. It can be speculated that in Continental
Europe competition will also enhance the emergence of independent non-integrated companies in
about ten years.
Table 13: Prediction table ordered response model (Atlantic Basin sub-sample)
N° of observations Value Count with max prob. Error
1 17 3 142 66 111 -453 41 30 114 18 4 145 16 14 2
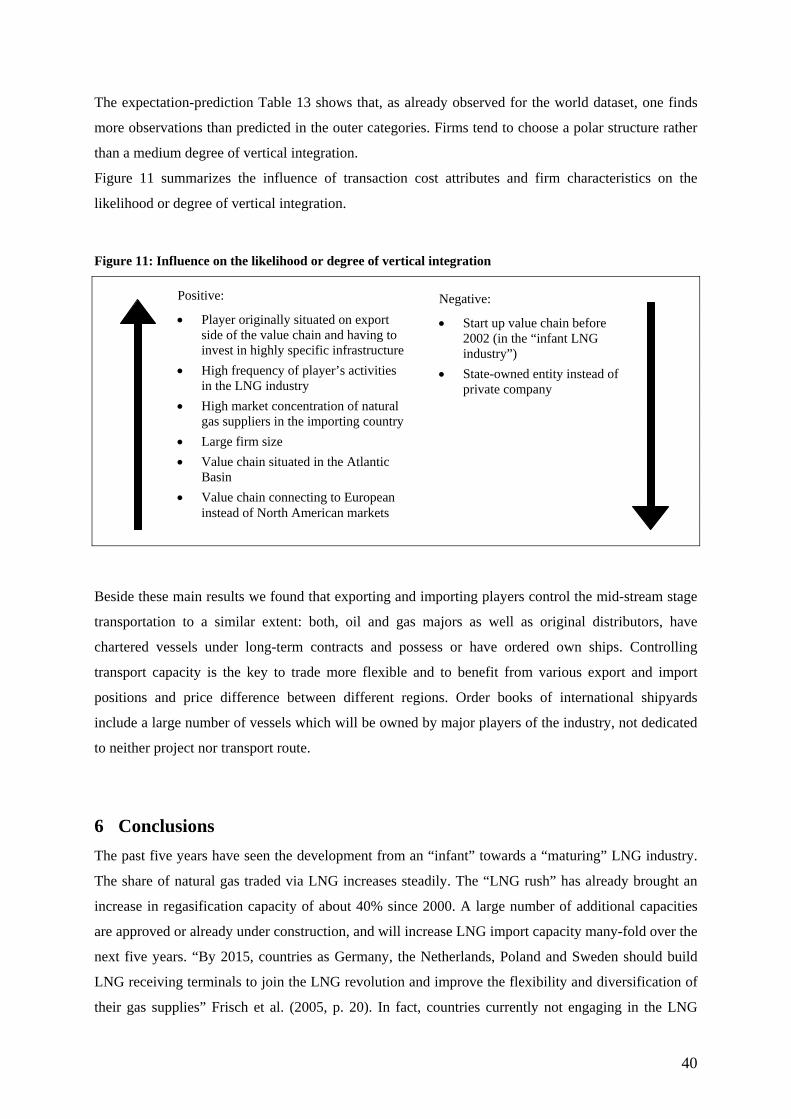
40
The expectation-prediction Table 13 shows that, as already observed for the world dataset, one finds
more observations than predicted in the outer categories. Firms tend to choose a polar structure rather
than a medium degree of vertical integration.
Figure 11 summarizes the influence of transaction cost attributes and firm characteristics on the
likelihood or degree of vertical integration.
Figure 11: Influence on the likelihood or degree of vertical integration
Beside these main results we found that exporting and importing players control the mid-stream stage
transportation to a similar extent: both, oil and gas majors as well as original distributors, have
chartered vessels under long-term contracts and possess or have ordered own ships. Controlling
transport capacity is the key to trade more flexible and to benefit from various export and import
positions and price difference between different regions. Order books of international shipyards
include a large number of vessels which will be owned by major players of the industry, not dedicated
to neither project nor transport route.
6 Conclusions The past five years have seen the development from an “infant” towards a “maturing” LNG industry.
The share of natural gas traded via LNG increases steadily. The “LNG rush” has already brought an
increase in regasification capacity of about 40% since 2000. A large number of additional capacities
are approved or already under construction, and will increase LNG import capacity many-fold over the
next five years. “By 2015, countries as Germany, the Netherlands, Poland and Sweden should build
LNG receiving terminals to join the LNG revolution and improve the flexibility and diversification of
their gas supplies” Frisch et al. (2005, p. 20). In fact, countries currently not engaging in the LNG
Positive:
• Player originally situated on export side of the value chain and having to invest in highly specific infrastructure
• High frequency of player’s activities in the LNG industry
• High market concentration of natural gas suppliers in the importing country
• Large firm size • Value chain situated in the Atlantic
Basin • Value chain connecting to European
instead of North American markets
Negative:
• Start up value chain before 2002 (in the “infant LNG industry”)
• State-owned entity instead of private company
41
industry actually consider the LNG option. Discussions are under way about terminals at
Wilhelmshaven (Germany), Gdansk (Poland), or Krk (Croatia).41
Rising natural gas demand worldwide and the ongoing process of liberalization in Continental Europe
lead to fundamental changes in corporate behavior. Today’s industry is characterized by more flexible
(long-term) contracts, accompanied by short-term agreements, and companies integrating vertically to
internalize risk factors resulting from investments in capital intensive LNG infrastructures and to
benefit from various export and import positions around the world. However, vertical integration and
strategic partnerships lead to an industry in which a small number of large and powerful players are
active. Jensen (2004) argues that in the developing global LNG market “super majors” will play an
important role. Vertical integration limits competition at the horizontal level thus counteracting
liberalization efforts in downstream markets.
Based on transaction cost economics and using data on 85 LNG export and import projects worldwide
we provide quantitative evidence on the determinants of vertical integration in the (liquefied) natural
gas industry. We confirm the main hypothesis of increasing transaction costs along the LNG value
chain inducing a higher degree of vertical integration. Other findings suggest that investments in
specific infrastructure have a positive impact on the likelihood of vertical integration. The extent of
vertical integration increased significantly with project start up dates since 2002. Furthermore, private
companies’ degree of vertical integration exceeds the degree of vertical integration of state-owned
entities. With rising firm size and frequency of transactions in the LNG industry, players tend to be
more integrated. We show that for value chains situated in the Atlantic Basin (in contrast to the Pacific
Basin) the degree of vertical integration is higher. This is particularly the case for value chains
connecting to European instead of North American import markets.
Companies control liquefaction and regasification capacities at various locations around the world
enabling the exploitation of arbitrage opportunities with highly volatile natural gas prices. 42 In
addition, players order own vessels thereby creating uncommitted transport capacities. Until today,
most re-directions of spot cargoes took place from Europe to the U.S. and also in near future, the
currently very high U.S. spot prices could drag more LNG cargoes away from Europe. The Middle
East is expected to evolve to a swing producer; volumes contracted under long- and short-term
agreements are dedicated to both, European as well as Asian markets.
Further research should set a focus on non-transaction cost determinants of vertical integration. The
analysis of market power and other strategic motivations will provide other useful insights. As pointed
out by Joskow (2005, p. 8) vertical integration may not only create market power by gaining control
over different stages of a value chain but can also be a response to market power of potential trading
partners (see also Klein, 2004, pp. 21ff). 41 Diversifying supply sources would lead (especially for Balkan countries) to a decrease in dependency from one major supplier and therefore secure competitive prices. Oostvoorn et al. (2006) model natural gas corridors among Europe and predict high prices especially in the Balkan countries due to strong market power of one major supplier for the coming decades. 42 See Appendix 18 for a figure showing the development of North American versus European natural gas prices.

42
References Acemoglu, Daron, Philippe Aghion, Rachel Griffith, and Fabrizio Zilibotti (2005a): Vertical
Integration and Technology: Theory & Evidence. National Bureau of Economic Research, Cambridge MA, Working Paper 10997.
Acemoglu, Daron, Simon Johnson, and Todd Mitton (2005b): Determinants of Vertical Integration: Finance, Contracts, and Regulation. National Bureau of Economic Research, Cambridge MA, Working Paper 11424.
Anderson, Erin, and David C. Schmittlein (1984): Integration of the Sales Force: An Empirical Examination. Rand Journal of Economics, Vol. 15, No. 3, pp. 385-395.
Baker, George P., and Thomas Hubbard (2004): Contractibility and Asset Ownership: On-Board Computers and Governance in US Trucking. Quarterly Journal of Economics, Vol. 119, No. 4, pp. 1443-1479.
Barrera-Rey, Fernando (1995): The Effects of Vertical Integration on Oil Company Performance. Oxford Institute for Energy Studies, Oxford, WPM Working Paper 21.
BP (2006): Statistical Review of World Energy 2005.
Bolle, Friedel (1989): Take-or-Pay Verträge und Vertikale Integration im Erdgashandel. Zeitschrift für Energiewirtschaft, Vol. 13, No. 4, pp. 249-255.
Bolton, Leigh (2005): Succeeding in the Growing Global LNG Markets. Presentation at ICBI Sparks and Flames Conference, Amsterdam, Netherlands, December 9, 2005.
Buehler, Stefan, and Armin Schmutzler (2004): Intimidating Competitors – Endogenous Vertical Integration and Downstream Investment in Successive Oligopoly. Socioeconomic Institute, University of Zurich, Working Paper 0409.
Buvik, Arnt, and Sven A. Haugland (2005): The Allocation of Specific Assets, Relationship Duration, and Contractual Coordination in Buyer-Seller Relationships. Scandinavian Journal of Management, Vol. 21, No. 1, pp. 41-60.
Carlton, Dennis W. (1979): Vertical Integration in Competitive Markets under Uncertainty. Journal of Industrial Economics, Vol. 27, No. 3, pp. 189-209.
Carroll, Glenn R., and David J. Teece (1999): Firms, Markets, and Hierarchies – The Transaction Cost Perspective. Oxford University Press, New York.
Cavanaugh, Joseph K. (2001): Partial Integration and Asset Specific Investment. Economics Department, Wright State University LC, Working Paper.
Cedigaz (2004): The Players on the European Gas Market. 2004 Report.
CERA (2006): LNG Shipping – The Anatomy of a Bubble. Decision Brief, 01/2006.
Coase, Ronald H. (1937): The Nature of the Firm. Economica, Vol. 4, No. 16, pp. 386-405.
Cornot-Gandolphe, Sylvie (2005): LNG Cost Reductions and Flexibility in LNG Trade add to Security of Gas Supply. In IEA Prices and Taxes (2005), OECD, Paris.
Council of European Energy Regulators (2005): Investments in Gas Infrastructures and the Role of EU National Regulatory Authorities. Report.

43
Court, Susan J. (2006): Changing Paradigms in World Gas Markets and Energy Policy. Presentation at IEA/IGU/EP High-Level Conference on Regulation of Natural Gas Markets. IEA, Paris.
Dahl, Carol A., and Thomas K. Matson (1998): Evolution of the US Natural Gas Industry in Response to Changes in Transaction Costs. Land Economics, Vol. 74, No. 3, pp. 390-408.
Demsetz, Harold (1967): Toward a Theory of Property Rights. American Economic Review, Vol. 57, No. 2, pp. 347-359.
Energy Information Administration (EIA) (2003): The Global LNG Market – Status and Outlook. Research Report.
- - - (2005a): Natural Gas Annual 2004. Research Report.
- - - (2005b): Annual Energy Outlook. Research Report.
- - - (2006): Natural Gas Weekly Update (general issues).
Ellis, Andrew, Einar Bowitz, and Kjell Roland (1999): Structural Change in Europe’s Gas Markets: Three Scenarios for the Development of the European Gas Market to 2020. Energy Policy, Vol. 28, No. 5, pp. 297-309.
European Union (2003): EU Gas Directive 2003/55/EC.
Frisch, Morten, Paul Carpenter, and Carlos Lapuerta (2005): The Advent of U.S. Gas Demand Destruction and its Likely Consequences for the Pricing of Future European Gas Supplies. Paper presented at Gastech Conference, Bilbao, Spain, March 16, 2005.
Greene, William H. (2002): Econometric Analysis. Prentice Hall, 5th Edition.
Grossman, Sanford J., and Oliver D. Hart (1986): The Costs and Benefits of Ownership: A Theory of Vertical and Lateral Integration. Journal of Political Economy, Vol. 94, No. 4, pp. 691-719.
Hart, Oliver, and John Moore (1990): Property Rights and the Theory of the Firm. Journal of Political Economy, Vol. 98, No. 6, pp. 1119-1158.
Hart, Oliver (1995): Firms, Contracts, and Financial Structure. Clarendon Press, Oxford.
Hirschhausen, Christian von (2006): Infrastructure Investments and Resource Adequacy in the Restructured U.S. Natural Gas Market – Is Supply Security at Stake? Working Paper WP-GG-18, Dresden University of Technology, Chair of Energy Economics and Public Sector Management.
Iniss, Helena (2004): Operational Vertical Integration in the Gas Industry, with Emphasis on LNG: Is It Necessary to ensure Viability? Mimeo.
Institute of Energy Economics Japan (2000): LNG Market at a Turning Point and Japan’s Options. 362nd Regular Meeting, Research Report.
- - - (2002): Liberalization of Gas Industries in Europe and the U.S. 373rd Regular Study Meeting, Research Report.
- - - (2003): Study of Changes in Patterns of LNG Tanker Operation. Research Report.
- - - (2004): Japanese Energy Policy and Regional Corporation. Paper presented at 2004 COE Summer International Seminar – Siberia and the Russian Far East in the 21st Century: Partners in the Community of Asia-Slavic Research Center, Hokkaido University July 14-16, 2004.
- - - (2005): LNG Supply and Demand in Asia Pacific and Atlantic Markets. Research Report.
44
International Energy Agency (IEA) (1998): Natural Gas Pricing in Competitive Markets. Research Report, IEA/OECD, Paris.
- - - (2003): The Challenges of further Cost Reductions for new Supply Options. Research Report.
- - - (2005a): World Energy Outlook. OECD, Paris.
- - - (2005b): Natural Gas Information. OECD, Paris.
- - - (2006): Natural Gas Market Review 2006. OECD, Paris.
Jensen, James T. (2003): The LNG Revolution. Energy Journal, Vol. 24, No. 2, pp. 1-45.
- - - (2004): The Development of a Global LNG Market. Is It Likely? If so, When? Oxford Institute for Energy Studies, Oxford.
- - - (2006): LNG – The Challenge of Including an Internationally Traded Commodity in a North American Natural Gas Forecast. Presentation at EIA Energy Outlook and Modeling Conference, Washington, U.S., March 27, 2006.
John, George, and Barton A. Weitz (1988): Forward Integration into Distribution: An Empirical Test of Transaction Cost Analysis. Journal of Law, Economics, and Organization, Vol. 4, No. 2, pp. 337-355.
Joskow, Paul L. (1985): Vertical Integration and Long Term Contracts: The Case of Coal-Burning Electric Generation Plants. Journal of Law, Economics, and Organization, Vol. 1, No. 1, pp. 33-80.
- - - (1987): Contract Duration and Relationship-Specific Investments: Empirical Evidence from Coal Markets. American Economic Review, Vol. 77, No. 1, pp. 168-185.
- - - (2005, revised): Vertical Integration. Handbook of New Institutional Economics, Springer/Kluwer.
Klein, Benjamin (1988): Vertical Integration as Organizational Ownership: The Fisher Body – General Motors Relationship Revisited. Journal of Law, Economics and Organization, Vol. 4, No. 1, pp. 199-213.
Klein, Benjamin, Robert G. Crawford, and Armen A. Alchian (1978): Vertical Integration, Appropriable Rents, and the Competitive Contracting Process. Journal of Law and Economics, Vol. 21, No. 4, pp. 297-326.
Klein, Peter G. (2004): The Make-or-Buy Decision: Lessons from Empirical Studies. Contracting and Organizations Research Institute, University of Missouri – Columbia, Working Paper 2004-07.
Langlois, Richard N., and Paul L. Robertson (1989): Explaining Vertical Integration: Lessons from the American Automobile Industry. Journal of Economic History, Vol. 49, No. 2, pp. 361-375.
Lieberman, Marvin B. (1991): Determinants of Vertical Integration: An Empirical Test. Journal of Industrial Economics, Vol. 39, No. 5, pp. 451-466.
Lijesen, Mark (2001): Welfare Effects of Vertical Integration in Energy Distribution. CPB Netherlands Bureau for Economic Policy Analysis. Research Report.
Masten, Scott (1984): The Organization of Production: Evidence from the Aerospace Industry. Journal of Law and Economics, Vol. 27, No. 2, pp. 403-417.
--- (1996): Case Studies in Contracting and Organization. New York, Oxford University Press.
45
Masten, Scott E., James W. Meehan, and Edward A. Snyder (1991): The Costs of Organization. Journal of Law, Economics, and Organization, Vol. 7, No. 1, pp. 1-25.
Monteverde, Kirk, and David J. Teece (1982a): Appropriable Rents and Quasi-Vertical Integration. Journal of Law and Economics, Vol. 15, No. 2, pp. 321-328.
- - - (1982b): Supplier Switching Costs and Vertical Integration in the Automobile Industry. Bell Journal of Economics, Vol. 13, No. 1, pp. 206-213.
Neumann, Anne, and Christian von Hirschhausen (2006): Long-term Contracts and Asset Specificity Revisited – An Empirical Analysis of Producer- Importer Relations in the Natural Gas Industry. Working Paper WP-GG-16, Dresden University of Technology, Chair of Energy Economics and Public Sector Management.
Nissen, David (2004): Commercial LNG: Structure and Implications. Paper presented at the XIV Respsol YPF Seminar: Managing Energy Markets, La Coruna, May 26, 2004.
- - - (2006): The Evolution of Commercial LNG: Optionality, Security, and Coasian Efficiency. Paper presented at 29th IAEE International Conference, June 7-10, 2006, Potsdam, Germany.
Ohanian, Nancy K. (1994): Vertical Integration in the US Pulp and Paper Industry, 1900-1940. Review of Economics and Statistics, Vol. 76, No. 1, pp. 202-207.
Oostvoorn, Fritz van, Wietze Lise, and Benjamin Hobbs (2006): Natural Gas Corridors Among EU and its Main Suppliers, Simulation Results with the Dynamic Gastale Model. Paper presented at 29th IAEE International Conference, June 7-10, 2006, Potsdam, Germany.
Poten & Partners (2005): Construction Costs on the Rise for LNG Projects. LNG in World Markets, November 2005.
Rosés, Joan R. (2005): Subcontracting and Vertical Integration in the Spanish Cotton Industry. Department of Economic History and Institutions, Universidad Carlos III Madrid. Working Paper.
Ruester, Sophia (2006): Economics of the Liquefied Natural Gas Value Chain and Corporate Strategies – An Empirical Analysis of the Determinants of Vertical Integration. Diploma Thesis at Dresden University of Technology, Chair of Energy Economics and Public Sector Management.
Salanié, Bernard (1997): The Economics of Contracts. 2nd edition, Cambridge, Massachusetts, MIT Press.
Saussier, Stéphane (2000): Transaction Costs and Contractual Incompleteness: The Case of Electricité de France. Journal of Economic Behavior and Organization, Vol. 42, No.2, pp. 189-206.
Shelanski, Howard A., and Peter G. Klein (1995): Empirical Research in Transaction Cost Economics. Journal of Law, Economics and Organization, Vol. 11, No. 2, pp. 335-361.
Simmons and Company (2005): Liquefied Natural Gas. Integrated Oil Research Report.
Simoens, Steven, and Anthony Scott (1999): What Determines Integration in Primary Care? Theory and Evidence. HERU Discussion Paper, 04/99.
Stigler, George J. (1951): The Division of Labor is Limited by the Extent of the Market. Journal of Political Economy, Vol. 59, No. 3, pp. 185-193.
Trans European Energy Networks (2006): TEN-Energy-Invest: Study on Energy Infrastructure Costs and Investments between 1996 and 2013 (medium-term) and further to 2023 (long-term) on the
46
Trans-European Energy Network and its Connection to Neighboring Regions. CESI, ITT, ME, RAMBØLL. Research Report.
Villas-Boas, Sofia B. (2005): Vertical Integration. Mimeo.
Whinston, Michael D. (2001): Assessing the Property Rights and Transaction Cost Theories of Firm Scope. American Economic Review, Vol. 91, No. 2, pp. 185-188.
- - - (2003): On the Transaction Costs Determinants of Vertical Integration. Journal of Law, Economics, and Organization, Vol. 19, No.1, pp. 1-23.
Williamson, Oliver E. (1971): The Vertical Integration of Production: Market Failure Considerations. American Economic Review, Vol. 61, No. 2, pp. 112-123.
- - - (1975): Markets and Hierarchies: Analysis and Antitrust Implications. New York, The Free Press.
- - - (1983): Credible Commitments: Using Hostages to Support Exchanges. American Economic Review, Vol. 73, No. 4, pp. 519-540.
- - - (1985): The Economic Institutions of Capitalism. New York, The Free Press.
- - - (1993): Transaction Cost Economics and Organizational Theory. Industrial and Corporate Change, Vol. 2, No. 2, pp. 107-156.
- - - (2006): Transaction Cost Economics. Presentation at ESNIE Conference, Cargèse, May 17, 2006.
Internet Sources Abu Dhabi Gas Company (2006):
http://www.adgas.com/
BP LNG (2006): http://www.bp.com/genericsection.do?categoryId=4201&contentId=3050765
British Gas Conversion Calculator (2006): http://ir.bg-group.com/bgir/conversion_new/
British Gas Group LNG (2006): http://www.bg-group.com/about/grp_lng.htm
Brunei LNG (2006): http://www.blng.com.bn/
Calhoun LNG (2006): http://www.calhounlng.com/
Cheniere Energy (2006): http://www.cheniere.com/default.shtml
Chevron Texaco (2006): http://www.chevron.com/about/our_businesses/gas.asp

47
Coface Country Rating (2006): http://www.cofacerating.com, http://www.trading-safely.com/
Colton Company (2006): LNG Carrier List http://www.coltoncompany.com/shipbldg/worldsbldg/gas.htm, 01/07/2006, 10h
CRU International (2006): Steel Price Index http://www.cruspi.com/HomePage.aspx, 01/07/2006, 12h
Dragon LNG (2006): http://www.dragonlng.co.uk/
Egyptian LNG (2006): http://www.egyptianlng.com/
Energy Information Administration (2006): Natural Gas Data http://www.eia.doe.gov/oil_gas/natural_gas/data_publications/natural_gas_weekly_market_update/ngwmu.html
Eni (2006): Company Strategy http://www.eni.it/home/attivita_e_strategie_en.html
Excelerate Energy (2006): http://www.excelerateenergy.com/
Exxon Mobil (2006): http://www.exxonmobil.com
FERC (2006): http://www.ferc.gov
Gaz de France LNG (2006): http://www.gazdefrance.com/FR/public/page.php?identifiant=groupe_activites_gnl
Golar LNG (2006): http://www.golar.com
Heren Ltd. (2006): http://www.heren.com/heren1.htm
National Grid UK (2006): http://www.nationalgrid.com/
Nigeria LNG (2006): http://www.nlng.com/NLNGnew/default
North West Shelf Australia LNG (2006): http://www.australialng.com.au/
Oman LNG (2006): http://www.omanlng.com/
Panhandle Energy (2006): http://www.panhandleenergy.com/default.asp
Poten & Partners (2006): LNG and Gas Opinion http://www.poten.com/?URL=list_attach.asp?table=tmarket&type_id=2
48
Qatargas (2006): http://www.qatargas.com.qa/
RasGas (2006): http://www.rasgas.com/
Sakhalin Energy (2006): http://www.sakhalinenergy.com/en/
Shell Gas and Power (2006): http://www.shell.com/home/Framework?siteId=shellgasandpower-en
South Hook LNG (2006): http://www.southhooklng.co.uk/
Statoil Snovhit LNG (2006): http://www.statoil.com/statoilcom/snohvit/svg02699.nsf?opendatabase&lang=no
Suez Group (2006): http://www.suez.com/metiers/english/energie/index.php
Total LNG (2006): http://www.total.com/en/group/activities/upstream/gas_power/transportation_transmission/LNGlng_1058.htm
Union Fenosa Gas (2006): http://www.unionfenosa.es/webuf/ShowContent.do?contenido=CON_10_01_01
Yahoo Finance (2006): http://de.finance.yahoo.com/waehrungsrechner

i
Appendices

ii
Table of Contents – Appendices
Table of Contents – Appendices
List of Figures – Appendix
List of Tables – Appendix
A.1 Natural Gas Composition in Different Export Countries
A.2 Existing and Proposed LNG Import Terminals North America
A.3 Expected and New LNG Import Terminals North America
A.4 European Natural Gas Infrastructure
A.5 Pipeline Projects Europe
A.6 Regulation of LNG projects
A.7 Owners and Operators of European National Transmission Pipelines
A.8 Pipeline Infrastructure Asia-Pacific
A.9 LNG Import Prices
A.10 Calculation Country Matrix LNG Strategies
A.11 LNG Export and Import Projects Included in the Analysis
A.12 Political Country Risk
A.13 U.S. and European Natural Gas Spot Prices
ii
iii
iii
iv
v
vi
vii
viii
ix
x
xi
xii
xiii
xiv
xxiii
xxv

iii
List of Figures – Appendix
Figure A-1: Existing and proposed LNG terminals North America v Figure A-2: European natural gas infrastructure vii Figure A-3: LNG Import prices Europe and NBP spot price xii Figure A-4: LNG import prices Asia-Pacific xii Figure A-5: Henry Hub (U.S.) and Zeebrugge (B) natural gas spot prices xxv
List of Tables – Appendix
Table A-1: Natural gas composition iv Table A-2: Expected new LNG import terminals North America vi Table A-3: Future (proposed) European interstate pipeline projects viii Table A-4: Regulation of future LNG infrastructure ix Table A-5: Ownership and operating of European national pipeline grids x Table A-6: Existing interstate natural gas pipelines in Asia-Pacific xi Table A-7: Proposed interstate natural gas pipelines Asia-Pacific xi Table A-8: Calculation country matrix xiii Table A-9: LNG export projects Atlantic Basin xiv Table A-10: LNG export projects Pacific Basin xv Table A-11: LNG import projects Atlantic Basin xvii Table A-12: LNG import projects Pacific Basin xix Table A-13: Political country risk ratings xxiv
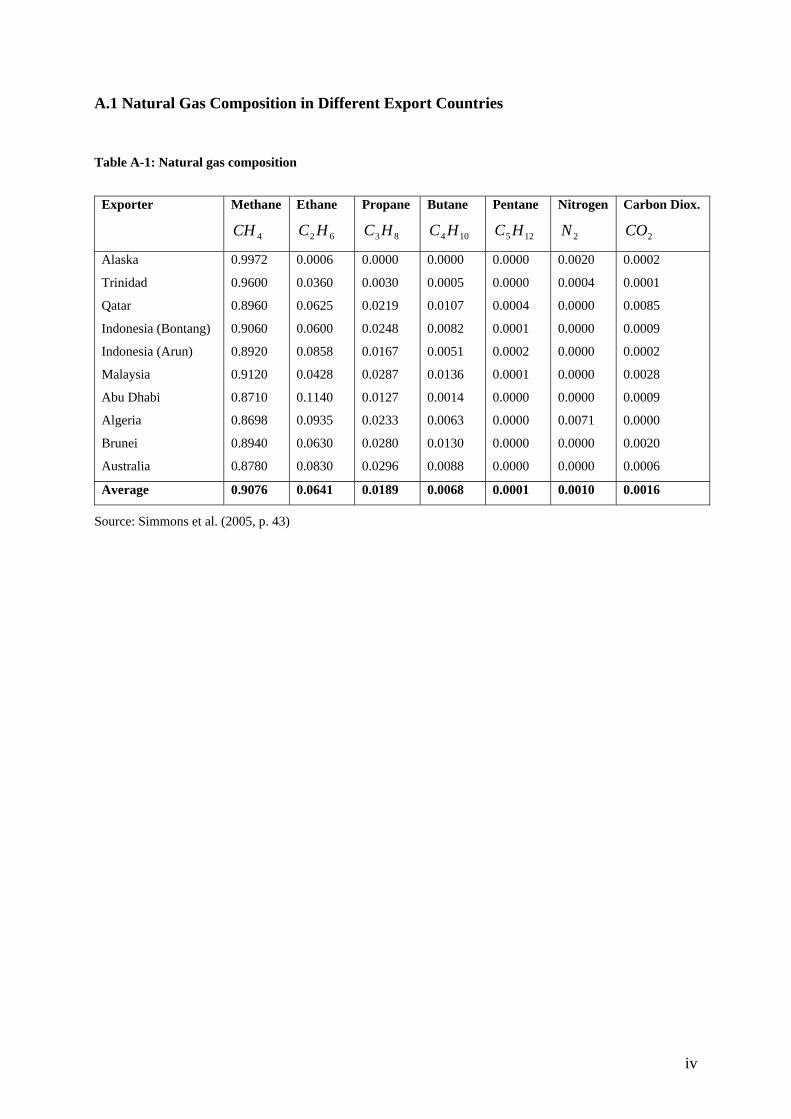
iv
A.1 Natural Gas Composition in Different Export Countries
Table A-1: Natural gas composition
Exporter Methane
4CH
Ethane
62 HC
Propane
83HC
Butane
104 HC
Pentane
125 HC
Nitrogen
2N
Carbon Diox.
2CO
Alaska
Trinidad
Qatar
Indonesia (Bontang)
Indonesia (Arun)
Malaysia
Abu Dhabi
Algeria
Brunei
Australia
0.9972
0.9600
0.8960
0.9060
0.8920
0.9120
0.8710
0.8698
0.8940
0.8780
0.0006
0.0360
0.0625
0.0600
0.0858
0.0428
0.1140
0.0935
0.0630
0.0830
0.0000
0.0030
0.0219
0.0248
0.0167
0.0287
0.0127
0.0233
0.0280
0.0296
0.0000
0.0005
0.0107
0.0082
0.0051
0.0136
0.0014
0.0063
0.0130
0.0088
0.0000
0.0000
0.0004
0.0001
0.0002
0.0001
0.0000
0.0000
0.0000
0.0000
0.0020
0.0004
0.0000
0.0000
0.0000
0.0000
0.0000
0.0071
0.0000
0.0000
0.0002
0.0001
0.0085
0.0009
0.0002
0.0028
0.0009
0.0000
0.0020
0.0006
Average 0.9076 0.0641 0.0189 0.0068 0.0001 0.0010 0.0016
Source: Simmons et al. (2005, p. 43)
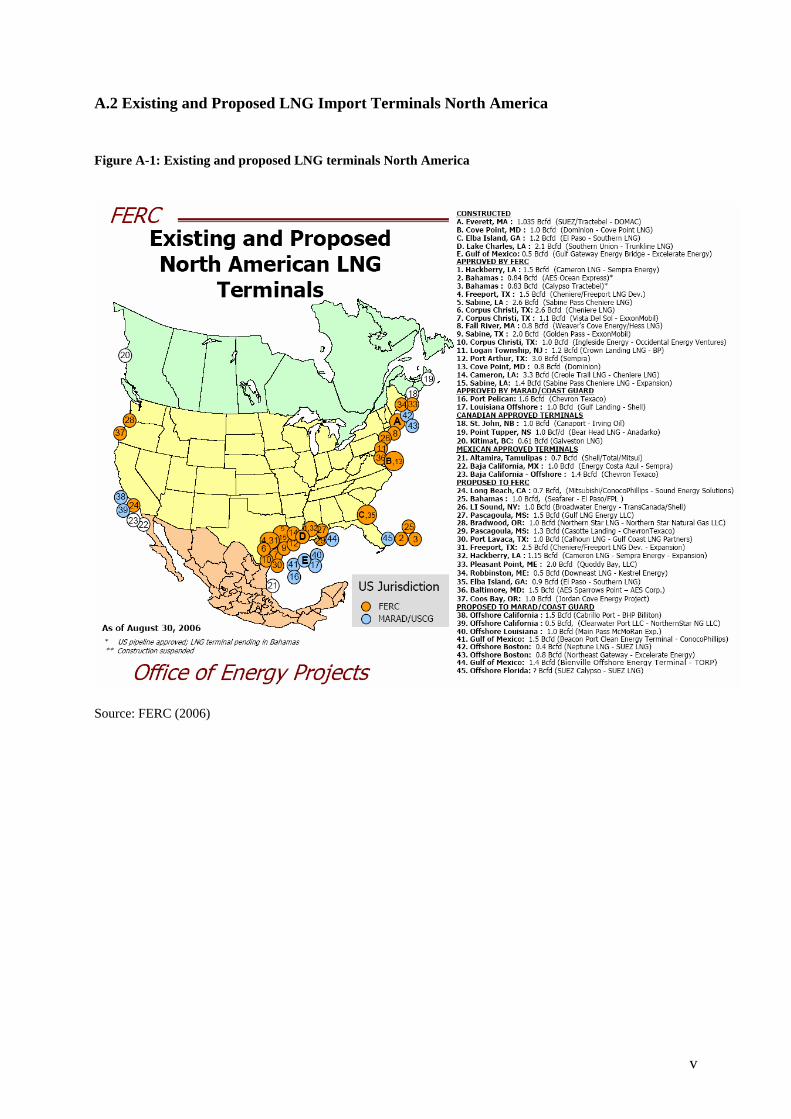
v
A.2 Existing and Proposed LNG Import Terminals North America
Figure A-1: Existing and proposed LNG terminals North America
Source: FERC (2006)
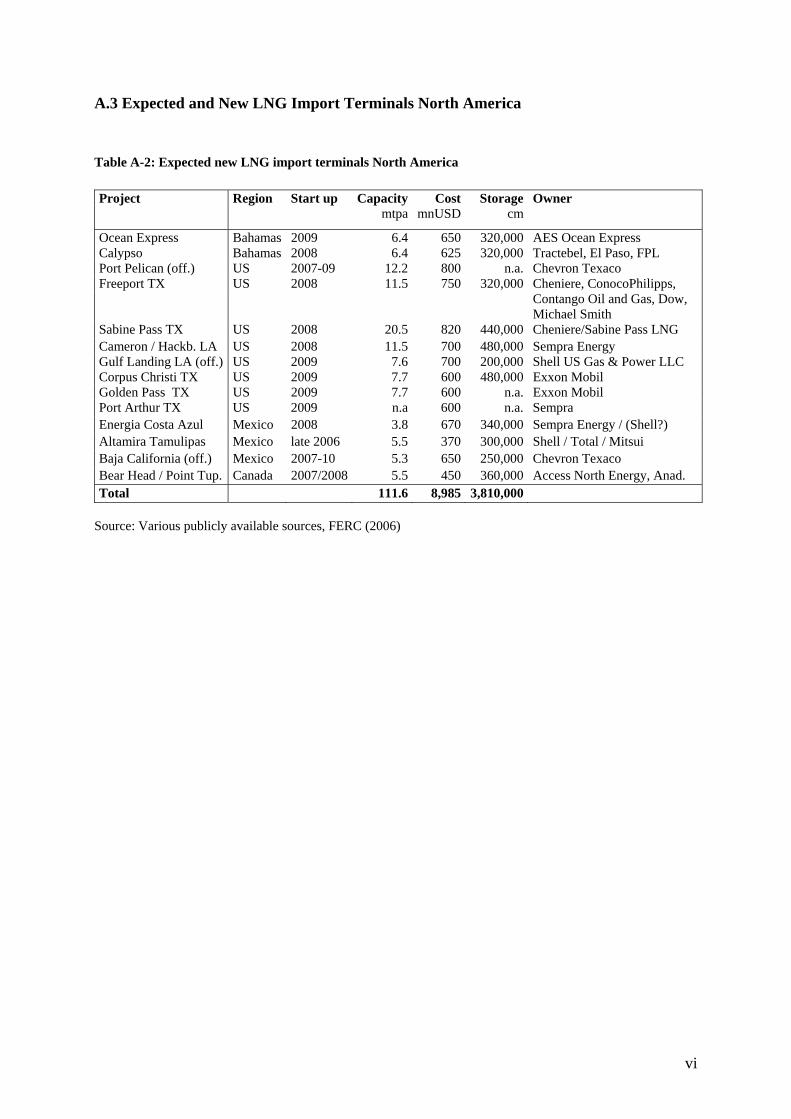
vi
A.3 Expected and New LNG Import Terminals North America
Table A-2: Expected new LNG import terminals North America Project Region Start up Capacity Cost Storage Owner
mtpa mnUSD cm
Ocean Express Bahamas 2009 6.4 650 320,000 AES Ocean Express Calypso Bahamas 2008 6.4 625 320,000 Tractebel, El Paso, FPL Port Pelican (off.) US 2007-09 12.2 800 n.a. Chevron Texaco Freeport TX US 2008 11.5 750 320,000
Cheniere, ConocoPhilipps, Contango Oil and Gas, Dow, Michael Smith
Sabine Pass TX US 2008 20.5 820 440,000 Cheniere/Sabine Pass LNG Cameron / Hackb. LA US 2008 11.5 700 480,000 Sempra Energy Gulf Landing LA (off.) US 2009 7.6 700 200,000 Shell US Gas & Power LLC Corpus Christi TX US 2009 7.7 600 480,000 Exxon Mobil Golden Pass TX US 2009 7.7 600 n.a. Exxon Mobil Port Arthur TX US 2009 n.a 600 n.a. Sempra Energia Costa Azul Mexico 2008 3.8 670 340,000 Sempra Energy / (Shell?) Altamira Tamulipas Mexico late 2006 5.5 370 300,000 Shell / Total / Mitsui Baja California (off.) Mexico 2007-10 5.3 650 250,000 Chevron Texaco Bear Head / Point Tup. Canada 2007/2008 5.5 450 360,000 Access North Energy, Anad. Total 111.6 8,985 3,810,000
Source: Various publicly available sources, FERC (2006)
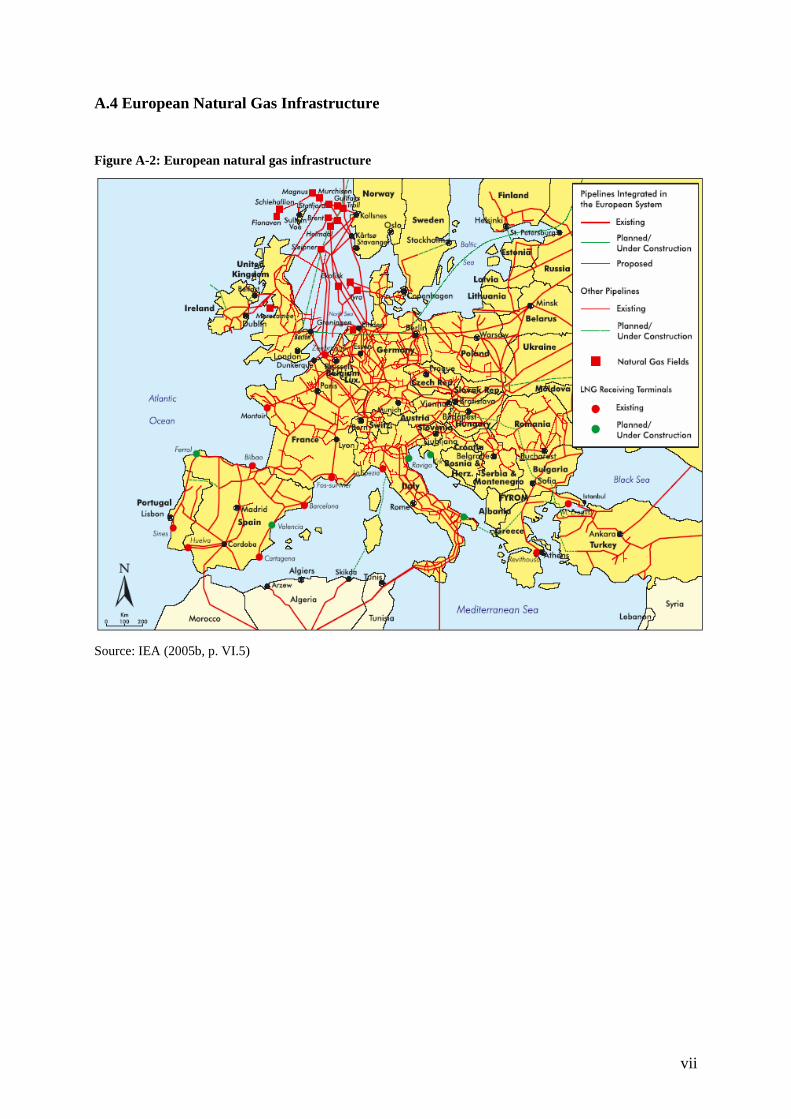
vii
A.4 European Natural Gas Infrastructure
Figure A-2: European natural gas infrastructure
Source: IEA (2005b, p. VI.5)
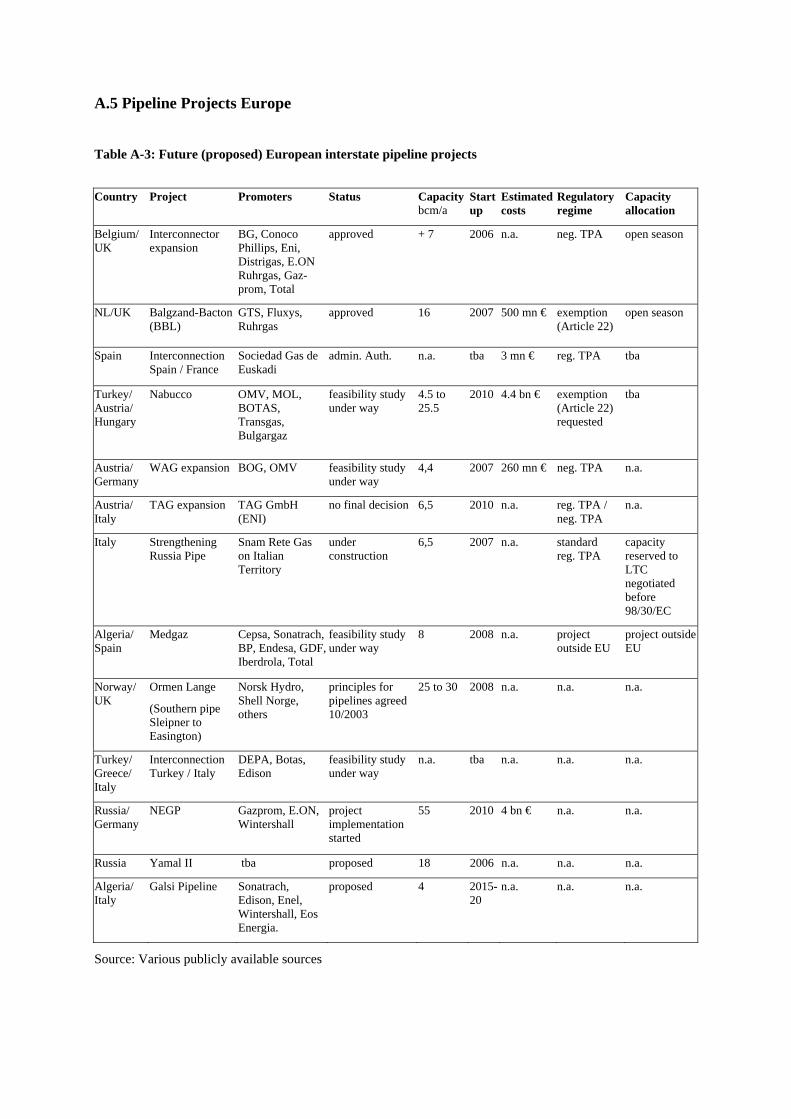
A.5 Pipeline Projects Europe
Table A-3: Future (proposed) European interstate pipeline projects
Country Project Promoters Status Capacity
bcm/a Start up
Estimated costs
Regulatory regime
Capacity allocation
Belgium/ UK
Interconnector expansion
BG, Conoco Phillips, Eni, Distrigas, E.ON Ruhrgas, Gaz-prom, Total
approved + 7 2006 n.a. neg. TPA open season
NL/UK Balgzand-Bacton (BBL)
GTS, Fluxys, Ruhrgas
approved 16 2007 500 mn € exemption (Article 22)
open season
Spain Interconnection Spain / France
Sociedad Gas de Euskadi
admin. Auth. n.a. tba 3 mn € reg. TPA tba
Turkey/ Austria/ Hungary
Nabucco OMV, MOL, BOTAS, Transgas, Bulgargaz
feasibility study under way
4.5 to 25.5
2010 4.4 bn € exemption (Article 22) requested
tba
Austria/ Germany
WAG expansion BOG, OMV feasibility study under way
4,4 2007 260 mn € neg. TPA n.a.
Austria/ Italy
TAG expansion TAG GmbH (ENI)
no final decision 6,5 2010 n.a. reg. TPA / neg. TPA
n.a.
Italy Strengthening Russia Pipe
Snam Rete Gas on Italian Territory
under construction
6,5 2007 n.a. standard reg. TPA
capacity reserved to LTC negotiated before 98/30/EC
Algeria/ Spain
Medgaz
Cepsa, Sonatrach, BP, Endesa, GDF, Iberdrola, Total
feasibility study under way
8 2008 n.a. project outside EU
project outside EU
Norway/ UK
Ormen Lange
(Southern pipe Sleipner to Easington)
Norsk Hydro, Shell Norge, others
principles for pipelines agreed 10/2003
25 to 30 2008 n.a. n.a. n.a.
Turkey/ Greece/ Italy
Interconnection Turkey / Italy
DEPA, Botas, Edison
feasibility study under way
n.a. tba n.a. n.a. n.a.
Russia/ Germany
NEGP Gazprom, E.ON, Wintershall
project implementation started
55 2010 4 bn € n.a. n.a.
Russia Yamal II tba proposed 18 2006 n.a. n.a. n.a.
Algeria/ Italy
Galsi Pipeline Sonatrach, Edison, Enel, Wintershall, Eos Energia.
proposed 4 2015-20
n.a. n.a. n.a.
Source: Various publicly available sources
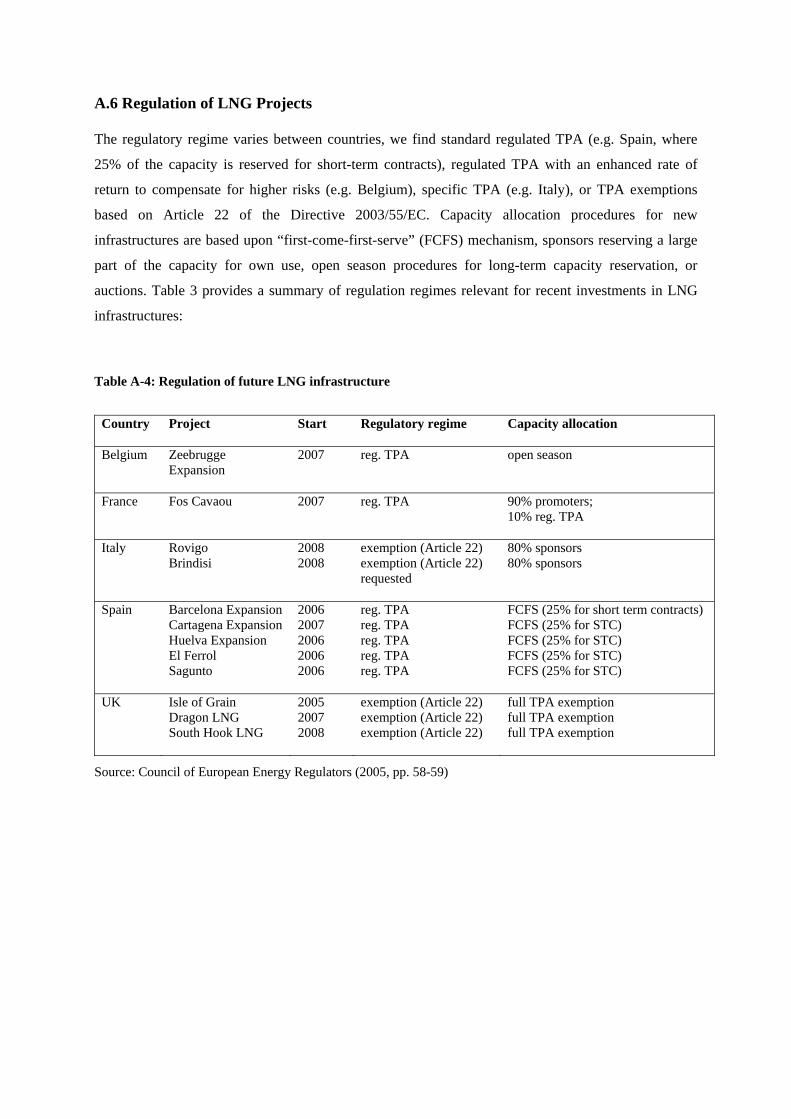
A.6 Regulation of LNG Projects The regulatory regime varies between countries, we find standard regulated TPA (e.g. Spain, where
25% of the capacity is reserved for short-term contracts), regulated TPA with an enhanced rate of
return to compensate for higher risks (e.g. Belgium), specific TPA (e.g. Italy), or TPA exemptions
based on Article 22 of the Directive 2003/55/EC. Capacity allocation procedures for new
infrastructures are based upon “first-come-first-serve” (FCFS) mechanism, sponsors reserving a large
part of the capacity for own use, open season procedures for long-term capacity reservation, or
auctions. Table 3 provides a summary of regulation regimes relevant for recent investments in LNG
infrastructures:
Table A-4: Regulation of future LNG infrastructure
Country Project Start
Regulatory regime Capacity allocation
Belgium Zeebrugge Expansion
2007 reg. TPA open season
France Fos Cavaou
2007 reg. TPA
90% promoters; 10% reg. TPA
Italy
Rovigo Brindisi
2008 2008
exemption (Article 22) exemption (Article 22) requested
80% sponsors 80% sponsors
Spain Barcelona Expansion Cartagena Expansion Huelva Expansion El Ferrol Sagunto
2006 2007 2006 2006 2006
reg. TPA reg. TPA reg. TPA reg. TPA reg. TPA
FCFS (25% for short term contracts) FCFS (25% for STC) FCFS (25% for STC) FCFS (25% for STC) FCFS (25% for STC)
UK Isle of Grain Dragon LNG South Hook LNG
2005 2007 2008
exemption (Article 22) exemption (Article 22) exemption (Article 22)
full TPA exemption full TPA exemption full TPA exemption
Source: Council of European Energy Regulators (2005, pp. 58-59)

x
A.7 Owners and Operators of European National Transmission Pipelines Table A-5: Ownership and operating of European national pipeline grids
Country Ownership Structure 2005
Austria Domestic Transmission pipelines: OMV Gas, EVN, STGW, OÖFG and BEGAS, managed by AGGM (Austrian Gas Grid Management). Transit pipelines operated by OMV Gas and managed by BOG GmbH (WAG), TAG Gmbh (TAG) and OMV Gas (SOL, HAG, PENTA)
Belgium Fluxys
Czech Republic
Single integrated transmission and supply company Transgas and eight regional gas distribution companies with regional monopolies. 2002: 97% of Transgas privatized, sold to RWE GAS
Denmark State-owned DONG
Finland GASUM OY (Fortum (31%), State (24%), OAO Gazprom (25%), E.ON Ruhrgas (20%))
France GDF (partly privatized in June 2005): transmission system except in south-western France, where Total owns and operates the network
Germany Private companies
Greece DEPA (65% state-owned, 35% Hellenic Petroleum, itself 35% state owned).
Hungary MOL Gas Transmission Plc (subsidiary of integrated oil and gas company MOL (12% state-owned))
Ireland Bord Gáis Éireann (state-owned)
Italy All but a few pipelines owned and operated by SNAM Rete Gas. Eni sold some 50% of the company and is required to sell another 30% by 2007. Offshore pipelines considered part of production facilities.
Luxembourg SOTEG (21% State, 20% E.ON-Ruhrgas, 20% ARCELOR (large buyer), 19% by Cegedel (power company), 10% by Saar-Ferngas, and 10 % Société Nationale de Crédit et d'Investissement = main importer of gas, supplies four distribution companies and industrial customers
Netherlands Gas Transport Services B.V. has been the operator of the national gas transmission system since July 2004; independent operator; 100% subsidiary of N.V. Nederlandse Gasunie
Norway Offshore pipelines owned by gas producers (joint ventures, where Gassled is the largest, with more than 90 % of volume)
Poland State-owned Polish Oil and Gas Company; POGC-Transport Ltd. separated from POGC on 1 July 2004
Portugal GALP Transgás (100% Galp Energia which is owned by the State, Italian ENI, EDP, other Portuguese interests and Iberdrola) has concession for supply, transmission and primary distribution of gas into Portugal until 2028.
Slovak Republic
Single, integrated transmission, supply and distribution company called SPP. In 2002, SPP was partially privatised (49%)
Spain ENAGAS, Naturcorp Redes, and other small transport companies. ENAGAS (Free float above 55%. major shareholders include: GAS NATURAL (20.07%), BP (5%)): close to 100% of the high pressure grid
Sweden Owned and partly operated by Nova Naturgas (E.ON Ruhrgas 30%, Statoil 30%, Fortum 20%, DONG 20%)
Switzerland Transitgas, Swissgas and by regional gas companies.
Turkey Botas
UK Main onshore transmission pipeline system owned and operated by Transco, offshore pipeline system owned by producers.
Sources: Cedigaz (2004), various publicly available sources
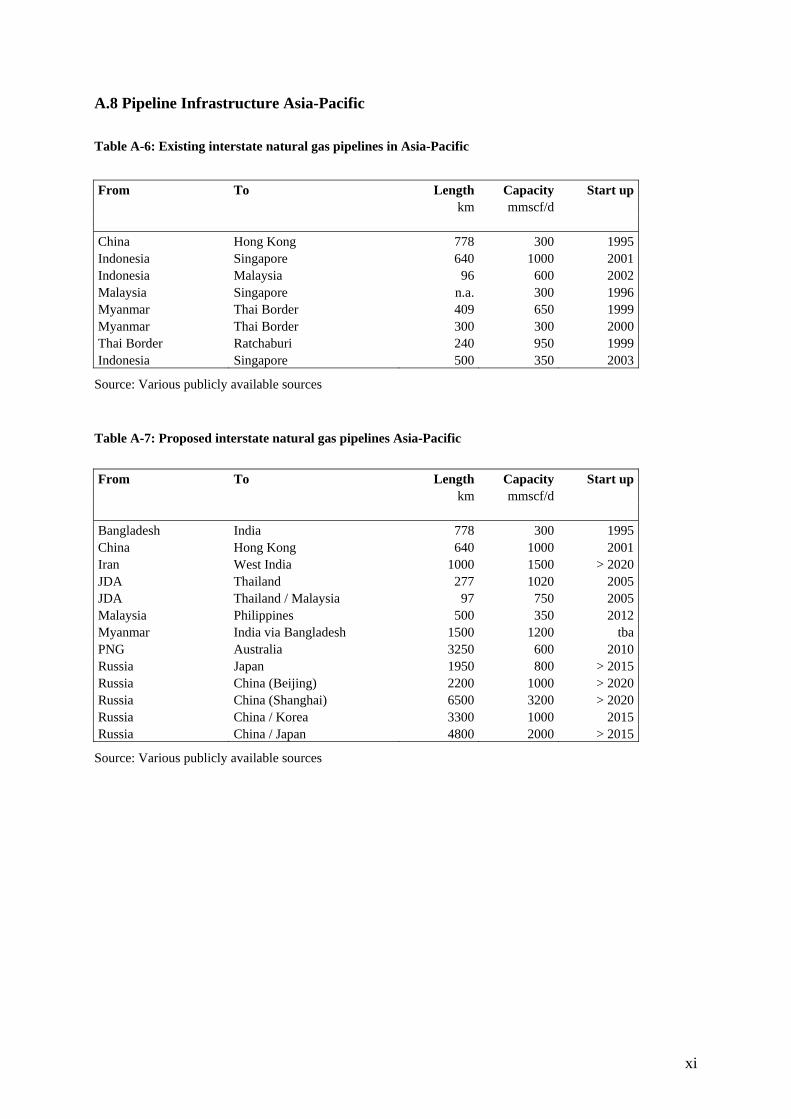
xi
A.8 Pipeline Infrastructure Asia-Pacific Table A-6: Existing interstate natural gas pipelines in Asia-Pacific
From To Length Capacity Start up km mmscf/d China Hong Kong 778 300 1995 Indonesia Singapore 640 1000 2001 Indonesia Malaysia 96 600 2002 Malaysia Singapore n.a. 300 1996 Myanmar Thai Border 409 650 1999 Myanmar Thai Border 300 300 2000 Thai Border Ratchaburi 240 950 1999 Indonesia Singapore 500 350 2003
Source: Various publicly available sources
Table A-7: Proposed interstate natural gas pipelines Asia-Pacific
From To Length Capacity Start up km mmscf/d Bangladesh India 778 300 1995 China Hong Kong 640 1000 2001 Iran West India 1000 1500 > 2020 JDA Thailand 277 1020 2005 JDA Thailand / Malaysia 97 750 2005 Malaysia Philippines 500 350 2012 Myanmar India via Bangladesh 1500 1200 tba PNG Australia 3250 600 2010 Russia Japan 1950 800 > 2015 Russia China (Beijing) 2200 1000 > 2020 Russia China (Shanghai) 6500 3200 > 2020 Russia China / Korea 3300 1000 2015 Russia China / Japan 4800 2000 > 2015
Source: Various publicly available sources

xii
A.9 LNG Import Prices
Figure A-3: LNG Import prices Europe and NBP spot price
0
1
2
3
4
5
6
7
8
9
10
Jan 9
8
Mai 98
Sep 98
Jan 9
9
Mai 99
Sep 99
Jan 0
0
Mai 00
Sep 00
Jan 0
1
Mai 01
Sep 01
Jan 0
2
Mai 02
Sep 02
Jan 0
3
Mai 03
Sep 03
Jan 0
4
Mai 04
Sep 04
Jan 0
5
Mai 05
Sep 05
Jan 0
6
Mai 06
US
D/M
Btu
0
10
20
30
40
50
60
70
80
90
penc
e/th
erm
Belgium Spain Average EU NBP Spot
Source: IEA Energy Prices and Taxes (statistics of 1999 to 2005)
Figure A-4: LNG import prices Asia-Pacific
0
1
2
3
4
5
6
7
8
9
10
Jan 9
8
Mai 98
Sep 98
Jan 9
9
Mai 99
Sep 99
Jan 0
0
Mai 00
Sep 00
Jan 0
1
Mai 01
Sep 01
Jan 0
2
Mai 02
Sep 02
Jan 0
3
Mai 03
Sep 03
Jan 0
4
Mai 04
Sep 04
Jan 0
5
Mai 05
Sep 05
Jan 0
6
USD/
MBt
u
Japan Korea India
Source: IEA Energy Prices and Taxes (statistics of 1999 to 2005)
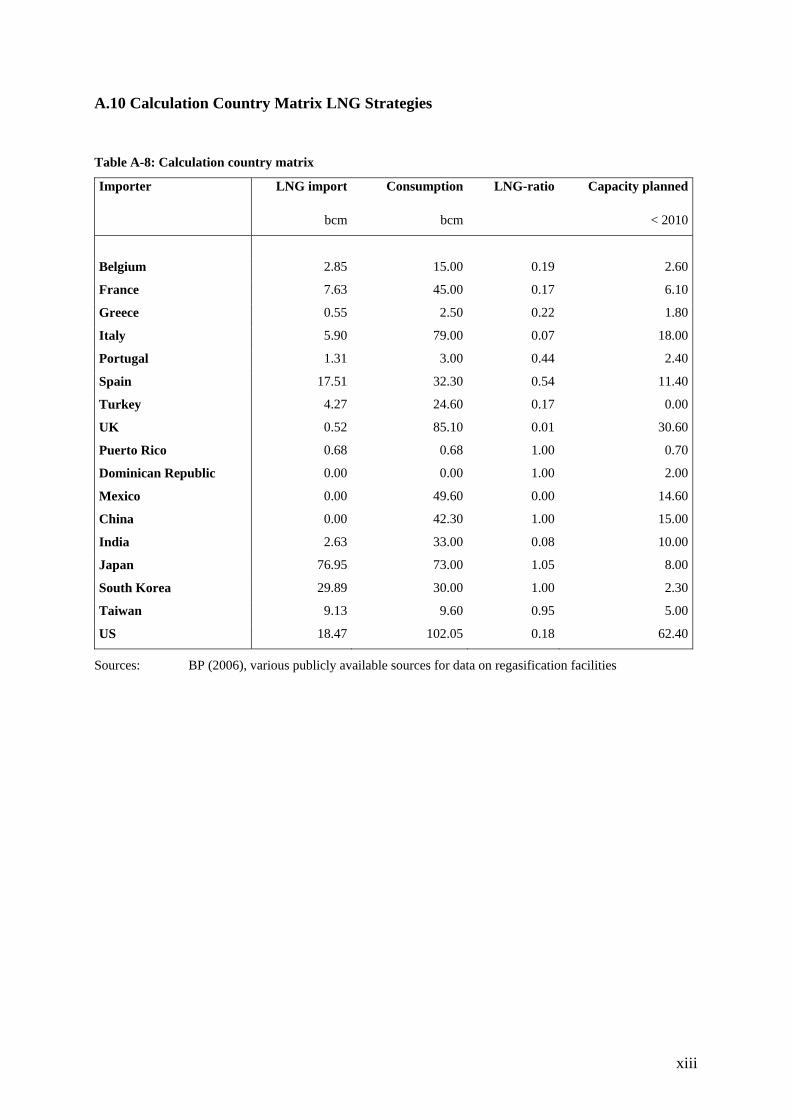
xiii
A.10 Calculation Country Matrix LNG Strategies
Table A-8: Calculation country matrix
Importer LNG import Consumption LNG-ratio Capacity planned
bcm bcm < 2010
Belgium 2.85 15.00 0.19 2.60
France 7.63 45.00 0.17 6.10
Greece 0.55 2.50 0.22 1.80
Italy 5.90 79.00 0.07 18.00
Portugal 1.31 3.00 0.44 2.40
Spain 17.51 32.30 0.54 11.40
Turkey 4.27 24.60 0.17 0.00
UK 0.52 85.10 0.01 30.60
Puerto Rico 0.68 0.68 1.00 0.70
Dominican Republic 0.00 0.00 1.00 2.00
Mexico 0.00 49.60 0.00 14.60
China 0.00 42.30 1.00 15.00
India 2.63 33.00 0.08 10.00
Japan 76.95 73.00 1.05 8.00
South Korea 29.89 30.00 1.00 2.30
Taiwan 9.13 9.60 0.95 5.00
US 18.47 102.05 0.18 62.40
Sources: BP (2006), various publicly available sources for data on regasification facilities
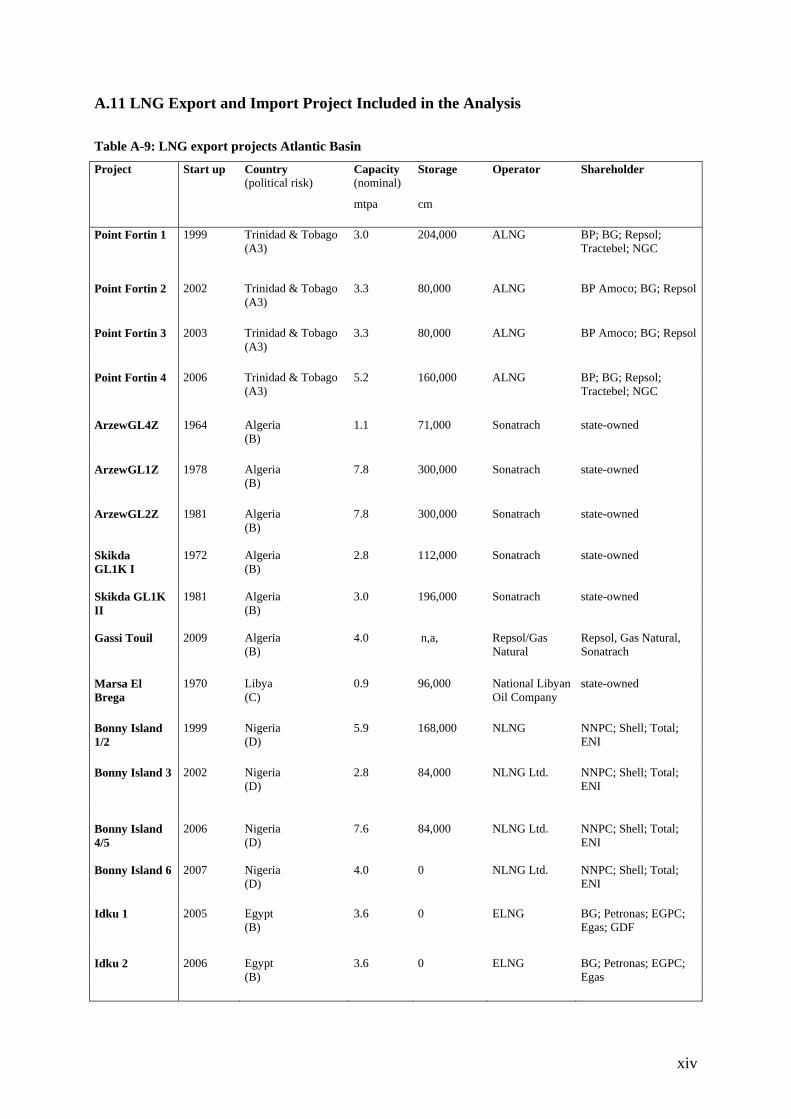
xiv
A.11 LNG Export and Import Project Included in the Analysis Table A-9: LNG export projects Atlantic Basin
Project
Start up Country (political risk)
Capacity (nominal)
Storage Operator Shareholder
mtpa cm Point Fortin 1
1999 Trinidad & Tobago (A3)
3.0 204,000 ALNG BP; BG; Repsol; Tractebel; NGC
Point Fortin 2
2002 Trinidad & Tobago (A3)
3.3 80,000 ALNG BP Amoco; BG; Repsol
Point Fortin 3
2003 Trinidad & Tobago (A3)
3.3 80,000 ALNG BP Amoco; BG; Repsol
Point Fortin 4 2006 Trinidad & Tobago
(A3) 5.2 160,000 ALNG BP; BG; Repsol;
Tractebel; NGC
ArzewGL4Z
1964 Algeria (B)
1.1 71,000 Sonatrach state-owned
ArzewGL1Z 1978 Algeria
(B) 7.8 300,000 Sonatrach state-owned
ArzewGL2Z
1981 Algeria (B)
7.8 300,000 Sonatrach state-owned
Skikda GL1K I
1972 Algeria (B)
2.8 112,000 Sonatrach state-owned
Skikda GL1K II
1981 Algeria (B)
3.0 196,000 Sonatrach state-owned
Gassi Touil
2009 Algeria (B)
4.0 n,a, Repsol/Gas Natural
Repsol, Gas Natural, Sonatrach
Marsa El Brega
1970 Libya (C)
0.9 96,000 National Libyan Oil Company
state-owned
Bonny Island 1/2
1999 Nigeria (D)
5.9 168,000 NLNG NNPC; Shell; Total; ENI
Bonny Island 3
2002 Nigeria (D)
2.8 84,000 NLNG Ltd. NNPC; Shell; Total; ENI
Bonny Island 4/5
2006 Nigeria (D)
7.6 84,000 NLNG Ltd. NNPC; Shell; Total; ENI
Bonny Island 6
2007 Nigeria (D)
4.0 0 NLNG Ltd. NNPC; Shell; Total; ENI
Idku 1
2005 Egypt (B)
3.6 0 ELNG BG; Petronas; EGPC; Egas; GDF
Idku 2
2006 Egypt (B)
3.6 0 ELNG BG; Petronas; EGPC; Egas
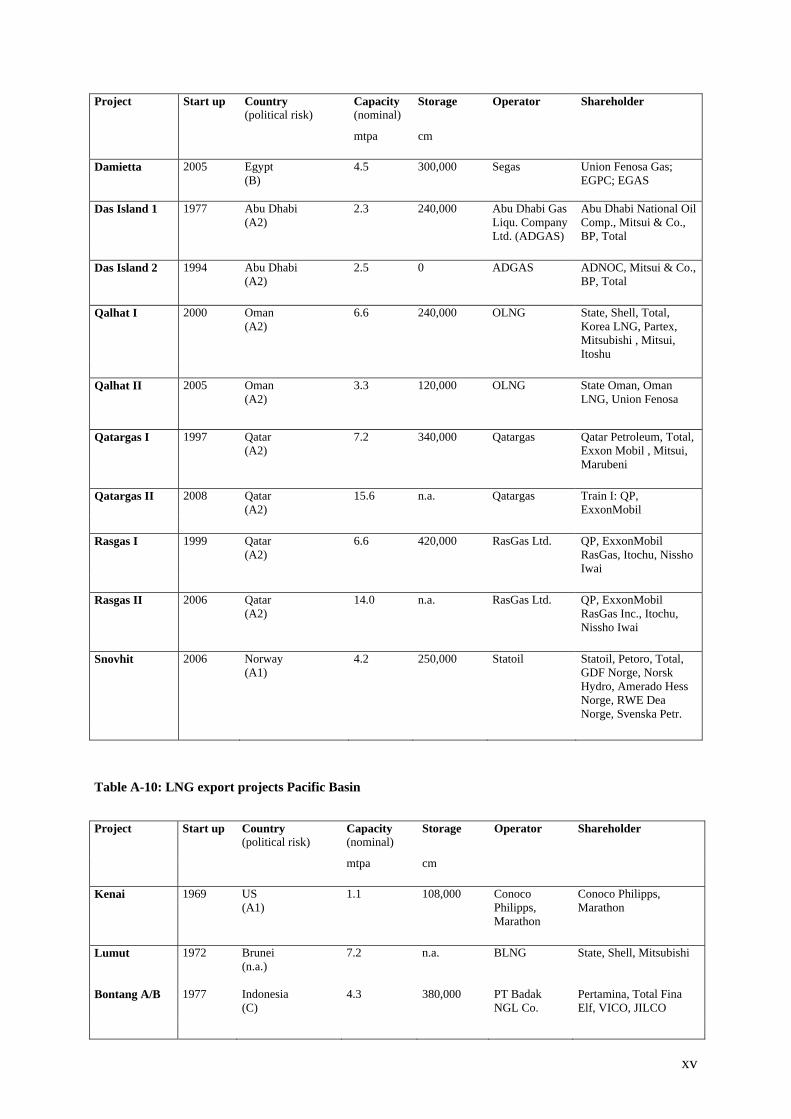
xv
Project
Start up Country (political risk)
Capacity (nominal)
Storage Operator Shareholder
mtpa cm Damietta
2005 Egypt (B)
4.5 300,000 Segas Union Fenosa Gas; EGPC; EGAS
Das Island 1
1977 Abu Dhabi (A2)
2.3 240,000 Abu Dhabi Gas Liqu. Company Ltd. (ADGAS)
Abu Dhabi National Oil Comp., Mitsui & Co., BP, Total
Das Island 2 1994 Abu Dhabi
(A2) 2.5 0 ADGAS ADNOC, Mitsui & Co.,
BP, Total Qalhat I
2000 Oman (A2)
6.6 240,000 OLNG State, Shell, Total, Korea LNG, Partex, Mitsubishi , Mitsui, Itoshu
Qalhat II
2005 Oman (A2)
3.3 120,000 OLNG State Oman, Oman LNG, Union Fenosa
Qatargas I
1997 Qatar (A2)
7.2 340,000 Qatargas Qatar Petroleum, Total, Exxon Mobil , Mitsui, Marubeni
Qatargas II
2008 Qatar (A2)
15.6 n.a. Qatargas Train I: QP, ExxonMobil
Rasgas I
1999 Qatar (A2)
6.6 420,000 RasGas Ltd. QP, ExxonMobil RasGas, Itochu, Nissho Iwai
Rasgas II
2006 Qatar (A2)
14.0 n.a. RasGas Ltd. QP, ExxonMobil RasGas Inc., Itochu, Nissho Iwai
Snovhit
2006 Norway (A1)
4.2 250,000 Statoil Statoil, Petoro, Total, GDF Norge, Norsk Hydro, Amerado Hess Norge, RWE Dea Norge, Svenska Petr.
Table A-10: LNG export projects Pacific Basin
Project
Start up Country (political risk)
Capacity (nominal)
Storage Operator Shareholder
mtpa cm Kenai
1969 US (A1)
1.1 108,000 Conoco Philipps, Marathon
Conoco Philipps, Marathon
Lumut
1972 Brunei (n.a.)
7.2 n.a. BLNG State, Shell, Mitsubishi
Bontang A/B
1977 Indonesia (C)
4.3 380,000 PT Badak NGL Co.
Pertamina, Total Fina Elf, VICO, JILCO
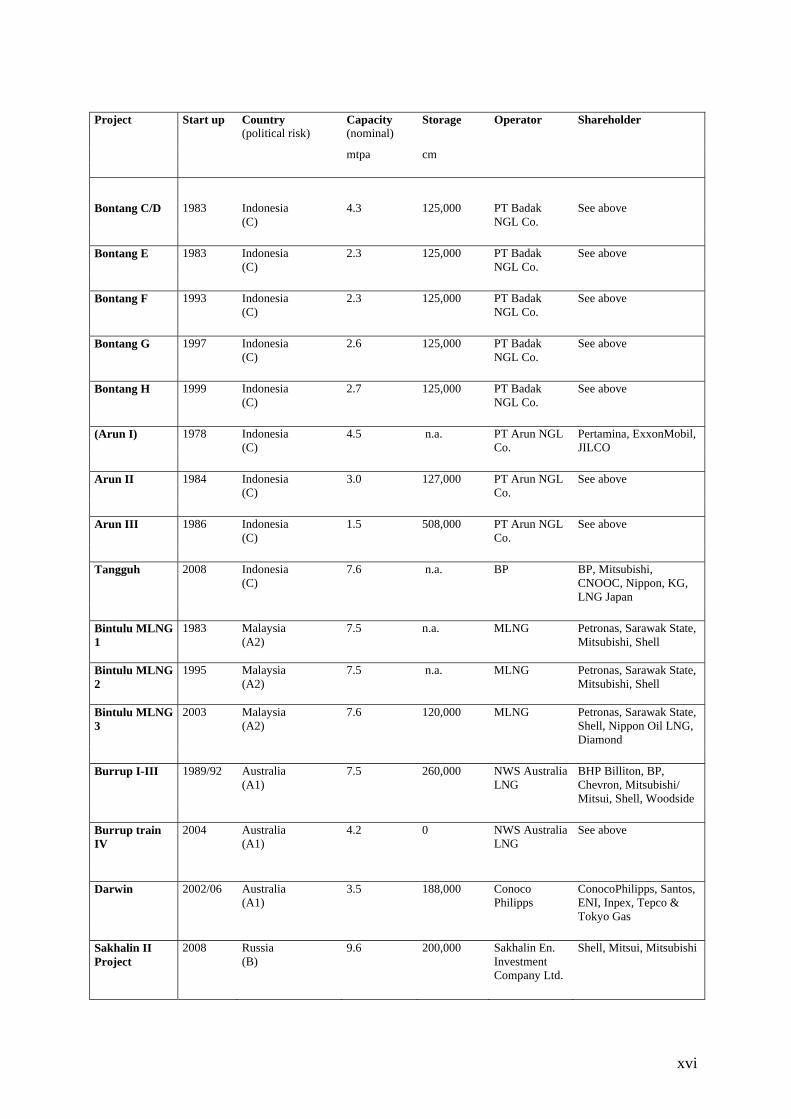
xvi
Project
Start up Country (political risk)
Capacity (nominal)
Storage Operator Shareholder
mtpa cm
Bontang C/D
1983 Indonesia (C)
4.3 125,000 PT Badak NGL Co.
See above
Bontang E
1983 Indonesia (C)
2.3 125,000 PT Badak NGL Co.
See above
Bontang F
1993 Indonesia (C)
2.3 125,000 PT Badak NGL Co.
See above
Bontang G
1997 Indonesia (C)
2.6 125,000 PT Badak NGL Co.
See above
Bontang H
1999 Indonesia (C)
2.7 125,000 PT Badak NGL Co.
See above
(Arun I)
1978 Indonesia (C)
4.5 n.a. PT Arun NGL Co.
Pertamina, ExxonMobil, JILCO
Arun II
1984 Indonesia (C)
3.0 127,000 PT Arun NGL Co.
See above
Arun III
1986 Indonesia (C)
1.5 508,000 PT Arun NGL Co.
See above
Tangguh
2008 Indonesia (C)
7.6 n.a. BP BP, Mitsubishi, CNOOC, Nippon, KG, LNG Japan
Bintulu MLNG 1
1983 Malaysia (A2)
7.5 n.a. MLNG Petronas, Sarawak State, Mitsubishi, Shell
Bintulu MLNG 2
1995 Malaysia (A2)
7.5 n.a. MLNG Petronas, Sarawak State, Mitsubishi, Shell
Bintulu MLNG 3
2003 Malaysia (A2)
7.6 120,000 MLNG Petronas, Sarawak State, Shell, Nippon Oil LNG, Diamond
Burrup I-III
1989/92 Australia (A1)
7.5 260,000 NWS Australia LNG
BHP Billiton, BP, Chevron, Mitsubishi/ Mitsui, Shell, Woodside
Burrup train IV
2004 Australia (A1)
4.2 0 NWS Australia LNG
See above
Darwin
2002/06 Australia (A1)
3.5 188,000 Conoco Philipps
ConocoPhilipps, Santos, ENI, Inpex, Tepco & Tokyo Gas
Sakhalin II Project
2008 Russia (B)
9.6 200,000 Sakhalin En. Investment Company Ltd.
Shell, Mitsui, Mitsubishi
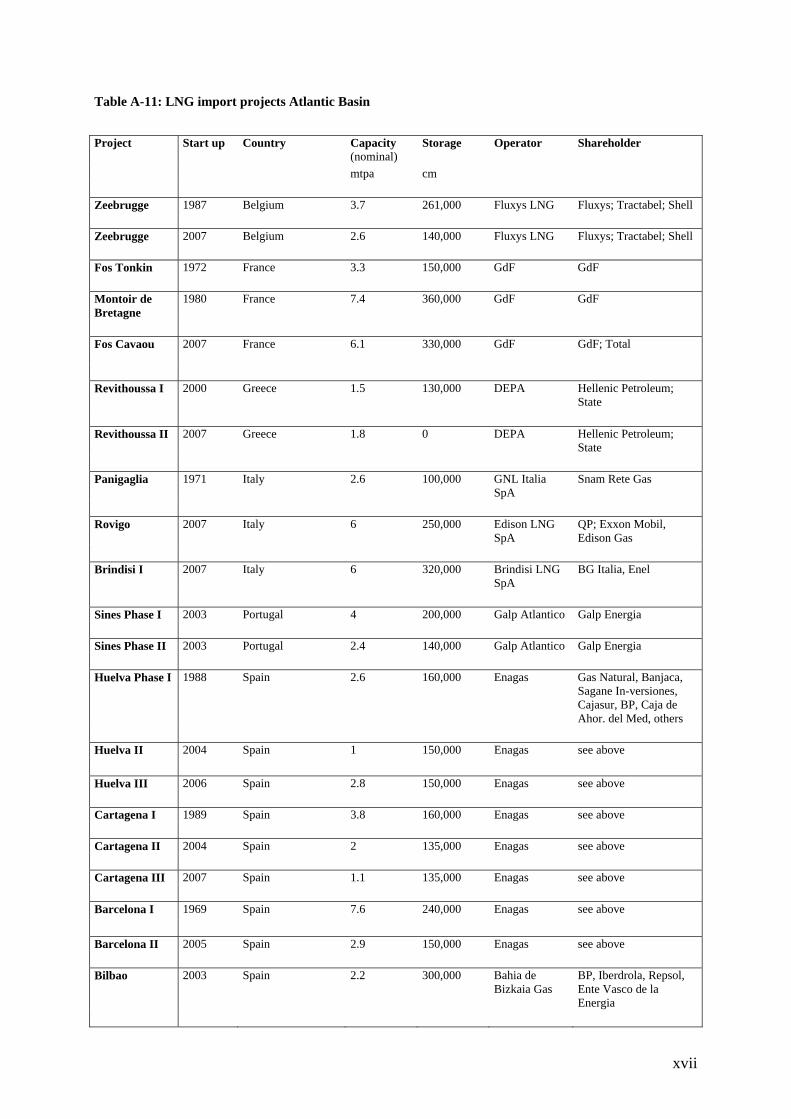
xvii
Table A-11: LNG import projects Atlantic Basin
Project Start up Country Capacity
(nominal) Storage Operator Shareholder
mtpa cm Zeebrugge
1987 Belgium 3.7 261,000 Fluxys LNG Fluxys; Tractabel; Shell
Zeebrugge
2007 Belgium 2.6 140,000 Fluxys LNG Fluxys; Tractabel; Shell
Fos Tonkin 1972 France 3.3 150,000 GdF GdF Montoir de Bretagne
1980 France 7.4 360,000 GdF GdF
Fos Cavaou 2007 France 6.1 330,000 GdF GdF; Total
Revithoussa I
2000 Greece 1.5 130,000 DEPA Hellenic Petroleum; State
Revithoussa II
2007 Greece 1.8 0 DEPA Hellenic Petroleum; State
Panigaglia
1971 Italy 2.6 100,000 GNL Italia SpA
Snam Rete Gas
Rovigo
2007 Italy 6 250,000 Edison LNG SpA
QP; Exxon Mobil, Edison Gas
Brindisi I 2007 Italy 6 320,000 Brindisi LNG
SpA BG Italia, Enel
Sines Phase I 2003 Portugal 4 200,000 Galp Atlantico Galp Energia Sines Phase II 2003 Portugal 2.4 140,000 Galp Atlantico Galp Energia Huelva Phase I
1988 Spain 2.6 160,000 Enagas Gas Natural, Banjaca, Sagane In-versiones, Cajasur, BP, Caja de Ahor. del Med, others
Huelva II 2004 Spain 1 150,000 Enagas see above Huelva III 2006 Spain 2.8 150,000 Enagas see above Cartagena I 1989 Spain 3.8 160,000 Enagas see above Cartagena II 2004 Spain 2 135,000 Enagas see above Cartagena III 2007 Spain 1.1 135,000 Enagas see above Barcelona I 1969 Spain 7.6 240,000 Enagas see above Barcelona II 2005 Spain 2.9 150,000 Enagas see above Bilbao
2003 Spain 2.2 300,000 Bahia de Bizkaia Gas
BP, Iberdrola, Repsol, Ente Vasco de la Energia

xviii
Project Start up Country Capacity
(nominal) Storage Operator Shareholder
mtpa cm Sagunto
2006 Spain 4.8 300,000 Planta de Regasification de Sagunto SA
Union Fenosa Gas; Iberdrola; Endesa; Oman Oil
Marmara Ereglisi
1994 Turkey 4.6 255,000 Botas Turkish Petroleum Corporation
Aliaga
(not operating)
Turkey 3 280,000 Egegaz LNG Colagolu Group
Dragon/ Milford Haven
2007 UK 4.5 336,000 Dragon LNG Ltd.
Petroplus. BG. Petronas
Isle of Grain Phase I
2005 UK 3.5 200,000 Grain LNG Ltd.
National Grid Transco
Isle of Grain II 2008 UK 7 500,000 Grain LNG
Ltd. National Grid Transco
South Hook Phase I
2008 UK 7.8 465,000 South Hook Terminal Company
Exxon Mobil; QP
South Hook Phase II
2010 UK 7.8 310,000 South Hook Terminal Company
Exxon Mobil; QP
Penuelas
2000 Puerto Rico 0.7 160,000 Ecoelectrica LP
JV Edison & Gas Natural
Elba Island I
1978/01 US 3.4 189,000 Southern LNG Co. (El Paso)
El Paso Corp.
Elba Island II
2006 US 5.8 92,400 Southern LNG Co. (El Paso)
El Paso Corp.
Everett/Boston I
1971 US 5.4 155,000 Distrigaz/ Tractebel LNG
Distrigaz/ Tractebel
Everett/Boston II
2006 US 2.6 0 Distrigaz/ Tractebel LNG
Distrigaz/ Tractebel
Lake Charles I
1982 US 4.8 285,000 Trunkline LNG
Southern Union
Lake Charles II
2006 US 4.4 122,000 Trunkline LNG
Southern Union
Cove Point I 1978/03 US 7.7 240,000 Dominion
Resources Dominion
Cove Point II
2007 US 6.1 320,000 Dominion Resources
Dominion
Punta Caucedo
2003 DomRep 2 160,000 AES Corporation
AES Corporation

xix
Project Start up Country Capacity
(nominal) Storage Operator Shareholder
mtpa cm Port Pelican
2007 US 12.2 n.a. Port Pelican LLC
Chevron Texaco
Energia Costa Azul
2008 Mexico 3.8-7.6 340,000 Sempra Energy Sempra
Altamira
2006 Mexico 5.5-9.5 300,000 Terminal de LNG de Altamira
Shell / Total / Mitsui
Baja Cali-fornia Mexico
2010 Mexico 5.3-10.7 250,000 Chevron Texaco
Table A-12: LNG import projects Pacific Basin
Project
Start up Country Capacity (nominal)
Storage Operator Shareholder
mtpa cm
Dahej I
2004 India 5 320,000 Petronet LNG Ltd.(PLL)
Bharat Petroleum, Oil & NG Corp., Indian Oil Corp., Gas Authority India, GDF, RasGas, banks
Kochi
2009 India 2.5 310,000 Petronet LNG Ltd.
see above
Dabhol 2006 India 5 n.a. Ratnagiri Gas
and Power Private ltd.
Gail; National Th. Power Corp.
Hazira 2004 India 2.5 n.a. Hazira LNG &
Ports Shell, Total
Chita I 1977 Japan 7.6 300,000 Chubu Electr./
Toho Gas Chubu Electric/Toho Gas
Chita II 1983 Japan 11.6 640,000 Chita LNG Chubu Electric/Toho
Gas Chita Midorihama
2001 Japan 4.1 200,000 Toho Gas Toho Gas
Fukuoka 1993/95 Japan 0.6 70,000 Saibu Gas Saibu Gas Futtsu 1985 Japan 19.6 860,000 Tokyo Electric Tokyo Electric Hatsukaichi 1996 Japan 0.5 170,000 Hiroshima Gas Hiroshima Gas Higashi-Niigata
1984 Japan 8.5 720,000 Tohoku Electric. Nihonkai
Tohoku Electric, Nihonkai
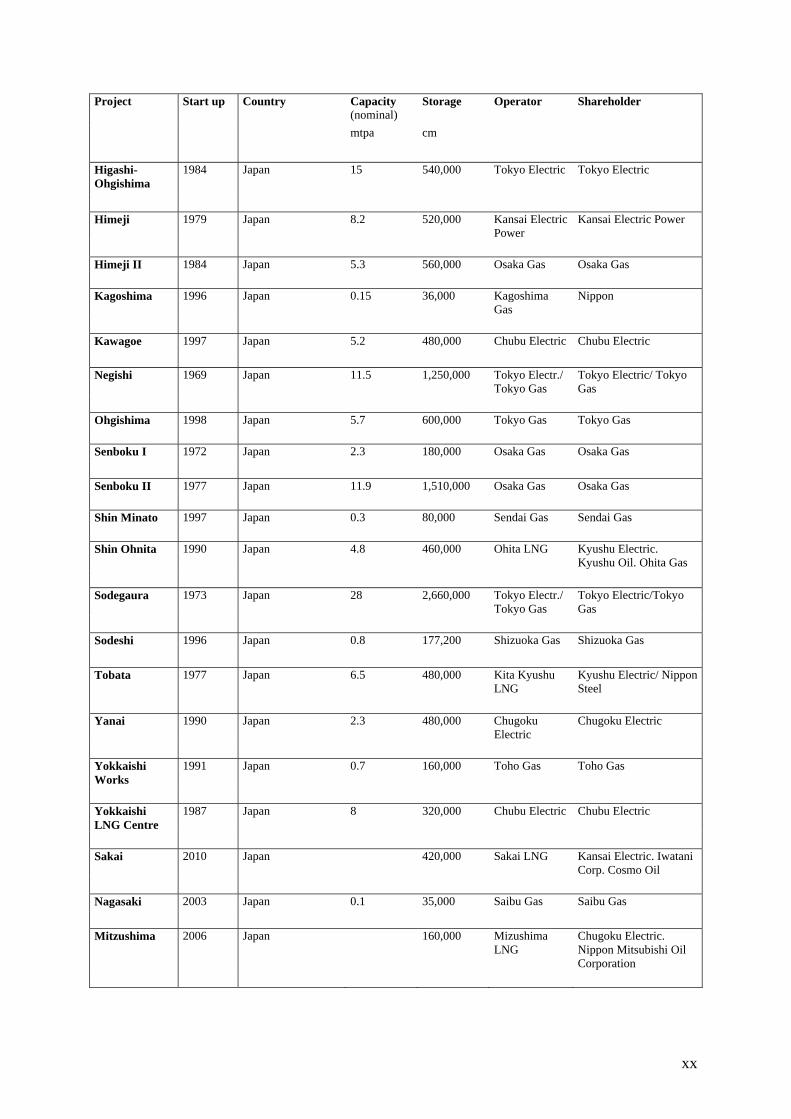
xx
Project
Start up Country Capacity (nominal)
Storage Operator Shareholder
mtpa cm
Higashi-Ohgishima
1984 Japan 15 540,000 Tokyo Electric Tokyo Electric
Himeji 1979 Japan 8.2 520,000 Kansai Electric
Power Kansai Electric Power
Himeji II 1984 Japan 5.3 560,000 Osaka Gas Osaka Gas Kagoshima 1996 Japan 0.15 36,000 Kagoshima
Gas Nippon
Kawagoe 1997 Japan 5.2 480,000 Chubu Electric Chubu Electric
Negishi 1969 Japan 11.5 1,250,000 Tokyo Electr./
Tokyo Gas Tokyo Electric/ Tokyo Gas
Ohgishima 1998 Japan 5.7 600,000 Tokyo Gas Tokyo Gas Senboku I 1972 Japan 2.3 180,000 Osaka Gas Osaka Gas Senboku II 1977 Japan 11.9 1,510,000 Osaka Gas Osaka Gas Shin Minato 1997 Japan 0.3 80,000 Sendai Gas Sendai Gas Shin Ohnita 1990 Japan 4.8 460,000 Ohita LNG Kyushu Electric.
Kyushu Oil. Ohita Gas Sodegaura 1973 Japan 28 2,660,000 Tokyo Electr./
Tokyo Gas Tokyo Electric/Tokyo Gas
Sodeshi 1996 Japan 0.8 177,200 Shizuoka Gas Shizuoka Gas Tobata 1977 Japan 6.5 480,000 Kita Kyushu
LNG Kyushu Electric/ Nippon Steel
Yanai 1990 Japan 2.3 480,000 Chugoku
Electric Chugoku Electric
Yokkaishi Works
1991 Japan 0.7 160,000 Toho Gas Toho Gas
Yokkaishi LNG Centre
1987 Japan 8 320,000 Chubu Electric Chubu Electric
Sakai 2010 Japan 420,000 Sakai LNG Kansai Electric. Iwatani
Corp. Cosmo Oil Nagasaki 2003 Japan 0.1 35,000 Saibu Gas Saibu Gas Mitzushima 2006 Japan 160,000 Mizushima
LNG Chugoku Electric. Nippon Mitsubishi Oil Corporation
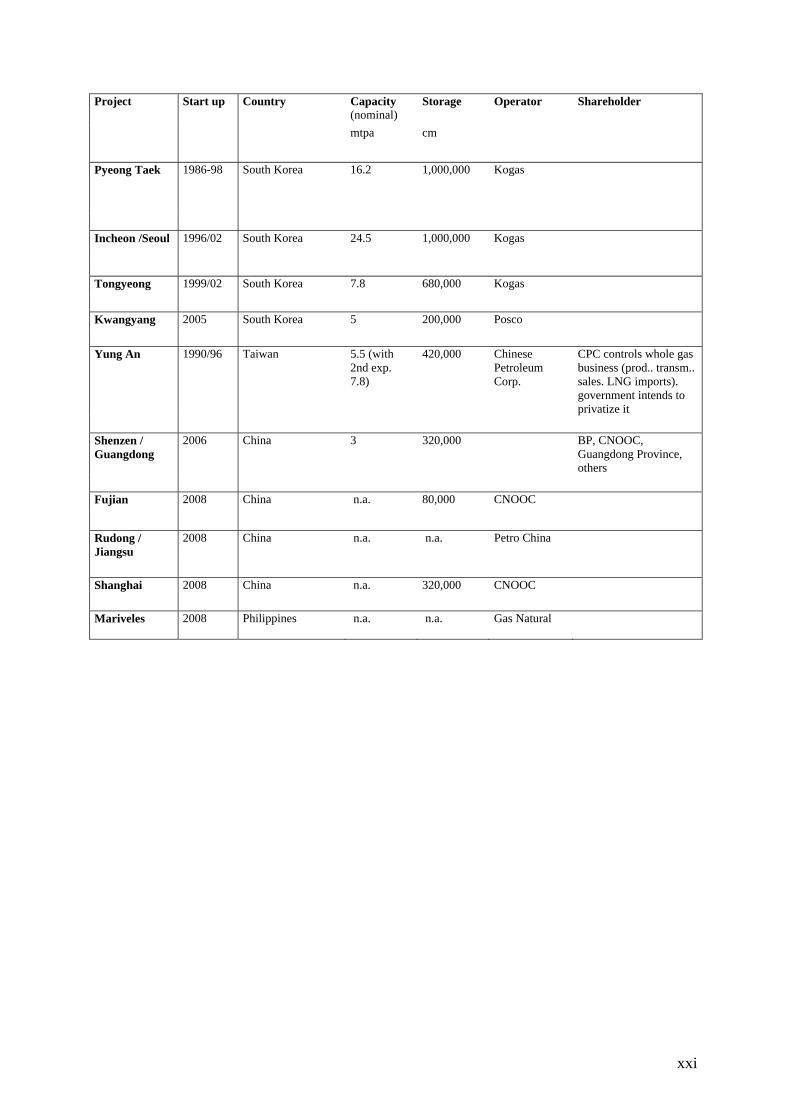
xxi
Project
Start up Country Capacity (nominal)
Storage Operator Shareholder
mtpa cm
Pyeong Taek 1986-98 South Korea 16.2 1,000,000 Kogas
Incheon /Seoul 1996/02 South Korea 24.5 1,000,000 Kogas
Tongyeong 1999/02 South Korea 7.8 680,000 Kogas Kwangyang 2005 South Korea 5 200,000 Posco Yung An
1990/96 Taiwan 5.5 (with 2nd exp. 7.8)
420,000 Chinese Petroleum Corp.
CPC controls whole gas business (prod.. transm.. sales. LNG imports). government intends to privatize it
Shenzen / Guangdong
2006 China 3 320,000 BP, CNOOC, Guangdong Province, others
Fujian 2008 China n.a. 80,000 CNOOC
Rudong / Jiangsu
2008 China n.a. n.a. Petro China
Shanghai 2008 China n.a. 320,000 CNOOC
Mariveles
2008 Philippines n.a. n.a. Gas Natural
A.12 Political Country Risk A political country risk rating published by Coface Country Rating was used since it is available as a
free source and nearly all states part of the analysis are included.43 Coface is a France-based company,
offering firms a number of services helping them to manage, finance, and protect their receivables in
global business-to-business trade: credit information and corporate ratings, receivables management,
credit insurance, and receivables financing. Subsidiaries are active in 58 countries worldwide.
A country rating system allows companies being active in different states to value risks for
investments and exchange relationships. A company’s financial commitments are affected by the local
business environment, economic and political issues.
The rating is based on an ordinal scale with seven stages, distinguishing between “investment grade”
(A1-A4) and “speculative grad” (B, C, and D). The stages are described as follows (see Coface, 2006):
• A1 – “Steady political and economic environment is likely to further the already
excellent payment record of companies. Very low risk probability.”
• A2 – “Political and economic stability is generally good. Although the payment
record of companies is not as good as A1, the risk is still considered low.”
• A3 – “Unfavorable political or economic conditions may lead to a worsening of a
payment record that is lower than that of A1 and A2. However, risk is still considered
low.”
• A4 – “Negative political or economic conditions is likely to worsen a patchy payment
record of companies within this country. However, risk level is considered
acceptable.”
• B – “Unsteady political or economic conditions are likely to worsen an already poor
payment record.”
• C – “Very unsteady political or economic conditions are likely to worsen an already
bad payment record.”
• D – “Extremely unsteady political or economic conditions are likely to worsen an
already very bad payment record.”
To include the ratings into different regressions, the levels have been converted being distributed
between zero and one with equal steps between two stages. Table 15 depicts (converted) country
ratings of in the analysis included states.
43 URL: http://www.cofacerating.com, http://www.trading-safely.com/

xxiv
Table A-13: Political country risk ratings
Country
Political country risk Risk converted
Algeria B 0.666
Australia A1 0.000
Belgium A1 0.000
Canada A1 0.000
China A3 0.333
Dominican Republic C 0.833
Egypt B 0.666
France A2 0.167
Germany A2 0.167
Greece A2 0.167
India A4 0.500
Indonesia C 0.833
Iran C 0.833
Italy A2 0.167
Japan A2 0.167
Korea A2 0.167
Libya C 0.833
Malaysia A2 0.167
Mexico A4 0.500
Nigeria D 1.000
Norway A1 0.000
Portugal A2 0.167
Qatar A2 0.167
Russia B 0.666
Spain A1 0.000
Taiwan A1 0.000
Trinidad & Tobago A3 0.333
Turkey B 0.666
United Arab Emirates A2 0.167
United Kingdom A1 0.000
Unites States of America A1 0.000
Yemen C 0.833
Source: Coface (2006)
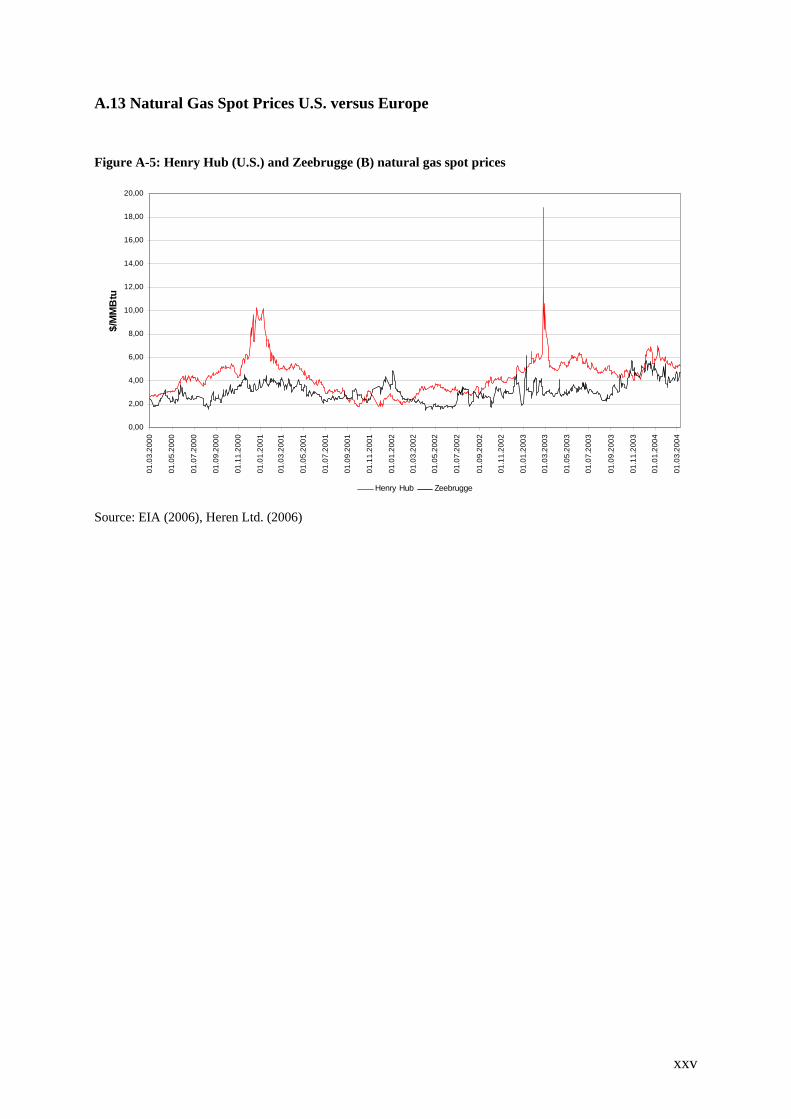
xxv
A.13 Natural Gas Spot Prices U.S. versus Europe
Figure A-5: Henry Hub (U.S.) and Zeebrugge (B) natural gas spot prices
0,00
2,00
4,00
6,00
8,00
10,00
12,00
14,00
16,00
18,00
20,00
01.0
3.20
00
01.0
5.20
00
01.0
7.20
00
01.0
9.20
00
01.1
1.20
00
01.0
1.20
01
01.0
3.20
01
01.0
5.20
01
01.0
7.20
01
01.0
9.20
01
01.1
1.20
01
01.0
1.20
02
01.0
3.20
02
01.0
5.20
02
01.0
7.20
02
01.0
9.20
02
01.1
1.20
02
01.0
1.20
03
01.0
3.20
03
01.0
5.20
03
01.0
7.20
03
01.0
9.20
03
01.1
1.20
03
01.0
1.20
04
01.0
3.20
04
$/M
MB
tu
Henry Hub Zeebrugge Source: EIA (2006), Heren Ltd. (2006)
Related Documents