Corporate Social Responsibility Contracting and Firm Innovation: International Evidence Albert Tsang* Schulich School of Business York University E-mail: [email protected] Kun Tracy Wang Research School of Accounting Australian National University E-mail: [email protected] Simeng Liu Research School of Accounting Australian National University E-mail: [email protected] Li Yu Research Institute of Economics and Management Southwestern University of Finance and Economics E-mail: [email protected] This version: December 2019 Abstract Shareholders have been showing growing interest in including sustainability performance criteria in executive compensation policies. In this study, we examine the relation between the inclusion of corporate social responsibility (CSR) criteria in executive compensation schemes (i.e., CSR contracting) and firm innovation in an international context. Using a large sample of firms from 30 countries, we find that firms with CSR contracting exhibit higher levels of innovation as measured by patents granted and citations received. Moreover, consistent with the argument that CSR contracting complements country-level institutional voids by incentivizing management to implement future-oriented initiatives, we show that CSR contracting has a stronger effect on firm innovation in countries with weaker stakeholder orientation or legal environments. Finally, our results suggest that firms’ CSR contracting and CSR performance have substitutive effects on firm innovation. Overall, this study sheds light on the effect that linking executive compensation to sustainability-oriented CSR criteria has on firm innovation in a global context, which has implications for business practitioners and researchers. Keywords: sustainability; executive compensation; innovation; patent; international ___________________________________________________________________________

Welcome message from author
This document is posted to help you gain knowledge. Please leave a comment to let me know what you think about it! Share it to your friends and learn new things together.
Transcript

Corporate Social Responsibility Contracting and Firm Innovation:
International Evidence
Albert Tsang*
Schulich School of Business
York University
E-mail: [email protected]
Kun Tracy Wang
Research School of Accounting
Australian National University
E-mail: [email protected]
Simeng Liu
Research School of Accounting
Australian National University
E-mail: [email protected]
Li Yu
Research Institute of Economics and Management
Southwestern University of Finance and Economics
E-mail: [email protected]
This version: December 2019
Abstract
Shareholders have been showing growing interest in including sustainability performance
criteria in executive compensation policies. In this study, we examine the relation between the
inclusion of corporate social responsibility (CSR) criteria in executive compensation schemes
(i.e., CSR contracting) and firm innovation in an international context. Using a large sample of
firms from 30 countries, we find that firms with CSR contracting exhibit higher levels of
innovation as measured by patents granted and citations received. Moreover, consistent with
the argument that CSR contracting complements country-level institutional voids by
incentivizing management to implement future-oriented initiatives, we show that CSR
contracting has a stronger effect on firm innovation in countries with weaker stakeholder
orientation or legal environments. Finally, our results suggest that firms’ CSR contracting and
CSR performance have substitutive effects on firm innovation. Overall, this study sheds light
on the effect that linking executive compensation to sustainability-oriented CSR criteria has on
firm innovation in a global context, which has implications for business practitioners and
researchers.
Keywords: sustainability; executive compensation; innovation; patent; international
___________________________________________________________________________

2
1. Introduction
Innovation has long been recognized as a key driver of long-term organizational success and
national economic growth (e.g., Holmström 1989; Grossman & Helpman 1990; Hall et al. 2005; Gu
2005).1 In recent decades, innovation has become an even more important investment for firms due
to rapidly increasing competitive pressure in the domestic and global markets (e.g., Aghion et al.
2005; Aghion et al. 2014). However, although shareholders generally demand firms engage in
innovative activities to maximize firm value in the long term, managers, who usually face short-term
career pressures, tend to avoid future-oriented innovative activities because of their risky and long-
term nature (Narayanan 1985; Holmström 1989; Flammer & Bansal 2017). Anecdotal evidence
provides support to this argument. For example, Graham et al. (2005) find that 78% of their surveyed
executives would sacrifice future-oriented projects with positive net present value to meet their
financial performance targets in the short-turn. Therefore, how to alleviate this agency conflict and
motivate managers to undertake more future-oriented innovation activities is an important question
for both practitioners and researchers. The large body of academic research on innovation conducted
over the past decade also suggests there is an increasing need to understand the factors that drive and
determine innovation (He & Tian 2018).
To overcome the managerial short-termism that prevents managers from investing in projects
that have the potential to create long-term value, a growing number of firms have started to include
social and environmental (or corporate social responsibility, CSR) criteria, such as employee health
and safety, CO2 emissions/water pollution targets, and the inclusion of their securities in socially
responsible indices (e.g., the Dow Jones Sustainability Index, DJSI), in their executive compensation
contracts (Hong et al. 2016; Flammer et al. 2019).2 Generally, this practice is considered a means of
1 For example, studies show that innovation is important for improving firms’ long-term financial performance (e.g.,
Bloom & Van Reenen 2002; Gu 2005; Matolcsy & Wyatt 2008; Burrus et al. 2018), increasing firm value (e.g., Hall et
al. 2005), and developing firms’ competitive advantages (e.g., Porter 1992, 1998). 2 See Appendix A for a detailed example of CSR contracting. Anecdotal evidence suggests that CSR contracting has
become increasingly prevalent and that many companies view the incorporation of CSR criteria in executive
compensation as a good corporate governance practice (Flammer et al. 2019).

3
rewarding CEOs for implementing sustainability-oriented CSR initiatives. Consistent with the view
that CSR contracting mitigates corporate short-termism, Flammer et al. (2019) show that the adoption
of CSR contracting improves the CSR performance and value of firms.3
Although numerous studies have examined the effect of incorporating financial and stock
performance targets in executive compensation on managerial behavior such as firm innovation (e.g.,
Murphy & Gibbons 1992; Lerner & Wulf 2007; Baranchuk et al. 2014; Flammer & Bansal 2017;
Mao & Zhang 2017), very little is known about whether and how the integration of nonfinancial CSR
performance measures in executive compensation affects firm innovation. Moreover, compared to
the traditional long-term pay-for-financial-performance compensation schemes that tend to mix
forward-looking features with earnings or stock price targets, contracting on nonfinancial CSR
criteria tends to provide a less noisy and more explicit reflection of long-term strategies (Bushman
et al. 1996; Ittner et al. 1997; Dikolli & Vaysman 2006; Matĕjka et al. 2009). Thus, the primary
objective of this study is to empirically examine how the adoption of this emerging yet increasingly
popular compensation practice, which aims to link executive pay to nonfinancial CSR performance
(i.e., CSR contracting), affects firm innovation.
Despite the increasing trend in the use of CSR contracting in recent years, it remains unclear
whether and how CSR contracting affects firm innovation. Competing predictions can be drawn from
the research on the relationship between CSR and firm innovation. For instance, some studies
propose that an increased commitment to more responsible practices fosters corporate innovation by
reducing managerial short-termism stemming from the desire to achieve the short-term financial
goals demanded by more prominent stakeholders, such as customers and shareholders (e.g., Chen et
al. 2016a; Chen et al. 2016b; Flammer & Kacperczyk 2016; Flammer et al. 2019). However, other
studies suggest that a greater focus on a firm’s less direct stakeholders, such as the environment, local
3 This emerging compensation practice of including CSR-related criteria in executive compensation is commonly referred
to as “CSR contracting,” “CSR-based compensation,” and “pay for social and environmental performance” by
practitioners and academics (Flammer et al. 2019). In this study, we use these terms interchangeably.

4
community, and employees, hinders the firm’s ability to invest in firm innovations that have the
potential to maximize shareholder value (e.g., Manchiraju & Rajgopal 2017; Chen et al. 2018).
Moreover, although a number of studies have shown that country-level institutional
characteristics play an important role in firms’ CSR performance (Dhaliwal et al. 2012; Ioannou &
Serafeim 2012; Dhaliwal et al. 2014; El Ghoul et al. 2017; Marano et al. 2017; Liao et al. 2019),
which suggests that the effect of CSR contracting may vary across countries, to the best of our
knowledge, no studies have explored the heterogeneity in the consequences of CSR contracting
across countries. This gap is surprising given that firms in many countries have started to link
executive/employee remuneration to performance on social and environmental issues (Velte 2016;
Burchman & Sullivan 2017).4 Our study aims to fill this gap in the literature. Thus, as a second
research objective, we further examine whether and how the relation between CSR contracting and
firm innovation varies with country-level institutional characteristics related to stakeholder
orientation and the legal environment. Studies have shown that these two major country-level
institutional variables have significant effects on firms’ CSR performance (e.g., Dhaliwal et al. 2012;
Dhaliwal et al. 2014; Ioannou and Serafeim 2012).
Using a novel database on CSR contracting and a comprehensive sample of publicly listed
firms in 30 countries, we test these competing predictions on the relation between CSR contracting
and firm innovation. After controlling for year-, industry-, and country-fixed effects and a vector of
firm-, industry-, and country-level factors that have been shown to have potential effects on firm
innovation, we find a significantly positive relation between CSR contracting and firm innovation
measured by the patents granted and citations received. The results of additional tests using a
4 For example, evidence from the 2013 KPMG Survey of Corporate Responsibility Reporting
(https://assets.kpmg/content/dam/kpmg/pdf/2013/12/corporate-responsibility-reporting-survey-2013.pdf) suggests that
more than 10% of the world’s largest companies (G250) currently provide a clear explanation in their CSR reporting of
how remuneration is linked to CSR performance (see “Linking CSR performance with pay sends clear sustainability
signal,” available at https://www.theguardian.com/sustainable-business/linking-csr-pay-sustainability). In recent years,
increasing numbers of companies have begun to link executive pay to CSR performance (see, for example,
https://www.wsj.com/articles/more-companies-link-executive-pay-to-sustainability-targets-11561379745).
5
difference-in-differences (DID) model and focusing on first-time CSR contracting lend further
support to the positive effect of CSR contracting on firm innovation.
Our results are robust to an array of additional tests including tests accounting for the potential
large sample bias and the truncation bias of the innovation variables, and the use of alternative
innovation and CSR contracting measures. We also conduct additional tests to reduce the concern
that the positive relation between CSR contracting and innovation is driven by a change of CEO, the
effect of non-CSR-related compensation schemes, and heterogeneity in corporate governance
attributes across firms. Furthermore, we use multiple approaches to address endogeneity concerns
relating to unobserved firm characteristics, including the use of a propensity score matched sample
obtained by matching CSR contracting adopters with non-adopters to increase the comparability
between the two groups, controlling firm fixed effects to account for all time-invariant firm-specific
factors, and the use of a DID method to account for the temporal variation in innovation that is not
attributable to the adoption of CSR contracting. A Heckman-type correction is also performed using
a two-stage Heckman model to mitigate potential sample selection bias.
Having established a robust positive relation between CSR contracting and firm innovation,
we next explore whether and how this positive relation varies with country-level institutional
characteristics. Consistent with the argument that CSR contracting complements country-level
institutional voids by incentivizing management to implement sustainability-oriented initiatives, we
show that the effect of CSR contracting on firm innovation is stronger in countries with weaker
stakeholder orientation or legal environments. Finally, given that both CSR contracting and CSR
performance are likely to be positively related to firm innovation, in an additional test, we further
explore whether CSR contracting and CSR performance substitute or complement each other in terms
of their effect on firm innovation. Our results indicate that a firm’s CSR contracting and CSR
performance act as substitutes in terms of their effects on firm innovation.

6
Our study contributes to the literature in several ways. First, the literature on compensation
focuses on the effects of long-term financial and equity-based executive incentives in encouraging
innovation, in view that these types of compensation are likely to mitigate managerial myopia, and
thereby encourage managerial risk-taking and align managerial interests with the creation of long-
term shareholder value (e.g., Dechow & Sloan 1991; Murphy & Gibbons 1992; Holthausen et al.
1995; Lerner & Wulf 2007; Xue 2007; Francis et al. 2011; Sheikh 2012; Flammer & Bansal 2017;
Nguyen 2018).5 Our study adds to this growing body of literature on the relation between managerial
compensation schemes and firm innovation by examining the relation between the inclusion of
nonfinancial sustainability-oriented CSR criteria in executive compensation schemes and innovation.
Second, the literature on CSR generally indicates that improved CSR performance and
stakeholder engagement lead to enhanced firm innovation (e.g., Wagner 2010; Bocquet et al. 2013;
2017; Kim et al. 2014; Luo & Du 2015; Flammer & Kacperczyk 2016; Cook et al. 2019). However,
few studies have examined how to incentivize managers to implement sustainability-oriented CSR
initiatives by crafting appropriate executive compensation contracts that, in turn, affect firm
innovation. As such, our study contributes to the literature by showing that the inclusion of CSR
criteria and targets in executive compensation schemes provides an effective incentive to motivate
managers to invest in long-term value maximization activities, and in turn fosters firm innovation.6
Finally, the increasing awareness of the importance of CSR performance for firms and the
growing significance of CSR as a corporate investment have raised the fundamental question of
whether CSR enhances shareholder value. Although a substantial number of studies have examined
this question from different perspectives, the evidence is conflicting. For example, while a number
5 Other studies, such as Sauermann and Cohen (2010), Change et al. (2015), and Jia et al. (2016), have also examined the
roles that non-CEO executives’ incentive designs and lower-ranked employees play in encouraging firm innovation. 6 Related to our study, in a U.S. setting, Flammer et al. (2019) find that the adoption of CSR contracting is conducive to
environmentally friendly innovation, measured as the proportion of green patents relative to total patents generated by
the firm. Although their research focuses on green innovation using a sample of large U.S. firms, our study sheds light
on the role of CSR contracting in promoting the overall quantity and quality of innovation and more importantly
demonstrates the cross-national differences in CSR contracting in a global context.

7
of studies have found a positive relationship between CSR performance and firm financial
performance (e.g., Orlitzky et al. 2003; Deng et al. 2013; Ferrell et al. 2016), other studies have found
evidence supporting CSR as a potential agency cost that has the potential to undermine shareholder
value (e.g., Krüger 2015; Masulis & Reza 2015).
Motivated by these conflicting findings, studies have started to examine how contextual factors
affect the relationship between CSR and firm value. For instance, Dhaliwal et al. (2011) suggest that
an important contextual factor influencing the relation between CSR performance and the cost of
equity capital is the presence of voluntary CSR disclosure. That is, CSR reporting firms with superior
CSR performance are more likely to be associated with a significantly lower cost of equity capital.
Similarly, Tsang et al. (2019b) show that the issuance of integrated reporting (i.e., disclosures that
integrate financial and non-financial CSR information) moderates the relation between CSR
performance and firm value. Lins et al. (2017) find that the financial performance implications of
CSR performance can vary across time. Specifically, they show that CSR performance can generate
more value during financial crises (i.e., when the overall level of trust in corporations and markets is
low). Thus, our finding of a substitutive effect between CSR performance and CSR contracting
contributes to the debate by demonstrating the potential role that CSR contracting can play in the
relation between CSR performance and firm innovation.
Our study also has practical implications for business practitioners, such as controlling
shareholders and board of directors, in terms of how to design appropriate executive compensation
schemes to effectively motivate managers to engage in firm innovation and long-term value creation.
Our results highlight that CSR contracting, as an emerging corporate governance mechanism, can be
used to stimulate firm innovation, especially for firms with fewer future-oriented initiatives and firms
domiciled in countries with weaker stakeholder orientation or legal environments.
The remainder of this study is organized as follows. In Section 2, we develop two competing
hypotheses on the relation between CSR contracting and firm innovation. Section 3 describes the

8
research design, including the sample selection, model specification, and variable construction.
Section 4 presents the sample distribution, summary statistics, and empirical results of the hypothesis
tests and robustness checks. In Section 5, we perform additional tests to further explore the relation
of interest. Finally, Section 6 concludes the study.
2. Related Literature and Hypotheses Development
In recent years, there have been a number of significant environmental, regulatory, and social
developments in countries around the world. For example, publicly listed Indian firms are now
required to spend at least 2% of their net income on CSR (Manchiraju & Rajgopal 2017). Moreover,
countries such as China, Denmark, Malaysia, and South Africa have introduced regulations requiring
firms to conduct CSR reporting (Ioannou & Serafeim 2017). With the growing acceptance of
sustainability as an important driver of business value, many firms have started to integrate CSR
criteria in their executive compensation packages to ensure that the notion of sustainability is
effectively embedded with the organization (Forbes 2010; E&Y 2010; GreenBiz 2015).7 CSR-based
executive compensation generally links executive compensation to the performance of a wide range
of stakeholder-friendly initiatives. This compensation practice tends to focus on the interests of
different non-shareholder stakeholders, such as employees, customers, the community, and the
environment, by setting managerial targets to address their needs.8
7 For example, shareholder proposal No. 6 in the 2018 proxy ballot of United Parcel Service, Inc. (UPS) states,
“Shareholders request the Board Compensation Committee prepare a report assessing the feasibility of integrating
sustainability metrics into the performance measures of senior executives under the Company’s compensation incentive
plans.” This proposal is supported by the investors’ belief that “Linking executive compensation and sustainability would
help position UPS for sustainability leadership and drive improvement on challenges that our Company has defined as
material.” Available at http://www.investors.ups.com/node/25326/html. 8 For example, the Netherlands’ international energy enterprise Shell PLC links 20% of its executives’ annual bonuses
and 10% of their long-term incentive plans to sustainable development, especially in relation to carbon reduction (Royal
Dutch Shell Plc 2018). Similarly, the U.S multinational retail corporation Walmart Inc. links its executives’ annual
incentives with diversity/inclusion and ethics/compliance goals (Walmart Inc. 2019). Xcel Energy links its annual
incentive awards for executives to environmental (e.g., greenhouse gas reduction goals) and social metrics (e.g.,
employee safety) (Xcel Energy 2011).

9
Survey evidence further suggests that the practice of linking sustainability objectives to
executive compensation (i.e., the adoption of CSR contracting) has become a global trend. For
example, a survey of the constituents of the indices in 11 global markets, including the U.S., U.K.,
Australia, France, Germany, and the Netherlands, found that 42% of the companies studied provided
a link between sustainability and executive compensation (Glass Lewis 2010). Supporting the
growing prevalence of CSR contracting, our sample from a large number of countries shows that
while less than 5% of firms globally used explicit CSR contracting in 2004, the ratio increased to
more than 14% in 2015.
As a typical long-term investment activity, innovation can improve firms’ financial
performance and long-term firm value (Gu 2005; Hall et al. 2005; Matolcsy & Wyatt 2008). In this
section, we develop two competing hypotheses on the relation between the adoption of CSR
contracting and firm innovation. Agency theory suggests that managers tend to underinvest in
innovative activities in consideration of the long investment horizons and high failure rates of
innovation (Baysinger et al. 1991; Holmström 1989, 1999; Frederick et al. 2002; Ferreira et al. 2014).
Although shareholders care about firms’ long-term performance, managers tend to be more myopic
and focus excessively on short-term results because of their career concerns (Narayanan 1985; Stein
1989; Degeorge et al. 1999). Thus, the short-termism of managers could induce them to invest in
projects with short-term payoffs at the cost of valuable long-term projects such as innovative
activities, even if the latter are expected to yield higher returns (Stein 1989; Holmström 1999).
Research shows that CSR contracting mitigates managers’ short-termism and fosters long-term
orientation (Matĕjka et al. 2009; Flammer et al. 2019). Thus, the managers of firms that implement
this compensation practice are likely to divert their attention from short-term financial gain to longer-
term value creation, and are thereby likely to engage in more future-oriented investment projects
(Dikolli & Vaysman 2006; Matĕjka et al. 2009). In line with this, it is likely that firms that include
CSR criteria in their executive compensation schemes will place greater emphasis on sustainability-
10
oriented investments that are valuable to the shareholders over the long term and subsequently
undertake more future-oriented innovation activities.
Although in our study, we argue that CSR contracting incentivizes managers to increase their
investment in CSR performance, which in terms creates a positive externality on shareholders’ value
by fostering future-oriented innovation activities, it could be argued that improvements in CSR
performance have little impact on firms’ innovation. This argument is plausible especially given that
CSR activities are more likely to be associated with the interests of non-shareholder stakeholders
than shareholders. However, it is worth noting that greater effort to improve CSR performance can
also directly affect shareholders’ value through its direct effect on firms’ innovation outcomes. For
example, Ryou et al. (2019) suggest that CSR activity can be considered as a type of product
innovation (e.g., the creation of new socially responsible product features or categories) and process
innovation (e.g., the use of socially responsible production processes). 9 In a similar vein, Flammer
et al. (2019) show that the adoption of CSR contracting leads to increased green innovation.
Thus, to the extent that integrating CSR criteria in executive compensation can have a positive
effect in fostering executives’ long-term orientation, which is essential for innovation, we posit that
the adoption of CSR contracting likely fosters firms’ innovation success. Accordingly, we state our
first hypothesis formally as follows.
Hypothesis 1a. CSR contacting has a positive impact on firm innovation.
Alternatively, integrating CSR criteria in executive compensation may have a non-significant
or even a negative impact on firm innovation. First, CSR-based compensation may merely serve as
a symbolic component that has no substantial influence on managers’ behavior (Westphal & Zajac
1994; Zajac & Westphal 1995). For example, executive compensation mainly comprises a fixed
9 According to the Thomson Reuters ASSET4 database, “Product Innovation” is a major category for measuring firms’
CSR performance. Specifically, the product innovation category measures a firm’s commitment to and effectiveness in
supporting research and development on eco-efficient products, technologies, and services.

11
salary with contingent payments linked to the firm’s financial performance, and CSR contracting
may only represent a small proportion of the overall compensation and may be too trivial to influence
managers’ business decisions or effectively divert their attention toward long-term investments in
areas such as innovation. Moreover, executives who have a substantial influence over their boards
may take the initiative to use CSR contracting to enhance the legitimacy of their formal compensation
contracts and improve shareholders’ impressions of them and the firm (Tedeschi & Reiss 1981;
Schlenker 1980). In this case, the adoption of CSR contracting would be expected to have no effect
on firm innovation.
Second, even if CSR contracting contributes to enhanced stakeholder engagement, the role that
better stakeholder engagement plays in firm innovation is unclear. For example, it is possible that
enhanced stakeholder engagement entrenches the roles of executives and employees by increasing
their job security and reducing the likelihood of dismissal (Cespa & Cestone 2007), which in turn
would reduce their incentives for innovation. It is also possible that an improved relationship between
managers and employees would result in the managers and employees enjoying the “quiet life” with
reduced incentives for undertaking risky activities such as innovation (Bertrand & Mullainathan
2003).
Third, according to Friedman (1970), a firm’s commitment to its stakeholders may draw limited
and valuable resources away from activities that maximize profits and shareholder value. That is, a
greater focus on the firm’s nonfinancial CSR performance as a result of CSR contracting may divert
limited financial, human, and physical resources from innovation activities to CSR investment,
thereby reducing the firm’s innovation success. Supporting this view, studies have shown that greater
CSR investment and more CSR reporting requirements hinder firms’ profitability and shareholders’
value (Manchiraju & Rajgopal 2017; Chen et al. 2018).
Finally, Hubbard et al. (2017) show that investments in CSR initiatives can expose the CEOs
of firms with poor financial performance to a greater risk of dismissal. Although the long-term returns

12
on firms’ innovation investments are unlikely to be certain, it is more certain that the firms would
need to make substantial investments in innovation in the short term which may hinder firms’
financial performance. Thus, it is possible that managers may reduce their investments in innovation
to reduce their career concerns when they are required to place greater emphasis on CSR performance,
for instance, through the integration of CSR criteria in executive compensation schemes.
Taken together, these discussions suggest that CSR contracting may hinder firms’ innovation.
Accordingly, we state the alternative hypothesis formally as follows:
Hypothesis 1b. CSR contracting has a negative (or no) impact on firm innovation.
3. Research Design
3.1 Sample selection and data collection
We begin our sample selection by first obtaining information about firms’ executive
compensation policies and CSR performance from the Thomson Reuters ASSET4 database. Our
sample period starts from 2004 because this is the first year that ASSET4 provides global coverage
of executive compensation policy data on whether a firm includes CSR criteria in executive
performance evaluation. As research suggests that there is generally a lag (e.g., one to two years)
between the filing year and the actual grant year of patents (Hall et al. 2001; Fang et al., 2014; Zhong
2018), we end our CSR contracting sample in 2015 to ensure that the patent data are available in the
two-year leading period of each sample year. Next, we merge the compensation data from ASSET4
with the Worldscope database, which provides accounting and financial information on publicly
listed firms globally.
We further collect the patent and citation data for our innovation measures from the BvD Orbis
patent database.10 We then calculate the total number of patents filed and citations received by a
10 This database contains patent and citation information on about 115 million patent applications and around 300 million
firms around the world. Compared with other widely used patent databases, including the National Bureau of Economic
Research patent database and the Harvard Patent Network Database, this database provides more comprehensive
coverage of global firms over a longer period, thus enabling the construction of a larger sample.

13
patent owner in a year. For the firm-year observations without patent or citation information, a value
of zero is assigned. Country-level data are collected from the World Bank’s official website
(https://www.worldbank.org). We exclude firm-years with missing data and remove countries with
less than 50 observations, leading to a final sample comprising 17,855 firm-year observations from
30 countries from 2004 to 2015.
3.2. Model specification
To examine whether and how the use of CSR contracting is associated with corporate
innovation, we estimate the following regression model:
INNOVATIONijt+1 = 0 + 1CSRContractingijt + 2CSRPerfijt + All Other
Controls + YearFE + IndustryFE + CountryFE + ijt (1)
where i indexes the firm, j indexes the country, and t indexes the fiscal year. We use one-year forward
innovation measures to account for the time needed to complete innovation projects.11 All standard
errors in the regressions are clustered at the firm level to account for possible correlations in the error
terms. Detailed definitions of the variables are provided in Appendix B.
In our study, corporate innovation is measured using output-oriented measures (i.e., patents
and citations) instead of input-oriented measures (i.e., R&D expenditure or R&D capital) in
consideration of the inconsistencies in accounting for R&D across countries. As our study is
conducted in an international context, the differences in accounting standards among countries could
lead to substantial inconsistent accounting treatments for R&D activities. For example, ASC 730 of
the U.S. GAAP mandates that all R&D spending be expensed as incurred except in several specific
cases (e.g., software development costs), whereas although IAS 38 of IFRS requires all research costs
to be expensed, part of the development cost should be capitalized when certain criteria are met
(Deloitte 2019; KPMG 2019). These inconsistencies in accounting standards indicate that the
11 For brevity, we report the results using one-year forward innovation measures. Using two-year forward innovation
measures does not change our inference.

14
differences in reported R&D expenditures do not necessarily represent the differences in innovative
efforts.12
We then construct two patent-based innovation measures following innovation literature (Hall
et al. 2005; Tian & Wang 2014; Flammer & Kacperczyk 2016; Francis et al. 2018). The first measure
is the patent count (PATENT), which is defined as the natural logarithm of one plus the number of
patents filed by a firm in a given year that are eventually granted. We use the patent application year
when calculating PATENT because compared to the grant year, the patent application year better
captures the actual timing of the patented innovation (Griliches et al. 1988; Hall et al. 2001).
Although a simple count of patents can capture the quantity of innovation, it does not differentiate
impactful breakthrough inventions from incremental technological discoveries (Sevilir & Tian 2012;
Nguyen 2018). In addition, according to Griliches et al. (1988), there is extreme skewness in the
distribution curve of patent value due to the existence of small numbers of highly valued and cited
patents. In view of the large variation in patent quality, we take the number of citations received by
patents as the second proxy, which reflects the technological and economic significance of the
patented innovation (Trajtenberg 1990; Hall et al. 2005). Thus, the second measure of innovation
output is the citation count (CITATION), which is defined as the natural logarithm of one plus the
number of citations received for all patents granted to a firm during a given year. For the above two
measures of innovation output, the transformation using the natural logarithm of the patent (citation)
count plus one can avoid the loss of observations with zero patents (citations) and alleviate the right-
skewness in the patent (citation) distribution.
The test variable of interest is CSR contracting (CSRContracting), which is constructed as an
indicator variable that equals 1 if CSR (or health and safety, or sustainability) performance targets
are included in the firm’s executive compensation contracts in that year and 0 otherwise. Thus, the
12 Supporting this argument, Koh and Reeb (2015) show that even firms that do not report R&D expenditures may still
engage in innovation and acquire patents.

15
coefficient of interest 1 captures the change in corporate innovation associated with the inclusion of
CSR-related criteria in executive compensation. Following the prediction of Hypothesis 1a (1b), we
expect that CSR contracting will have a positive (negative) association with corporate innovation.
Following the literature (e.g., Hall & Ziedonis 2001; Chen et al. 2016a; Flammer & Kacperczyk
2016; Francis et al. 2018; Zhong 2018; Flammer et al. 2019; Tsang et al. 2019a), we control for a set
of firm-, industry-, and country-level variables that may affect innovation output when examining
the relation between CSR contracting and corporate innovation. First, as studies have shown that
CSR performance has a positive impact on firm innovation (e.g., Bocquet et al. 2013; 2017; Luo &
Du 2015), we include in the model a firm-year’s overall CSR performance (CSRPerf), which is
defined as the average of the firm-year’s social and environmental performance scores based on the
data from ASSET4. The value of CSRPerf ranges between 0 and 100, with a higher value indicating
better CSR performance. Second, we control for the existence of long-term financial targets in
executive compensation (Comp_LongtermFin) because the literature (e.g., Murphy & Gibbons 1992;
Manso 2011) suggests that this executive compensation design plays an important role in fostering
corporate innovation by encouraging managers to focus on long-term value creation. Third, given
that R&D intensity is positively related to innovation output (e.g., Bradley et al. 2017), we include
R&D intensity (R&D) as a control, which is constructed as R&D expenditure scaled by total assets.
We control for capital intensity (i.e., the capital-labor ratio) (CapitalIntensity) because Hall and
Ziedonis (2001) have demonstrated that capital intensive firms tend to patent more aggressively to
avoid costly litigation and improve their negotiating position with other patent owners. Older firms
tend to generate more innovations as they have accumulated more experience in conducting
innovation activities compared to younger enterprises (Sørensen & Stuart 2000). Thus, we also
include firm age (Age) in the model. The literature shows that firm size, profitability, growth
opportunities, capital structure, and access to external financing could also impact firms’ engagement
in costly, risky, and long-term innovative projects (e.g., Kleinknecht 1989; Audretsch 1995; O’Brien

16
2003; Brown et al. 2009, 2013; Wies & Moorman 2015; Lyandres & Palazzo 2016). Correspondingly,
we control for an array of relevant corporate characteristics including firm size (Size), return on assets
(ROA), market-to-book ratio (MTB), sales growth (SalesGrowth), leverage ratio (Leverage), level of
cash holdings (CASH), and access to external financing (ExternalFinance). In addition, we control
the percentage of foreign sales (ForeignSales) because the literature suggests that exposure to foreign
markets has a positive effect on firm innovation (Alvarez & Robertson 2014). We also include the
percentage of closely held shares (InsiderOwnership) as research suggests it may influence
managerial incentives to innovate (e.g., Francis & Smith 1995; Choi et al. 2011).
Furthermore, at the industry level, Aghion et al. (2005) show that the relationship between
market competition and innovation takes an inverted-U shape, so we control for the degree of product
market competition using the Herfindahl-Hirschman index (HHI), which is calculated as the sum of
the squared market shares in the sales of a firm’s industry, with industries being classified based on
the three-digit SIC codes in each country. The squared term of the Herfindahl-Hirschman index (HHI2)
is also included to mitigate the possible non-linear relation between industry competition and
corporate innovation. At the country level, we control for GDP per capita (LNGDP) to capture the
aggregate technological sophistication at the country level (Furman et al. 2002). Finally, year-,
industry- and country-fixed effects (YearFE, IndustryFE, and CountryFE) are included to control for
variations in patenting and citation intensities over time, by industry, and across countries.
4. Empirical Results
4.1. Sample distribution
Panel A of Table 1 presents the sample distribution and summary statistics by country.13 There
are large variations in the number of observations, the percentage of CSR contracting adopters, and
13 As a large proportion of firm-year observations are not associated with a patent or citation, we also provide summary
statistics for the innovation output of firms that have at least one patent (i.e., the patent sample) or citation (i.e., the
citation sample).

17
innovation output across the 30 countries in our sample. As in many international studies, U.S. firms
comprise the largest proportion of the sample (34.11%). In our full sample, firm-years with the
presence of CSR contracting account for 15.84% of the sample. Australia has the highest percentage
of CSR contracting adopters (39.85%), followed by Norway (36.89%) and South Africa (35.45%).
The most innovative country in our sample is Japan, where firms have, on average, 219.44 patents
and 138.12 citations, followed by South Korea, Finland, Germany, and the U.S.
Panel B of Table 1 presents the sample distribution and summary statistics over time. Over the
sample period, the number of firms included in the sample shows a generally increasing trend, from
855 firms in 2004 to 2,523 firms in 2015, indicating the increasing coverage of ASSET4. The results
also indicate that firms increasingly adopt CSR contracting over the sample period, rising from 1.87%
of firms in 2004 to 32.29% in 2014, although the ratio drops slightly to 24.73% in 2015. The overall
rising trend also reflects the emerging practice of linking CSR criteria to executive incentive schemes
in recent years, which further highlights the need for research on CSR contracting.
In terms of innovation output, our data show a significant decrease in the average number of
patents a firm applies for and is granted each year over the last several years of the sample period.
This decline could be due to the significant time lag between a patent application and the granting of
the patent (Hall et al. 2001; Fang et al. 2014), as we only observe the information on a patent after it
has been granted. Thus, it is likely that some patents applied for in the last few years of the sample
period may have still been under review and not been granted, and hence are not included in the
database and our sample. Citation data are subject to a similar truncation bias because patents granted
in later years tend to have fewer citations than those granted in the early years of the sample period.
In our robustness tests, we use truncation-adjusted patent and citation counts to address the concerns
relating to the truncation bias in our patent and citation data.
Table 1, Panel C reports the sample distribution and summary statistics across industry sectors.
The three industries with the highest proportions of CSR contracting are the extractive (29.91%),

18
mining/construction (26.12%), and chemicals (20.19%) industries, all of which are among the
world’s most polluting industries according to a report prepared by Pure Earth and Green Cross
(2016), two international non-profit organizations. This suggests that CSR contracting is more
prevalent in less eco-friendly industries, perhaps because these industries seek to reduce their
environmental impact and obtain a social license to operate. In contrast, the industry with the lowest
proportion of CSR contracting is the miscellaneous manufacturing sector (3.71%). The three most
innovative industries are electrical equipment manufacturing, transportation equipment
manufacturing, and computers, which is consistent with the intuition that the firms in these industries
perceive innovative technologies and products as an important means of securing competitive
advantage. In contrast, firms in the retail industries tend to be less innovative.
[Table 1 here]
4.2. Summary statistics
Table 2 provides the descriptive statistics for all variables used in the main regression analyses.
All variables are winsorized at the 1st and 99th percentile to reduce the potential impact of outliers.
In the full sample, firms on average have 43 patents and 45 citations.14 The distribution of the patents
and citations shows a high degree of right-skewness, with the median being much smaller than the
corresponding mean, which suggests that a very small portion of observations have substantially
higher patent quantity and quality, which is consistent with prior studies (e.g., Griliches et al. 1988;
Zhong 2018). Therefore, we follow the literature and use the log transformation of the patent and
citation data in our regression analysis to correct the skewness of these variables. The mean of
CSRContracting is 0.158, indicating that 15.8% of the firm-year observations in the sample include
CSR-related criteria in their executive compensation schemes.
[Table 2 here]
14 The average patent and citation counts in the sample are larger than those reported by Francis et al. (2018), another
international study on innovation, mainly because we include firms from Japan and South Korea in our sample. The firms
in these countries generate significantly higher numbers of patents and receive more citations than firms in other countries.

19
4.3. Main results
The main regression results of testing the competing hypotheses on the association between
CSR contracting and firm innovation are presented in Panels A (for the patent model) and B (for the
citation model) of Table 3. We find a significantly positive relation between CSRContracting and
firms’ patent counts (β = 0.106, p < 0.01 in Panel A, Column 1) and citation counts (β = 0.133, p <
0.001 in Panel B, Column 1), which provides support for Hypothesis 1a that the adoption of CSR
contracting has a positive effect on firm innovation. From an economic perspective, these results
indicate that controlling for other factors, linking executive compensation to CSR targets increases
the numbers of patents and citations by 10.6% and 13.3% on average, respectively. The signs of the
coefficients on the control variables are generally consistent with our predictions and consistent with
the innovation literature (e.g., Sørensen & Stuart 2000; Hall & Ziedonis 2001; Furman et al. 2002;
Brown et al. 2009; Lyandres & Palazzo 2016).
[Table 3 here]
4.4. Mitigating large sample bias
As shown in Panel A of Table 1, our sample is dominated by U.S. firms, which account for
about 34% of the sample. The large presence of firms from a single country gives rise to concerns
about large sample bias. To address this concern, we perform a robustness check by excluding U.S.
firms from the sample and rerunning the main regression. The regression results are presented in
Column 2 of Panels A and B of Table 3. Consistent with the main results, the coefficients on
CSRContracting remain positive and significant (β = 0.163, p < 0.001 for the patent model; β = 0.234,
p < 0.001 for the citation model). Furthermore, to assess whether heterogeneity in the number of
firm-years across countries affects our results, we apply a weighted least squares (WLS) model in
which the weight is the inverse of the number of observations per country. Column 3 of Table 3
reports the results of the WLS regressions for PATENT and CITATION. The coefficients on
CSRContracting are 0.154 (p < 0.001) and 0.153 (p < 0.001) for the patent and citation models,

20
respectively, which are statistically and economically similar to our main results. In summary, these
robustness tests demonstrate that our finding of a positive relation between CSR contracting and
innovation is not driven by countries with a larger presence in the sample, and is a phenomenon that
is applicable to firms in all of the sample countries.
4.5. Addressing truncation bias
The truncation bias in the patent counts arises from the significant time lag between a patent
application and the granting of the patent (Hall 2001; Fang et al. 2014). Although PATENT measures
the number of patents applied for by a firm in a given year that are eventually granted, some of the
patents applied for in the later years of the sample period may still have been under review, and
therefore not included in the BvD database. This truncation problem leads to underreported patent
counts toward the end of the sample period. Following Hall et al. (2001, 2005), we use adjustment
factors to address the truncation bias in the patent dataset and compute the truncation-adjusted patent
counts.15 Similar to the patent counts, the citation counts are also subject to a truncation problem
because firms can accumulate more citations over time. Thus, we make a similar adjustment to the
citation counts. Column 4 of Table 3 reports the results using the truncation-adjusted patent and
citation data. Our inference of a positive relation between CSR contracting and innovation remains
unchanged after accounting for truncation bias.
4.6. Addressing additional endogeneity concerns
In this section, we address potential endogeneity concerns arising from omitted variables by
using the PSM approach and controlling for firm-fixed effects.
15 First, we estimate the application-grant lag distribution (Ws) for the first-half of the sample period from 2005 to 2010.
This is calculated as the percentage of patents applied for in a given year that are granted in s years. Then, truncation-
adjusted patent numbers are computed for the sample years from 2011 to 2015 by applying the adjustment factors to the
raw patent numbers. More specifically, the truncation-adjusted patent counts are Padj = 𝑃𝑟𝑎𝑤
∑ 𝑊𝑠2016−𝑡𝑠=0
, where Praw is the raw
(unadjusted) number of patent applications at year t and 2011=<t<=2016.

21
4.6.1. Propensity-score matched sample
A potential endogeneity concern is that firms that adopt CSR contracting may exhibit
fundamentally different characteristics compared to non-adopters, and these characteristics may
affect both the adoption of CSR contracting and innovation, and lead to a spurious correlation
between CSR contracting and firm innovation. For example, larger firms and more profitable firms
may be more likely to adopt CSR contracting and may also be more innovative. To address the
concern that controlling for the potential confounding factors in our main regression model may not
fully address the comparability of CSR contracting adopters and non-adopters, we use the PSM
approach to match CSR contracting adopters (the treatment group) with non-adopters (control group)
using one-to-one nearest neighbor propensity score matching without replacement. The matching is
based on firm size, industry, year, and country. To increase the comparability of the treatment and
control groups, we further require a caliper (the value for the maximum distance of the controls) of
0.01 for the matching. This matching process yields a matched sample of 4,748 firm years, consisting
of 2,374 firm years for CSR contracting adopters and 2,374 firm years for non-adopters.16 Column 5
of Panels A and B of Table 3 present the results using the PSM sample. The results demonstrate that
our inference remains unchanged.
4.6.2. Controlling for firm-fixed effects
We also include firm fixed effects in the regressions to capture time-invariant unobservable
firm characteristics. In particular, if the unobservable firm characteristics that are correlated with
both CSR contracting and innovation are constant over time, controlling for firm fixed effects will
help alleviate the omitted variable concern. The results of the regressions that include firm fixed
effects are reported in Column 6 in Panels A and B of Table 3. The coefficients on CSRContracting
16 Appendix C reports the summary statistics for the treatment and control groups and the differences in the means of the
two groups. Compared to non-adopters, CSR contracting adopters have significantly larger PATENT and CITATION
values, which is consistent with our main results based on the full sample. In addition, CSR contracting adopters do not
exhibit significant differences from non-adopters in terms of most of the control variables used in the regression model.

22
remain significantly positive (β = 0.087, p < 0.001 for the patent model, and β = 0.140, p < 0.001 for
the citation model).
4.7. Addressing the potential sample selection bias
As all of our sample firms are covered by the ASSET4 database, a potential concern is that our
results may be subject to sample selection bias if the decision on whether to include a firm in the
database is not random. To address this concern, we follow the literature (e.g., El Ghoul et al. 2017)
and perform a Heckman-type correction using a two-stage Heckman model. We merge the sample
from ASSET4 with the Worldscope data and distinguish firms covered in ASSET4 from those not
covered by generating an indicator variable ASSET4 Sample, which equals 1 if an observation is
covered in ASSET4, and 0 otherwise. In the first stage regression, we estimate a probit model by
regressing the dependent variable, ASSET4 Sample, on a set of explanatory variables that may have
affected the decision of ASSET4 on whether to cover a firm in that year. Using this model, we obtain
the inverse Mills ratio (Mills). In the second stage, we add Mills to Equation (1) to control for sample
selection bias.17 The second stage results presented in Column 7 of Table 3 show that the coefficients
on CSRContracting remain statistically and economically similar to our main results.
4.8. Alternative measures of innovation
In addition to using innovation output measures based on the patent and citation counts, we use
innovation efficiency and patent value as alternative innovation measures. First, following the
innovation literature (Lanjouw & Schankerman 2004; Becker-Blease 2011; Hirshleifer et al. 2013;
Zhong 2018), we use innovation efficiency (PATENT_Efficiency and CITATION_Efficiency) as our
first alternative innovation measure. We define PATENT_Efficiency (CITATION_Efficiency) as the
number of patents (citations) granted in a year divided by R&D capital (RDC), where RDC is
computed as R&Dt + 0.8R&Dt-1 + 0.6R&Dt-2 + 0.4R&Dt-3 + 0.2R&Dt-4 (Hirshleifer et al. 2013;
17 The results of the first stage regression are reported in Appendix D.

23
Zhong 2018).18 The results using PATENT_Efficiency and CITATION_Efficiency as the dependent
variables are presented in Columns 1 and 2 of Table 4.19 The second alternative measure of firm
innovation is PATENT_Value, which represents the economic value of innovation outcomes.
Following Kogan et al. (2017), the measure is calculated as the change in the market value of a firm
(adjusted by the average market return during the same measurement window) in the three-day
window following the patent grant announcement. Overall, our additional tests using the alternative
innovation measures show that CSR contracting helps increase the innovation efficiency and
economic value of innovation outputs.
[Table 4 here]
4.9. Additional robustness tests
4.9.1 Alternative measure of CSR contracting using data from Sustainalytics
In the previous tests, we used CSR contracting data from ASSET4. We now test the robustness
of our findings using CSR contracting data from an alternative database. Specifically,
CSRContracting_Alt is an indicator variable that equals 1 if a firm’s executive compensation is
explicitly tied to environmental, social, and corporate governance (ESG) performance targets based
on data from Sustainalytics, and 0 otherwise. We also take into account the more general corporate
governance practice of simply setting ESG performance targets that are not explicitly linked to
executive compensation, ExecutivePerf_ESGtarget.20 The results are presented in Table 5.21 The
coefficients on CSRContracting_Alt in both panels are significantly positive and quantitatively
18 RDC is calculated using five-year cumulative R&D expenses with the assumption of an annual depreciation rate of 20%
(Chan et al. 2001; Lev et al. 2005). Missing R&D expenditures are set as 0 for the calculation of RDC. 19 The control variable R&D is removed from this regression due to the mechanical relation between innovation efficiency
(scaled by R&D investment) and R&D. The results remain quantitatively and statistically similar when we include R&D
as a control in the regressions. 20 Sustainalytics provides worldwide ESG data on firms’ policies, programs, and preparedness for ESG risk management.
CSRContracting_Alt and ExecutivePerf_ESGtarget are constructed based on Sustainalytics’ data item “G.2.6, which
provides an assessment of whether a part of executive remuneration is explicitly linked to sustainability performance
targets, such as health and safety targets, environmental targets, etc.,” and “G.2.5, which provides an assessment of
whether there is explicit responsibility at the board level for ESG issues and/or whether there are committees dealing
with ESG issues and how they are linked to the company board.” 21 The sample size in this table is reduced significantly to 4,411 firm-years because the Sustainalytics database starts from
2009 and covers a much smaller sample of international firms than ASSET4.

24
similar to those on CSRContracting in Table 3. Notably, the coefficients on
ExecutivePerf_ESGtarget are insignificant, indicating that simply setting ESG targets without
explicitly linking executives’ remuneration to the targets does not appear to enhance innovation. This
finding again, lends support to the importance of explicitly linking CSR performance targets in
executive compensation policies in motivating managers’ behavior change.
4.9.2. Pre- and post-CSR contracting analysis using a difference-in-differences model
We also use a DID method to compare the changes in innovation between firms with CSR
contracting and those without. Following studies examining the effect of the staggered adoption of
laws and regulations (e.g., Bourveau et al. 2018; Tsang et al. 2019a), we use a staggered DID design.
Specifically, we create the variable POST_CSRContracting, which is an indicator variable that equals
1 for the year in which a firm adopts CSR contracting and any year after, and 0 otherwise. For the
control firms, we randomly assign a CSR contracting adoption year when defining
POST_CSRContracting. The results using the DID method with the inclusion of year and firm fixed
effects are reported in Column 2 of Panels A and B of Table 5. The coefficients on
POST_CSRContracting are 0.062 (p = 0.019) for the patent model and 0.133 (p = 0.008) for the
citation model, both of which are positive and statistically significant.22
4.9.3. Alternative measurement window for innovation
To investigate whether the findings are robust to the choice of measurement window, we
restrict the sample to a [t-3, t+3] window (with t denoting the year in which a firm adopts CSR
contracting) for measuring the patent outputs and rerun the regression. To be included in the test
sample, a firm is required to be observable during the pre- and post-CSR contracting periods. This
additional requirement helps mitigate the potential influence of the differences in firm composition
and sample years during the pre- and post-adoption periods on our findings. As presented in Column
22 By focusing on the cross-temporal differences in innovation between the treatment and control groups before and after
the adoption of CSR contracting, the DID method controls for the unobservable cross-temporal trends in firm innovation
and eliminates the influence of temporal variation in innovation that is not caused by the adoption of CSR contracting,
and thereby helps to address issues relating to unobserved heterogeneity and endogeneity (Bertrand et al. 2004).

25
3 of Panels A and B of Table 5, the coefficients on CSRContracting remain significantly positive (β
= 0.081, p < 0.001 and β = 0.101, p = 0.005 for the patent model and citation model, respectively).
4.10. Addressing possible alternative explanations
4.10.1. CEO changes
A remaining concern is that our results may be explained by factors such as top executive
turnover, which is also likely to influence corporate innovation strategies and outputs. To ensure our
findings are not driven by CEO changes, we exclude all firm-years for firms that experienced a CEO
change during the sample period. As reported in Column 4 of Panels A and B of Table 5, the
coefficients on CSRContracting remain significantly positive and quantitatively similar to the main
results (β = 0.091, p < 0.05 for the patent model and β = 0.184, p = 0.001 for the citation model).
4.10.2. Other compensation incentives
Studies have suggested that the long-term equity-based components of executive compensation,
such as restricted stocks and stock options, can motivate innovation by alleviating managerial myopia
and directing managers’ attention toward longer-term value creation (e.g., Lerner & Wulf 2007;
Flammer & Bansal 2017; Nguyen 2018). Thus, we include Comp_LongtermStock in our model,
which is an indicator variable measuring whether a firm has recently distributed long-term equity
incentives to its executives. The results are reported in Column 5 of Table 5. In addition, studies have
shown that managerial compensation based on stock performance targets rather than accounting
earnings has a positive impact on innovation (e.g., Murphy & Gibbons 1992). Accordingly, we
include an additional variable for stock performance-oriented compensation
(Comp_ShareholderReturn), which is an indicator variable that equals 1 if an executive
compensation scheme is linked to total shareholder returns in that year, and 0 otherwise. We continue
to find that our inferences are unchanged.

26
4.10.3. Corporate governance attributes
Good corporate governance practices presumably mitigate agency conflicts, improve
transparency, and optimize the allocation of investment capital, which in turn may enhance the
adoption of CSR contracting and engagement in firm innovation (Fauver et al. 2017; Zhong 2018).
Therefore, following Chen et al. (2016a), we add two corporate governance factors to our model:
board independence (BoardIndependence) and CEO duality (CEODuality). 23 The results are
reported in Column 7 of Table 5. Our inferences are unchanged after the addition of the two corporate
governance variables.
[Table 5 here]
5. Additional Analysis
5.1. Country-level institutions and CSR contracting
Rodriguez et al. (2006) argue that the strategic implications of CSR are influenced by cross-
country differences in the institutions that regulate market activity, such as business, labor, and social
agencies. Thus, in this section, we investigate the possible role of country-level institutional
characteristics on the association between CSR contracting and innovation.
5.1.1. National stakeholder orientation
National stakeholder orientation refers to a society’s overall expectations for CSR performance,
which are shaped by the country’s institutional, legal, and cultural characteristics (Williams &
Aguilera 2008; Dhaliwal et al. 2012; Cheung et al. 2018). In general, countries that are more
stakeholder-oriented have relatively more stringent labor rights legislation and laws on CSR
disclosure, and higher public awareness of CSR issues. Thus, national stakeholder orientation may
either substitute or complement the relation between CSR contracting and innovation. For example,
23 A board with greater independence or without CEO duality is widely regarded as having good corporate governance.
BoardIndependence is calculated as the proportion of independent directors on the board in a given year. CEODuality is
an indicator variable that equals 1 if the CEO also serves as the chairperson of the board, and 0 otherwise.

27
given the lower level of CSR activities of firms in countries with lower stakeholder orientation, the
use of CSR contracting to improve firms’ CSR performance may have relatively little effect in
fostering managers’ future-oriented activities, including those related to innovation. In contrast, by
developing close connections with stakeholders who are able to provide resources and support for
innovative activities, CSR contracting may help fill the gaps in the institutional, legal, and social
environments in less stakeholder-oriented countries. This suggests that CSR contracting has a more
positive effect on innovation.
Using the median of STAKE for the countries included in our sample as a cut-off point, we split
the sample into two subsamples: firms in countries with strong stakeholder orientation (6,627
observations) and firms in countries with weak national stakeholder orientation (9,158
observations).24 The results for the two subsamples are presented in Table 6. The coefficients on
CSRContracting are significantly positive for countries with weak stakeholder orientation (β = 0.142,
p < 0.05 in Column 2 for the patent model; β = 0.112, p < 0.05 in Column 4 for the citation model),
and insignificant albeit positive for countries with high stakeholder orientation. These results support
our conjecture that the positive effect of CSR contracting on firm innovation is more pronounced in
less stakeholder-oriented countries.
[Table 6 here]
5.1.2. National law enforcement
Next, we examine the role of country-level law enforcement on the relation between CSR
contracting and firm innovation. Flammer and Kacperczyk (2016) demonstrate that the legal
enforcement of statutes that consider the needs of nonfinancial stakeholders has a positive effect on
firm innovation, as the enforcement can protect the interests of stakeholders, foster their longer-term
24 The data on national stakeholder orientation are obtained from Dhaliwal et al. (2012), who develop a measure of
country-level stakeholder orientation (STAKE) that incorporates four dimensions of national stakeholder engagement: (1)
the stringency of a country’s legal environment in protecting labor rights and benefits; (2) the degree of a country’s
mandatory requirements for CSR disclosure; (3) a country’s public awareness of CSR issues; and (4) the country-level
attitudes of corporate executives to CSR engagement.

28
horizons, and strengthen their tolerance for risks associated with firm innovation. However, in
countries with weak legal enforcement, stakeholders tend to be less protected against adverse events
by formal legal institutions, and in turn have a shorter-term orientation and less tolerance of
uncertainty. Hence, the stakeholders are less willing to accept or engage in risky innovation initiatives.
In this condition, the voluntary adoption of CSR contracting may act as a substitute for law
enforcement in terms of protecting stakeholders’ interests by increasing management’s commitment
to CSR and stakeholders. Thus, we expect CSR contracting to have a stronger effect on innovation
in countries with weaker enforcement of legal institutions. Alternatively, in countries with a strong
legal environment, CSR contracting may play an even more important role in fostering corporate
innovation activities because presumably corporate innovation outputs (e.g., property right) can be
better protected in countries with more stringent legal environment.
To test our conjecture, we partition the sample into two subsamples, namely firms in countries
with strong law enforcement and firms in countries with weak law enforcement, using the median of
Rule of law for the countries included in our sample.25 The results are reported in Table 7. The
coefficients on CSRContracting are significantly positive only for the subsample of countries with
weak law enforcement (β = 0.137, p < 0.01 in Column 2 for the patent model and β = 0.210, p <
0.001 in Column 4 for the citation model). These results are consistent with our prediction that the
association between CSR contracting and firm innovation is amplified in countries with weak law
enforcement.
[Table 7 here]
5.2. CSR contracting, CSR performance, and firm innovation
Given that CSR contracting and CSR performance are both likely to have a positive relation
with firm innovation, in an additional test, we further explore whether CSR contracting and CSR
25 Following La Porta et al. (1998), we use the country-level rule of law (Rule of law) as a proxy for the overall
enforcement ability of a country’s legal system. We obtain the Rule of law data from the World Bank. Specifically, this
variable measures the extent to which agents can trust that a country’s legislation will be enforced, especially in regard
to contracts, the protection of property rights, and the authority of the police and courts.

29
performance substitute or complement each other in terms of their effects on firm innovation. Thus,
we further examine the interactive role of CSR contracting and CSR performance in innovation by
interacting the CSR contracting and CSR performance variables. In terms of the CSR performance
measures, in addition to the overall CSR performance score (CSRPerf), which we introduced as a
control in the earlier tests, we include five new variables measuring employee-related CSR
performance,26 as research shows that positive employee treatment enhances firm innovation by
promoting a learning climate and facilitating the exchange and absorption of knowledge and ideas
(Lau & Ngo 2004; Sung & Choi 2014; Mao & Weathers 2019). The results after including the
interaction terms between CSRContracting and the CSR performance measures are presented in
Table 8. The coefficients on both CSRContracting and CSRPerf are significantly positive in all
columns, indicating that CSR contracting and good CSR performance are beneficial to firm
innovation. Furthermore, all of the interaction terms are negatively and significantly related to firm
innovation, which suggests that CSR contracting can substitute for CSR performance in terms of its
effect on firm innovation.
[Table 8 here]
5.3. Mandatory CSR reporting requirements
A possible alternative explanation of the observed positive effect of CSR contracting on
innovation is that firms tend to signal their innovation success through CSR contracting. To partially
address this concern, we take advantage of the country-level CSR reporting regulations as an
exogenous shock and examine their impact on the relation between CSR contracting and innovation
because studies suggest that mandatory CSR or CSR reporting requirements substantially increase
firms’ commitment to CSR (e.g., Manchiraju & Rajgopal 2017; Chen et al. 2018). According to
Ioannou and Serafeim (2017), during our sample period, CSR disclosure was mandated by law in
26 Specifically, the five measures of employee-related CSR performance include the overall CSR performance associated
with employees’ wellbeing (EMPperf) and its four dimensions: (1) employment quality (EMP_EQ); (2) workforce health
and safety (EMP_HS); (3) training and development (EMP_TD); and (4) diversity and opportunity (EMP_DO). See
Appendix B for more detailed variable definitions.

30
five countries, namely China, Denmark, India, Malaysia, and South Africa. Thus, we introduce
POST_CSRRMandate, which is an indicator variable that equals 1 for the year of the adoption of
mandatory CSR reporting and any year after, and 0 otherwise. We then add POST_CSRRMandate
and its interaction with CSRContracting to our innovation model using a staggered DID design that
includes firm fixed effects. 27 Our untabulated results show that the main effects of
POST_CSRRMandate and CSRContracting are significantly positive, while the interaction term
CSRContracting × POST_CSRRMandate is significantly negative. These results indicate that
mandatory CSR disclosure requirements increase firm innovation, and attenuate the positive relation
between CSR contracting and firm innovation, which is consistent with our results showing that CSR
contracting is substitutive for country-level CSR orientation and firm-level CSR performance in
enhancing firm innovation.
6. Conclusion
With the growing awareness of the relationship between the nonfinancial performance and
long-term financial performance of firms, shareholders and researchers have shown increasing
interest in the inclusion of CSR performance requirements in firms’ executive compensation policies.
Although the inclusion of equity compensation and stock performance targets in executive
compensation schemes has been shown to be effective in motivating firm innovation (e.g., Murphy
& Gibbons 1992; Lerner & Wulf 2007; Flammer & Bansal 2017), we have limited understanding of
whether the inclusion of nonfinancial CSR criteria in executive compensation policies plays a similar
role.
In this study, based on a comprehensive sample of firms from 30 countries, we find robust
evidence showing that the inclusion of CSR criteria in executive compensation policies has a positive
27 We exclude firms that are from CSR reporting mandated countries but have no pre-mandate firm-years from our sample
to ensure better comparison.

31
effect on firm innovation. We further explore whether and how country-level institutional
characteristics moderate the relation between CSR contracting and firm innovation. We find that
CSR contracting has a stronger effect on firm innovation in countries with weaker stakeholder
orientation or legal enforcement. This finding is consistent with the notion that CSR contracting plays
an important role in filling these institutional voids by incentivizing management to commit to future-
oriented investment, which in turn fosters better firm innovation. Finally, we present evidence
suggesting that while CSR contracting and CSR performance appear to be positively related to firm
innovation, they substitute each other in terms of their effects on firm innovation.
Our study contributes to the literature on the relation between executive compensation and firm
innovation by shedding light on the role of CSR-based compensation in incentivizing future-oriented
investments in areas such as innovation. The findings of our study also have a number of practical
implications. For example, our findings suggest that boards can improve the innovation outcomes of
their firms by introducing CSR-based executive compensation, especially for firms domiciled in
countries with weak stakeholder orientation or legal environments.

32
REFERENCES
Aghion, P., N. Bloom, R. Blundell, R. Griffith, and P. Howitt. 2005. Competition and innovation: An inverted-
U relationship. The Quarterly Journal of Economics 120 (2): 701–728.
Aghion, P., S. Bechtold, L. Cassar, and H. Herz. 2014. The casual effects of competition on innovation:
Experimental evidence. NBER Working Paper. https://www.nber.org/papers/w19987
Alvarez, R., and R. Robertson. 2004. Exposure to foreign markets and plant-level innovation: Evidence from
Chile and Mexico. The Journal of International Trade and Economic Development 13 (1): 57–87.
Audretsch, D. B. 1995. Firm profitability, growth, and innovation. Review of Industrial Organization 10 (5):
579–588.
Baranchuk, N., R. Kieschnick, and R. Moussawi. 2014. Motivating innovation in newly public firms. Journal
of Financial Economics 111: 578–588.
Barth, M. E., W. H. Beaver, J. R. Hand, and W. R. Landsman. 2005. Accruals, accounting-based valuation
models, and the prediction of equity values. Journal of Accounting, Auditing and Finance 20 (4): 311–
345.
Baysinger, B. D., R. D. Kosnik, and T. A. Turk. 1991. Effects of board and ownership structure on corporate
R&D strategy. Academy of Management Journal 34 (1): 205–214.
Becker-Blease, J. R. 2011. Governance and innovation. Journal of Corporate Finance 17 (4): 947–958.
Bertrand, M., E. Duflo, and S. Mullainathan. 2004. How much should we trust differences-in-differences
estimates? The Quarterly Journal of Economics 119 (1):249-275.
Bertrand, M., and S. Mullainathan. 2003. Enjoying the quiet life? Corporate governance and managerial
preferences. Journal of Political Economy 111 (5): 1043–1075.
Bloom, N., and J. Van Reenen. 2002. Patents, real options and firm performance. The Economic Journal 112
(478): 97–116.
Bocquet, R., C. Le Bas, C. Mothe, and N. Poussing. 2013. Are firms with different CSR profiles equally
innovative? Empirical analysis with survey data. European Management Journal 31 (6): 642–654.
Bocquet, R., C. Le Bas, C. Mothe, and N. Poussing. 2017. CSR, innovation, and firm performance in sluggish
growth contexts: A firm-level empirical analysis. Journal of Business Ethics 146 (1): 241–254.
Bourveau, T., Y. Lou, and R. Wang. 2018. Shareholder litigation and corporate disclosure: Evidence from
derivative lawsuits. Journal of Accounting Research 56 (3): 797–842.
Bradley, D., I. Kim, and X. Tian. 2017. Do unions affect innovation? Management Science 63 (7): 2251–2271.
Brown, J. R., S. M. Fazzari, and B. C. Petersen. 2009. Financing innovation and growth: Cash flow, external
equity, and the 1990s R&D boom. The Journal of Finance 64 (1): 151–185.
Brown, J. R., G. Martinsson, and B. C. Petersen. 2013. Law, stock markets, and innovation. The Journal of
Finance 68 (4): 1517–1549.
Burchman, S., and B. Sullivan. 2017. It’s time to tie executive compensation to sustainability. Harvard
Business Review, Publication Date: Aug 16, 2017.
Burrus, R. T., J. E. Graham, and A. T. Jones. 2018. Regional innovation and firm performance. Journal of
Business Research 88: 357–362.
Bushman, R. M., R. J. Indjejikian, and A. Smith. 1996. CEO compensation: The role of individual
performance evaluation. Journal of Accounting and Economics 21 (2): 161–193.
Cespa, G., and G. Cestone. 2007. Corporate social responsibility and managerial entrenchment. Journal of
Economics and Management Strategy 16 (3): 741–771.
Chan, L. K., J. Lakonishok, and T. Sougiannis. 2001. The stock market valuation of research and development
expenditures. The Journal of Finance 56 (6): 2431–2456.
Change, X., K. Fu, A. Low, and W. Zhang. 2015. Non-executive employee stock options and corporate
innovation. Journal of Financial Economics 115 (1): 168–188.
Chen, C., Y. Chen, P. H. Hsu, and E. J. Podolski. 2016a. Be nice to your innovators: Employee treatment and
corporate innovation performance. Journal of Corporate Finance 39: 78–98.
Chen, Y., M. Hung, and Y. Wang. 2018. The effect of mandatory CSR disclosure on firm profitability and
social externalities: Evidence from China. Journal of Accounting and Economics 65 (1): 169–190.
Chen, J., W. S. Leung, and K. P. Evans. 2016b. Are employee-friendly workplaces conducive to innovation?
Journal of Corporate Finance 40: 61–79.
Cheung, Y. L., W. Tan, and W. Wang. 2018. National stakeholder orientation, corporate social responsibility,
and bank loan cost. Journal of Business Ethics 150 (2): 505–524.

33
Choi, S. B., S. H. Lee, and C. Williams. 2011. Ownership and firm innovation in a transition economy:
Evidence from China. Research Policy 40 (3): 441–452.
Cook, K. A., A. M. Romi, D. Sánchez, and J. M. Sánchez. 2019. The influence of corporate social
responsibility on investment efficiency and innovation. Journal of Business Finance and Accounting 46
(3–4): 494–537.
Dechow, P. M., and R. G. Sloan. 1991. Executive incentives and the horizon problem: An empirical
investigation. Journal of Accounting and Economics 14 (1): 51–89.
Degeorge, F., J. Patel, and R. Zeckhauser. 1999. Earnings management to exceed thresholds. The Journal of
Business 72 (1): 1–33.
Deloitte. 2019. IAS 38 - Intangible Assets. https://www.iasplus.com/en/standards/ias/ias38
Deng, X., J. Kang, and B. S. Low. 2013. Corporate social responsibility and stakeholder value maximization:
Evidence from mergers. Journal of Financial Economics 110 (1): 87–109.
Dhaliwal, D. S., O. Z. Li, A. Tsang, and Y. G. Yang. 2011. Voluntary nonfinancial disclosure and the cost of
equity capital: The initiation of corporate social responsibility reporting. The Accounting Review 86 (1):
59–100.
Dhaliwal, D. S., S. Radhakrishnan, A. Tsang, and Y. G. Yang. 2012. Nonfinancial disclosure and analyst
forecast accuracy: International evidence on corporate social responsibility disclosure. The Accounting
Review 87 (3): 723–759.
Dhaliwal, D., O. Z. Li, A. Tsang, and Y. G. Yang. 2014. Corporate social responsibility disclosure and the
cost of equity capital: The roles of stakeholder orientation and financial transparency. Journal of
Accounting and Public Policy 33 (4): 328–355.
Dikolli, S. S., and I. Vaysman. 2006. Contracting on the stock price and forward-looking performance
measures. European Accounting Review 15 (4): 445–464.
E&Y. 2010. Seven things CEOs and boards should ask about ‘triple bottom line’ reporting. Ernst & Young.
http://globalsustain.org/files/Seven_things_CEOs_boards_should_ask_about_climate_reporting.pdf
El Ghoul, S., O. Guedhami, and Y. Kim. 2017. Country–level institutions, firm value, and the role of corporate
social responsibility initiatives. Journal of International Business Studies 48 (3): 360–385.
Fang, V. W., X. Tian, and S. Tice. 2014. Does stock liquidity enhance or impede firm innovation? The Journal
of Finance 69 (5): 2085–2125.
Fauver, L., M. Hung, X. Li, and A. G. Taboada. 2017. Board reforms and firm value: Worldwide evidence.
Journal of Financial Economics 125 (1): 120–142.
Fauver, L., M. B. McDonald, and A. G. Taboada. 2018. Does it pay to treat employees well? International
evidence on the value of employee-friendly culture. Journal of Corporate Finance 50: 84–108.
Ferreira, D., G. Manso, and A. C. Silva. 2014. Incentives to innovate and the decision to go public or private.
Review of Financial Studies 27 (1): 256–300.
Ferrell, A., H. Liang, and L. Renneboog. 2016. Socially responsible firms. Journal of Financial Economic
122 (3): 585–606.
Flammer, C., and P. Bansal. 2017. Does a long-term orientation create value? Evidence from a regression
discontinuity. Strategic Management Journal 38 (9): 1827–1847.
Flammer, C., B. Hong, and D. Minor. 2019. Corporate governance and the rise of integrating corporate social
responsibility criteria in executive compensation: Effectiveness and implications for firm outcomes.
Strategic Management Journal 40 (7): 1097–1122.
Flammer, C., and A. Kacperczyk. 2016. The impact of stakeholder orientation on innovation: Evidence from
a natural experiment. Management Science 62 (7): 1982–2001.
Forbes. 2010. Executive bonuses and corporate responsibility. Forbes, 20 May. https://www.forbes.com/site
s/csr/2010/05/20/executive-bonuses-and-corporate-responsibility/#ac76194650c1
Francis, B. B., I. Hasan, and Z. Sharma. 2011. Incentives and innovation: Evidence from CEO compensation
contracts. Bank of Finland Research Discussion Paper. No. 17/2011. https://papers.ssrn.com/sol3/pape
rs.cfm?abstract_id=1953947
Francis, B. B., I. Kim, B. Wang, and Z. Zhang. 2018. Labor law and innovation revisited. Journal of Banking
and Finance 94: 1–15.
Francis, J., and A. Smith. 1995. Agency costs and innovation some empirical evidence. Journal of Accounting
and Economics 19 (2–3): 383–409.
Frederick, S., G. Loewenstein, and T. O'donoghue. 2002. Time discounting and time preference: A critical
review. Journal of economic literature 40 (2): 351–401.

34
Friedman, M. 1970. The social responsibility of business is to increase its profits. The New York Times
Magazine, September 13th 1970. http://umich.edu/~thecore/doc/Friedman.pdf
Furman, J. L., M. E. Porter, and S. Stern. 2002. The determinants of national innovative capacity. Research
Policy 31 (6): 899–933.
Glass Lewis. 2010. Greening the Green. https://www.glasslewis.com/glass-lewis-publishes-greening-the-
green-2012-linking-executive-compensation-to-sustainability/
Graham, J. R., C. R. Harvey, and S. Rajgopal. 2005. The economic implication of corporate financial reporting.
Journal of Accounting and Economics 40 (1–3): 3–73.
GreenBiz. 2015. Apple, Google and bribing employees to hit corporate climate goals. GreenBiz, 5 November.
https://www.greenbiz.com/article/apple-google-and-bribing-employees-hit-corporate-climate-goals
Griliches, Z., A. Pakes, and B. H. Hall. 1988. The value of patents as indicators of inventive activity. NBER
Working Paper. https://www.nber.org/papers/w2083
Grossman, G. M., and E. Helpman. 1990. Trade, innovation, and growth. American Economic Review 80 (2):
86–91.
Gu, F. 2005. Innovation, future earnings, and market efficiency. Journal of Accounting, Auditing and Finance
20 (4): 385–418.
Hall, B. H., A. B. Jaffe, and M. Trajtenberg. 2001. The NBER patent citation data file: Lessons, insights and
methodological tools. NBER Working Paper. https://www.nber.org/papers/w8498
Hall, B. H., A. Jaffe, and M. Trajtenberg. 2005. Market value and patent citations. RAND Journal of
Economics 36 (1): 6–38.
Hall, B. H., and R. H. Ziedonis. 2001. The patent paradox revisited: an empirical study of patenting in the US
semiconductor industry, 1979-1995. RAND Journal of Economics 32 (1): 101–128.
He, J. J., and X. Tian. 2018. Finance and corporate innovation: a survey. Asia-Pacific Journal of Financial
Studies 47: 165–212.
Hirshleifer, D., P. H. Hsu, and D. Li. 2013. Innovative efficiency and stock returns. Journal of Financial
Economics 107 (3): 632–654.
Holmström, B. 1989. Agency costs and innovation. Journal of Economic Behavior and Organization 12 (3):
305–327.
Holmström, B. 1999. Managerial incentive problems: A dynamic perspective. Review of Economic Studies 66
(1): 169–182.
Holthausen, R. W., D. F. Larcker, and R. G. Sloan. 1995. Business unit innovation and the structure of
executive compensation. Journal of Accounting and Economics 19 (2–3): 279–313.
Hong, B., Z. Li, and D. Minor. 2016. Corporate governance and executive compensation for corporate social
responsibility. Journal of Business Ethics 136 (1): 199–213.
Hubbard, T. D., D. M. Christensen, and S. D. Graffin. 2017. Higher highs and lower lows: The role of
corporate social responsibility in CEO dismissal. Strategic Management Journal 38 (11): 2255–2265.
Ioannou, I., and G. Serafeim. 2012. What drives corporate social performance? The role of nation-level
institutions. Journal of International Business Studies 43 (9): 834–864.
Ioannou, I., and G. Serafeim. 2017. The consequences of mandatory corporate sustainability reporting.
Working Paper. London Business School. https://papers.ssrn.com/sol3/papers.cfm?abstract_id=1799589
Ittner, C. D., D. F. Larcker, and M. V. Rajan. 1997. The choice of performance measures in annual bonus
contracts. The Accounting Review 72 (2): 231–255.
Jia, N., X. Tian, W. Zhang. 2016. The holy grail of teamwork: Management team synergies and firm
innovation. Working Paper, Tsinghua University.
Kim, Y., C. Brodhag, and D. Mebratu. 2014. Corporate social responsibility driven innovation. Innovation:
The European Journal of Social Science Research 27 (2): 175–196.
Kleinknecht, A. 1989. Firm size and innovation. Small Business Economics 1 (3): 215–222.
Kogan, L., D. Papanikolaou, A. Seru, and N. Stoffman. 2017. Technological innovation, resource allocation,
and growth. Quarterly Journal of Economics 132 (2): 665–712.
Koh, P. S., and D. M. Reeb. 2015. Missing R&D. Journal of Accounting and Economics 60 (1): 73–94.
KPMG. 2019. IFRS vs. US GAAP: R&D costs. https://advisory.kpmg.us/articles/2017/ifrs-vs-us-gaap-rd-
costs.html
Krüger, P. 2015. Corporate goodness and shareholder wealth. Journal of Financial Economics 115 (2): 304–
329.

35
La Porta, R., F. Lopez-de-Silanes, A. Shleifer, and R. W. Vishny. 1998. Law and finance. Journal of political
Economy 106 (6): 1113–1155.
Lanjouw, J. O., and M. Schankerman. 2004. Patent quality and research productivity: Measuring innovation
with multiple indicators. The Economic Journal 114 (495): 441–465.
Lau, C. M., and H. Y. Ngo. 2004. The HR system, organizational culture, and product innovation.
International Business Review 13 (6): 685–703.
Lerner, J., and J. Wulf. 2007. Innovation and incentives: Evidence from corporate R&D. Review of Economics
and Statistics 89 (4): 634–644.
Lev, B., B. Sarath, and T. Sougiannis. 2005. R&D reporting biases and their consequences. Contemporary
Accounting Research 22 (4): 977–1026.
Liao, C., Z. San, and A. Tsang. 2019. Corporate governance reforms around the world: The effect on corporate
social responsibility. Working Paper, York University.
Lins, K. V., H. Servaes, and A. Tamayo. 2017. Social capital, trust, and financial performance: The value of
corporate social responsibility during the financial crisis. Journal of Finance 72 (4): 1785–1824.
Luo, X., and S. Du. 2015. Exploring the relationship between corporate social responsibility and firm
innovation. Marketing Letters 26 (4): 703–714.
Lyandres, E., and B. Palazzo. 2016. Cash holdings, competition, and innovation. Journal of Financial and
Quantitative Analysis 51 (6): 1823–1861.
Manchiraju, H., and S. Rajgopal. 2017. Does corporate social responsibility (CSR) create shareholder value?
Evidence from the Indian Companies Act 2013. Journal of Accounting Research 55(5): 1257–1300.
Manso, G. 2011. Motivating innovation. The Journal of Finance 66 (5):1823–1860.
Mao, C. X., and J. Weathers. 2019. Employee treatment and firm innovation. Journal of Business Finance
and Accounting 46 (7–8): 977–1002.
Mao, C., and C. Zhang. 2017. Managerial risk-taking incentive and firm innovation: Evidence from FAS 123R.
Journal of Financial and Quantitative Analysis 53 (2): 867–898.
Marano, V., P. Tashman, and T. Kostova. 2017. Escaping the iron cage: Liabilities of origin and CSR reporting
of emerging market multinational enterprises. Journal of International Business Studies 48 (3): 386–408.
Masulis, R. W., and S. W. Reza. 2015. Agency problems of corporate philanthropy. Review of Financial
Studies 28 (2): 592–636.
Matějka, M., K. A. Merchant, and W. A. Van der Stede. 2009. Employment horizon and the choice of
performance measures: Empirical evidence from annual bonus plans of loss-making entities.
Management Science 55 (6): 890–905.
Matolcsy, Z. P., and A. Wyatt. 2008. The association between technological conditions and the market value
of equity. The Accounting Review 83 (2): 479–518.
Murphy, K. J., and R. Gibbons. 1992. Does executive compensation affect investment? NBER Working Paper.
https://www.nber.org/papers/w4135
Narayanan, M. 1985. Managerial incentives for short‐term results. Journal of Finance 40 (5): 1469–1484.
Newmont Mining Corporation. 2019. 2019 proxy statement, filed April 16th, 2019. Newmont Mining
Corporation. https://investors.newmontgoldcorp.com/reports-and-filings/default.aspx
Nguyen, T. 2018. CEO Incentives and Corporate Innovation. Financial Review 53 (2): 255–300.
O'Brien, J. P. 2003. The capital structure implications of pursuing a strategy of innovation. Strategic
Management Journal 24 (5): 415–431.
Orlitzky, M., F. L. Schmidt, and S. L. Rynes. 2003. Corporate social and financial performance: A Meta-
analysis. Organization Studies 24(3): 403–441.
Porter, M. E. 1992. Capital disadvantage: America's failing capital investment system. Harvard Business
Review 70 (5): 65–82.
Porter, M. E. 1998. The competitive advantage of nations: With a new introduction. New York: Free Press.
Pure Earth, and Green Cross. 2016. 2016 world’s worst pollution problems. https://www.worstpolluted.org
Rodriguez, P., D. S. Siegel, A. Hillman, and L. Eden. 2006. Three lenses on the multinational enterprise:
Politics, corruption, and corporate social responsibility. Journal of International Business Studies 37 (6):
733–746.
Royal Dutch Shell Plc. 2018. 2018 annual report. https://reports.shell.com
Ryou, J. W., A. Tsang, and K. Wang. 2019. Product market competition and voluntary corporate social
responsibility disclosures. Working Paper, York University. https://www.fox.temple.edu/wp-

36
content/uploads/2018/01/Ryou-Ji-Woo-Product-Market-Competition-and-Voluntary-Corporate-
Social....pdf
Sauermann, H., and W. M. Cohen. 2010. What makes them tick? Employee motives and firm innovation.
Management Science 56 (12): 2134–2153.
Schlenker, B. R. 1980. Impression management: The self-concept, social identity, and interpersonal relations.
Cole, Monterey, CA: Brooks/Cole Pub. Co.
Sevilir, M., and X. Tian. 2012. Acquiring innovation. Working Paper, Indiana University. https://papers.ssrn.
com/sol3/papers.cfm?abstract_id=1731722
Sheikh, S. 2012. Do CEO compensation incentives affect firm innovation? Review of Accounting and Finance
11 (1): 4–39.
Sørensen, J. B., and T. E. Stuart. 2000. Aging, obsolescence, and organizational innovation. Administrative
Science Quarterly 45 (1): 81–112.
Stein, J. C. 1989. Efficient capital markets, inefficient firms: A model of myopic corporate behavior. Quarterly
Journal of Economics 104 (4): 655–669.
Sung, S. Y., and J. N. Choi. 2014. Do organizations spend wisely on employees? Effects of training and
development investments on learning and innovation in organizations. Journal of Organizational
Behavior 35 (3): 393–412.
Tedeschi, J. T., and M. Reiss. 1981. Verbal strategies in impression management. The Psychology of Ordinary
Explanations of Social Behavior: 271–309.
Tian, X., and T. Y. Wang. 2014. Tolerance for failure and corporate innovation. Review of Financial Studies
27 (1): 211–255.
Trajtenberg, M. 1990. A penny for your quotes: Patent citations and the value of innovations. Rand Journal
of Economics 21 (1): 172–187.
Tsang, A., K. T. Wang, and N. Z. Zhu. 2019a. Corporate governance reforms around the world: The impact
on firm innovation. Working Paper, York University.
Tsang, A., S. Zeng, and G. Zhou. 2019b. Corporate social responsibility and firm value: International evidence
on the role of integrated reporting. Working Paper, York University.
Velte, P. 2016. Sustainable management compensation and ESG performance – The German case. Problems
and Perspectives in Management 14 (4): 17–24.
Wagner, M. 2010. Corporate social performance and innovation with high social benefits: A quantitative
analysis. Journal of Business Ethics 94 (4):581–594.
Walmart Inc. 2019. 2019 proxy statement, filed April 23, 2019. Walmart Inc. https://stock.walmart.com/inve
stors/financial-information/sec-filings/default.aspx
Westphal, J. D., and E. J. Zajac. 1994. Substance and symbolism in CEOs' long-term incentive plans.
Administrative Science Quarterly 39 (3): 367–390.
Wies, S., and C. Moorman. 2015. Going public: How stock market listing changes firm innovation behavior.
Journal of Marketing Research 52 (5): 694–709.
Williams, C., and R. V. Aguilera. 2008. Corporate social responsibility in a comparative perspective. Oxford
Handbook of Corporate Social Responsibility, Oxford University Press.
Xcel Energy. 2011. 2011 proxy statement, filed April 5, 2011, p. 52. Xcel.
http://investors.xcelenergy.com/SEC-Filings
Xue, Y. 2007. Make or buy new technology: The role of CEO compensation contract in a firm’s route to
innovation. Review of Accounting Studies 12 (4): 659–690.
Zajac, E. J., and J. D. Westphal. 1995. Accounting for the explanations of CEO compensation: Substance and
symbolism. Administrative Science Quarterly 40 (2): 283–308.
Zhong, R. I. 2018. Transparency and firm innovation. Journal of Accounting and Economics 66 (1): 67–93.

37
Appendix A. An Example of CSR Contracting
The international gold producer Newmont Mining Corporation links “employee health and safety” and
“sustainability and external relations” to its executives’ annual bonuses, which account for 20% and 5%
of the total bonuses, respectively. Moreover, the company’s annual report shows that the executives’
annual bonuses comprise 70% of their annual incentives (Newmont Mining Corporation 2019), so the
CSR-based bonuses comprise a substantial proportion of the executives’ overall compensation.
The table below is extracted from the company’s 2019 proxy statement (p. 71).28
28 A proxy statement is a document that all publicly listed U.S. firms are required to file to the U.S. Securities and
Exchange Commission (SEC) before shareholder meetings. It covers material matters of the firm relevant to shareholders’
voting decisions. According to the SEC, a proxy statement must disclose executives’ compensation schemes, which
include salary, bonuses, equity awards, any deferred compensation, and other perks.

38
Appendix B. Variable Definitions and Data Sources
Variable Definition Data Source
Innovation measures
PATENT Natural logarithm of one plus the number of patents filed by a firm in a
given year.
Orbis
PATENT_Adj Natural logarithm of one plus the truncation-adjusted patent counts filed
by a firm in a given year.
Orbis
PATENT_Efficiency Innovation efficiency measured as patent counts divided by R&D capital
(RDC), where RDC is computed as R&Dt + 0.8×R&Dt-1 + 0.6×R&Dt-2 +
0.4×R&Dt-3 + 0.2×R&Dt-4 (R&D is annual research and development
expenditures in millions).
Orbis, Worldscope
PATENT_Value The economic value of innovation, which is calculated as the change in
the market value of a firm (adjusted by the market’s average return during
the same measurement window) in a three-day window following the
patent grant announcement.
Orbis, Capital IQ
CITATION Natural logarithm of one plus the number of citations of all patents filed
by a firm in a given year.
Orbis
CITATION_Adj Natural logarithm of one plus the truncation-adjusted citation counts of
all patents filed by a firm in a given year.
Orbis
CITATION_Efficiency Innovation efficiency measured as citation counts divided by R&D
capital (RDC).
Orbis, Worldscope
CSR Contracting
CSRContracting An indicator variable that equals 1 if senior executives’ compensation is
linked to CSR/H&S (Health and Safety)/sustainability targets (CSR
contracting) in the year, and 0 otherwise. According to ASSET4, this data
item is derived using the underlying data item ‘Senior Executive CSR
Sustainability Compensation Incentives’ (this question is answered as
Yes/No for every executive in the company). If for any one of the
executives it is answered as ‘Yes’ for this data item, the indicator
Sustainability Compensation Incentives becomes ‘Yes’.
ASSET4
POST_CSRContracting An indicator variable that equals 1 for the year of CSR contracting
adoption and any year after, and 0 otherwise.
Own construction
CSRContracting_Alt An alternative measure of CSR contracting, which is an indicator variable
that equals 1 if the firm’s executive compensation is explicitly tied to
ESG performance targets, and 0 otherwise. The variable is constructed
based on Sustainalytics’ data item G.2.6.
Sustainalytics
Compensation variables
Comp_LongtermFin An indicator variable that equals 1 if the management and board
members’ remuneration is partly linked to financial objectives or targets
that are more than two years forward looking, and 0 otherwise.
ASSET4
Comp_LongtermStock An indicator variable that equals 1 if the company’s most recently granted
stocks or stock options vest in a three-year period at minimum, and 0
otherwise.
ASSET4
Comp_ShareholderReturn An indicator variable that equals 1 if senior executives’ compensation is
linked to the total shareholder returns in the year, and 0 otherwise.
ASSET4
ExecutivePerf_ESGtarget An indicator variable that equals 1 if ESG targets are used to evaluate
executive performance but no such reference is made in the remuneration
policy, and 0 otherwise. The variable is constructed based on
Sustainalytics’ data item G.2.5.
Sustainalytics
Board characteristics
BoardIndep The percentage of independent directors serving on the company’s board
in the year.
ASSET4
CEODuality An indicator variable that equals 1 if the company’s CEO and chair of the
board is the same person, and 0 otherwise.
ASSET4
CSR performance
CSRPerf The average of SOCPerf and ENVPerf defined below. ASSET4
SOCPerf Social performance score. The value of the variable ranges between 0 and
100, with a higher value indicating better performance.
ASSET4
ENVPerf Environmental performance sore. The value of the variable ranges
between 0 and 100, with a higher value indicating better environmental
performance.
ASSET4
EMPPerf Employee-related performance score. The value of the variable ranges
between 0 and 100, with a higher value indicating better employee
performance.
ASSET4
EMP_EQ The workforce/employment quality score. According to ASSET4, it
“measures a company’s management commitment and effectiveness
towards providing high-quality employment benefits and job conditions.
It reflects a company’s capacity to increase its workforce loyalty and
productivity by distributing rewarding and fair employment benefits, and
ASSET4

39
by focusing on long-term employment growth and stability by promoting
from within, avoiding lay-offs and maintaining relations with trade
unions.”
EMP_HS The workforce/health and safety score. According to ASSET4, it
“measures a company’s management commitment and effectiveness
towards providing a healthy and safe workplace. It reflects a company’s
capacity to increase its workforce loyalty and productivity by integrating
into its day-to-day operations a concern for the physical and mental
health, well-being and stress level of all employees.”
ASSET4
EMP_TD The workforce/training and development score. According to ASSET4,
it “measures a company’s management commitment and effectiveness
towards providing training and development (education) for its
workforce. It reflects a company’s capacity to increase its intellectual
capital, workforce loyalty and productivity by developing the
workforce’s skills, competences, employability and careers in an
entrepreneurial environment.”
ASSET4
EMP_DO The workforce/diversity and opportunity score. According to ASSET4, it
“measures a company’s management commitment and effectiveness
towards maintaining diversity and equal opportunities in its workforce. It
reflects a company’s capacity to increase its workforce loyalty and
productivity by promoting an effective life-work balance, a family
friendly environment and equal opportunities regardless of gender, age,
ethnicity, religion or sexual orientation.”
ASSET4
Other controls
R&D Research and development expenditures scaled by total assets. Worldscope
ExternalFinance The sum of a firm’s net equity issues (scaled by total assets) over a rolling
five-year window ending in the current fiscal year.
Worldscope
Size Natural logarithm of the book value of total assets, measured at the end
of the fiscal year in millions.
Worldscope
MTB Market value of equity divided by the book value of equity. Worldscope
InsiderOwnership The total number of closely held shares as a percentage of the total
number of shares outstanding.
Worldscope
CapitalIntensity Net property, plant, and equipment divided by the total number of
employees.
Worldscope
SalesGrowth The annual change in net sales scaled by beginning total assets. Worldscope
ForeignSales Foreign sales scaled by total sales. Worldscope
Age Natural logarithm of one plus the number of years listed on Worldscope. Worldscope
Leverage Total liabilities scaled by total assets. Worldscope
ROA Net income before extraordinary items scaled by beginning total assets. Worldscope
Cash Cash holding scaled by total assets. Worldscope
HHI Industry Herfindahl–Hirschman index based on all firms within each
country, where industries are defined by the three-digit SIC code.
Worldscope
HHI2 The squared term of HHI. Worldscope
LNGDP Natural logarithm of gross domestic product per capita. World Bank
Other variables used in the additional analysis
Stakeholder Orientation The principal factor of the following four proxies: (1) STAKELAW, which
measures the stringency of a country’s legal environment in protecting
labor rights and benefits; (2) CSRLAW, which measures the degree of a
country’s mandatory requirements for CSR disclosure; (3) PUBWARE,
which assesses a country’s public awareness of CSR issues; and (4)
PUBAWARE1, the attitudes of corporate executives to CSR engagement
at the country level.
Dhaliwal et al. (2012)
Rule of Law A proxy for the overall enforcement ability of a country’s legal and
regulatory systems, which measures the extent to which agents have
confidence in and abide by the rules of society and, in particular, the
quality of contract enforcement, property rights, the police, and the
courts.
Worldbank
The Heckman two-step model
ASSET4 Sample An indicator variable that equals 1 if the observation is covered in
ASSET4, and 0 otherwise.
Own construction
Mills The inverse Mills ratio, which measures the predicted likelihood of the
observation being covered in ASSET4. It controls for the sample
selection bias in the second stage of the two-stage Heckman model.
Own construction

40
Appendix C. Comparative Statistics of Matched Sample CSRContracting=1 CSRContracting=0
N=2,374 N=2,374
(1) (2) (3) (4) (5) (6)
Mean S.D. Mean S.D.
diff.
[(1)-(3)] p-value
PATENTt+1 0.881 1.643 0.701 1.485 0.180 0.000
CITATIONt+1 0.604 1.397 0.483 1.291 0.121 0.002
CSRPerft 61.764 27.498 52.997 28.431 8.767 0.000
Comp_LongtermFint 0.161 0.368 0.161 0.368 0.000 1.000
R&Dt 0.015 0.033 0.015 0.036 0.000 0.779
ExternalFinancet 0.002 0.083 0.012 0.098 -0.010 0.000
Sizet 8.532 1.416 8.508 1.398 0.024 0.565
MTBt 3.022 3.372 3.189 3.538 -0.167 0.095
InsiderOwnershipt 0.146 0.209 0.174 0.219 -0.028 0.000
CapitalIntensityt 4.677 1.767 4.685 1.848 -0.008 0.876
SalesGrowtht 0.023 0.203 0.050 0.202 -0.027 0.000
ForeignSalest 0.454 0.338 0.430 0.348 0.024 0.019
Aget 3.506 0.079 3.509 0.077 -0.003 0.243
Leveraget 0.548 0.185 0.544 0.197 0.004 0.571
ROAt 0.052 0.095 0.054 0.092 -0.002 0.521
Casht 0.115 0.104 0.123 0.122 -0.008 0.016
HHIt 0.379 0.305 0.390 0.314 -0.011 0.223
HHIt2 0.236 0.325 0.250 0.336 -0.014 0.147
LNGDPt 10.669 0.572 10.675 0.566 -0.006 0.718
Note: Total sample is 4,748 firm years, including 2,374 firm years for firms that adopt CSR contracting (the
treatment group) and 2,374 firm years for firms that do not adopt CSR contracting (control group).
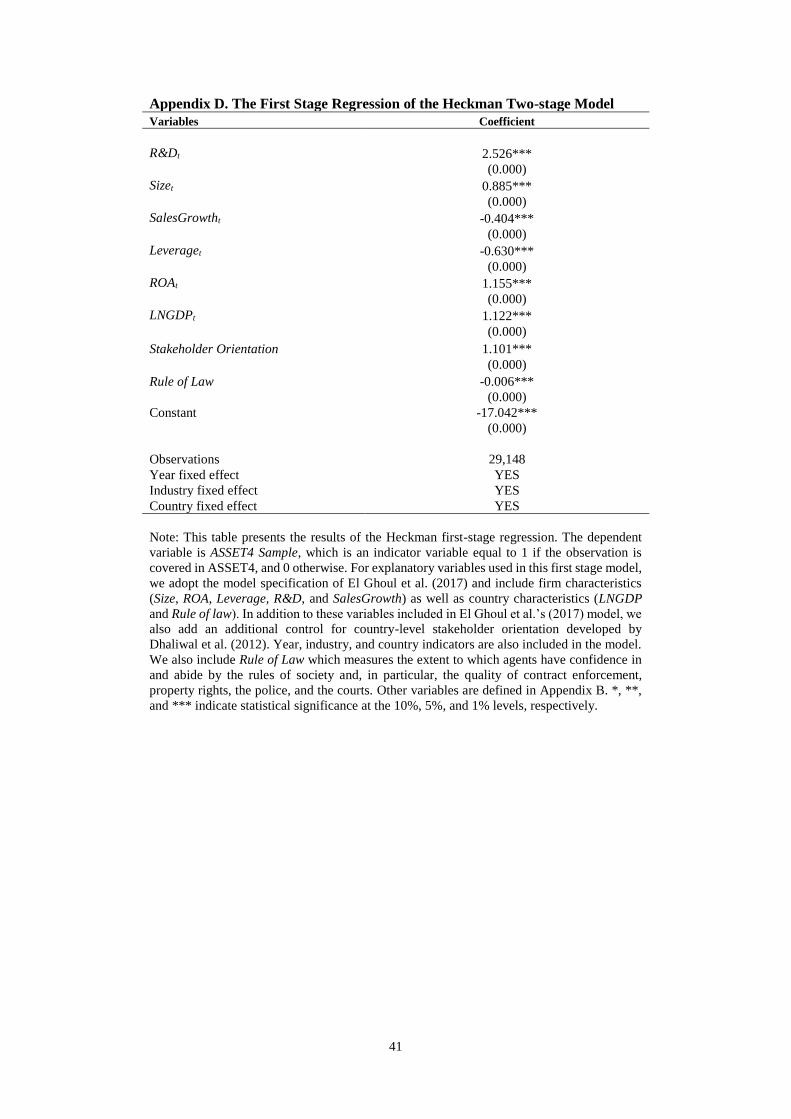
41
Appendix D. The First Stage Regression of the Heckman Two-stage Model
Variables Coefficient
R&Dt 2.526***
(0.000)
Sizet 0.885***
(0.000)
SalesGrowtht -0.404***
(0.000)
Leveraget -0.630***
(0.000)
ROAt 1.155***
(0.000)
LNGDPt 1.122***
(0.000)
Stakeholder Orientation 1.101***
(0.000)
Rule of Law -0.006***
(0.000)
Constant -17.042***
(0.000)
Observations 29,148
Year fixed effect YES
Industry fixed effect YES
Country fixed effect YES
Note: This table presents the results of the Heckman first-stage regression. The dependent
variable is ASSET4 Sample, which is an indicator variable equal to 1 if the observation is
covered in ASSET4, and 0 otherwise. For explanatory variables used in this first stage model,
we adopt the model specification of El Ghoul et al. (2017) and include firm characteristics
(Size, ROA, Leverage, R&D, and SalesGrowth) as well as country characteristics (LNGDP
and Rule of law). In addition to these variables included in El Ghoul et al.’s (2017) model, we
also add an additional control for country-level stakeholder orientation developed by
Dhaliwal et al. (2012). Year, industry, and country indicators are also included in the model.
We also include Rule of Law which measures the extent to which agents have confidence in
and abide by the rules of society and, in particular, the quality of contract enforcement,
property rights, the police, and the courts. Other variables are defined in Appendix B. *, **,
and *** indicate statistical significance at the 10%, 5%, and 1% levels, respectively.

42
Table 1. Sample Distribution Panel A: Sample distribution and statistics by country
Country N % of
full sample
% of CSR
contracting
adopters
within
country
Patent
(Full
Sample)
Citation
(Full
Sample)
Patent
(Patent
Sample)
Citation
(Citation
Sample)
N=17,855 N=17,855 N=17,855 N=6,350 N=4,663
1. Australia 823 4.61 39.85 1.00 1.69 13.56 43.47
2. Austria 77 0.43 6.49 2.38 0.94 5.72 5.14
3. Belgium 95 0.53 16.84 11.19 6.49 23.62 20.57
4. Brazil 119 0.67 14.29 0.95 0.15 5.14 4.50
5. Canada 1,008 5.65 24.70 0.38 0.47 4.51 11.46
6. China 303 1.70 0.66 1.21 0.45 14.12 7.61
7. Denmark 142 0.80 14.79 36.15 29.80 64.16 70.53
8. Finland 241 1.35 11.62 32.32 48.24 63.84 163.73
9. France 536 3.00 16.79 9.80 5.34 30.71 30.12
10. Germany 438 2.45 7.31 28.52 42.38 63.41 128.02
11. Greece 59 0.33 5.08 0.00 0.00 0.00 0.00
12. Hong Kong 533 2.99 2.25 0.14 0.02 4.17 2.60
13. India 300 1.68 6.33 4.46 2.26 12.75 16.14
14. Indonesia 96 0.54 11.46 0.00 0.00 0.00 0.00
15. Ireland 128 0.72 12.50 0.00 0.00 0.00 0.00
16. Italy 160 0.9 14.38 3.09 1.86 10.53 11.92
17. Japan 2,562 14.35 1.48 219.44 138.12 254.73 201.40
18. Malaysia 61 0.34 3.28 0.00 0.00 0.00 0.00
19. Mexico 84 0.47 10.71 0.13 0.00 2.75 0.00
20. Netherlands 227 1.27 26.43 4.58 3.88 28.08 41.90
21. Norway 122 0.68 36.89 1.68 1.20 8.91 14.60
22. Singapore 105 0.59 11.43 0.01 0.00 1.00 0.00
23. South Africa 330 1.85 35.45 0.04 0.00 1.75 0.00
24. South Korea 314 1.76 7.64 114.89 52.83 143.73 115.21
25. Spain 176 0.99 9.66 0.79 0.13 3.86 3.29
26. Sweden 339 1.9 10.03 3.72 3.14 18.01 24.20
27. Switzerland 331 1.85 8.46 5.23 2.70 24.03 20.79
28. Turkey 72 0.40 6.94 3.64 0.08 18.71 2.00
29. United Kingdom 1,983 11.11 25.37 1.03 1.24 16.16 32.81
30. United States 6,091 34.11 17.44 22.34 63.10 54.68 194.42
Overall 17,855 100.00 15.84 43.49 44.88 122.29 171.84

43
Panel B: Sample distribution and statistics by year
Year N
% of
full
sample
% of CSR
contracting
adopters
within year
Patent
(Full
Sample)
Citation
(Full
Sample)
Patent
(Patent
Sample)
Citation
(Citation
Sample)
N=17,855 N=17,855 N=17,855 N=6,350 N=4,663
1. 2004 855 4.79 1.87 70.77 148.51 145.44 328.96
2. 2005 1,053 5.90 2.09 76.27 132.71 150.97 283.45
3. 2006 1,036 5.80 3.57 76.57 124.00 150.24 267.63
4. 2007 1,064 5.96 3.48 75.03 98.19 151.77 217.65
5. 2008 1,258 7.05 4.21 59.46 70.28 121.83 159.31
6. 2009 1,426 7.99 5.54 60.88 58.73 126.00 133.58
7. 2010 1,612 9.03 10.79 52.98 37.16 113.57 91.17
8. 2011 1,701 9.53 16.11 48.71 24.03 107.05 61.76
9. 2012 1,759 9.85 22.68 42.97 10.46 99.07 30.88
10. 2013 1,580 8.85 29.81 14.67 3.69 38.95 13.70
11. 2014 1,988 11.13 32.29 15.73 1.83 39.42 7.05
12. 2015 2,523 14.13 24.73 6.60 0.31 16.01 1.22
Overall 17,855 100.00 15.84 43.49 44.88 122.29 171.84
Panel C: Sample distribution and statistics by industry
Industry N
% of
full
sample
% of CSR
contracting
adopters
within
country
Patent
(Full
Sample)
Citation
(Full
Sample)
Patent
(Patent
Sample)
Citation
(Citation
Sample)
N=17,855 N=17,855 N=17,855 N=6,350 N=4,663
1. Mining/Construction 1,734 9.71 26.12 4.31 0.52 49.48 14.33
2. Food 990 5.54 12.73 7.48 4.93 24.44 12.08
3. Textiles/Print/Publish 896 5.02 14.84 19.73 8.97 72.16 30.89
4. Chemicals 1,065 5.96 20.19 80.35 28.18 138.02 46.44
5. Pharmaceuticals 698 3.91 10.46 38.19 46.45 64.07 64.68
6. Extractive 1,364 7.64 29.91 5.09 3.28 30.96 109.91
7. Manf: Rubber
/Glass/Etc.
583 3.27 13.38 62.70 24.39 127.36 35.76
8. Manf: Metal 803 4.50 16.94 41.45 15.91 98.19 68.70
9. Manf: Machinery 965 5.40 10.57 79.68 72.72 133.04 55.07
10. Manf: Electrical
Equipment
631 3.53 8.40 217.46 259.54 292.57 150.90
11. Manf: Transport
Equipment
845 4.73 16.45 115.56 98.41 208.20 414.60
12. Manf: Instruments 913 5.11 10.41 74.37 83.32 122.35 222.34
13. Manf: Misc. 135 0.76 3.70 74.70 70.58 114.60 172.10
14. Computers 1,807 10.12 8.97 88.41 155.91 141.63 146.58
15. Retail: Wholesale 663 3.71 9.80 2.83 1.45 18.95 301.00
16. Retail: Misc 1,519 8.51 12.05 0.36 0.95 5.26 19.61
17. Retail: Restaurant 211 1.18 19.91 0.32 0.82 6.18 24.03
18. Services 1,932 10.82 17.75 1.55 3.39 11.58 19.22
19. Others 101 0.57 16.83 0.18 0.00 3.00 46.81
Overall 17,855 100.00 15.84 43.49 44.88 122.29 171.84
Note: This table presents the sample distribution in this study. Panel A reports the sample distribution by country. Panel
B reports the sample distribution by year. Panel C reports the sample distribution by industry following the industry
classification by Barth et al. (2005). The sample comprises 17,855 firm-year observations from 30 countries from 2004
to 2015.

44
Table 2. Summary Statistics Variables N Mean S.D. 25% Median 75%
PATENTt+1 (raw) PatentSample 6,350 122.29 227.81 5 28 124
PATENTt+1 (raw) FullSample 17,855 43.492 147.93 0 0 8
PATENTt+1 (ln) FullSample 17,855 1.211 1.951 0 0 2.197
PATENT_Efficiency 10,377 0.174 0.415 0.000 0.011 0.140
PATENT_Value 17,855 -0.003 0.644 -25.137 0.000 0.000
CITATIONt+1(raw) CitationSample 4,663 171.84 354.62 6 29 141
CITATIONt+1(raw) FullSample 17,855 44.876 196.3 0 0 1
CITATIONt+1 (ln) FullSample 17,855 0.92 1.826 0 0 0.693
CSRContractingt 17,855 0.158 0.365 0 0 0
CSRPerft 17,855 51.694 27.922 30.775 45.38 78.69
Comp_LongtermFint 17,855 0.103 0.304 0 0 0
R&Dt 17,855 0.021 0.04 0 0.002 0.024
ExternalFinancet 17,855 0.006 0.093 -0.032 -0.002 0.029
Sizet 17,855 8.365 1.325 7.526 8.334 9.197
MTBt 17,855 3.115 3.416 1.279 2.159 3.651
InsiderOwnershipt 17,855 0.225 0.228 0.020 0.152 0.363
CaptialIntensityt 17,855 4.466 1.576 3.460 4.285 5.243
SalesGrowtht 17,855 0.073 0.224 -0.030 0.047 0.147
ForeignSalest 17,855 0.422 0.327 0.108 0.410 0.696
Aget 17,855 3.443 0.111 3.367 3.466 3.555
Leveraget 17,855 0.525 0.197 0.393 0.533 0.659
ROAt 17,855 0.061 0.096 0.023 0.056 0.100
Casht 17,855 0.144 0.134 0.05 0.103 0.194
HHIt 17,855 0.364 0.303 0.122 0.256 0.524
HHIt2 17,855 0.224 0.318 0.015 0.065 0.274
LnGDPt 17,855 10.56 0.646 10.569 10.75 10.848
Note: This table reports the summary statistics for key variables used in the main regression analyses. See Appendix
B for detailed variable definitions.

45
Table 3. CSR Contracting and Innovation Panel A. Results for patent
(1) (2) (3) (4) (5) (6) (7)
Model Full sample Excluding U.S.
firms
WLS regression Truncation adjusted
patent
PSM sample With firm fixed
effect
Second Stage
Regression
Dep. Var. PATENTt+1 PATENTt+1 PATENTt+1 PATENT_Adj t+1 PATENTt+1 PATENTt+1 PATENTt+1
CSRContractingt 0.106*** 0.163*** 0.154*** 0.096** 0.097*** 0.087*** 0.105** (0.009) (0.000) (0.000) (0.029) (0.007) (0.000) (0.011)
CSRPerft 0.006*** 0.004*** 0.004*** 0.006*** 0.004*** 0.001*** 0.006*** (0.000) (0.000) (0.000) (0.000) (0.000) (0.008) (0.000)
Comp_LongtermFint 0.099* 0.047 0.045 0.112* 0.096 0.065* 0.103*
(0.096) (0.512) (0.390) (0.082) (0.141) (0.055) (0.090)
R&Dt 12.409*** 9.914*** 9.616*** 13.284*** 8.532*** 1.916*** 12.508*** (0.000) (0.000) (0.000) (0.000) (0.000) (0.002) (0.000)
ExternalFinancet -0.168 0.127 0.109 -0.162 0.047 -0.053 -0.211* (0.142) (0.321) (0.380) (0.179) (0.746) (0.386) (0.072)
Sizet 0.215*** 0.198*** 0.186*** 0.240*** 0.124*** 0.076*** 0.208*** (0.000) (0.000) (0.000) (0.000) (0.000) (0.008) (0.000)
MTBt 0.005 0.010 0.010** 0.007 0.012 -0.001 0.006 (0.343) (0.188) (0.023) (0.245) (0.116) (0.751) (0.323)
InsiderOwnershipt -0.236** -0.180* -0.174*** -0.273*** -0.169* 0.035 -0.193**
(0.012) (0.098) (0.001) (0.006) (0.076) (0.546) (0.047)
CaptialIntensityt 0.016 -0.031* -0.020** 0.013 0.026* 0.024 0.026 (0.333) (0.070) (0.018) (0.438) (0.060) (0.190) (0.129)
SalesGrowtht 0.007 0.003 0.012 0.040 0.027 -0.058** 0.007 (0.892) (0.958) (0.822) (0.449) (0.673) (0.023) (0.901)
ForeignSalest 0.275*** 0.244*** 0.242*** 0.321*** 0.098 -0.223*** 0.249*** (0.000) (0.000) (0.000) (0.000) (0.135) (0.000) (0.000)
Aget 1.028 -3.378*** -2.974*** 1.094 1.534** -0.699 1.029 (0.256) (0.000) (0.000) (0.260) (0.011) (0.175) (0.253)
Leveraget -0.068 -0.041 -0.100 -0.087 -0.240* -0.051 -0.060 (0.588) (0.797) (0.170) (0.509) (0.073) (0.561) (0.640)
ROAt 0.153 -0.036 0.032 0.183 -0.063 -0.226*** 0.119 (0.347) (0.848) (0.817) (0.281) (0.716) (0.009) (0.496)
Casht 0.312* -0.289 -0.114 0.381** 0.867*** -0.077 0.357* (0.079) (0.170) (0.264) (0.042) (0.000) (0.491) (0.055)
HHIt 0.038 0.178 0.050 0.089 -0.582 0.167 0.121 (0.912) (0.652) (0.759) (0.810) (0.107) (0.651) (0.737)
HHIt2 0.065 -0.066 0.025 0.036 0.466 -0.153 -0.010

46
(0.825) (0.841) (0.855) (0.908) (0.120) (0.601) (0.974)
LNGDPt 1.294*** 1.384*** 1.143*** 1.136*** 0.138 1.095*** 1.419*** (0.000) (0.000) (0.000) (0.000) (0.427) (0.000) (0.000)
Millst -0.047 (0.753)
Constant -18.73*** -5.11*** -2.88*** -17.54*** -7.23*** -8.37*** -20.08*** (0.000) (0.000) (0.005) (0.000) (0.007) (0.000) (0.000)
Observations 17,855 11,764 11,764 17,855 4,748 17,855 16,942
R-squared 0.637 0.711 0.678 0.639 0.463 0.946 0.637
Year fixed effect YES YES YES YES YES YES YES
Industry fixed effect YES YES YES YES YES NO YES
Country fixed effect YES YES YES YES YES NO YES
Firm fixed effect NO NO NO NO NO YES NO
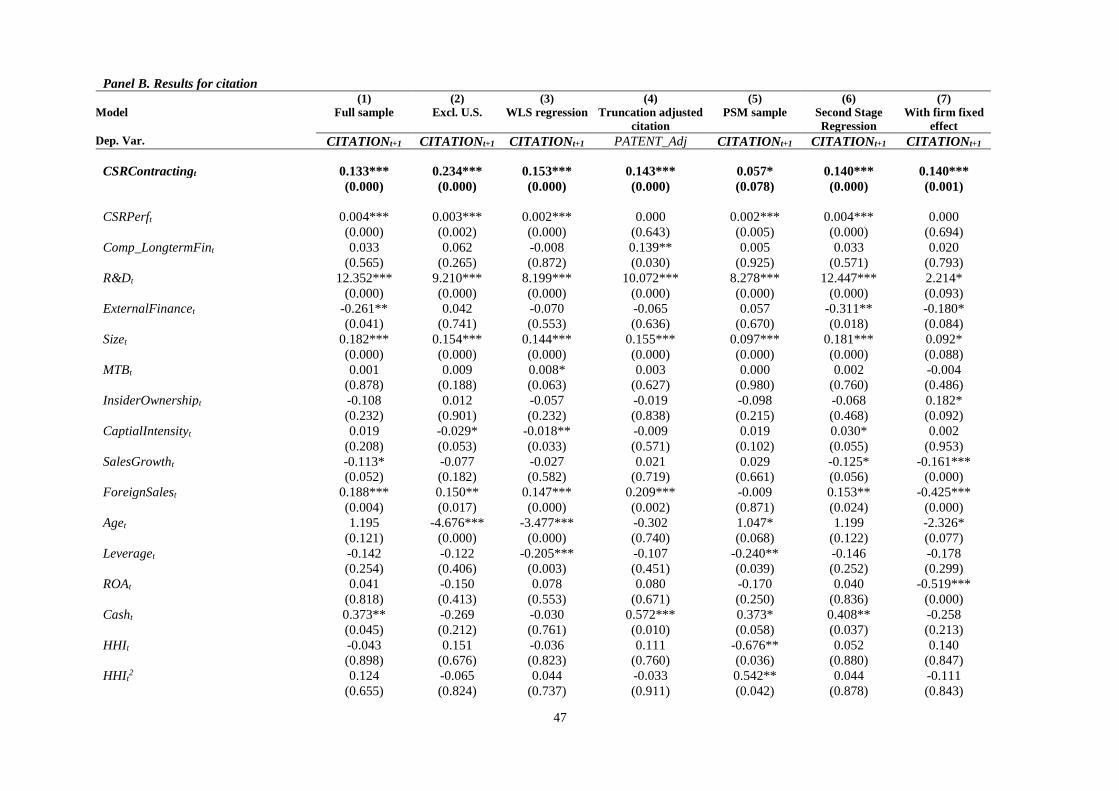
47
Panel B. Results for citation
(1) (2) (3) (4) (5) (6) (7)
Model Full sample Excl. U.S. WLS regression Truncation adjusted
citation
PSM sample Second Stage
Regression
With firm fixed
effect
Dep. Var. CITATIONt+1 CITATIONt+1 CITATIONt+1 PATENT_Adj CITATIONt+1 CITATIONt+1 CITATIONt+1
CSRContractingt 0.133*** 0.234*** 0.153*** 0.143*** 0.057* 0.140*** 0.140*** (0.000) (0.000) (0.000) (0.000) (0.078) (0.000) (0.001)
CSRPerft 0.004*** 0.003*** 0.002*** 0.000 0.002*** 0.004*** 0.000 (0.000) (0.002) (0.000) (0.643) (0.005) (0.000) (0.694)
Comp_LongtermFint 0.033 0.062 -0.008 0.139** 0.005 0.033 0.020 (0.565) (0.265) (0.872) (0.030) (0.925) (0.571) (0.793)
R&Dt 12.352*** 9.210*** 8.199*** 10.072*** 8.278*** 12.447*** 2.214* (0.000) (0.000) (0.000) (0.000) (0.000) (0.000) (0.093)
ExternalFinancet -0.261** 0.042 -0.070 -0.065 0.057 -0.311** -0.180* (0.041) (0.741) (0.553) (0.636) (0.670) (0.018) (0.084)
Sizet 0.182*** 0.154*** 0.144*** 0.155*** 0.097*** 0.181*** 0.092* (0.000) (0.000) (0.000) (0.000) (0.000) (0.000) (0.088)
MTBt 0.001 0.009 0.008* 0.003 0.000 0.002 -0.004 (0.878) (0.188) (0.063) (0.627) (0.980) (0.760) (0.486)
InsiderOwnershipt -0.108 0.012 -0.057 -0.019 -0.098 -0.068 0.182* (0.232) (0.901) (0.232) (0.838) (0.215) (0.468) (0.092)
CaptialIntensityt 0.019 -0.029* -0.018** -0.009 0.019 0.030* 0.002 (0.208) (0.053) (0.033) (0.571) (0.102) (0.055) (0.953)
SalesGrowtht -0.113* -0.077 -0.027 0.021 0.029 -0.125* -0.161*** (0.052) (0.182) (0.582) (0.719) (0.661) (0.056) (0.000)
ForeignSalest 0.188*** 0.150** 0.147*** 0.209*** -0.009 0.153** -0.425*** (0.004) (0.017) (0.000) (0.002) (0.871) (0.024) (0.000)
Aget 1.195 -4.676*** -3.477*** -0.302 1.047* 1.199 -2.326* (0.121) (0.000) (0.000) (0.740) (0.068) (0.122) (0.077)
Leveraget -0.142 -0.122 -0.205*** -0.107 -0.240** -0.146 -0.178 (0.254) (0.406) (0.003) (0.451) (0.039) (0.252) (0.299)
ROAt 0.041 -0.150 0.078 0.080 -0.170 0.040 -0.519*** (0.818) (0.413) (0.553) (0.671) (0.250) (0.836) (0.000)
Casht 0.373** -0.269 -0.030 0.572*** 0.373* 0.408** -0.258 (0.045) (0.212) (0.761) (0.010) (0.058) (0.037) (0.213)
HHIt -0.043 0.151 -0.036 0.111 -0.676** 0.052 0.140 (0.898) (0.676) (0.823) (0.760) (0.036) (0.880) (0.847)
HHIt2 0.124 -0.065 0.044 -0.033 0.542** 0.044 -0.111
(0.655) (0.824) (0.737) (0.911) (0.042) (0.878) (0.843)

48
LNGDPt 0.940*** 1.278*** 0.810*** 1.113*** -0.296 1.021*** 0.706*** (0.000) (0.000) (0.000) (0.000) (0.173) (0.000) (0.000)
Millst -0.009
(0.957) Constant -14.54*** 0.978 2.52** -11.55*** -0.080 -15.52*** 1.371
(0.000) (0.443) (0.011) (0.000) (0.978) (0.000) (0.758)
Observations 17,855 11,764 11,764 17,855 4,646 16,942 17,855
R-squared 0.503 0.560 0.486 0.425 0.360 0.507 0.829
Year fixed effect YES YES YES YES YES YES YES
Industry fixed effect YES YES YES YES YES YES YES
Country fixed effect YES YES YES YES YES YES YES
Firm fixed effect NO NO NO NO NO YES NO
Note: This table presents the regression results of the effect of CSR contracting on firm innovation. The dependent variables in Panels A and B are PATENT and CITATION
respectively. All of the variables are defined in Appendix B. p-values based on robust standard errors adjusted for clustering by firm are reported in parentheses. *, **, and ***
indicate statistical significance at the 10%, 5%, and 1% levels, respectively.

49
Table 4. CSR Contracting and Innovation – Alternative Measures of Innovation
(1) (2) (3)
Dep. Var. PATENT_Efficiencyt+1 CITATION_Efficiencyt+1 PATENT_Valuet+1
CSRContractingt 0.064*** 0.065*** 0.023* (0.000) (0.000) (0.079)
CSRPerft 0.001 -0.001** -0.000 (0.853) (0.028) (0.472)
Comp_LongtermFint 0.022** -0.042* 0.016** (0.040) (0.066) (0.033)
R&Dt -0.326
(0.100)
ExtenralFinancet 0.079** 0.121* -0.030 (0.023) (0.091) (0.577)
Sizet -0.028*** -0.027*** -0.004 (0.000) (0.002) (0.410)
MTBt 0.003** 0.002 0.002** (0.045) (0.414) (0.025)
InsiderOwnershipt 0.067 0.099** -0.035 (0.193) (0.017) (0.247)
CaptialIntensityt 0.015** 0.019 0.005 (0.024) (0.108) (0.258)
SalesGrowtht 0.055** 0.028 0.014 (0.050) (0.495) (0.610)
ForeignSalest -0.000 0.081** 0.027 (0.993) (0.013) (0.106)
Aget -0.259 0.606** 0.021 (0.565) (0.015) (0.460)
Leveraget 0.017 -0.134** -0.002 (0.672) (0.016) (0.940)
ROAt 0.165** 0.153* 0.048 (0.021) (0.095) (0.437)
Casht -0.053 0.174 -0.040 (0.258) (0.109) (0.373)
HHIt 0.295** 0.128 0.105 (0.035) (0.398) (0.179)
HHIt2 -0.210** -0.027 -0.021
(0.038) (0.820) (0.764)
LNGDPt 0.241*** -0.095 -0.045 (0.000) (0.178) (0.372)
Constant -1.671 -0.476 0.358 (0.291) (0.657) (0.513)
Observations 10,377 10,377 17,855
R-squared 0.304 0.173 0.031
Year fixed effect YES YES YES
Industry fixed effect YES YES YES
Country fixed effect YES YES YES
Note: This table presents the regression results of the effect of CSR contracting on firm innovation using additional
innovation measures. All of the variables are defined in Appendix B. p-values based on robust standard errors
adjusted for clustering by firm are reported in parentheses. *, **, and *** indicate statistical significance at the
10%, 5%, and 1% levels, respectively.

50
Table 5. CSR Contracting and Innovation - Additional Robustness Tests Panel A. Dependent variable: PATENTt+1
(1) (2) (3) (4) (5) (6) (7) Alternative
measure of CSR
contracting
DID model Year [t-3, t+3] Excl. firms
experienced
CEO change
Control for
Comp_Longterm
Stock
Control for
Comp_
Shareholder
Return
Control for
BoardIndep &
CEODuality
Dep. Var. PATENTt+1 PATENTt+1 PATENTt+1 PATENTt+1 PATENTt+1 PATENTt+1 PATENTt+1
CSRContracting_Altt 0.151**
(0.050)
ExecutivePerf_ESGtargett -0.096
(0.208)
CSRContractingt
0.081*** 0.091** 0.101** 0.104** 0.108*** (0.000) (0.041) (0.014) (0.010) (0.008)
POST_CSRContracting
0.062**
(0.019)
CSRPerft 0.004*** 0.001 0.002*** 0.005*** 0.006*** 0.006*** 0.006*** (0.000) (0.215) (0.001) (0.000) (0.000) (0.000) (0.000)
Comp_LongtermFint 0.261*** 0.060* 0.082** 0.077 0.097 0.099* 0.093
(0.006) (0.079) (0.016) (0.138) (0.104) (0.097) (0.117)
R&Dt 10.224*** 1.745*** 0.808 13.408*** 12.411*** 12.411*** 12.007*** (0.000) (0.008) (0.202) (0.000) (0.000) (0.000) (0.000)
ExternalFinancet 0.124 -0.086 -0.099 -0.213 -0.161 -0.166 -0.210* (0.604) (0.197) (0.143) (0.124) (0.161) (0.147) (0.069)
Sizet 0.177*** 0.087*** 0.115*** 0.210*** 0.214*** 0.215*** 0.208*** (0.000) (0.006) (0.004) (0.000) (0.000) (0.000) (0.000)
MTBt 0.002 0.002 -0.002 0.004 0.005 0.005 0.005 (0.796) (0.443) (0.625) (0.457) (0.342) (0.345) (0.319)
InsiderOwnershipt -0.585*** 0.048 -0.001 -0.345*** -0.232** -0.234** -0.269*** (0.000) (0.371) (0.989) (0.000) (0.013) (0.013) (0.003)
CapitalIntensityt 0.018 0.038* 0.003 -0.026*** 0.016 0.016 0.024 (0.544) (0.064) (0.895) (0.006) (0.325) (0.335) (0.119)
SalesGrowtht 0.139 -0.043* -0.060* 0.049 0.012 0.007 0.004 (0.165) (0.075) (0.051) (0.434) (0.824) (0.884) (0.933)
ForeignSalest 0.309*** -0.169*** -0.272*** 0.348*** 0.275*** 0.274*** 0.290*** (0.004) (0.004) (0.000) (0.000) (0.000) (0.000) (0.000)
Aget 1.782* -1.357** -0.775 -0.292 1.029 1.022 0.938 (0.055) (0.039) (0.417) (0.687) (0.256) (0.260) (0.276)
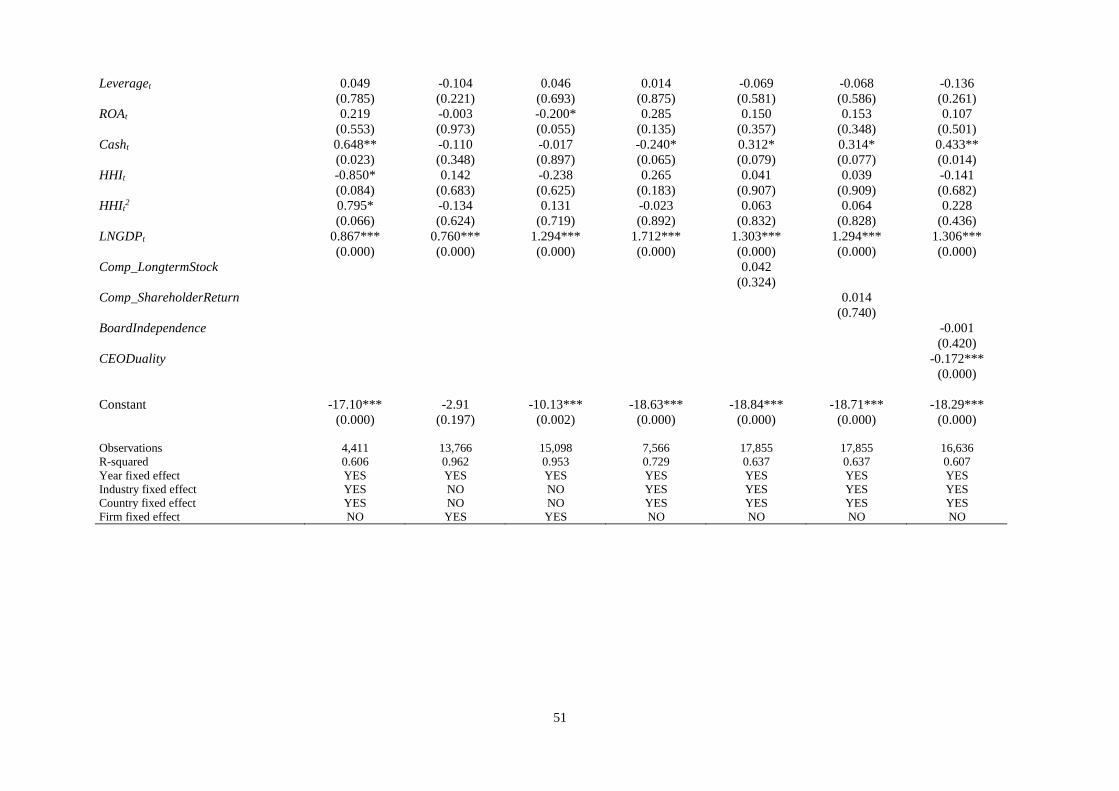
51
Leveraget 0.049 -0.104 0.046 0.014 -0.069 -0.068 -0.136 (0.785) (0.221) (0.693) (0.875) (0.581) (0.586) (0.261)
ROAt 0.219 -0.003 -0.200* 0.285 0.150 0.153 0.107 (0.553) (0.973) (0.055) (0.135) (0.357) (0.348) (0.501)
Casht 0.648** -0.110 -0.017 -0.240* 0.312* 0.314* 0.433** (0.023) (0.348) (0.897) (0.065) (0.079) (0.077) (0.014)
HHIt -0.850* 0.142 -0.238 0.265 0.041 0.039 -0.141 (0.084) (0.683) (0.625) (0.183) (0.907) (0.909) (0.682)
HHIt2 0.795* -0.134 0.131 -0.023 0.063 0.064 0.228
(0.066) (0.624) (0.719) (0.892) (0.832) (0.828) (0.436)
LNGDPt 0.867*** 0.760*** 1.294*** 1.712*** 1.303*** 1.294*** 1.306*** (0.000) (0.000) (0.000) (0.000) (0.000) (0.000) (0.000)
Comp_LongtermStock 0.042
(0.324)
Comp_ShareholderReturn 0.014
(0.740)
BoardIndependence
-0.001 (0.420)
CEODuality
-0.172*** (0.000)
Constant -17.10*** -2.91 -10.13*** -18.63*** -18.84*** -18.71*** -18.29*** (0.000) (0.197) (0.002) (0.000) (0.000) (0.000) (0.000)
Observations 4,411 13,766 15,098 7,566 17,855 17,855 16,636
R-squared 0.606 0.962 0.953 0.729 0.637 0.637 0.607
Year fixed effect YES YES YES YES YES YES YES
Industry fixed effect YES NO NO YES YES YES YES
Country fixed effect YES NO NO YES YES YES YES
Firm fixed effect NO YES YES NO NO NO NO

52
Panel B. Dependent variable: CITATIONt+1 (1) (2) (3) (4) (5) (6) (7)
Alternative
measure of CSR
contracting
DID model Year [t-3, t+3] Excl. firms
experienced CEO
change
Control for
Comp_Longterm
Stock
Control for
Comp_
Shareholder
Return
Control for
BoardIndep &
CEODuality
Dep. Var. CITATAIONt+1 CITATAIONt+1 CITATAIONt+1 CITATAIONt+1 CITATAIONt+1 CITATAIONt+1 CITATAIONt+1
CSRContracting_Altt 0.138* (0.073)
ExecutivePerf_ESGtargett -0.005 (0.946)
POST_CSRContracting 0.133***
(0.008) CSRContractingt 0.101*** 0.184*** 0.098** 0.129*** 0.119***
(0.005) (0.001) (0.038) (0.000) (0.001)
CSRPerft 0.002** -0.001 0.002* 0.003*** 0.005*** 0.004*** 0.003*** (0.028) (0.482) (0.056) (0.001) (0.000) (0.000) (0.000)
Comp_LongtermFint 0.196** 0.038 0.137* 0.104 0.006 0.032 0.020 (0.024) (0.607) (0.077) (0.170) (0.936) (0.575) (0.727)
R&Dt 10.909*** 2.346* 0.411 11.193*** 9.750*** 12.358*** 11.935*** (0.000) (0.056) (0.730) (0.000) (0.000) (0.000) (0.000)
ExternalFinancet 0.280 -0.269*** -0.125 -0.369** -0.298** -0.255** -0.300** (0.246) (0.008) (0.286) (0.015) (0.032) (0.046) (0.020)
LnSizet 0.172*** 0.131** 0.159** 0.127*** 0.243*** 0.180*** 0.176*** (0.000) (0.018) (0.026) (0.000) (0.000) (0.000) (0.000)
MTBt -0.001 -0.001 -0.005 0.005 0.008 0.001 0.001 (0.863) (0.883) (0.451) (0.533) (0.195) (0.889) (0.840)
InsiderOwnershipt -0.349*** 0.113 0.282** -0.099 -0.192* -0.102 -0.162* (0.010) (0.252) (0.022) (0.362) (0.074) (0.260) (0.057)
CaptialIntensityt 0.020 0.036 -0.048 -0.008 0.011 0.019 0.028* (0.394) (0.357) (0.269) (0.622) (0.546) (0.214) (0.064)
SalesGrowtht -0.039 -0.115*** -0.142*** -0.067 -0.103 -0.111* -0.122** (0.712) (0.003) (0.004) (0.336) (0.105) (0.055) (0.033)
ForeignSalest 0.248** -0.325*** -0.485*** 0.252*** 0.205*** 0.186*** 0.190*** (0.012) (0.001) (0.000) (0.001) (0.007) (0.005) (0.003)
LnAget 1.345*** -1.979 -3.540*** 0.399 1.318 1.177 1.120 (0.006) (0.136) (0.009) (0.697) (0.117) (0.129) (0.117)
Leveraget 0.124 -0.250 0.054 -0.028 -0.368** -0.143 -0.200*

53
(0.466) (0.128) (0.791) (0.856) (0.014) (0.250) (0.096)
ROAt 0.253 -0.197 -0.421*** 0.128 -0.164 0.040 0.006 (0.515) (0.197) (0.008) (0.568) (0.423) (0.823) (0.974)
Casht 0.529* -0.209 -0.160 -0.159 0.362 0.378** 0.466** (0.066) (0.325) (0.480) (0.438) (0.103) (0.042) (0.010)
HHIt -0.355 0.105 -0.183 -0.133 0.173 -0.039 -0.198 (0.406) (0.884) (0.833) (0.708) (0.666) (0.906) (0.546)
HHIt2 0.359 -0.046 0.116 0.299 -0.044 0.121 0.274
(0.325) (0.934) (0.859) (0.316) (0.896) (0.663) (0.315)
LNGDPt 1.636*** 0.636*** 0.790*** 1.286*** 0.646*** 0.941*** 0.921*** (0.000) (0.000) (0.000) (0.000) (0.000) (0.000) (0.000)
Comp_LongtermStock 0.053
(0.307) Comp_ShareholderReturn 0.041
(0.381)
BoardIndependence -0.001
(0.348)
CEODuality -0.171***
(0.000) Constant -23.61*** 0.54 4.21 -15.42*** -12.18*** -14.51*** -13.79***
(0.000) (0.904) (0.371) (0.000) (0.000) (0.000) (0.000)
Observations 4,411 13,766 15,098 7,566 17,855 17,855 16,636
R-squared 0.506 0.883 0.861 0.591 0.457 0.503 0.471
Year fixed effect YES YES YES YES YES YES YES
Industry fixed effect YES NO NO YES YES YES YES
Country fixed effect YES NO NO YES YES YES YES
Firm fixed effect NO YES YES NO NO NO NO
Note: This table presents results of the additional robustness tests on the effect of CSR contracting on firm innovation. The dependent variable in Panel A and B is PATENT and
CITATION, respectively. All of the variables are defined in Appendix B. p-values based on robust standard errors adjusted for clustering by firm are reported in parentheses. *,
**, and *** indicate statistical significance at the 10%, 5%, and 1% levels, respectively.

54
Table 6. CSR Contracting, Firm Innovation and Stakeholder Orientation (1) (2) (3) (4)
Stakeholder Orientation
HIGH LOW HIGH LOW
Dep. Var. PATENTt+1 PATENTt+1 CITATIONt+1 CITATIONt+1
CSRContractingt 0.028 0.142** 0.045 0.112** (0.493) (0.025) (0.150) (0.012)
CSRPerft 0.003*** 0.004*** 0.002** 0.003*** (0.002) (0.000) (0.030) (0.000)
Comp_LongtermFint 0.015 0.131 -0.009 0.108** (0.813) (0.124) (0.872) (0.028)
R&Dt 9.257*** 9.943*** 7.172*** 12.068*** (0.000) (0.000) (0.000) (0.000)
ExternalFinancet -0.317** -0.008 -0.221* -0.133 (0.012) (0.962) (0.061) (0.474)
Sizet 0.166*** 0.157*** 0.104*** 0.189*** (0.000) (0.000) (0.000) (0.000)
MTBt 0.009 0.001 0.003 0.003 (0.210) (0.834) (0.633) (0.556)
InsiderOwnershipt -0.182 -0.288** -0.148 -0.209*** (0.102) (0.020) (0.109) (0.006)
CapitalIntensityt 0.048*** 0.006 0.029** 0.011 (0.001) (0.807) (0.022) (0.338)
SalesGrowtht 0.068 0.000 -0.002 -0.086 (0.238) (0.999) (0.967) (0.232)
ForeignSalest 0.051 0.455*** 0.023 0.269*** (0.438) (0.000) (0.685) (0.000)
Aget 0.573 1.426 0.824 0.794 (0.507) (0.253) (0.243) (0.238)
Leveraget -0.389*** 0.098 -0.324*** 0.122 (0.010) (0.499) (0.009) (0.142)
ROAt 0.105 0.284 0.170 0.050 (0.561) (0.260) (0.302) (0.806)
Casht 0.663*** 0.313 0.372* 0.491*** (0.003) (0.145) (0.055) (0.000)
HHIt -0.530 0.585 -0.578* 0.825*** (0.168) (0.155) (0.075) (0.000)
HHIt2 0.512 -0.451 0.509* -0.649***
(0.124) (0.231) (0.066) (0.000)
LNGDPt 0.006 0.990*** -0.242 1.493***
(0.965) (0.000) (0.146) (0.000)
Constant -3.094 -15.033*** -0.431 -17.206***
(0.328) (0.000) (0.881) (0.000)
Observations 9,009 8,247 9,009 8,247
R-squared 0.378 0.667 0.312 0.584
Year fixed effect YES YES YES YES
Industry fixed effect YES YES YES YES
Country fixed effect YES YES YES YES
Note: This table reports the regression results estimating the possible moderating role of stakeholder orientation
in the effect of CSR contracting on firm innovation. Stakeholder Orientation is principal factor of the following
four proxies: (1) STAKELAW, which measures the stringency of a country’s legal environment in protecting
labor rights and benefits; (2) CSRLAW, which measures the degree of a country’s mandatory requirements for
CSR disclosure; (3) PUBWARE, which assesses a country’s public awareness of CSR issues; and (4)
PUBAWARE1, the attitudes of corporate executives to CSR engagement at the country level. The threshold for
the sample split is the median of Stakeholder Orientation. All variables are defined in Appendix B. p-values based
on robust standard errors adjusted for clustering by firm are reported in parentheses. *, **, and *** indicate
statistical significance at the 10%, 5%, and 1% levels, respectively.

55
Table 7. CSR Contracting, Firm Innovation, and Investor Protection (1) (2) (3) (4)
Rule of Law
HIGH LOW HIGH LOW
Dep. Var. PATENTt+1 PATENTt+1 CITATIONt+1 CITATIONt+1
CSRContractingt 0.072 0.137*** 0.041 0.210*** (0.114) (0.005) (0.220) (0.000)
CSRPerft 0.002* 0.005*** 0.001 0.003*** (0.051) (0.000) (0.222) (0.001)
Comp_LongtermFint -0.007 0.128 -0.022 0.058 (0.918) (0.116) (0.660) (0.477)
R&Dt 5.450*** 9.821*** 5.603*** 11.585*** (0.000) (0.000) (0.000) (0.000)
ExternalFinancet 0.011 -0.090 -0.012 -0.258 (0.933) (0.540) (0.910) (0.161)
Sizet 0.100*** 0.128*** 0.083*** 0.163*** (0.000) (0.000) (0.001) (0.000)
MTBt 0.005 0.001 0.007 0.004 (0.496) (0.908) (0.290) (0.575)
InsiderOwnershipt -0.181 -0.086 -0.130 0.075 (0.137) (0.464) (0.239) (0.560)
CapitalIntensityt 0.011 0.033 -0.006 0.036* (0.492) (0.102) (0.706) (0.079)
SalesGrowtht 0.078 0.030 0.012 -0.018 (0.157) (0.632) (0.831) (0.826)
ForeignSalest 0.223*** 0.235*** 0.059 0.146 (0.003) (0.003) (0.348) (0.109)
Aget -1.072*** 1.639 -1.783*** 1.320 (0.000) (0.144) (0.000) (0.290)
Leveraget -0.393** 0.130 -0.355** 0.097 (0.026) (0.353) (0.019) (0.529)
ROAt 0.195 0.063 0.269 -0.073 (0.277) (0.766) (0.124) (0.782)
Casht 0.202 0.472** 0.039 0.374 (0.333) (0.021) (0.825) (0.116)
HHIt -0.870** 0.443 -0.706** 0.584 (0.036) (0.258) (0.048) (0.162)
HHIt2 0.705** -0.282 0.536* -0.394
(0.049) (0.426) (0.074) (0.282)
LNGDPt 0.236* 0.725*** 0.416*** 0.837*** (0.054) (0.000) (0.006) (0.000)
Constant 0.380 -14.266*** 1.257 -14.739*** (0.751) (0.000) (0.373) (0.001)
Observations 5,315 9,778 5,315 9,778
R-squared 0.316 0.660 0.266 0.559
Year fixed effect YES YES YES YES
Industry fixed effect YES YES YES YES
Country fixed effect YES YES YES YES
Note: This table reports the regression results estimating the possible moderating role of law enforcement ability
in the effect of CSR contracting on firm innovation. Rule of Law is a proxy for the overall enforcement ability of
a country’s legal and regulatory systems (i.e., the stringency of country-level legal and regulatory environment),
which measures the extent to which agents have confidence in and abide by the rules of society and, in particular,
the quality of contract enforcement, property rights, the police, and the courts. The threshold for the sample split
is the median of Rule of Law. All variables are defined in Appendix B. p-values based on robust standard errors
adjusted for clustering by firm are reported in parentheses. *, **, and *** indicate statistical significance at the
10%, 5%, and 1% levels, respectively.

56
Table 8. CSR Contracting, CSR Performance and Innovation Panel A. Dependent variable: PATENTt+1
(1) (2) (3) (4) (5) (6)
Dep. Var. PATENTt+1 PATENTt+1 PATENTt+1 PATENTt+1 PATENTt+1 PATENTt+1
CSRPerf = Overall EMP EMP_EQ EMP_HS EMP_TD EMP_DO
CSRContractingt 0.364*** 0.569*** 0.636*** 0.664*** 0.364*** 0.495*** (0.000) (0.010) (0.006) (0.000) (0.002) (0.003)
CSRPerft 0.006*** 0.027*** 0.016*** 0.018*** 0.011*** 0.019*** (0.000) (0.000) (0.000) (0.000) (0.000) (0.000)
CSRContractingt × CSRPerft -0.004*** -0.009** -0.010** -0.010*** -0.005** -0.007** (0.002) (0.024) (0.029) (0.002) (0.024) (0.023)
Comp_LongtermFint 0.098* 0.113* 0.104* 0.119** 0.109* 0.122** (0.099) (0.060) (0.085) (0.047) (0.071) (0.042)
R&Dt 12.369*** 12.087*** 12.554*** 12.394*** 12.406*** 12.151*** (0.000) (0.000) (0.000) (0.000) (0.000) (0.000)
ExternalFinancet -0.159 -0.099 -0.191* -0.158 -0.150 -0.136 (0.163) (0.386) (0.096) (0.167) (0.192) (0.234)
LnSizet 0.216*** 0.168*** 0.233*** 0.204*** 0.210*** 0.190*** (0.000) (0.000) (0.000) (0.000) (0.000) (0.000)
MTBt 0.006 0.004 0.006 0.006 0.006 0.003 (0.308) (0.468) (0.299) (0.261) (0.311) (0.525)
InsiderOwnershipt -0.233** -0.203** -0.246*** -0.205** -0.237** -0.237** (0.013) (0.029) (0.009) (0.028) (0.012) (0.011)
CapitalIntensityt 0.016 0.024 0.012 0.012 0.023 0.023 (0.326) (0.141) (0.470) (0.469) (0.159) (0.164)
SalesGrowtht 0.008 0.033 -0.006 0.009 0.012 0.014 (0.880) (0.525) (0.910) (0.856) (0.810) (0.789)
ForeignSalest 0.274*** 0.250*** 0.316*** 0.230*** 0.279*** 0.295*** (0.000) (0.000) (0.000) (0.000) (0.000) (0.000)
LnAget 1.076 1.147 0.995 1.157 1.241 0.922 (0.229) (0.197) (0.257) (0.182) (0.155) (0.286)
Leveraget -0.073 -0.074 -0.044 -0.080 -0.053 -0.065 (0.556) (0.546) (0.723) (0.518) (0.672) (0.596)
ROAt 0.151 0.089 0.162 0.185 0.121 0.165 (0.355) (0.581) (0.324) (0.257) (0.458) (0.309)
Casht 0.329* 0.329* 0.264 0.326* 0.318* 0.308* (0.065) (0.064) (0.137) (0.066) (0.073) (0.082)
HHIt 0.046 0.028 0.066 0.020 0.067 0.032 (0.894) (0.934) (0.849) (0.954) (0.847) (0.925)
HHIt2 0.059 0.049 0.025 0.065 0.016 0.060
(0.843) (0.867) (0.933) (0.825) (0.956) (0.838)
LNGDPt 1.284*** 1.368*** 1.368*** 1.329*** 1.332*** 1.340*** (0.000) (0.000) (0.000) (0.000) (0.000) (0.000)
Constant -18.83*** -20.63*** -20.05*** -20.15*** -20.07*** -19.35*** (0.000) (0.000) (0.000) (0.000) (0.000) (0.000)
Observations 17,855 17,855 17,855 17,855 17,855 17,855
R-squared 0.637 0.642 0.634 0.640 0.636 0.640
Year fixed effect YES YES YES YES YES YES
Industry fixed effect YES YES YES YES YES YES
Country fixed effect YES YES YES YES YES YES

57
Panel B. Dependent variable: CITATIONt+1
(1) (2) (3) (4) (5) (6)
Dep. Var. CITATAION
t+1
CITATAION
t+1
CITATAION
t+1
CITATAION
t+1
CITATAION
t+1
CITATAION
t+1
CSRPerf = CSRPerf EMPPerf EMP_EQ EMP_HS EMP_TD EMP_DO
CSRContractingt 0.533*** 0.696*** 0.741*** 0.455** 0.394*** 0.752*** (0.000) (0.001) (0.001) (0.010) (0.000) (0.000)
CSRPerft 0.005*** 0.018*** 0.012*** 0.012*** 0.007*** 0.013*** (0.000) (0.000) (0.000) (0.000) (0.000) (0.000)
CSRContractingt × CSRPerft -0.007*** -0.011*** -0.011*** -0.006* -0.005** -0.012*** (0.000) (0.003) (0.007) (0.054) (0.013) (0.000)
Comp_LongtermFint 0.031 0.040 0.034 0.046 0.038 0.048 (0.582) (0.483) (0.555) (0.423) (0.508) (0.399)
R&Dt 12.289*** 12.131*** 12.428*** 12.337*** 12.352*** 12.175*** (0.000) (0.000) (0.000) (0.000) (0.000) (0.000)
ExternalFinancet -0.247* -0.212* -0.270** -0.253** -0.248* -0.236* (0.052) (0.097) (0.035) (0.047) (0.053) (0.064)
LnSizet 0.183*** 0.151*** 0.191*** 0.173*** 0.179*** 0.167*** (0.000) (0.000) (0.000) (0.000) (0.000) (0.000)
MTBt 0.001 0.000 0.001 0.001 0.001 -0.000 (0.790) (0.967) (0.823) (0.795) (0.824) (0.993)
InsiderOwnershipt -0.104 -0.084 -0.111 -0.087 -0.107 -0.108 (0.249) (0.345) (0.218) (0.333) (0.233) (0.224)
CaptialIntensityt 0.020 0.025 0.017 0.017 0.024 0.024 (0.201) (0.111) (0.270) (0.275) (0.127) (0.126)
SalesGrowtht -0.111* -0.095* -0.119** -0.110* -0.109* -0.109* (0.054) (0.100) (0.040) (0.056) (0.060) (0.057)
ForeignSalest 0.187*** 0.170*** 0.214*** 0.157** 0.191*** 0.195*** (0.004) (0.009) (0.001) (0.017) (0.004) (0.003)
LnAget 1.269* 1.294* 1.180 1.277* 1.338* 1.163 (0.087) (0.086) (0.115) (0.091) (0.074) (0.114)
Leveraget -0.150 -0.150 -0.128 -0.150 -0.134 -0.147 (0.224) (0.222) (0.300) (0.224) (0.278) (0.231)
ROAt 0.037 -0.004 0.041 0.062 0.020 0.050 (0.837) (0.984) (0.820) (0.731) (0.911) (0.778)
Casht 0.398** 0.389** 0.344* 0.382** 0.379** 0.378** (0.032) (0.037) (0.066) (0.041) (0.042) (0.042)
HHIt -0.031 -0.052 -0.027 -0.056 -0.026 -0.054 (0.926) (0.874) (0.936) (0.866) (0.938) (0.871)
HHIt2 0.113 0.116 0.099 0.124 0.093 0.128
(0.683) (0.673) (0.720) (0.651) (0.737) (0.640)
LNGDPt 0.924*** 0.985*** 0.991*** 0.964*** 0.961*** 0.971*** (0.000) (0.000) (0.000) (0.000) (0.000) (0.000)
Constant -14.70*** -15.86*** -15.54*** -15.48*** -15.41*** -15.15*** (0.000) (0.000) (0.000) (0.000) (0.000) (0.000)
Observations 17,855 17,855 17,855 17,855 17,855 17,855
R-squared 0.505 0.506 0.503 0.505 0.503 0.506
Year fixed effect YES YES YES YES YES YES
Industry fixed effect YES YES YES YES YES YES
Country fixed effect YES YES YES YES YES YES
Note: This table presents the regression results examining the substitution/complementary role of CSR contracting and
CSR performance in their effects on firm innovation. The dependent variable in Panel A and B is PATENT and CITATION,
respectively. EMPPerf is the overall performance of a firm in relation to its employees. It can be further divided into four
sub-categories, which are: (1) employment quality (EMP_EQ); (2) workforce health and safety (EMP_HS); (3) training
and development (EMP_TD); and (4) diversity and opportunity (EMP_DO). All of the variables are defined in Appendix
B. p-values based on robust standard errors adjusted for clustering by firm are reported in parentheses. *, **, and ***
indicate statistical significance at the 10%, 5%, and 1% levels, respectively.
Related Documents