kpmg.com.au Corporate reporting - evolution and integration A review of corporate reporting trends in the year to 30 June 2016 across the ASX 200 and beyond

Welcome message from author
This document is posted to help you gain knowledge. Please leave a comment to let me know what you think about it! Share it to your friends and learn new things together.
Transcript
kpmg.com.au
Corporate reporting - evolution and integrationA review of corporate reporting trends in the year to 30 June 2016 across the ASX 200 and beyond

Larry Fink, BlackRock CEO has asked every company they invest in to lay out a strategic framework for long-term value creation (December 2015)
About this Report
Introduction to Annual Review (September 2015) " This integrated report demonstrates how NAB is working to create value for stakeholders through our business strategy, operating environment, governance, financial and non-financial activities."
Welcome to KPMG’s third survey of ASX 200 Corporate Reporting.
Driven by a combination of legislation, regulation, investor-led corporate governance enhancements, and voluntary actions, corporate reporting reform continues to gain global momentum.
Local statusThis survey demonstrates further improvements in Australian corporate reporting in 2016, but at a slower pace than many other countries.
Amongst ASX 200 companies, 60 percent have ‘cut the clutter’ in their financial reports. Many of those companies are also seeking opportunities to remove volume and improve clarity in the rest of their annual report and other corporate reports.
Companies such as National Australia Bank and Lendlease and other organisations, such as VicSuper, Cbus, and Australia Post, have moved further along the ‘Reporting Continuum’. These organisations are now reporting on how they create longer term value. The Lendlease case study (page 22) is a great example of the challenges and benefits of moving toward integrated reporting.
Global driversGlobally, including in the US, organisations are moving along the Reporting Continuum more quickly. Companies such as Unilever, SAP and Coca-Cola continue to release integrated reports. This year, GE issued its first Integrated Summary Report to better and more succinctly explain through the lens of management how GE creates sustainable value.
These developments are being supported by major investors, such as BlackRock and CalPers, who are strongly encouraging companies to report on how they create long term value. Academic research, as well as corporate feedback, is demonstrating the internal and market benefits of integrated reporting. Leading academic Mary Barth from Stanford University recently found that good integrated reporting is positively associated with both stock liquidity and firm value.
In the UK, companies are required to prepare a Strategic Report as part of their Annual Report. The European Commission has introduced a non-financial reporting directive and in Japan, Brazil and South Africa integrated reporting is being driven by principles of good corporate governance. In New Zealand, the External Reporting Board (XRB) has adopted extended external reporting as a strategic priority for FY16 /17.
I hope the results of this survey provide you with ideas and inspiration to consider on your journey to maximising the value of your corporate reporting.
Duncan McLennanNational Managing Partner – Audit & Advisory KPMG Australia
Key message
© 2016 KPMG, an Australian partnership and a member firm of the KPMG network of independent member firms affiliated with KPMG International Cooperative (“KPMG International”), a Swiss entity. All rights reserved. The KPMG name and logo are registered trademarks or trademarks of KPMG International. Liability limited by a scheme approved under Professional Standards Legislation.
2 Key findings
4 Stage 1 – Cutting the clutter
Financial reports – easy to read and understand?
Remuneration report – does pay equal performance?
Corporate governance – does it matter?
12 Stage 2 – More insightful reporting
Operating and financial review – more insightful reporting
Corporate reporting portfolio
18 Stage 3 – Integrated reporting <IR>
24 How KPMG can help
25 Appendix 1 – Review methodology
Contents
© 2016 KPMG, an Australian partnership and a member firm of the KPMG network of independent member firms affiliated with KPMG International Cooperative (“KPMG International”), a Swiss entity. All rights reserved. The KPMG name and logo are registered trademarks or trademarks of KPMG International. Liability limited by a scheme approved under Professional Standards Legislation.
2 Corporate reporting – evolution and integration
Key findings
This report follows on from KPMG’s 2015 survey A new era in Corporate Reporting – Review of recent corporate and de-cluttering trends in the ASX200. The approach adopted this year is consistent with last year’s approach, except that this year more focus has been given to assessing each organisation’s progress along what we call the Reporting Continuum.
We have identified three major stages in the Reporting Continuum, although organisations may only take on one or two areas of improvement within each stage in any particular year.
The three stages are:
Stage 1 – Cutting the clutter in the annual report.
Stage 2 – More insightful reporting, moving beyond cutting the clutter to focus on value creation in the short, medium and long term.
Stage 3 – Integrated Reporting, with reference to the International Integrated Reporting Council (IIRC)'s International Integrated Reporting <IR> Framework (<IR> Framework).
It is encouraging to see that the majority of listed organisations have ‘cut the clutter’ in their financial reports to remove immaterial information, restructure and improve presentation.
These reports are now clearer and more readable.
Some organisations have taken the concept further and de-cluttered their Remuneration Report.
Most also now present their Corporate Governance Statement on their website. Making this change has however left many companies with a gap in their primary report to their shareholders, the annual report. We believe there is still a need to demonstrate how the Board performed in overseeing management’s delivery on strategy and management of risk.
We have also looked at the reports of a number of large scale Australian organisations who strive to emulate the better practice reporting of leading listed organisations. These non-listed organisations have also made advancements through this year.
Stage 1
Stage 2
Stage 3
Cutting the clutter in the annual report
More insightful reporting, moving beyond cutting the clutter to focus on value creation in the short, medium and long term.
Integrated Reporting, with reference to the IIRC's International Integrated Reporting <IR> Framework.
© 2016 KPMG, an Australian partnership and a member firm of the KPMG network of independent member firms affiliated with KPMG International Cooperative (“KPMG International”), a Swiss entity. All rights reserved. The KPMG name and logo are registered trademarks or trademarks of KPMG International. Liability limited by a scheme approved under Professional Standards Legislation.

3Corporate reporting – evolution and integration
Organisations that have moved beyond 'cutting the clutter' are now directing their attention to demonstrating value creation.
Organisations in this stage (Stage 2) of the Reporting Continuum include: mining houses, banks, property companies, Telstra, nbn and Australia Post. In their annual reports, these organisations present their business models, strategies, risks and performance clearly. In the Operating and Financial Review (OFR), their message has shifted to a focus on longer term value creation. They have gone beyond ASIC’s Regulatory Guide 247: Effective disclosures in an operating and financial review (RG247).
Many have also retained an overview of their governance practices, and a few describe what we call ‘Active Governance’. Active Governance involves outlining the Board’s key areas of focus during the year and actions taken.
In a number of instances, we also see a clear linkage described between strategy, performance and executive incentives in Remuneration Reports.
Many of the organisations progressing through the second stage of the Reporting Continuum are not far away from preparing an integrated report.
Only a small number of organisations have entered Stage 3 of the Reporting Continuum. Even those which have entered Stage 3 agree there is work to be done.
In this publication we use Lendlease’s recent integrated reporting experience as a case study. Lendlease is now in Stage 3. The company produced its first annual report with reference to the <IR> Framework in 2016 through its OFR. By doing so, they were able to remove two reports from the reporting portfolio, present a much clearer value story to their key stakeholders, and eliminate six weeks of report preparation effort.
Areas for improvement remain, but the Lendlease story should inspire others to follow suit next year.
The following pages provide a summary of the findings from our review with a few examples highlighting good practices across each of the above three stages.
An illustration of the ASX200 advancing along the Reporting Continuum
Stage 1 Stage 2 Stage 3 Cutting the clutter in the annual report
More insightful reporting
Integrated Reporting <IR>
© 2016 KPMG, an Australian partnership and a member firm of the KPMG network of independent member firms affiliated with KPMG International Cooperative (“KPMG International”), a Swiss entity. All rights reserved. The KPMG name and logo are registered trademarks or trademarks of KPMG International. Liability limited by a scheme approved under Professional Standards Legislation.

4 Corporate reporting – evolution and integration
Financial reports – easy to read and understand?
The 'three R's' when de-clutteringThere are three R’s to consider when cutting the clutter in financial reports:
• Remove immaterial or irrelevant financial report disclosures that have built up over time
• Re-order and re-label accounting policies and detailed notes so that they better reflect the key financial measures and focus on areas of most relevance
• Re-write technical wording into plain English, whilst still fully complying with relevant accounting standards and regulatory requirements.
Over the past two years, we have seen a significant take up of organisations re-designing their financial reports and applying the 'three R's'. As of the June 2016 reporting season, we noted over 60 percent of the ASX 200 have de-cluttered their financial reports.
The process to de-clutter a financial report is not a complex one, and feedback from executives and directors continues to demonstrate that this is a worthwhile investment. The result is reports that are generally shorter, easier to read, navigate and understand.
Preparers are also commenting that de-cluttered reports are saving time during the busy year end process, as the removal of immaterial information has resulted in less information needing to be prepared and generally shorter reports for senior management and directors to review.
De-cluttering financial reports is not only beneficial for ASX listed organisations. All organisations with internal and external stakeholders who prepare publicly-available financial reports can benefit from the process, including not for profit organisations and government business entities who are looking to better explain financial performance to potential donors, supporters, government stakeholders and the general public.
Cutting the clutter
117 (2015: 68) organisations, or more than 60 percent, have 'cut the clutter' in the Annual Financial Report.
Number of notes
The average Annual Financial Report now has 31 notes and 56 pages, consistent with 2015 and a decease from 35 and 61 respectively in 2014.
Grouping notes
105 (2015: 54) organisations have grouped notes to the financial statements into more logical categories.
Accounting policies
107 (2015: 55) organisations have included accounting policies within the associated notes.
Use of graphs and tables
14 (2015:3) organisations have included graphs or images within the notes to their financial statements.
Call out boxes
61 (2015: 20) organisations have used call out boxes and/or section introductions to highlight useful information to stakeholders.
© 2016 KPMG, an Australian partnership and a member firm of the KPMG network of independent member firms affiliated with KPMG International Cooperative (“KPMG International”), a Swiss entity. All rights reserved. The KPMG name and logo are registered trademarks or trademarks of KPMG International. Liability limited by a scheme approved under Professional Standards Legislation.

5Corporate reporting – evolution and integration
FINANCIAL REPORT – NOTES TO THE FINANCIAL STATEMENTS
Pact Group Holdings Ltd 24
Section 1 – Our Performance A key element of Pact’s strategy is to maximise long-term shareholder value. This section highlights the results and performance of the Group for the year ended 30 June 2016. 1.1 GROUP RESULTS
Sales revenue
Pact’s chief operating decision maker is the Managing Director and Chief Executive Officer (CEO). The CEO monitors results by reviewing two reportable segments, Pact Australia (PA) and Pact International (PI), focusing on reported EBIT (earnings before finance costs and loss on de-recognition of financial assets, net of interest income, tax and significant items). As required by AASB 8 Operating Segments, the results above have been reported on a consistent basis to that supplied to the CEO. Reportable segments Countries of Operation Products/services Pact Australia
Pact International
Australia
New Zealand China Indonesia Philippines Singapore United States of America
Manufacture and supply of rigid plastic and metal packaging and associated services
Contract manufacturing and packing services
Manufacture and supply of materials handling products and the provision of associated services
Recycling and sustainability services
How Pact accounts for Revenue Revenue from the sale of goods is recognised when there has been a transfer of risks and rewards to the customer (through the execution of a sales agreement at the time of delivery of the goods to the customer), no further work or processing is required, the quantity and quality of the goods has been determined, the price is determined and generally title has passed. Revenue from the sale of goods is measured at the fair value of the consideration received or receivable to the extent that it is probable that the economic benefits will flow to the Group and the revenue can be reliably measured.
$’000 2016 2015 Pact Australia 1,027,939 889,911 Pact International 353,399 359,242 TOTAL 1,381,338 1,249,153
Section introduction refers to Pact’s strategy, providing connectivity throughout the broader annual report.
Use of a table helps readers differentiate between segments and also removes repetition.
Accounting policy included as part of the analysis and interpretation note.
Using company specific information rather than boilerplate disclosures.
Pact Group Holdings Pact Group has used a number of de-cluttering techniques to help readers better understand the information within its annual report. This has resulted in a 16 page (33 percent) year-on-year reduction to the length of the report.
Below highlights some examples of how Pact Group did this:
Source: Pact Group Holdings Limited, Preliminary Final Report & Full Year Statutory Accounts 2016, page 24.
Stage 1 Cutting the clutter
© 2016 KPMG, an Australian partnership and a member firm of the KPMG network of independent member firms affiliated with KPMG International Cooperative (“KPMG International”), a Swiss entity. All rights reserved. The KPMG name and logo are registered trademarks or trademarks of KPMG International. Liability limited by a scheme approved under Professional Standards Legislation.

6 Corporate reporting – evolution and integration
SYDNEY AIRPORT 2015106
DIRECTORS’ REPORT
AUDITOR’S SIGNED REPORTS
FINANCIAL STATEMENTS
DIRECTORS’ STATEMENTS
NOTES TO THE FINANCIAL STATEMENTS
The maturity profile of interest bearing liabilities is presented in the chart below.
$0m
$300m
$600m
$900m
$1,200m
$1,500m
203020292028202720262025202420232022202120202019201820172016
Drawn Bank Undrawn Bank Domestic Bonds Foreign Bonds
86
545
720
519
750802
1,033
659
438
136
379
200
15
386419
59
100
217
643
217
Assets pledged as securityAll interest bearing liabilities of SCACH, a wholly owned subsidiary, are of equal rank with respect to all its assets (excluding deferred tax and goodwill) pledged as security. The security consists of fixed and floating charges over the assets of the Group and a mortgage over the Airport lease.
Recognition and measurementThe Group recognises interest bearing liabilities on the date that they become a party to the contractual provisions of the instrument. These are initially recognised at fair value less any attributable transaction costs and subsequently measured at amortised cost using the effective interest rate method, with interest expense recognised on an effective yield basis.
At 31 December 2015 and 2014, the fair values of all fixed interest rate bonds were determined based on observable market inputs, categorised as Level 2.
The Group derecognises an interest bearing liability when its contractual obligations are discharged, cancelled or expired.
CIBs explainedCapital indexed bonds are inflation linked bonds. The principal amount of the bond is indexed against the Consumer Price Index with the revised capital amount due for repayment at maturity.
Effective interest rate method explainedA method of calculating the amortised cost of a financial liability, allocating interest expense over the relevant period. The effective interest rate is the rate that exactly discounts estimated future cash payments through the expected life of the financial liability.
2 INTEREST BEARING LIABILITIES (CONT.)
Sydney Airport Limited Sydney Airport have de-cluttered the financial report, resulting in a 13 page (30 percent) year-on-year reduction to the length of the report.
Below highlights some examples of how Sydney Airport did this:
Source: Sydney Airport, Annual Report 2015, page 106.
Used a graph to visually represent the maturity profile of interest bearing liabilities.
Accounting policy included as part of the analysis and interpretation note.
Simple language used to explain complex accounting terminology.
© 2016 KPMG, an Australian partnership and a member firm of the KPMG network of independent member firms affiliated with KPMG International Cooperative (“KPMG International”), a Swiss entity. All rights reserved. The KPMG name and logo are registered trademarks or trademarks of KPMG International. Liability limited by a scheme approved under Professional Standards Legislation.

7Corporate reporting – evolution and integration
Remuneration report – does pay equal performance?
Executive remuneration policies and practices have become a focus area for many organisations continuing on their de-cluttering journey.
Although the average length of the Remuneration Report has only decreased by one page, our review showed that some organisations have improved the clarity and readability of their remuneration reports by focusing on:
• describing how key management personnel are remunerated in the short, medium and long term, including highlighting amounts ‘at risk’
• specifically discussing how remuneration is linked to the company performance and value created during the year
• re-ordering the disclosures to show a more practical flow of information, such as including all non-executive director information in a single section at the back of the report.
This has allowed organisations to reduce the size of their remuneration report because duplicate disclosures and excess information have been removed.
This reporting season has seen questions raised over the variety of financial metrics and the inclusion of non-financial metrics in determining executive performance and reward. We suggest that the focus of the debate, and the questions asked, need to change.
It is entirely appropriate that the metrics which clearly and demonstrably measure execution of a particular organisation's strategy form a key part of the basis on which executives are rewarded. Reporting on these measures and their strategic alignment is critical, as this is a key element of the investment equation. An investor should ask, ̀ do I understand the strategy and the drivers of its past and future execution?' If that involves operational effectiveness, customer service experience or achievement of diversity targets, then so be it – if that is core to the organisation's stated strategy.
We are not commenting on the levels at which such measures represent over or under-performance, nor on the weighting given to each one in incentive arrangements. However, if they are central to strategy and aligned to creating long term value, then they should be taken into account when assessing performance and remuneration.
This is an area where further dialogue is required to ensure company investors (and proxy advisers) are brought on the corporate reporting journey and involved in scoping what is material for reporting. It would be better if the questions from the market focused on the quality and integrity of the measures reported, and the extent to which they are aligned to strategy, performance and reward.
The average length of an ASX 200 Remuneration Report is now 17 pages compared to 18 in 2015.
2016 201517 18
Stage 1 Cutting the clutter
© 2016 KPMG, an Australian partnership and a member firm of the KPMG network of independent member firms affiliated with KPMG International Cooperative (“KPMG International”), a Swiss entity. All rights reserved. The KPMG name and logo are registered trademarks or trademarks of KPMG International. Liability limited by a scheme approved under Professional Standards Legislation.

8 Corporate reporting – evolution and integration
“ Following on from the work we had undertaken in de-cluttering our financial statements, it was logical to determine if our remuneration report was providing informative, relevant and concise communication. We restructured the report; summarising key remuneration tables and bringing them forward to provide an instant overview of our executive remuneration. We also eliminated significant duplication and jargon, where possible, to make the report clearer and more concise. Overall, this reduced the size of our report by approximately 21 percent, resulting in a more informative and easy to read remuneration report which focuses on what actually matters.”
David Coulter, Chief Financial Officer, IOOF Holdings
IOOF Holdings IOOF has included an Executive Summary and extended the Overview to clearly state the purpose of the Remuneration Report and set the scene for the remuneration outcomes to follow.
36
IOOF annual report 2016
Remuneration report (cont’d)
Executive SummaryThis report details the remuneration framework and outcomes for Key Management Personnel (KMP) of the IOOF Group for the year ended 30 June 2016. The Board of Directors is committed to a remuneration strategy that aligns remuneration practices with the creation of shareholder value. A number of amendments have been made to the policies over the past few years to ensure that the policies have remained aligned with shifts in the IOOF Group’s business strategy and focus. The key principles of the IOOF Group’s remuneration policy remain unchanged from last year.
This report aims to communicate our remuneration practices, and their link to the creation of shareholder value, in a clear, concise and transparent way and demonstrate how these practices:
• align to our strategic objectives;
• are sufficient to attract, motivate and retain an ambitious and highly talented executive team; and
• support an appropriate governance culture to minimise risks to our shareholders.
2016 saw record profits from continuing operations and sustained returns to shareholders over the last three years. These strong results have been reflected in the short and long term incentive outcomes received by the KMP.
The IOOF Group’s Total Shareholder Return (TSR) performance over the three years to 30 June 2016 was 29.3% placing it at the 52nd percentile relative to the ASX 200. Return on Equity (RoE) for the year to 30 June 2016 was 12.3%. The impact of these outcomes on Managing Director and other KMP LTIs is detailed at sections 3.1, 3.2.2 and 4.1.2 below.
There were no increases to fees paid to Non-Executive Directors except for CPI adjustments.
37
IOOF annual report 2016
1. Overview1.1 Key Management PersonnelThis report covers the IOOF Group’s KMP. KMP are the people who have the authority and responsibility for planning, directing and controlling the activities of the IOOF Group:
Name Position Term as KMP
Managing Director
Mr C Kelaher Managing Director Full year
Other Executive KMP
Mr D Coulter Chief Financial Officer Full year
Mr S Merlicek Chief Investment Officer Full year
Mr R Mota Group General Manager – Wealth Management Full year
Mr G Riordan Group General Counsel & General Manager Trustee Services Full year
Executive KMP – Former
Mr M Farrell Group General Manager – Dealerships Ceased employment 22 January 2016
The Non-Executive Directors of the IOOF Group are also required to be disclosed as part of this report and are listed below:
Non-Executive Directors
Dr R Sexton AM Independent Non-Executive Director & Chairman Full year
Ms J Harvey Independent Non-Executive Director Full year
Mr A Griffiths Independent Non-Executive Director Full year
Mr G Venardos Independent Non-Executive Director Full year
Ms E Flynn Independent Non-Executive Director Appointed 15 September 2015
Mr I Griffiths Independent Non-Executive Director Resigned 2 October 2015
1.2 Summary – Key Management Personnel remunerationThe IOOF Group uses a total remuneration package approach in determining remuneration that comprises both “fixed” and “at risk” components. These components reflect an employee’s contribution to the IOOF Group, their skills and qualifications, market benchmarks and the remuneration environment.
The remuneration arrangements for KMP comprise three key components:
• a base package which is a fixed amount and is reviewed on an annual basis with consideration given to cost of living increases (CPI), market movements or changes in the scope of the individual’s role and responsibilities;
• a Short Term Incentive (STI) amount which is tied to the successful achievement of a set of performance scorecard objectives (including financial, strategic, customer and people objectives) for the annual performance period. STI awards are considered “at risk“ components of an individual’s remuneration and can be awarded as either cash or share-based arrangements; and
• a Long Term Incentive (LTI) which is intended to provide incentives to KMP to remain with the IOOF Group to enhance the sustainable performance of the IOOF Group over the long term. LTI awards are considered “at risk“ components of an individual’s remuneration and are all share-based arrangements.
Source: IOOF Annual Report 2016, page 36 and 37.
Clearly sets out the aims of the report, including alignment to the strategic objectives.
Used a table to show the key management personnel covered in the Remuneration Report.
High level discussion on performance helps set the readers expectations for the short and long term incentive outcomes received.
© 2016 KPMG, an Australian partnership and a member firm of the KPMG network of independent member firms affiliated with KPMG International Cooperative (“KPMG International”), a Swiss entity. All rights reserved. The KPMG name and logo are registered trademarks or trademarks of KPMG International. Liability limited by a scheme approved under Professional Standards Legislation.

9Corporate reporting – evolution and integration
Stage 1 Cutting the clutter
nbn Annual Report 2015-16
Australia’s broadband network62
Remuneration report (continued)
The following diagram outlines the link between nbn’s Company strategy and remuneration for Senior Executives.
…and nbn’s actual performance
Ready for ServiceExceeded target performance and achieved 2,893,474 premises Ready for Service
Premises ActivatedExceeded target performance and activated 1,098,634 premises
Customer Experience MetricExceeded target score and achieved 7.2 overall
Telecommunica-tions RevenueExceeded target telecommunica-tions revenue and achieved $403 million
Scaling the BusinessOutstanding achievement against 12 key initiatives underpinning nbn’s ability to scale
…directly impacts Senior Executive remuneration
Total Fixed RemunerationFixed pay increases aligned to market practice with smaller increases for FY2016
CEO STI Outcome133% target
Average Senior Executive STI Outcome133% target
Achieved by focusing on nbn’s strategic imperatives
Build a high - performing and reliable network
Build effective and efficient processes and systems
Build a united partnership with vendors, Delivery Partners and Retail Service Providers
Build affordable products and services
Make nbn a great place to work
nbn’s Goal by 2020
8 million homes and businesses connected by 2020
…which are reflected in STI Corporate Measures
Ready for ServiceA Rollout Region is Ready for Service when nbn is ready to begin connecting premises in that Rollout Region to the nbnTM network
Premises ActivatedPremises which have an active service installed. Premises are activated after receiving and provisioning a service order from a Retail Service Provider
Customer Experience MetricMeasures customer satisfaction through surveys to Retail Service Providers
Telecommunica-tions RevenueMeasures revenue earned directly related to connecting customers and selling to Retail Service Providers
Scaling the BusinessMeasures nbn’s overall achievement against the FY2016 targets as well as an assessment of its preparedness for the even more significant ramp in scale required in FY2017
nbnnbn’s Remuneration Report starts by focusing on the link between the corporate strategy and the remuneration strategy. The following diagram goes further and shows the reader how the overall goal and strategic imperatives of nbn are reflected in the compensation metrics of senior executives and explains the impact on actual remuneration based on performance during the year.
Source: nbn limited, Annual Report 2015-2016, page 62.
© 2016 KPMG, an Australian partnership and a member firm of the KPMG network of independent member firms affiliated with KPMG International Cooperative (“KPMG International”), a Swiss entity. All rights reserved. The KPMG name and logo are registered trademarks or trademarks of KPMG International. Liability limited by a scheme approved under Professional Standards Legislation.

10 Corporate reporting – evolution and integration
Corporate governance – does it matter?
With the release of the ASX Corporate Governance Council’s Corporate Governance Principles and Recommendations (3rd edition), and the change to ASX Listing Rule 4.10.3 organisations were given the freedom to remove the Corporate Governance Statement from the annual report and replace it with the website URL where the statement is located.
This was a great step to help organisations free up much needed space in the annual report and remove year-on-year standing data, giving them more real estate to focus on the information needs of their shareholders.
The majority of organisations reviewed have now removed the Corporate Governance Statement from the annual report. However for many, the annual report no longer contains any information on how the organisation is governed or the areas of focus of the Board for the year and going forward.
When de-cluttering the Corporate Governance Statement, organisations should consider if the governance section within the annual report contains sufficient discussion on how the governance framework operated in the year and what, if anything, has changed.
Active governanceLeading reporters in this space have recognised the need to continue to inform their readers about governance and started to include an ‘Active Governance’ summary focusing on how the Board has supported value creation during the year, including:
• explaining how the Board actively oversees management’s delivery against strategy, within the risk appetite of the group
• key areas of concern, activities and actions taken by the board during the year
• how the governance structures have adapted to changes in business practices, including changes in the governance structure and frameworks.
organisations have removed the Corporate Governance Statement from the annual report.
organisations have replaced the Corporate Governance Statement with a Governance Summary.
organisations have nominal governance information in the annual report.
organisations have increased their focus on ‘Active governance’, the critical consideration.
113
30
83
12
© 2016 KPMG, an Australian partnership and a member firm of the KPMG network of independent member firms affiliated with KPMG International Cooperative (“KPMG International”), a Swiss entity. All rights reserved. The KPMG name and logo are registered trademarks or trademarks of KPMG International. Liability limited by a scheme approved under Professional Standards Legislation.

11Corporate reporting – evolution and integration
Treasury Wine Estates In 2016 Treasury Wine Estates (TWE) removed its nine page Corporate Governance Statement, which detailed its compliance with the ASX Corporate Governance Principles and Recommendations, from the annual report and replaced it with a three page corporate governance summary focusing on:
• key 2016 governance focus areas of the Board
• Board competency skills matrix
• role of the Board
• Board committees
• governance policies.
The summary is well balanced between providing the reader with an overview of the governance framework in place at TWE and presenting ‘active information’ on the governance activities of the board during the year.
Source: Treasury Wine Estate, Annual Report 2016, page 36 and 38.
Stage 1 Cutting the clutter
“ The Board believes good corporate governance and transparency in corporate reporting is a fundamental part of the group’s culture and business practices, as such we felt it was important to continue to demonstrate to our investors, through the annual report the role of the Board and Board committees during the year in overseeing the implementation of our strategy.”
Treasury Wine Estates
© 2016 KPMG, an Australian partnership and a member firm of the KPMG network of independent member firms affiliated with KPMG International Cooperative (“KPMG International”), a Swiss entity. All rights reserved. The KPMG name and logo are registered trademarks or trademarks of KPMG International. Liability limited by a scheme approved under Professional Standards Legislation.

12 Corporate reporting – evolution and integration
Operating and financial review – more insightful reporting
We are starting to see a shift in the focus of annual reports and other corporate reports. Rather than solely focusing on earnings, organisations are beginning to highlight how they create sustainable value and explain the ‘value’ they have created during the year for their shareholders
Many organisations wanting to tell a more insightful story have started to adopt integrated reporting principles in current reporting.This includes how they create long term value through their business models and details of the most important resources and relationships they rely upon.
Some organisations are incorporating this information into the existing Operating and Financial Review (OFR), with some of them now starting to go well beyond the requirements of a basic OFR as guided by RG247.
A number of good examples of improved disclosures in the areas of strategy and the alignment between strategic priorities and performance are now available.
© 2016 KPMG, an Australian partnership and a member firm of the KPMG network of independent member firms affiliated with KPMG International Cooperative (“KPMG International”), a Swiss entity. All rights reserved. The KPMG name and logo are registered trademarks or trademarks of KPMG International. Liability limited by a scheme approved under Professional Standards Legislation.

13Corporate reporting – evolution and integration
FY16 Goals i Maintain gearing within 35%-45% range.
i Extend average debt maturity.
i Diversify sources and tenor of debt.
i Additional capital markets issuance to be considered.
FY16 Achievements % Balance sheet gearing at 30 June 2016 was 42.6%.
× The weighted average debt maturity was 4.2 years at 30 June 2016; down from 4.7 years at 30 June 2015.
% Growthpoint entered into $250m of new debt capital market facilities for 7 years in December 2015, with proceeds used to repay domestic bank debt. In addition Growthpoint terminated three interest rate swaps with face values of $265 million (at cost of $10.5 million) and entered into four new interest rate swaps with a face value of $150 million and a weighted average maturity of 5 years.
FY17 Goals
As per FY16 plus:
• Ensure fixed debt is within the target range of 75% to 100% after current transactions are completed.
FY16 Goals i Inclusion in major indexes.
i Increase equity capital where appropriate.
i Engage with research analysts to increase and improve coverage.
i Increase liquidity of Growthpoint's securities.
FY16 Achievements % Remained in S&P/ASX200 (plus other indices).
% $40.1 million of new equity was raised via the distribution reinvestment plan with the proceeds being used to fund acquisitions and capital works.
× Research coverage reduced from seven to six analysts.
× Liquidity of Growthpoint's securities was flat from FY15 to FY16, with 121,359,340 securities traded in FY16 compared to 132,622,827 in FY15.
FY17 Goals
No change from FY16.
76
14
Increase liquidity and value of Growthpoint securities
Borrow prudently
Operate sustainably4 5 6
FY16 Goals i Refine sustainability objectives.
i Focus on long-term value rather than short-term profits.
i Improve gender diversity of directors and employees.
FY16 Achievements % Sustainability objectives have been refined (refer pages 7-9 of Sustainability Report for more details).
% The property portfolio, capital management strategy and established sustainability targets have been built with long-term value creation in mind.
× 35% of the Group's employees (six out of 17) are female, down from 40% as at 30 June 2015 (six out of 15).
FY17 Goals • Monitor compliance with sustainability
objectives and improve integration of sustainability practices within business operations.
• Continue to focus on long-term value rather than short-term profits.
• Seek additional female director (target date 2020).
7
Sustainable growth means ensuring Growthpoint's business assets, revenue and expenses are able to be continued. It includes enhancing people and limiting our impact on the environment.
255 London Circuit, Canberra, ACT
2016 Sustainability Report (available online only)
More details about sustainability can be found in Growthpoint's 2016 Sustainability Report.
investors.growthpoint.com.au/SustainabilityReport/2016
13
Business O
verviewO
perating Sustainably
Financial Report
Financial Managem
entP
ortfolio Review
Additional Inform
ation
Strategy
Used icons to show the reader where additional information can be found within the annual report.
Shows linkage with the FY17 goals.
Signposting to where more detail is available in the wider reporting portfolio – the online sustainability report.
Balanced view of performance, showing both favourable and unfavourable outcomes.
Growthpoint The theme of the Growthpoint annual report, which is described as an integrated report, is sustainable growth. “Sustainable growth means ensuring Growthpoint’s business assets, revenue and expenses are able to be continued. It includes enhancing people and limiting our impact on the environment.”
When reporting back on strategic objectives for the year they concisely show the goal for the current year, the outcomes and the goal for the next financial year. The disclosure presents outcomes in a balanced way, and it was clearly evident where the stated strategic objective was not achieved.
The disclosure clearly signposts where the reader can find additional information, adding to the connectivity across the whole report.
Source: Growthpoint Limited, Annual Report 2016, page 13.
FY16 Goals i Maintain gearing within 35%-45% range.
i Extend average debt maturity.
i Diversify sources and tenor of debt.
i Additional capital markets issuance to be considered.
FY16 Achievements % Balance sheet gearing at 30 June 2016 was 42.6%.
× The weighted average debt maturity was 4.2 years at 30 June 2016; down from 4.7 years at 30 June 2015.
% Growthpoint entered into $250m of new debt capital market facilities for 7 years in December 2015, with proceeds used to repay domestic bank debt. In addition Growthpoint terminated three interest rate swaps with face values of $265 million (at cost of $10.5 million) and entered into four new interest rate swaps with a face value of $150 million and a weighted average maturity of 5 years.
FY17 Goals
As per FY16 plus:
• Ensure fixed debt is within the target range of 75% to 100% after current transactions are completed.
FY16 Goals i Inclusion in major indexes.
i Increase equity capital where appropriate.
i Engage with research analysts to increase and improve coverage.
i Increase liquidity of Growthpoint's securities.
FY16 Achievements % Remained in S&P/ASX200 (plus other indices).
% $40.1 million of new equity was raised via the distribution reinvestment plan with the proceeds being used to fund acquisitions and capital works.
× Research coverage reduced from seven to six analysts.
× Liquidity of Growthpoint's securities was flat from FY15 to FY16, with 121,359,340 securities traded in FY16 compared to 132,622,827 in FY15.
FY17 Goals
No change from FY16.
76
14
Increase liquidity and value of Growthpoint securities
Borrow prudently
Operate sustainably4 5 6
FY16 Goals i Refine sustainability objectives.
i Focus on long-term value rather than short-term profits.
i Improve gender diversity of directors and employees.
FY16 Achievements % Sustainability objectives have been refined (refer pages 7-9 of Sustainability Report for more details).
% The property portfolio, capital management strategy and established sustainability targets have been built with long-term value creation in mind.
× 35% of the Group's employees (six out of 17) are female, down from 40% as at 30 June 2015 (six out of 15).
FY17 Goals • Monitor compliance with sustainability
objectives and improve integration of sustainability practices within business operations.
• Continue to focus on long-term value rather than short-term profits.
• Seek additional female director (target date 2020).
7
Sustainable growth means ensuring Growthpoint's business assets, revenue and expenses are able to be continued. It includes enhancing people and limiting our impact on the environment.
255 London Circuit, Canberra, ACT
2016 Sustainability Report (available online only)
More details about sustainability can be found in Growthpoint's 2016 Sustainability Report.
investors.growthpoint.com.au/SustainabilityReport/2016
13
Business O
verviewO
perating Sustainably
Financial Report
Financial Managem
entP
ortfolio Review
Additional Inform
ation
Strategy
Stage 2 More insightful reporting
© 2016 KPMG, an Australian partnership and a member firm of the KPMG network of independent member firms affiliated with KPMG International Cooperative (“KPMG International”), a Swiss entity. All rights reserved. The KPMG name and logo are registered trademarks or trademarks of KPMG International. Liability limited by a scheme approved under Professional Standards Legislation.

14 Corporate reporting – evolution and integration
Henderson Group PLC Henderson use a table to show the connectivity between their strategic priorities, how they performed during the year, the key performance indicators (KPIs) used to measure performance and the principal risks that impact each strategic priority.
Each KPI is then explained in detail on the following pages, including a graph showing current and past performance, how the KPI is linked to strategy and commentary on the current year performance.
Source: Henderson Group PLC Annual Report 2015, page 14-16.
© 2016 KPMG, an Australian partnership and a member firm of the KPMG network of independent member firms affiliated with KPMG International Cooperative (“KPMG International”), a Swiss entity. All rights reserved. The KPMG name and logo are registered trademarks or trademarks of KPMG International. Liability limited by a scheme approved under Professional Standards Legislation.

15Corporate reporting – evolution and integration
Telstra Telstra clearly explains who Telstra is and shows clear linkage between the overview and other sections of the report i.e. the strategy ‘Improve Customer Advocacy’.
Improving Customer Advocacy has been a key strategic focus for Telstra for some time as it is a key driver of sustainable value. The disclosure is balanced as it explains clearly that although performance in certain business units has improved, ‘Our overall NPS performance this year was disappointing, and shows we have more to do to deliver a great experience for our customers every time they interact with us’. The disclosure goes on to explain what Telstra is doing to rebuild that customer experience and advocacy.
Source: Telstra, Annual Report 2016, page 3 and 10.
The overview of group strategy on page 3, connects through to the detailed strategy and performance section, through the key pillars.
Stage 2 More insightful reporting
© 2016 KPMG, an Australian partnership and a member firm of the KPMG network of independent member firms affiliated with KPMG International Cooperative (“KPMG International”), a Swiss entity. All rights reserved. The KPMG name and logo are registered trademarks or trademarks of KPMG International. Liability limited by a scheme approved under Professional Standards Legislation.

16 Corporate reporting – evolution and integration
Corporate reporting portfolio
In addition to the annual report, many organisations also produce a number of voluntary and regulatory reports targeted at different stakeholder groups, such as sustainability/ESG reports, investor presentations, annual reviews and reports required by industry-based regulators. This can result in complex reporting portfolios, with reports being prepared by different teams across the organisation and released at different times throughout the year.
Each additional report requires organisations to have additional internal review processes to ensure the integrity of the report and that data being communicated is accurate. Additional reports increase the risk of disconnected and/or inconsistent information going to market, especially if it is being released at a later date. They also cost money to produce.
As a next step to continue their journey along the Reporting Continuum, some organisations are starting to set a corporate reporting strategy, beginning with a stocktake of the reports in the corporate reporting portfolio. This allows them to re-evaluate the real need for each individual report.
Engaging with report users to understand their information needs, and subsequently rationalising the reporting portfolio not only better meets the material information needs of key stakeholders, but can also help drive internal cost efficiencies. It can be done as part of setting an overall corporate reporting strategy taking the organisation further down the path towards integrated reporting.
20 16Annual Report
SECURITYHOLDER REVIEW ANNUAL REPORT 2015
Stage 2 More insightful reporting
Source: Lendlease, Annual Report 2015, Securityholder Review 2015, Annual Report 2016.
© 2016 KPMG, an Australian partnership and a member firm of the KPMG network of independent member firms affiliated with KPMG International Cooperative (“KPMG International”), a Swiss entity. All rights reserved. The KPMG name and logo are registered trademarks or trademarks of KPMG International. Liability limited by a scheme approved under Professional Standards Legislation.
17Corporate reporting – evolution and integration
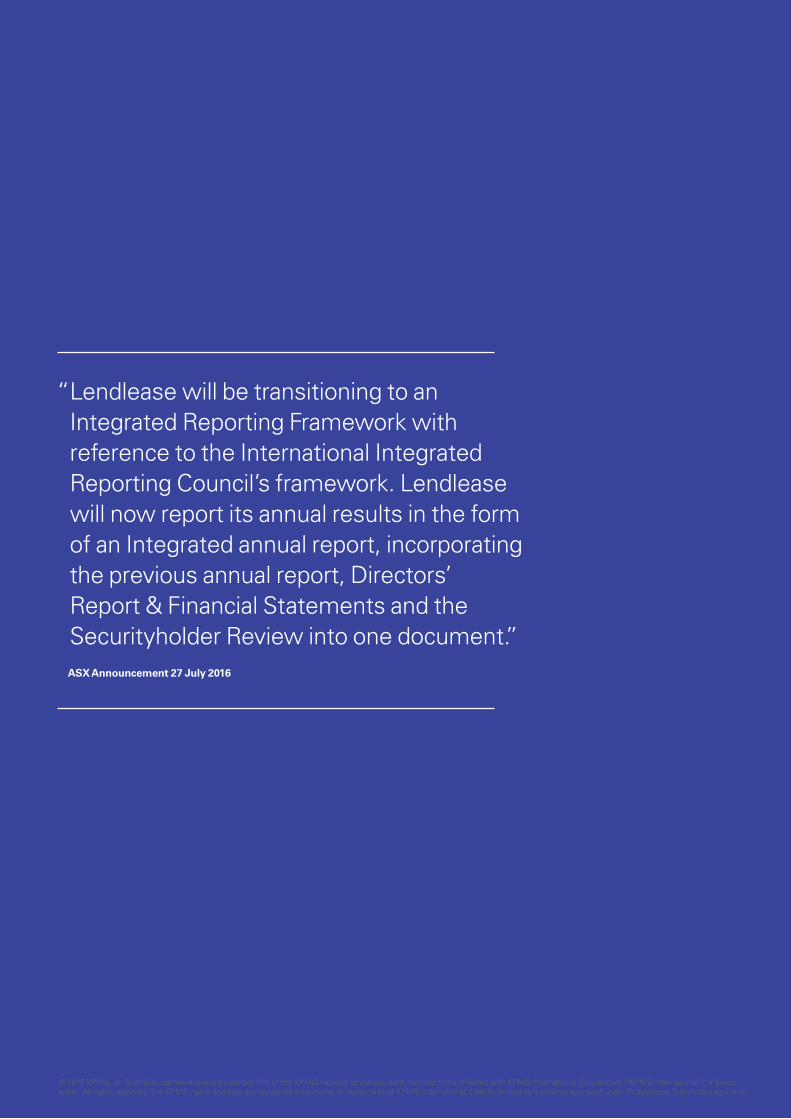
“ Lendlease will be transitioning to an Integrated Reporting Framework with reference to the International Integrated Reporting Council’s framework. Lendlease will now report its annual results in the form of an Integrated annual report, incorporating the previous annual report, Directors’ Report & Financial Statements and the Securityholder Review into one document.”ASX Announcement 27 July 2016
© 2016 KPMG, an Australian partnership and a member firm of the KPMG network of independent member firms affiliated with KPMG International Cooperative (“KPMG International”), a Swiss entity. All rights reserved. The KPMG name and logo are registered trademarks or trademarks of KPMG International. Liability limited by a scheme approved under Professional Standards Legislation.

18 Corporate reporting – evolution and integration
Integrated reporting <IR>
As organisations move towards this third stage in the Reporting Continuum, the goal is to develop a ‘flagship’ or integrated report which provides investors with a clear and concise overview of all the information needed for decision making, not just the financials. This ‘flagship’ report should show investors how the organisation’s strategy, business model, governance, performance, risks and future prospects, come together to create long term value.
In the current reporting season we have seen a small number of organisations produce a ‘flagship’ report which has been based on the principles of integrated reporting.
In some circumstances this information is included in the annual report, such as the approach taken by Lendlease, and for others it is in a separate Annual Review, which is the approach taken by National Australia Bank (NAB).
Stakeholder engagementAs organisations start to move towards focusing their ‘flagship’ report on explaining how they create and preserve value, they will realise the importance of really capturing and then responding to what is material for their key stakeholders.
What leading reporters are preparing now is not a document focused on past financial performance using a prescribed template, but a report that addresses the reasonable and changing information needs of providers of financial capital and other key stakeholders.
In order to transition to integrated reporting, organisations will need a formal and continuous process to determine who their key stakeholders are, and what information is important and material for them when making their various investment decisions.
The International Integrated Reporting <IR> FrameworkThe International Integrated Reporting Council (IIRC) released the International Integrated Reporting <IR> Framework (<IR> Framework) in December 2013 to assist organisations prepare an integrated report.
The <IR> Framework does not need to be applied in totality, and no one in Australia has prepared a perfect integrated report. However the framework has been considered by the likes of NAB, Australia Post and Lendlease when preparing their reports. They have all leveraged the principles to help shape their ‘flagship’ report and move them along the reporting continuum.
THE INTERNATIONAL <IR> FRAMEWORK
International <IR> Framework.
© 2016 KPMG, an Australian partnership and a member firm of the KPMG network of independent member firms affiliated with KPMG International Cooperative (“KPMG International”), a Swiss entity. All rights reserved. The KPMG name and logo are registered trademarks or trademarks of KPMG International. Liability limited by a scheme approved under Professional Standards Legislation.

19Corporate reporting – evolution and integration
Stage 3 Integrated Reporting
National Australia Bank National Australia Bank (NAB) has gone through a detailed and robust process to engage with their stakeholders and understand their expectations. This engagement process has enabled them to identify seven prioritised topics to be disclosed in the integrated report.
The report also clearly shows how the business activities NAB undertake creates long-term value for their stakeholders.
“ By engaging with our stakeholders, we can better understand the expectations of our broader community, identify challenges sand opportunities and encourage innovation.”
National Australia Bank
Through the stakeholder engagement process NAB have identified seven priority topics to be included in the report.
The table is used to show clear linkages between financial impacts, business activities, related broader impacts and the associated risks.
Source: National Australia Bank, Annual Review 2016, page 8 and 9.
© 2016 KPMG, an Australian partnership and a member firm of the KPMG network of independent member firms affiliated with KPMG International Cooperative (“KPMG International”), a Swiss entity. All rights reserved. The KPMG name and logo are registered trademarks or trademarks of KPMG International. Liability limited by a scheme approved under Professional Standards Legislation.

20 Corporate reporting – evolution and integration
Australia PostThe 2016 Australia Post annual report takes Australia Post’s application of the <IR> Framework to another level. The integrated report component of the overall 2016 annual report is 50 pages.
The highlight of the report from an integrated reporting perspective is the manner in which the report is structured around the three fundamental concepts of the <IR> Framework, i.e the creation of value, through the business model and effectively using the 'six capitals'. As explicitly encouraged by the principles-based <IR> Framework, Australia Post has used its own terms to explain the key capitals used in its value creation process (e.g. ‘our customer network’ is used 'to cover manufactured and social capital').
The report highlights the guidance of Australia Post’s ‘annual report Steering Committee’ in preparing the report. Such steering groups have been a critical success factor in effective integrated reporting around the world, as it is essential that the organisation comes together in embarking on an integrated reporting journey, with the integrated report a quality output of the process.
The <IR> Framework can be broadly characterised as an ‘inside looking out’ approach to corporate reporting (a supply-oriented perspective) and the GRI G4 Guidelines could be characterised as an ‘outside looking in’ approach (a demand-oriented perspective). Australia Post uses both and reconciles their use.
About this report
This is the sixth year that we have incorporated sustainability reporting in our annual report. Prepared in accordance with legislative requirements, the Global Reporting Initiative (GRI) G4 Guidelines, Integrated Reporting <IR> and the principles set out in the United Nations Global Compact, our annual report includes our financial, social and environmental activities each year.
Integrated reporting is aimed at facilitating integrated thinking into mainstream business practices. It is more forward-looking than traditional annual reporting, while not as specifically detailed as comprehensive sustainability reports. In actively considering the relationships between our enterprise and how we create value in our areas of impact – organised as ‘capitals’ – we can move towards publicly reporting the way we integrate our thinking and decision-making.
The International Integrated Reporting <IR> Council Framework provides guiding principles that align with the GRI, the well-established global best practice sustainability framework. The content of this report has been guided by the annual report Steering Committee. The approach was endorsed by the Executive General Manager, Group Services, with final approval of the annual report by the Board.
This year our annual report is framed around the six integrated reporting capitals to align with the <IR> Framework:
Determining what matters most – the materiality process
This report provides information for our four primary stakeholders:
• our shareholder (the Australian Government)
• our people
• our customers
• the broader community.
The information in this report applies to Australia Post within the reporting period, unless otherwise stated. Australia Post did not issue restatements of information provided in previous reports and there are no significant changes in the boundary or scope of this report in 2015/16.
To determine the content and ensure we are reporting on what matters most to our stakeholders, we conduct an
annual materiality assessment. This process is explained on page 49.
The material sustainability issues nominated by our internal and external stakeholders are:
Our customer network Physical Capital
Our six integrated reporting capitals
Our business performance Financial Capital
Our environment Natural Capital
Our customers Our communities Social Capital
Our innovation Our expertise Intellectual Capital
Our people Human Capital
Top 10 material issues 2016
1. Customer experience 6. eCommerce expertise
2. Community relations 7. Support for the vulnerable
3. Innovate/co-create 8. Digital access
4. Operating profitability
9. Greenhouse gas emissions
5. Transparency and disclosure
10. Fair labour practices
Annual Report 20162 Annual Report 2016
Emphasis on link between integrated thinking and <IR> - facilitating integrated thinking into mainstream business practices a critical component of integrated reporting.
Source: Australia Post, Annual Report 2016, page II.
Formal reference of both IIRC Framework & GRI G4 Sustainability Reporting Guidelines.
Statement of accountability for integrated report – endorsed by Executive General Manager, Group Services, with final approval from Board.
Report framed around the six capitals to align with the <IR> Framework.
Reconciliation of Australia Post and IIRC’s ‘capitals’ terminology.
© 2016 KPMG, an Australian partnership and a member firm of the KPMG network of independent member firms affiliated with KPMG International Cooperative (“KPMG International”), a Swiss entity. All rights reserved. The KPMG name and logo are registered trademarks or trademarks of KPMG International. Liability limited by a scheme approved under Professional Standards Legislation.

21Corporate reporting – evolution and integration
Source: Australia Post, Annual Report 2016, page 2.
Stage 3 Integrated Reporting
Australia Post has used the six capitals to weave together its performance highlights. This highlights summary is supported by rich and insightful detail in sections on each capital, and also on the operating segments of the business.
2016 performance highlights
Australia Post Accelerator: $20 million investment
Safety6.6 LTIFR
Gender pay gap1.4%
Our purpose and valuesAustralia Post’s purpose is: Helping our people, customers and communities deliver a better future. Everyone, everywhere, everyday.
Our strategy is informed by, and focused on, services that meet customers’ contemporary needs. We love delivering eCommerce through our people by embracing our shared values:
Improving everyday: A better tomorrow starts with the changes we make today.
Being safe everywhere: There’s nothing more important than our safety, health and wellbeing.
Respecting everyone: We care about people and value diversity.
Delighting our customers: A great customer experience creates a better future.
Helping each other: We’re at our best when we work together.
Reduced carbon emissions by 17% since the year 2000We’re on track to achieve our target of 25% by 2020
Our environment
Our people
Our business performance
Our customer network
Government innovation partnership: digitising WA Police National Police Check process
$36 millionProfit after tax
3.8 million MyPost registrations
11 new superstores
Community Service Obligation
Community Investment$7.05 million
Exceeded our 94% on time target in delivering letters, with a result of 96.2%
249 million annual customer visits
• Joint venture with Aramex
• Qantas airfreight network
• Majority investment in Mailplus
Our innovation and expertise
Our customers and communities
KPIs cover all six capitals and demonstrate some connectivity between all reporting elements.
Reporting on intellectual capital (innovation & expertise) remains an area missing from many integrated reports at this stage.
© 2016 KPMG, an Australian partnership and a member firm of the KPMG network of independent member firms affiliated with KPMG International Cooperative (“KPMG International”), a Swiss entity. All rights reserved. The KPMG name and logo are registered trademarks or trademarks of KPMG International. Liability limited by a scheme approved under Professional Standards Legislation.

22 Corporate reporting – evolution and integration
About this reportThis is Lendlease’s first integrated annual report and we expect this report to evolve over time. Through this report we aim to communicate how we create long term value for our securityholders through five value pillars.
Lendlease – developing our first Integrated Report
Background
In 2014 the Lendlease Board and management decided to explore integrated reporting as a way of better communicating the Lendlease value story to its investors and other key stakeholders. The Board agreed to work towards a first integrated report by June 2016.
An internal reporting group was already established including executives from Finance, Corporate Affairs, Investor Relations, Strategy, Legal, Risk, Sustainability, Health & Safety, HR and Company Secretariat. This group was charged with driving development of the integrated reporting solution.
Challenges
There were challenges in getting agreement on the extent and pace of change required to Lendlease’s current reporting portfolio. For the 2015 annual report, changes were made to ‘cut the clutter’ in the financial report; but the rest of the reporting portfolio largely stayed the same.
The Board continued to ask for progress on the integrated reporting project, and real action started when a sub-set of the reporting group decided to design a pro-forma report with reference to the IIRC’s Integrated Reporting <IR> Framework. A member of the Finance team working virtually full time on this project, with significant support from members of broader finance, Investor Relations and Corporate Affairs, designed a pro-forma integrated report which could then be debated and refined with input from the broader reporting group.
Meanwhile, this smaller team was also undertaking in-depth research into best practice integrated reports prepared overseas, as well as testing, at a conceptual level, a move to integrated reporting with key internal and external stakeholders. This feedback informed the design of the pro-forma. Once the pro-forma was in good shape, the KPMG Better Business Reporting team were asked to review it and recommend further improvements from both an <IR> Framework and ASIC RG247 perspective.
Benefits
The CEO and Executive team all supported development of the report. The Board also took a keen interest and made a number of changes to drafts of the report which shaped the final version. They were fully supportive of the move to integrated reporting, and the focus on telling Lendlease’s value story more effectively.
From a time and cost perspective, developing the integrated report removed two additional reports from Lendlease’s corporate reporting portfolio and saved at least six weeks of management time in preparation and checking of additional reports without omitting any material information required by investors.
The development of the integrated report also challenged the reporting group to articulate their business model, strategy and the five pillars of value that underpin everything Lendlease does, more effectively (see report extracts on page 23). Agreement on these pillars brought a number of independent areas of the group together with a common understanding of how they each work together to deliver sustainable value.
20 16Annual Report
© 2016 KPMG, an Australian partnership and a member firm of the KPMG network of independent member firms affiliated with KPMG International Cooperative (“KPMG International”), a Swiss entity. All rights reserved. The KPMG name and logo are registered trademarks or trademarks of KPMG International. Liability limited by a scheme approved under Professional Standards Legislation.

23Corporate reporting – evolution and integration
Investor feedback
The initial feedback from investors has been positive. The integrated report explains Lendlease’s value story more effectively, which had been an area of criticism in the past. Investors have also commented on the improved transparency in the current report, especially around the business model.
Lendlease will take on board feedback on this first integrated report for next year, and as noted in the report will work on improving how strategic success is measured and reported.
" Progress on the integrated report really got going once the pro-forma had been developed and discussion was no longer conceptual. There was some push back, but this dissipated as the pro-forma took shape and especially when the pillars of value were agreed. The whole exercise has been valuable in helping clarify and align the group-wide interpretation of our strategy and how we create value. The fact that we have reduced the volume of our reporting and received positive feedback from our investors has been the icing on the cake."
Simon Benson, Group Financial Controller
ANNUAL REPORT 2016 | LENDLEASE ANNUAL REPORT 2016 | LENDLEASE28 29
Our Business | Our Strategy | Pillars of Value | Risk | Performance & Outlook | Governance | Financial Statements
DIRECTORS' REPORT
Our Business | Our Strategy | Pillars of Value | Risk | Performance & Outlook | Governance | Financial Statements
DIRECTORS' REPORT
GovernanceOur disciplined approach to governance aligns decision-making to strategy. This
includes strong risk management to proactively manage and address risks.
These pillars, supported by disciplined governance and risk management, drive our approach to business and contribute to our performance. Innovation is embedded in our approach to business through each of these pillars.
The Pillars of Value How the Pillars Drive Value
How the Pillar is Delivered Value Created by the Pillar Pillar Reference
Financial
We deliver returns to our securityholders and adopt a prudent approach to capital management with a view to maintaining a strong balance sheet position throughout market cycles.
Margins, fees and ownership returns across Development, Construction and Investments.
We target a capital efficient approach when we develop and invest.
Pages 30 to 31
Health & Safety
We are committed to the safety of our people. Through our Global Minimum Requirements (GMRs) we operate to a consistent standard across all of our operations. These GMRs extend not only to physical safety but also to people's health and wellbeing.
Every person who engages with Lendlease has the right to be safe and well. Operating safely ensures people feel valued and cared for, but fundamentally makes us more consistent, more reliable and more efficient in everything we do.
Pages 32 to 33
Our Customers
Our customers are a key contributor to the long term success and growth of Lendlease. We are currently creating a customer framework to enable a consistent customer experience to be delivered across all of our operations, leveraging the significant amount of work undertaken at a regional and business unit level.
Satisfied customers build our reputation for new work and repeat business enabling us to grow our pipeline of opportunities and to maintain occupancy across our assets.
Pages 34 to 35
Our People
Lendlease attracts, nurtures and retains the best people by building a culture of collaboration and continuous learning, where successes are recognised and people are rewarded.
Engaged, capable and motivated people are more productive and more committed to the long term success of our business.
Pages 36 to 39
Sustainability
Environmental, social and economic outcomes are delivered through our portfolio of international urban development, construction and investment activities and projects.
Recognised leadership in sustainability enhances our brand and is a competitive differentiator. Being sustainable means we win work and we attract capital from investors with Environmental, Social and Governance (ESG) mandates.
Pages 40 to 43
Fina
ncia
lN
on F
inan
cial
Our PeopleLendlease’s people are the greatest
contributors to our success and underpin our ability to deliver our vision to create the best places.
SustainabilitySustainability is about
creating places for people and meeting their needs for the future. Globally,
governments and communities are seeking trusted partners who can enhance urban areas with
efficient, healthy and resilient outcomes.
Health & SafetyEvery person who engages
with Lendlease has the right to be safe and well. This means
we focus on the mental health and physical wellbeing of all people on our projects and
within our offices.FinancialA strong balance sheet and access
to capital enables Lendlease to continue to expand its pipeline and
deliver quality earnings.
Our CustomersSatisfied customers drive long term value. We adopt a collaborative approach to managing our relationships,
delivering high quality service and responding to
our customers’ needs.
Source: Lendlease Annual Report 2016, page 4 and 29.
Stage 3 Integrated Reporting
Five pillars of value that drive the long term value for the business.
Further detail is provided as to how each pillar is delivered and the value created by the pillar.
© 2016 KPMG, an Australian partnership and a member firm of the KPMG network of independent member firms affiliated with KPMG International Cooperative (“KPMG International”), a Swiss entity. All rights reserved. The KPMG name and logo are registered trademarks or trademarks of KPMG International. Liability limited by a scheme approved under Professional Standards Legislation.

24 Corporate reporting – evolution and integration
How KPMG can help
KPMG is supporting organisations to improve their external reporting in a number of ways:
Further information on recent developments in corporate reporting and the implications for CFOs, Directors and Investors can be found in on the KPMG Better Business Reporting website.
kpmg.com/au/betterbusinessreporting
Assistance in identifying quick wins using our experience from working with clients who have undertaken de-cluttering activities.
Helping to prepare, or review pro-forma annual reports to help companies produce more insightful disclosures and recommend further improvements from both an <IR> Framework and RG247 perspective.
Advising on taking a more strategic approach to corporate reporting, including facilitating, developing or refining reporting and communication strategies, and aligning reporting processes and systems.
Facilitating workshops and discussions about application of the 'three R's', supporting organisation’s to identify and implement de-cluttering opportunities.
Providing thought leadership and examples of insightful disclosures.
Support in defining and enhancing Corporate Reporting Portfolios, including defining the flagship corporate report (from initial blueprint to final document), and navigation to other reports/website containing greater detail.
© 2016 KPMG, an Australian partnership and a member firm of the KPMG network of independent member firms affiliated with KPMG International Cooperative (“KPMG International”), a Swiss entity. All rights reserved. The KPMG name and logo are registered trademarks or trademarks of KPMG International. Liability limited by a scheme approved under Professional Standards Legislation.

25Corporate reporting – evolution and integration
Appendix 1 – Review methodology
The ASX 200 annual reports examined and included within the current year results are from those organisations listed as being within the ASX 200 survey as at 9 August 2016.
Where an organisation has not yet lodged an annual report at the time the review was completed, the preliminary release (Appendix 4E) was reviewed where it contained the full financial statements. This has resulted in 194 of the ASX 200 being included in the review results in relation to ‘cutting the clutter' in the financial statements, and 156 of the ASX 200 being covered in other areas of this report.
Where available, comparative data has been sourced from the 2015 KPMG publication, A new era in Corporate Reporting – Review of recent corporate reporting and de-cluttering trends in the ASX200.
© 2016 KPMG, an Australian partnership and a member firm of the KPMG network of independent member firms affiliated with KPMG International Cooperative (“KPMG International”), a Swiss entity. All rights reserved. The KPMG name and logo are registered trademarks or trademarks of KPMG International. Liability limited by a scheme approved under Professional Standards Legislation.

The data and information contained within this report may have changed due to the dynamic nature of social media. Every effort was made to ensure that data and information was correct at the time of publication.
The information contained in this document is of a general nature and is not intended to address the objectives, financial situation or needs of any particular individual or entity. It is provided for information purposes only and does not constitute, nor should it be regarded in any manner whatsoever, as advice and is not intended to influence a person in making a decision, including, if applicable, in relation to any financial product or an interest in a financial product. Although we endeavour to provide accurate and timely information, there can be no guarantee that such information is accurate as of the date it is received or that it will continue to be accurate in the future. No one should act on such information without appropriate professional advice after a thorough examination of the particular situation.
To the extent permissible by law, KPMG and its associated entities shall not be liable for any errors, omissions, defects or misrepresentations in the information or for any loss or damage suffered by persons who use or rely on such information (including for reasons of negligence, negligent misstatement or otherwise).
© 2016 KPMG, an Australian partnership and a member firm of the KPMG network of independent member firms affiliated with KPMG International Cooperative (“KPMG International”), a Swiss entity. All rights reserved.
The KPMG name and logo and are registered trademarks or trademarks of KPMG International.
Liability limited by a scheme approved under Professional Standards Legislation.
October 2016. QLDN14627AUD.
kpmg.com.au
Sydney
Nick RidehalghPartner T: +61 2 9455 9315 E: [email protected]
Kylie DumbleAssociate DirectorT: +61 2 9335 7292 E: [email protected]
Melbourne
Michael BrayDirectorT: +61 3 9288 5720 E: [email protected]
Bernie SzentirmayPartnerT: +61 3 9288 5423 E: [email protected]
Simon DuboisPartnerT: +61 3 9288 6927 E: [email protected]
Contact us
Related Documents