Corporate Presentation March 2019

Welcome message from author
This document is posted to help you gain knowledge. Please leave a comment to let me know what you think about it! Share it to your friends and learn new things together.
Transcript

Corporate PresentationMarch 2019

Multi faceted approach of
Distribution & Services
No.1 Technology distributor in MEA and No.2 in India
Expanding the reach & coverage for over
220+ brands through 39,800+ partners
An Emerging Markets player with in-
country presence
$6.7bn+ company with strong double digit 12 year CAGR (Revenue, EBITDA & PAT)
WHO ARE WE? WHAT WE DO?
A prominent & leading
“Technology Distributor”
evolving into a
“Services & Solutions company”
We are ‘Business Enablers’,
Seamlessly partnering with
Brands and Channel partners
in delivering value
2

Industry Overview

Distribution Food Chain
IT ENTERPRISE
IT CONSUMER & MOBILITY
Earlier
Present
Earlier
Present
VENDOR DISTRIBUTORSUB DISTRIBUTOR
RETAILER
RESELLERCUSTOMER
VENDOR DISTRIBUTOR
RESELLER
RETAILER CUSTOMER
ECOMMERCE PLAYER
VENDOR DISTRIBUTORSYSTEM INTEGRATOR
VALUE ADDED RESELLER
VENDOR DISTRIBUTOR
SYSTEM INTEGRATOR
VALUE ADDED RESELLER CUSTOMER
CUSTOMER
4

Distributors: Value Creators
Market Knowledge & Access
Demand Generation
Partner Recruitment & Enablement
Sales & Marketing Expertise
Supply Fulfilment
Pre & Post Sales Consulting
Nimble on Variable Cost
One stop shop
Inventory Management
Bulk breaking
Credit financing
Logistics
Order consolidation
Technical Support & Training
BRANDS CHANNEL PARTNERS
Increase in the revenue base & increased value offered in a product
Facilitating selling as well as enhancing the selling potential for partners
5

Product Lifecycle
Our presence across the product lifecycle
Manufacture/
DevelopSell Reach Maintain
6

Company Overview

Mission Statement
“Our mission is to offer a robust technology-powered
platform to enable a seamless flow of products and
services”
8

Our Values
ADAPTABILITY COLLABORATION KNOW-HOW
TRUST TRANSPARENCYOBJECTIVITY SIMPLICITY
9

Our Emergence
Presence across 37 markets, a leading Emerging Markets player1993
Present
10

Our Associations
Present
Enviable Partnerships with over 220+ brands199311

Our Expansion
220+ 39,800+ 4,839 37 80 220+ 285+
1 25 5 1 3 1 1
Present
1993
BRANDS
From a ‘Home Grown Company’ to a ‘Leading Distributor’
CHANNELPARTNERS
EMPLOYEES MARKETSSALES
OFFICESWAREHOUSES
SERVICE CENTRES
12

Our Board Of Directors
Independent Directors
Executive Directors
Prof. RamachandranProfessor, Corporate
Policy & StrategyIIM, Bengaluru
Keith WF BradleyEx.President,
Ingram Micro, North America
V. S. HariharanEx. Vice President,Hewlett-Packard,
Singapore
Raj ShankarManaging Director
E H Kasturi RanganWhole time Director
Non-Executive Directors
Chen, Yi-JuSenior Manager – Finance Planning & Management
Synnex Tech, Taiwan
Tu, Shu-ChyuanGeneral Manager
Business Development Synnex Tech, Taiwan
B RamaratnamProfessional
Director
Udai DhawanManaging Director,Standard CharteredPrivate Equity, India
CHAIRMAN
13
Anita P BelaniSr Business & Human
Capital Leader, Operating Partner (Gaja Capital)

Our Experienced Executive Team
Raj ShankarManaging Director
Serkan Celik, CEO, Arena,
Turkey
B RamkumarCOO, Gulf
Jim MathewSr. Vice President,
Mobility,Africa
S SethuramanSr. Vice President,
Ensure Services, MEA
Ramesh NatarajanJoint COO & Chief Sales Officer, India
J K Senapati,Joint COO, India
Dr. R. ArunachalamCEO, ProConnect
Logistics, India
P S NeogiChief Development & Strategy Officer
S V KrishnanChief Financial
Officer
S V RaoCEO, Ensure
Services, India
Sriram GaneshanDirector & Chief Financial Officer,
MEA
E H Kasturi RanganWhole Time
Director
S ChidambaramSr. Vice President,
Supply Chain Management, MEA
Jeetendra Berry,Sr Vice
President,IT Volume, Middle East
Rawad Ayash,Sr Vice
President,Mobility,
Middle East
14
Aloysius FernandesPresident,IT Volume,
Africa

Business Overview

Distribution Business
BUSINESS INDIA MIDDLE EAST AFRICA TURKEY SINGAPORE SOUTH ASIA
DISTRIBUTION
Solar products
Health & Medical Equipment
3D Printers & Scanners
PCs Laptops
Printers
Print Supplies
Consumer Lifestyle products
Networking
Servers & Storage Security
Software
Smartphones
IT CONSUMER IT ENTERPRISE MOBILITY EMERGING
16

Services Business
BUSINESS INDIA MIDDLE EAST AFRICA TURKEY SINGAPORE SOUTH ASIA
SERVICES
Logistics services Support services Digital print services 3D Print ServicesCloud services
SERVICES & SOLUTIONS COMPANY
DistributorTraderTransformative initiatives for
Seamless SuccessSupply Chain Consolidator
17

ProConnect India
Revenue Contribution from Services
50%
33%
17%Warehousing
Transportation
Others
Revenue Contribution from Industries
18%
17%
17%11%
8%
30%
IT
Consumer Durables
E-Com
Telecom & Infra
Food Products
Others
Wholly Owned Subsidiary of Redington
Integrated Third Party Logistics partner
PAN India presence
180+ Warehouses
6.8 mn Sq.ft. in operation
200+ Customers across 12+ Industries
19,800+ Pincodes
18

ProConnect India : Growth Story
403
FY14 FY15 FY16 FY17 FY18 FY19
Revenue
58
FY14 FY15 FY16 FY17 FY18 FY19
EBITDA
30
FY14 FY15 FY16 FY17 FY18 FY19
PAT
CUSTOMERS
WAREHOUSES
WAREHOUSING SPACE (in sq. ft.)
33
74
0.9 mn
53
74
1.2 mn
74
80
2.5 mn
124
150
4.8 mn
166
173
6.3 mn
76% 71%51%
35%21% 16%
24% 29%49%
65%79% 84%
FY14 FY15 FY16 FY17 FY18 FY19
Redington Outside Biz
2013-14 2017-182014-15 2015-16 2016-17
Revenue Mix
19
205
181
6.8 mn
2018-19

Ensure India
Clients
Warranty Support Services
Infrastructure Management
Services
Spare Parts Management
E-waste Management
Managed Print Services
Post Warranty Services
Wholly Owned Subsidiary of Redington
PAN India presence with 35+ Owned service centres across India
Preferred Service partner with 200+ service partners across India
FY19 Revenues : Rs 107 crsFY19 PAT : Rs 4 crs
20
*Illustrative

Redington Cloud Solutions
Our business
Redington team provides Managed Services,
focussing on SME/Mid Market
clientele
Our Cloud
PracticeBusiness
Development
Partner Enablement Program
ISV MarketplaceCloud Consulting
Managed Services
Digital Platform
Distribution
Element Services
Element
Our Cloud Practice
21
Down-selling of Cloud products

Printing Solutions
DIGITAL PRINT SERVICES 3D PRINT SERVICES
Set up 3D Printing Facility in Chennai
Exclusive Distributor of HP Indigo’s “Digital
Printing Press” in India
REVENUE MODEL
Distribution of Printing Press
Annuity revenues from clicks (impressions)
Parts & Labour
Ranked Grade “AA” by HP
Indigo
(Second highest in the world)
22
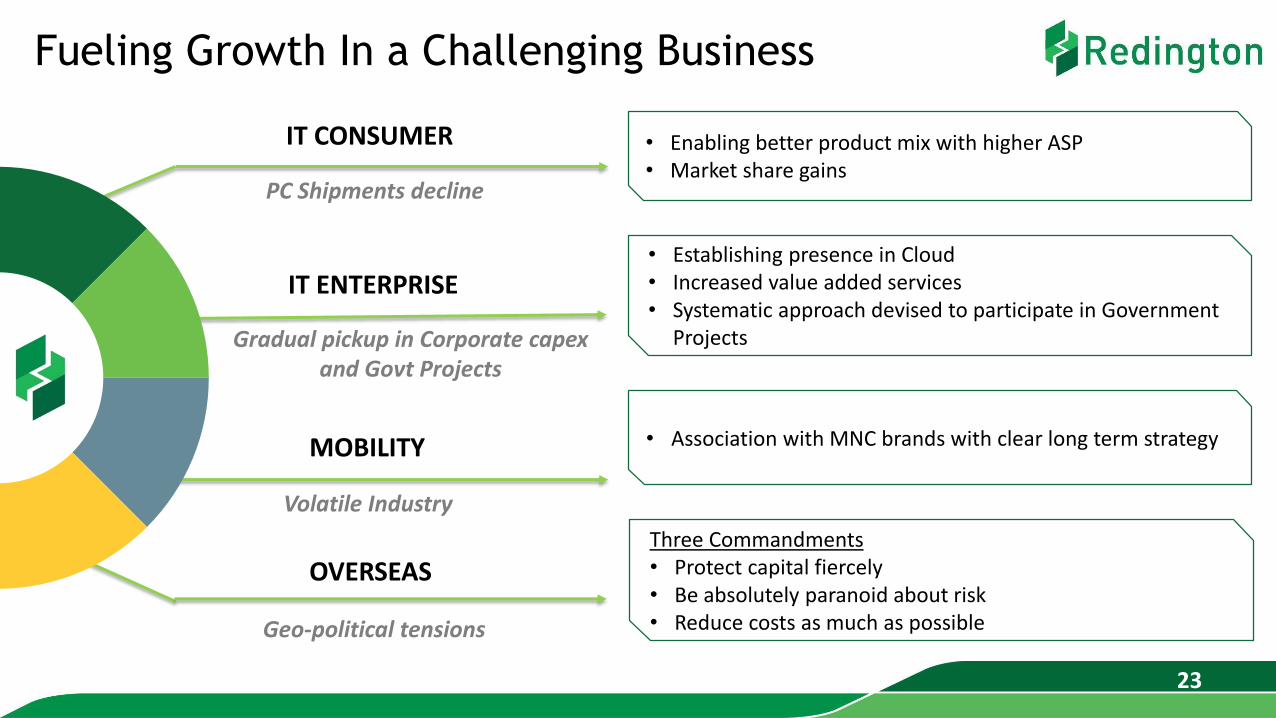
Fueling Growth In a Challenging Business
• Enabling better product mix with higher ASP• Market share gains
• Establishing presence in Cloud• Increased value added services• Systematic approach devised to participate in Government
Projects
• Association with MNC brands with clear long term strategy
Three Commandments• Protect capital fiercely• Be absolutely paranoid about risk• Reduce costs as much as possible
IT CONSUMER
IT ENTERPRISE
MOBILITY
OVERSEAS
PC Shipments decline
Gradual pickup in Corporate capexand Govt Projects
Volatile Industry
Geo-political tensions
23

Financial Performance
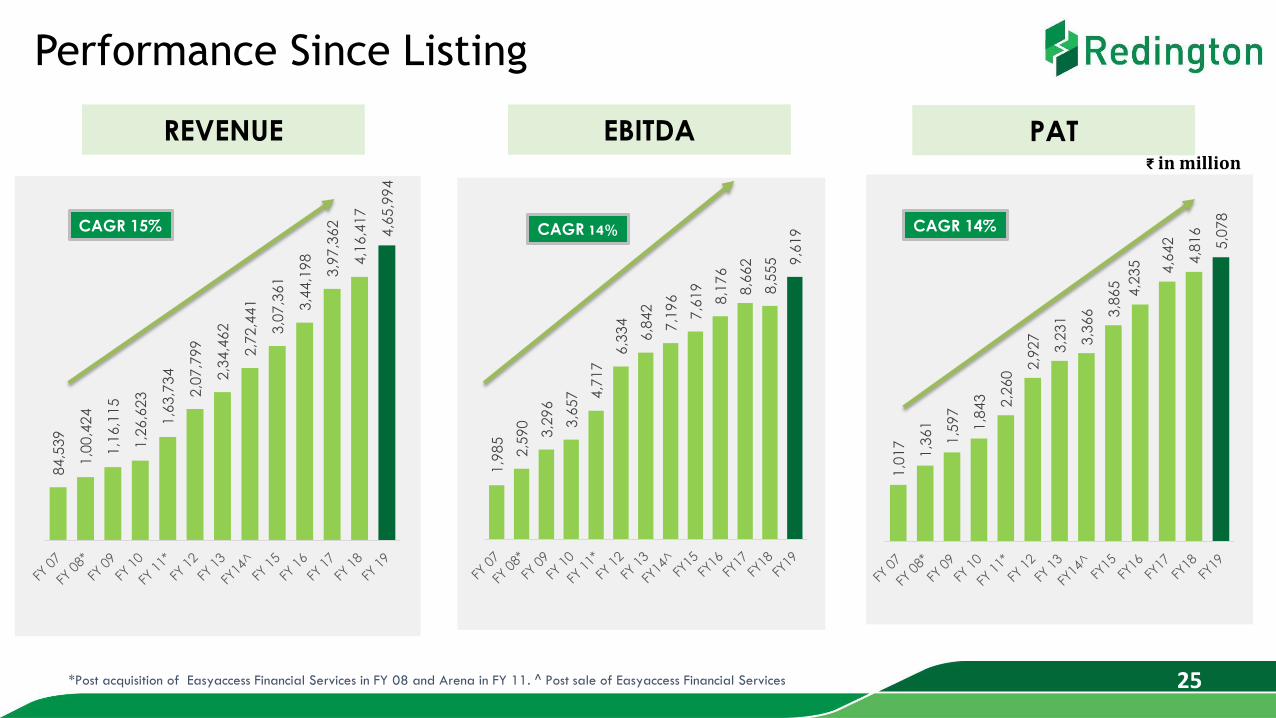
Performance Since Listing
REVENUE EBITDA PAT
*Post acquisition of Easyaccess Financial Services in FY 08 and Arena in FY 11. ^ Post sale of Easyaccess Financial Services
₹ in million
84
,53
9
1,0
0,4
24
1,1
6,1
15
1,2
6,6
23
1,6
3,7
34
2,0
7,7
99
2,3
4,4
62
2,7
2,4
41
3,0
7,3
61
3,4
4,1
98
3,9
7,3
62
4,1
6,4
17
4,6
5,9
94
1,9
85
2,5
90
3,2
96
3,6
57
4,7
17
6,3
34
6,8
42
7,1
96
7,6
19
8,1
76
8,6
62
8,5
55
9,6
19
1,0
17
1,3
61
1,5
97
1,8
43 2,2
60
2,9
27
3,2
31
3,3
66 3,8
65
4,2
35 4,6
42
4,8
16
5,0
78
CAGR 14%CAGR 14%CAGR 15%
25

Performance By Market
4,200 4,032
4,3555,587
FY18 FY19
India Overseas
8,5559,619
28%
12%
4%
REVENUE
₹ in million
26
EBIDTA
1,922 1,645
2,894 3,433
FY18 FY19
India Overseas
4,8165,078
19%
5%
14%
PAT
1,50,499 1,70,688
2,65,918
2,95,306
FY18 FY19
India Overseas
4,16,417
4,65,994
11%
12%
13%

Performance By Vertical
INDIA OVERSEAS
67% 65%
31% 33%
2% 2%
FY18 FY19
IT Mobility Services
75% 75%
20% 19%
5% 6%
FY18 FY19
IT Mobility Services
CONSOLIDATED
70% 69%
27% 28%
3% 3%
FY18 FY19
IT Mobility Services
27

Geographical Contribution
REVENUE PAT
43% 41% 38% 39% 36% 37%
57% 59% 62% 61% 64% 63%
FY 14 FY 15 FY 16 FY 17 FY 18 FY 19
India Overseas
53% 51% 49% 46%40%
32%
47% 49% 51% 54%60%
68%
FY 14 FY 15 FY 16 FY 17 FY18 FY19
India Overseas
28

Top 5 Vendors
11% 13% 15%22%
27% 27%
21% 20% 17%
15%
16% 15%4% 5% 4%
6%
8% 8%
3% 3% 4%
4%
7% 6%
7%9% 8%
7%
4% 5%
54%50% 52%
46%38% 39%
FY 14 FY 15 FY 16 FY 17 FY 18 FY 19
APPLE HP Inc DELL EMC CISCO LENOVO OTHERS
Note: Effect of Dell EMC merger is shown partly in FY17 figures and fully in FY18 figures 29

30
Key Operating Metrics
0.11% 0.12%
0.10% 0.08% 0.08%
0.14%
0.01%
0.11%
0.05%
-0.03%
0.09%
0.12%
FY 14 FY 15 FY 16 FY 17 FY 18 FY 19
Provision for AR-% of Sales Provision for Inventory -% of Sales
Cumulative generation
of cash flows
Working Capital Days at sustainable levels
Ensuring Risk adjusted
Returns
Rs in mn FY14 FY15 FY16 FY17 FY18 FY19
CFO 2,413 1,951 (1,922) 12,986 2,198 10,973
FCF (389) 947 (5,054) 9,113 (565) 7,318
30
33 36 43 33 29 32
61 59 63
53 59 54
39 41 48
43 44 49
55 54 58
43 44 37
FY 14 FY 15 FY 16 FY 17 FY 18 FY 19
Inventory Days Debtor Days Creditor Days Working Capital Days

Consolidated Financials
Particulars FY19 FY18 FY17 FY16 FY15 FY14
Total Revenue 4,65,994 4,16,417 3,93,762 3,44,198 3,07,361 2,72,441
EBITDA 9,619 8,555 8,662 8,176 7,619 7,196
PAT 5,078 4,816 4,642 4,235 3,865 3,367
Networth 39,060 35,306 31,479 29,494 23,742 20,213
Capital Employed 55,581 53,472 50,252 56,659 44,468 39,938
EBITDA Margins 2.1% 2.1% 2.2% 2.4% 2.5% 2.6%
PAT Margins 1.1% 1.2% 1.2% 1.2% 1.3% 1.2%
ROCE 16.5% 15.5% 15.2% 14.9% 17.2% 17.2%
ROE 13.7% 14.5% 15.3% 15.6% 18.2% 19.1%
EPS (₹) 12.8 12.0 11.6 10.6 9.7 8.4
Book Value per share
(₹)99.8 87.7 78.2 73.2 57.6 48.8
31

Dividend Distribution
20%
45%
95%
105%115%
120%
FY13 FY14 FY15 FY16 FY17 FY18 FY19
Dividend % on Face Value of shares
Dividend Payout : 20% on profits earned
Buyback of sharesIssue size Rs.139 crs
% Equity 2.78%
215%
Final dividend plus Special Interim Dividend declared 32

Shareholding Pattern (As on Mar 31st, 2019)
HDFC Mutual Fund
Fidelity Management & Research (FMR)
Franklin Templeton Investments
ICICIPru Life Insurance
Fidelity International
Dimensional Fund Advisors
Norges Bank
BlackRock Inc
33
Synnex
Mauritius Ltd,
24.2%
Standard
Chartered
Private Equity,
15.8%
Foreign
Institutional
Investors &
FPIs, 33.7%
Mutual Funds,
14.1%
Others, 12.2%

Our Growth Drivers

Revenue Growth Vectors
BRAND ACQUISITIONS
MARKET SHARE GAINS
MARKET EXPANSIONS
NEW BUSINESSOPPORTUNITIES
Continuous addition of brands across
product categories
Acquiring distribution rights in
newer regions & newer GTMs
Tapping incremental revenue from
available opportunities
Foraying into newer product categories &
businesses
TARGET3 year
RevenueCAGR of 10%
yoy
35

Margin Growth Vectors
Product Mix
Geography Mix
Business Mix
Driving Efficiency
Driving Hygiene
Enabling higher mix of
HIGH MARGIN productsFocus on
INDIA as a growth
market
Foray into SERVICES
Optimization of OPERATING
EXPENSES
Improvement in WORKING CAPITAL
utilization
Improved Margin
Trajectory
Improved WC turns
Improved ROCE
TARGETROCE of
16-18% by FY21
36

Capital Allocation Priorities
Returns to Shareholders1
Investments into business
Strategic M&As for ProConnect3
Investments into the business 2
NO FPO MADE
AA/A1+ Creditrating
Debt Equity
Ratio at 0.1
Dividend payout @ 20% of Profits
Investments of ~Rs.150 crs spread
until FY21
Investments of ~Rs.150 crs spread
until FY21
37

Redington Foundation
Foundation for CSR @ Redington (Redington Foundation), a trust formed by Redington (India) Limited to
implement various CSR activities towards the betterment of the society
38

39
Compliance OfficerM. MuthukumarasamyRedington (India) LimitedSPL Guindy House, 95 Mount Road,Guindy, Chennai 600 032https://www.redingtongroup.com
CIN - L52599TN1961PLC028758
Investor Contact
Sowmiya MManager – Investor [email protected]
IR Materials - https://redingtongroup.com/india/financials-and-reports/
CONTACT US

THANK YOU
Related Documents