144 CORPORATE GOVERNANCE © 2007 The Authors Journal compilation © 2007 Blackwell Publishing Ltd, 9600 Garsington Road, Oxford, OX4 2DQ, UK and 350 Main St, Malden, MA, 02148, USA Volume 15 Number 2 March 2007 Blackwell Publishing LtdOxford, UK CORGCorporate Governance: An International Review0964-8410© 2007 The Authors; Journal compilation © 2007 Blackwell Publishing Ltd March 2007152144158ORIGINAL ARTICLES CORPORATE OWNERSHIP STRUCTURE AND FIRM PERFORMANCEKAPOPOULOS & LAZARETOU *Address for correspondence: Risk Management Division, Emporiki Bank, 11 Sophocle- ous Str., 102 35, Athens. Tel: +30210 3284147; E-mail: [email protected] Corporate Ownership Structure and Firm Performance: evidence from Greek firms Panayotis Kapopoulos and Sophia Lazaretou* The Berle-Means thesis (1932 The Modern Corporation and Private Property. New York: Harcourt, Brace and World) implies that diffuse ownership adversely affects firm performance. This paper tries to investigate whether there is strong evidence to support the notion that variations across firms in observed ownership structures result in systematic variations in observed firm performance. We test this hypothesis by assessing the impact of the structure of ownership on corporate performance, measured by profitability, using data for 175 Greek listed firms. Following Demsetz and Villalonga (2001 Ownership Structure and Corporate Performance, Journal of Corporate Finance, 7, 209–233), we model ownership structure, first, as an endogenous variable and, second, we consider two different measures of ownership structure reflecting different groups of shareholders with conflicting interests. Empirical findings suggest that a more concentrated ownership structure positively relates to higher firm profitability. We also find that higher firm profitability requires a less diffused ownership. Keywords: Ownership structure, firm performance Introduction n their ground-breaking study, Berle and Means (1932) warned that the growing dis- persion of ownership of stocks was giving rise to a potentially value-reducing separation of ownership and control. As a consequence, they expected an inverse correlation between the diffuseness of shareholdings and corporate performance. This analytical framework is based upon the view that shareholder diffu- sion makes it difficult for them to act collec- tively and hence to influence management to any great extent. Can the Board of Directors help rescue this situation? In some cases they might not have much influence and they also suffer from the same information problems that shareholders have – that is, management typically has much more information about the company than either board members or shareholders. And as in any principle-agent problem, managers can use their superior information to extract rents, to the detriment of shareholder value. Moreover, large com- I pensation for board service may have actually acted as a disincentive for active management monitoring, given management control over the director appointment and retention pro- cess. Numerous legal reforms have been pro- posed for the development of strengthened board fiduciary duties or the stimulation of effective institutional shareholder activism. This is the theoretical underpinning underly- ing the current move towards equity-based compensation for corporate directors so as to provide them with a powerful personal incen- tive to exercise effective oversight (Bhagat et al., 1999). 1 In this paper we investigate whether there is evidence to support the notion that varia- tions across firms in observed ownership structures result in systematic variations in observed firm performance in the context of a small European capital market. We test this hypothesis by assessing the impact of the structure of ownership on firm performance measured by profitability using data for 175 listed Greek firms in 2000, chosen randomly

Welcome message from author
This document is posted to help you gain knowledge. Please leave a comment to let me know what you think about it! Share it to your friends and learn new things together.
Transcript
144
CORPORATE GOVERNANCE
© 2007 The AuthorsJournal compilation © 2007 Blackwell Publishing Ltd, 9600 Garsington Road,Oxford, OX4 2DQ, UK and 350 Main St, Malden, MA, 02148, USA
Volume 15 Number 2 March 2007
Blackwell Publishing LtdOxford, UK
CORGCorporate Governance: An International Review0964-8410© 2007 The Authors; Journal compilation © 2007 Blackwell Publishing LtdMarch 2007152144158ORIGINAL ARTICLES
CORPORATE OWNERSHIP STRUCTURE AND FIRM PERFORMANCEKAPOPOULOS & LAZARETOU
*Address for correspondence:Risk Management Division,Emporiki Bank, 11 Sophocle-ous Str., 102 35, Athens. Tel:
+
30210 3284147; E-mail:[email protected]
Corporate Ownership Structure and Firm Performance: evidence from Greek firms
Panayotis Kapopoulos and Sophia Lazaretou*
The Berle-Means thesis (1932
The Modern Corporation and Private Property
. New York:Harcourt, Brace and World) implies that diffuse ownership adversely affects firm performance.This paper tries to investigate whether there is strong evidence to support the notion thatvariations across firms in observed ownership structures result in systematic variations inobserved firm performance. We test this hypothesis by assessing the impact of the structureof ownership on corporate performance, measured by profitability, using data for 175 Greeklisted firms. Following Demsetz and Villalonga (2001 Ownership Structure and CorporatePerformance,
Journal of Corporate Finance
, 7, 209–233), we model ownership structure, first,as an endogenous variable and, second, we consider two different measures of ownershipstructure reflecting different groups of shareholders with conflicting interests. Empiricalfindings suggest that a more concentrated ownership structure positively relates to higher firmprofitability. We also find that higher firm profitability requires a less diffused ownership.
Keywords: Ownership structure, firm performance
Introduction
n their ground-breaking study, Berle andMeans (1932) warned that the growing dis-
persion of ownership of stocks was giving riseto a potentially value-reducing separation ofownership and control. As a consequence,they expected an inverse correlation betweenthe diffuseness of shareholdings and corporateperformance. This analytical framework isbased upon the view that shareholder diffu-sion makes it difficult for them to act collec-tively and hence to influence management toany great extent. Can the Board of Directorshelp rescue this situation? In some cases theymight not have much influence and they alsosuffer from the same information problemsthat shareholders have – that is, managementtypically has much more information aboutthe company than either board members orshareholders. And as in any principle-agentproblem, managers can use their superiorinformation to extract rents, to the detrimentof shareholder value. Moreover, large com-
I
pensation for board service may have actuallyacted as a disincentive for active managementmonitoring, given management control overthe director appointment and retention pro-cess. Numerous legal reforms have been pro-posed for the development of strengthenedboard fiduciary duties or the stimulation ofeffective institutional shareholder activism.This is the theoretical underpinning underly-ing the current move towards equity-basedcompensation for corporate directors so as toprovide them with a powerful personal incen-tive to exercise effective oversight (Bhagat
et al
., 1999).
1
In this paper we investigate whether thereis evidence to support the notion that varia-tions across firms in observed ownershipstructures result in systematic variations inobserved firm performance in the context of asmall European capital market. We test thishypothesis by assessing the impact of thestructure of ownership on firm performancemeasured by profitability using data for 175listed Greek firms in 2000, chosen randomly

CORPORATE OWNERSHIP STRUCTURE AND FIRM PERFORMANCE
145
© 2007 The AuthorsJournal compilation © Blackwell Publishing Ltd. 2007
Volume 15 Number 2 March 2007
and covering all sectors. The structure of own-ership of Greek firms has not been studiedextensively, nor has its impact on performancebeen assessed. This paper tries to fill this gap.
2
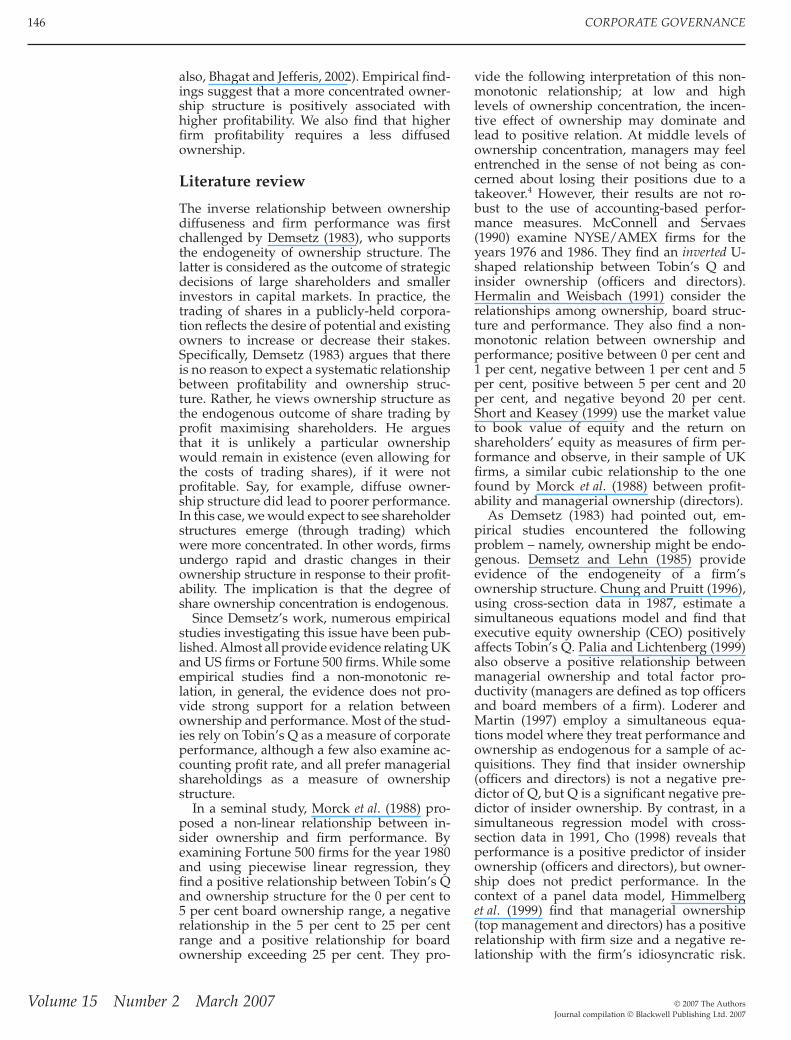
In addition, this paper examines the case ofa small European stock market. Much of theexisting literature applies to economies withAnglo-Saxon types of financial systems (US,UK). The Greek context provides a financialsystem, recently liberalised, that is more bank-based, involving a relatively small stock mar-ket in which the issue of corporate governancedoes not have a long history. From this per-spective, the Greek case provides unique in-formation. The Greek stock market is mostlydominated by family-controlled firms. As iswell known, in so-called “family capitalism”,the agency problem refers to the conflictingrelationship between strong blockholdersand weak minority shareholders (Morck andSteier, 2005). According to the data in La Porta
et al
. (1999), 65 per cent of the 20 largest Greekfirms are controlled by a few wealthy families,while 30 per cent are state-controlled and only5 per cent are widely-held (i.e. they do nothave a controlling shareholder) (see Figure 1).By contrast, in economies with Anglo-Saxontypes of financial systems, the fraction ofshares with no controlling shareholder is veryhigh: 80 per cent and 90 per cent for the top 20US and UK firms, respectively. Moreover, ithas been shown (see CMC, 2001a, 2001b) thatthe Greek listed firms cannot be considered inany case as having a diffused ownership struc-ture. The dispersion of shares is rather low. Inparticular, dispersion is about 36 per centwhen shareholders that own less than 1 per
cent are taken into account. This figure rises to47 per cent when shareholders that own atleast 5 per cent of outstanding shares are takeninto account.
3
These findings imply that fewshareholders control the firm’s management.They also provide evidence that medium- andsmall-sized firms are usually controlled by afamily and there is no separation of ownershipand control.
Demsetz (1983) and Demsetz and Lehn(1985), among others, have documented that,when examining the effect that ownershipstructure has on firm profitability, the endo-geneity of ownership structure should beaccounted for. The work by Demsetz and Vil-lalonga (2001) is motivated by the need to re-examine the relationship between ownershipstructure and firm performance taking intoaccount not only the endogeneity problem butalso different dimensions of ownership struc-tures. In particular, they propose the fractionof shares owned by outside shareholders andby management should be measured sepa-rately because they reflect different groups ofpersons who may have different interests.
Following Demsetz and Villalonga (2001),we apply similar models to Greek-listed firms.This paper seeks to add to the extremelylimited empirical evidence regarding this rela-tionship in the context of a small Europeancapital market. We model ownership struc-ture, first, as an endogenous variable and,second, we examine two different measures ofownership structure: (a) the fraction of sharesowned by insiders (top management, CEO,board members) and (b) the fraction of sharesowned by important outside investors (see,
Note: Fraction of 20 largest firms with different types of controlling shareholders is shown foreach country. A firm is categorised as narrowly-held (either directly or indirectly) if 10 per centof the voting rights associated with shares in that firm are held by one shareholder or a groupof shareholders.Source
:
La Porta
et al.
(1999).
Figure 1: Who owns US, UK and Greek firms?
0% 10% 20% 30% 40% 50% 60% 70% 80% 90% 100%
Greece
US
UK
no controlling shareholder family-controlledstate-controlled widely-held financial widely-held nonfinancial other
146
CORPORATE GOVERNANCE
© 2007 The AuthorsJournal compilation © Blackwell Publishing Ltd. 2007
Volume 15 Number 2 March 2007
also, Bhagat and Jefferis, 2002). Empirical find-ings suggest that a more concentrated owner-ship structure is positively associated withhigher profitability. We also find that higherfirm profitability requires a less diffusedownership.
Literature review
The inverse relationship between ownershipdiffuseness and firm performance was firstchallenged by Demsetz (1983), who supportsthe endogeneity of ownership structure. Thelatter is considered as the outcome of strategicdecisions of large shareholders and smallerinvestors in capital markets. In practice, thetrading of shares in a publicly-held corpora-tion reflects the desire of potential and existingowners to increase or decrease their stakes.Specifically, Demsetz (1983) argues that thereis no reason to expect a systematic relationshipbetween profitability and ownership struc-ture. Rather, he views ownership structure asthe endogenous outcome of share trading byprofit maximising shareholders. He arguesthat it is unlikely a particular ownershipwould remain in existence (even allowing forthe costs of trading shares), if it were notprofitable. Say, for example, diffuse owner-ship structure did lead to poorer performance.In this case, we would expect to see shareholderstructures emerge (through trading) whichwere more concentrated. In other words, firmsundergo rapid and drastic changes in theirownership structure in response to their profit-ability. The implication is that the degree ofshare ownership concentration is endogenous.
Since Demsetz’s work, numerous empiricalstudies investigating this issue have been pub-lished. Almost all provide evidence relating UKand US firms or Fortune 500 firms. While someempirical studies find a non-monotonic re-lation, in general, the evidence does not pro-vide strong support for a relation betweenownership and performance. Most of the stud-ies rely on Tobin’s Q as a measure of corporateperformance, although a few also examine ac-counting profit rate, and all prefer managerialshareholdings as a measure of ownershipstructure.
In a seminal study, Morck
et al
. (1988) pro-posed a non-linear relationship between in-sider ownership and firm performance. Byexamining Fortune 500 firms for the year 1980and using piecewise linear regression, theyfind a positive relationship between Tobin’s Qand ownership structure for the 0 per cent to5 per cent board ownership range, a negativerelationship in the 5 per cent to 25 per centrange and a positive relationship for boardownership exceeding 25 per cent. They pro-
vide the following interpretation of this non-monotonic relationship; at low and highlevels of ownership concentration, the incen-tive effect of ownership may dominate andlead to positive relation. At middle levels ofownership concentration, managers may feelentrenched in the sense of not being as con-cerned about losing their positions due to atakeover.
4
However, their results are not ro-bust to the use of accounting-based perfor-mance measures. McConnell and Servaes(1990) examine NYSE/AMEX firms for theyears 1976 and 1986. They find an
inverted
U-shaped relationship between Tobin’s Q andinsider ownership (officers and directors).Hermalin and Weisbach (1991) consider therelationships among ownership, board struc-ture and performance. They also find a non-monotonic relation between ownership andperformance; positive between 0 per cent and1 per cent, negative between 1 per cent and 5per cent, positive between 5 per cent and 20per cent, and negative beyond 20 per cent.Short and Keasey (1999) use the market valueto book value of equity and the return onshareholders’ equity as measures of firm per-formance and observe, in their sample of UKfirms, a similar cubic relationship to the onefound by Morck
et al
. (1988) between profit-ability and managerial ownership (directors).
As Demsetz (1983) had pointed out, em-pirical studies encountered the followingproblem – namely, ownership might be endo-genous. Demsetz and Lehn (1985) provideevidence of the endogeneity of a firm’sownership structure. Chung and Pruitt (1996),using cross-section data in 1987, estimate asimultaneous equations model and find thatexecutive equity ownership (CEO) positivelyaffects Tobin’s Q. Palia and Lichtenberg (1999)also observe a positive relationship betweenmanagerial ownership and total factor pro-ductivity (managers are defined as top officersand board members of a firm). Loderer andMartin (1997) employ a simultaneous equa-tions model where they treat performance andownership as endogenous for a sample of ac-quisitions. They find that insider ownership(officers and directors) is not a negative pre-dictor of Q, but Q is a significant negative pre-dictor of insider ownership. By contrast, in asimultaneous regression model with cross-section data in 1991, Cho (1998) reveals thatperformance is a positive predictor of insiderownership (officers and directors), but owner-ship does not predict performance. In thecontext of a panel data model, Himmelberg
et al
. (1999) find that managerial ownership(top management and directors) has a positiverelationship with firm size and a negative re-lationship with the firm’s idiosyncratic risk.

CORPORATE OWNERSHIP STRUCTURE AND FIRM PERFORMANCE
147
© 2007 The AuthorsJournal compilation © Blackwell Publishing Ltd. 2007
Volume 15 Number 2 March 2007
Controlling for these variables and firm fixedeffects, they also do not find any relation be-tween ownership and performance. Demsetzand Villalonga (2001) consider both the endo-geneity problem and the different dimensionsof ownership structures. By estimating a 2-equation model for the US firms, they find thatownership is negatively related to debt ratio,unsystematic risk and performance. However,performance (defined as Tobin’s Q or the ac-counting profit rate) is not found to be influ-enced by ownership (defined as managerialownership (CEO, board of directors, top man-agement) or ownership by the five largestshareholders). Welch (2003) applies the Dem-setz and Villalonga (2001) model to Australianlisted firms. Using a single equation model,she also considers a generalised non-linearmodel specification for the equation of firmperformance similar to that used by Morck
et al
. (1988). She finds limited evidence of anon-linear relationship between managerialshare ownership and firm performance. Morerecently, Villalonga and Amit (2004) examinethe impact of family ownership, control andmanagement on firm value. They concludethat family ownership creates value only
when it is combined with certain forms of con-trol and management. Finally, in a study ofTaiwan’s electronics industry, Sheu and Yang(2005) find that insider ownership (executives,board members and large shareholders) hasno influence on total factor productivity.
Corporate ownership structure and firm performance: data and sample selection
Inspection of ownership data reveals that theconcentration of equity ownership in 175Greek listed firms varies widely. Two meas-ures of the structure of corporate ownershipare used: the fraction of shares (voting rights)owned by a firm’s shareholders, each of whomowns at least 5 per cent of outstanding shares(important SH), and the fraction of sharesowned by a firm’s management (board mem-bers, CEO, top management), each of whomowns at least 5 per cent of outstanding shares(managerial SH).
5
Table 1 lists the frequencydistribution of these measures of corporateownership. We note that important SH rangesfrom 0 per cent to 95.7 per cent around a mean
Table 1: (a) Frequency distribution of measures of corporate structure (175 listed firms)
Range (%shares)
Important SH Managerial SH
Frequency(no firms)
Percentage Cumulativepercentage
Frequency(no firms)
Percentage Cumulativepercentage
0–9.9 8 4.57 4.57 68 38.86 38.8610–19.9 1 0.57 5.14 6 3.43 42.2920–29.9 5 2.86 8.00 12 6.86 49.1430–39.9 11 6.29 14.29 12 6.86 56.0040–49.9 19 10.86 25.14 22 12.57 68.5750–59.9 44 25.14 50.29 16 9.14 77.7160–69.9 26 14.86 65.14 13 7.43 85.1470–79.9 36 20.57 85.71 16 9.14 94.2980–89.9 23 13.14 98.86 10 5.71 100.0090–100 2 1.14 100.00 – – –
Table 1: (b) Summary statistics (in per cent)
Variable N Mean Standarddeviation
Maximum Minimum
Important SH 175 59.054 20.382 95.660 0.000Managerial SH 175 32.218 29.308 86.800 0.000
Note: N is the number of observations. Important SH is the fraction of shares owned by a firm’s importantoutside investors. Managerial SH is the fraction of shares owned by a firm’s management.

148
CORPORATE GOVERNANCE
© 2007 The AuthorsJournal compilation © Blackwell Publishing Ltd. 2007
Volume 15 Number 2 March 2007
of 59.0 per cent; managerial SH ranges from 0per cent to 86.8 per cent around a mean of 32.2per cent. Simple inspection of the data alsoreveals that the fraction of shares owned byimportant shareholders equals or exceeds 30per cent in 161 firms (92 per cent) of the 175firms included in our sample. The fraction ofshares owned by management is less than 30per cent for 85 firms of the 175 firm sampleused (49 per cent of the firms) and it is lessthan or equal to 10 per cent in 70 firms.
In the regression analysis, we rely both onthe percentage of shares owned by importantoutside investors and the percentage of sharesowned by management. The distributions ofthese two variables are skewed. The coeffi-cient of skewness is positive, implying thatthe distribution has a long right tail. To obtaina symmetric distribution, the raw data areconverted to log values using the logistictransformation, i.e. log[percentage owner-ship/(100-percentage ownership)].
6
In our sample, the correlation between thetwo measures of ownership concentration is0.54. This positive value indicates that manyof the important shareholders are also definedas management shareholders since they haverepresentation on corporate boards. The inter-ests of these board members are unlikely to bethe same as those of, what they call, “profes-sional managers”, but instead, are more likelyto coincide with other shareholders. This hasthe implication, as Demsetz and Villalonga(2001) point out, that management ownershipis not a reliable measure of the strength ofprofessional management in the firm’s oper-ations because it combines groups of indivi-duals (both true managers and boarddirectors), both of whom may have differentinterests. Moreover, even though the correla-tion is positive, it is not sufficiently high tolead to the conclusion that one of the measuresis redundant. This suggests that professionalmanagement does not hold enough shares sothat it is in a position to ignore importantshareholders. An inspection of the raw datareveals that, for less than 30 per cent of thetotal firms in our study, the fraction of sharesowned by important shareholders is exactlythe same as the fraction of shares owned bymanagement. This is explained by the fact thatin these firms the family that owns a largefraction of the firm’s shares is also present onthe corporate board. But, as Table 1 shows, itis less likely for professional managers to holda large fraction of shares. In an attempt to takea more accurate picture of the ownership–performance relation, in the empirical analysiswe use both measures.
In the empirical studies of ownership–performance relationships, two measures of
firm performance are typically used. Theaccounting profit rate was used in the Dem-setz and Lehn study (1985), while Tobin’s Qwas used in most of the studies that followed(see, for example, Morck
et al
., 1988; Cho, 1998;Loderer and Martin, 1997; Hermalin and Weis-bach, 1988; McConnell and Servaes, 1990;Demsetz and Villalonga, 2001). Tobin’s Q isdefined as the firm’s market value divided byits assets, valued either at book or replacementvalue (Shepherd, 1990). The Q ratio is used asa proxy for the market valuation of the firm’sassets. The accounting profit rate is measuredas the ratio of net income (after taxes) to thebook value of equity. It is an estimate of whatmanagement has accomplished.
There are two major differences betweenthese two measures of performance. Briefly,we note that the first difference relates to thetime perspective. Tobin’s Q, based on inves-tors’ evaluations of the likely future profit-ability of the firm, is forward looking,whereas the profit rate is backward looking.Thus, a high Q ratio indicates success in thesense that the firm has deployed its invest-ment to build up a company that is nowvalued more in the market than its bookvalue. The second difference concerns acco-unting problems in measuring performance.The profit rate is measured by the accountant,“constrained by standards set by his profes-sion” and, therefore, it is affected by account-ing practices, such as the different methodsapplied to assess tangible and intangibleassets. Different methods of depreciation canalso influence (raise or lower) the recordedprofit levels. In contrast, Tobin’s Q is meas-ured by investors and, thus, it is affected bytheir psychology, concerning estimates offuture events (herd behaviour, mistakes,manipulations, etc.).
7
Tobin’s Q also suffers, like accountingprofitability, from accounting artefact prob-lems for several reasons. First, as the ratio ofthe firm’s market value to the replacement costof tangible capital approximates Q, it doesnot reflect the value investors assign to a firm’sintangible capital nor does it include invest-ments made in intangible assets. As Lindbergand Ross (1981) point out, Tobin’s Q is highwhen the firm has valuable intangible assetsin addition to tangible ones. Second, empiricalstudies in the area of the impact of ownershipstructure on profitability that use Tobin’s Q donot measure the replacement cost of tangiblecapital. Instead, they use as a proxy the bookvalue of total assets. Book values generallyhave serious problems of their own caused byinflation and arbitrary depreciation choices.Moreover, replacement costs are very difficultto appraise.
8

CORPORATE OWNERSHIP STRUCTURE AND FIRM PERFORMANCE
149
© 2007 The AuthorsJournal compilation © Blackwell Publishing Ltd. 2007
Volume 15 Number 2 March 2007
Model specification
We are interested in examining the relation-ship between the variation in ownershipvariables and firm profitability. To this end,we choose a random sample of 175 Greeklisted firms. The firm sample covers all sec-tors of the Greek economy and the datarefers to the year 2000. The sample includesutilities and financial institutions, which arepart of the broader Greek public sector. Thus,a sub-sample excluding these firms is alsoexamined.
The main objective is to discover if impor-tant SH and managerial SH are systematicallyrelated to firm performance. For this purpose,both variables appear as explanatory variablesin the firm performance equation. However, aswe have already noted, firm performance isnot only determined by ownership structuresbut also may influence ownership structures.To deal with this issue, the econometric modelis a simultaneous system of two equations, inwhich firm performance is the dependent vari-able in the first equation and ownership struc-ture is the dependent variable in the secondequation. It is estimated by ordinary leastsquares and two-stages least squares to detectwhether different methods of estimation mayaffect the results.
Specifically, the estimated equations are asfollows:
(1)
(2)
where SH
i
is a measure of corporate owner-ship structure for the ith firm, X
i
and Z
i
arecontrol variables and u
i1
and u
i2
are errorterms.
Concerning equation (1), we estimate itusing both alternate measures of performance,namely Tobin’s Q and the accounting profitrate. We approximate Tobin’s Q taking theratio of the firm’s market value plus the bookvalue of its debt to the book value of totalassets.
9
The set of explanatory variables in-cludes both ownership variables, importantSH and managerial SH, and we seek to exam-ine whether ownership structures significantlyaffect profitability.
Previous empirical work includes addi-tional variables in the regressions to controlfor the possibility that factors other thanownership structure may have an impact onTobin’s Q. Control variables include distribu-tion expenses as a fraction of sales revenues,debt to book value of total assets (leverage)and the market concentration ratio. Distribu-
Firm performanceconstant SH X u
i
1 i1 i i1 i i1= + + +a bSH constant Firm performance
Z ui 2 i2 i
i i2
= ++ +
ab i2
tion expenses are used to explain differencesin measurements of Tobin’s Q that are causedby accounting artefacts. Accounting practicesdo not treat intangible and tangible capitalsimilarly. As noted, performance measure ofTobin’s Q may be distorted because its de-nominator (i.e. the replacement cost of tangi-ble capital or the book value of total assets)does not take into account the value of intan-gible assets.
10
Leverage is included in the setof explanatory variables to capture the “valueenhancing or value reducing effects of the dif-ferences that might exist between the interestobligations incurred when borrowing tookplace . . .” (Demsetz and Villalonga, 2001, p.221). In inflationary periods, debt sold in anearlier period will be paid back in money of alesser value; in deflation, it will be paid backin money with a higher value. Two indica-tors of market concentration are alternativelyused: the top four firm concentration ratio(CR4) and a Herfindahl measure of marketstructure (Hindex). CR4 is the sum of the fourlargest shares in the market, while Hindex isthe sum of squared market shares of all firmsin the market. Concentration indicators areused to account for the cross-firm variationsin Tobin’s Q of the profit rate that are due tocross-firm differences in pricing power. Firmsthat are more efficient and more aggressive inpricing have greater market shares. The usualfinding in the industrial organisation litera-ture is that market structure positively relatesto firm performance. Finally, dummy vari-ables U, F and Media
11
are also included forutilities and financial institutions, and mediaindustries. U and F dummies control for theeffect of “systematic regulation”, while Mediacontrols for the “amenity potential of thefirms”.
Regarding equation (2), the dependent vari-able is managerial shareholdings. Firm per-formance measures, either Tobin’s Q or theaccounting profit rate, appear as an explana-tory variable so as to examine the possibilityof reverse causation in the ownership–profitability relationship. Firm size as mea-sured by the book value of total assets andleverage appear in the set of control variablesin equation (2). Firm size enters to capture theeffect of the “value-maximising size of thefirm”. The larger the size of the firm,
ceterisparibus
, the larger its capital resources and thegreater the market value of a given fraction ofshares. In other words, larger firm sizerequires more investment from a shareholderand, thus, implies a more diffuse ownershipstructure. Including leverage as an indepen-dent variable reflects the notion that manage-ment chooses not to hold as many shares ifcreditors may add to the monitoring manage-

150
CORPORATE GOVERNANCE
© 2007 The AuthorsJournal compilation © Blackwell Publishing Ltd. 2007
Volume 15 Number 2 March 2007
ment of the firm. Thus, high values of thedebt-to-assets ratio should be associated withlower fractions of shares owned by largeshareholders and, thus, the more diffused theownership structure of the firm. Finally, as inequation (1), the dummy variables U, F andMedia are included in the right-hand side ofthe equation.
Table 2 reports the mean values, standarddeviations, maxima and minima of the vari-ables in the 175-firm sample. Variable defini-tions and data sources are provided in a DataAppendix at the end of the paper.
Empirical results
The Berle-Means (1932) thesis implies that dif-fuse ownership adversely affects firm perfor-mance. We test this hypothesis by assessingthe impact of the structure of ownership onprofitability, taking into account the endo-geneity of ownership structure and modellingseparately inside and outside ownership.Table 3 presents the results from the modelestimation using Tobin’s Q as a firm perfor-mance measure when managerial ownershipis taken into account. It uses the total samplesize (175 firms) and compares OLS estimatesto 2SLS estimates. Table 4 uses the smaller firmsample size (163 firms) excluding utilities andfinancial institutions. Focusing on OLS esti-mates for the profitability equation, we notethat profitability is always statistically depen-dent on at least one measure of ownershipstructure. The regression coefficient of thefraction of shares owned by important outsideinvestors takes a positive sign and is statisti-cally significant. This implies that outside in-
vestor shareholdings affect Tobin’s Q ratiopositively. This finding is consistent with whatone would expect: greater ownership concen-tration by outside investors may lead tosuperior performance. The second measure ofownership concentration, namely the fractionof shares owned by management, also has apositive effect on performance, although thecoefficient is statistically significant at muchlower levels of significance (10 per cent or 15per cent). This result is consistent with thefinding that the simple correlation coefficientbetween the two ownership variables is 0.54.Moreover, the results shown in the tables forthe 2SLS estimates confirm the finding for theeffect of ownership concentration on profit-ability. The coefficients of both ownershipvariables, important SH and managerial SH,have the correct positive sign and are statis-tically significant either at a much higher (1per cent) or a lower (10 per cent) level ofsignificance.
Another finding shown in Tables 3 and 4 isthe negative effect of the debt-to-assets ratioon profitability. In all OLS and 2SLS esti-mates, leverage negatively affects profitability.The distribution-to-sales ratio is positive, asexpected, but strongly insignificant. Marketconcentration consistently has a positive effecton profitability. The coefficient of the CR4 con-centration index takes a positive sign and issometimes statistically significant at the 10per cent level or better. However, when weadopt a Herfindahl indicator, our data do notsupport this finding.
12
The coefficient, eventhough it has the correct sign, is everywhereinsignificant. The picture is reversed when weestimate equation (1) with 2SLS. Nevertheless,the data do not seem to support the usual
Table 2: Descriptive statistics
Variable N Mean Standard deviation Maximum Minimum
Q 175 2.184 2.459 24.555 0.161Important SH 175 1.025 0.546 3.137 0.000Managerial SH 175 0.517 0.557 2.025 0.000Prate 175 0.060 0.317 0.712
−
3.837Debt 175 0.058 0.108 0.538 0.000Firm size 175 865.2 4,300.7 43,307.6 5.500Distr 175 0.097 0.099 0.554 0.000CR4 175 0.390 0.207 0.978 0.102Hindex 175 0.080 0.111 0.566 0.005
Note: Q is Tobin’s Q, important SH is the fraction of shares owned by important shareholders convertedto log values, managerial SH is the fraction of shares owned by management converted to log values, prateis accounting profit rate, firm size is total assets (in millions euro), debt is debt-to-assets ratio, distr isdistribution-to-sales ratio, CR4 and Hindex are two alternative definitions of industry concentration. N isthe number of firms. Variables’ definitions and data sources are provided in the Appendix.
CORPORATE OWNERSHIP STRUCTURE AND FIRM PERFORMANCE
151
© 2007 The AuthorsJournal compilation © Blackwell Publishing Ltd. 2007
Volume 15 Number 2 March 2007
Table 3: Estimates of ownership–performance relationship, full 175 firm sample size
Explanatoryvariables
OLS-estimates 2SLS-estimates
Q (eq. 1) Managerialshareholdings
(eq. 2)
Q (eq. 1) Managerialshareholdings
(eq. 2)
Constant 0.174 (0.318) 0.440 (6.969) 0.374 (0.640) 0.212 (0.831)Important
shareholdings1.372 (3.586) 1.398 (3.639)
Managerialshareholdings
0.297 (1.755) 0.258 (1.899)
Distr 1.769 (1.002) 1.598 (0.899)Debt
−
3.245 (
−
1.962)
−
0.147 (
−
0.387)
−
3.051 (
−
1.826) 0.041 (0.082)CR4 1.521 (1.603) 1.007 (0.918)Q 0.045 (2.680) 0.134 (1.329)Firm size
−
0.00002 (
−
0.148)
−
0.00003 (
−
1.092)Media
−
0.643 (
−
0.767) 0.373 (2.045)
−
0.524 (
−
0.615) 0.347 (1.726)F
−
1.371 (
−
1.762)
−
0.437 (
−
1.971)
−
1.307 (
−
1.668) 0.097 (0.244)U
−
1.342 (
−
0.801)
−
0.456 (
−
1.200)
−
1.184 (
−
0.701)
−
0.243 (
−
0.573)SE 2.284 0.528Adj-R
2
0.177 0.131
Notes: Ordinary Least Squares and Two-Stages Least Squares estimation of Ownership–performancerelationship. t-statistics are in parentheses. SE is the standard error of the estimate.
Table 4: Estimates of ownership–performance relationship, 163 firm sample size (excluding utilities andfinancial services)
Explanatoryvariables
OLS-estimates 2SLS-estimates
Q (eq. 1) Managerialshareholdings
(eq. 2)
Q (eq. 1) Managerialshareholdings
(eq. 2)
Constant 0.064 (0.113) 0.491 (7.366) 0.303 (0.500) 0.236 (0.887)Important
shareholdings1.563 (3.701) 1.602 (3.772)
Managerialshareholdings
0.179 (1.806) 0.116 (1.768)
Distr 2.226 (1.190) 2.052 (1.089)Debt
−
3.669 (
−
2.105) 0.067 (0.167)
−
3.448 (
−
1.961) 0.120 (0.234)CR4 1.409 (1.438) 0.772 (0.684)Q 0.041 (2.429) 0.138 (1.360)Firm size
−
0.00003 (
−
2.691)
−
0.00002 (
−
1.566)Media
−
0.687 (
−
0.798) 0.367 (1.998)
−
0.539 (
−
0.616) 0.336 (1.662)SE 2.343 0.533Adj-R
2
0.161 0.112
Notes: Ordinary Least Squares and Two-Stages Least Squares estimation of Ownership–performancerelationship. t-statistics are in parentheses. SE is the standard error of the estimate.
152
CORPORATE GOVERNANCE
© 2007 The AuthorsJournal compilation © Blackwell Publishing Ltd. 2007
Volume 15 Number 2 March 2007
finding of industrial organisation studiesthat profitability is partly driven by industryconcentration.
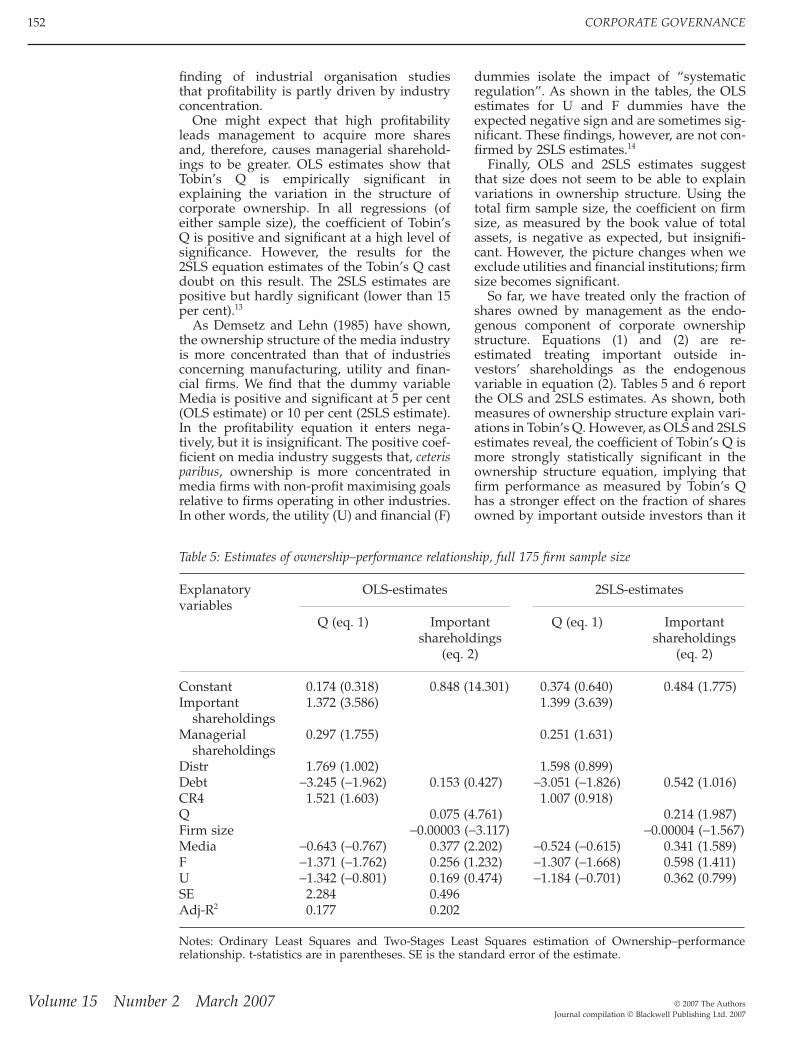
One might expect that high profitabilityleads management to acquire more sharesand, therefore, causes managerial sharehold-ings to be greater. OLS estimates show thatTobin’s Q is empirically significant inexplaining the variation in the structure ofcorporate ownership. In all regressions (ofeither sample size), the coefficient of Tobin’sQ is positive and significant at a high level ofsignificance. However, the results for the2SLS equation estimates of the Tobin’s Q castdoubt on this result. The 2SLS estimates arepositive but hardly significant (lower than 15per cent).
13
As Demsetz and Lehn (1985) have shown,the ownership structure of the media industryis more concentrated than that of industriesconcerning manufacturing, utility and finan-cial firms. We find that the dummy variableMedia is positive and significant at 5 per cent(OLS estimate) or 10 per cent (2SLS estimate).In the profitability equation it enters nega-tively, but it is insignificant. The positive coef-ficient on media industry suggests that,
ceterisparibus
, ownership is more concentrated inmedia firms with non-profit maximising goalsrelative to firms operating in other industries.In other words, the utility (U) and financial (F)
dummies isolate the impact of “systematicregulation”. As shown in the tables, the OLSestimates for U and F dummies have theexpected negative sign and are sometimes sig-nificant. These findings, however, are not con-firmed by 2SLS estimates.
14
Finally, OLS and 2SLS estimates suggestthat size does not seem to be able to explainvariations in ownership structure. Using thetotal firm sample size, the coefficient on firmsize, as measured by the book value of totalassets, is negative as expected, but insignifi-cant. However, the picture changes when weexclude utilities and financial institutions; firmsize becomes significant.
So far, we have treated only the fraction ofshares owned by management as the endo-genous component of corporate ownershipstructure. Equations (1) and (2) are re-estimated treating important outside in-vestors’ shareholdings as the endogenousvariable in equation (2). Tables 5 and 6 reportthe OLS and 2SLS estimates. As shown, bothmeasures of ownership structure explain vari-ations in Tobin’s Q. However, as OLS and 2SLSestimates reveal, the coefficient of Tobin’s Q ismore strongly statistically significant in theownership structure equation, implying thatfirm performance as measured by Tobin’s Qhas a stronger effect on the fraction of sharesowned by important outside investors than it
Table 5: Estimates of ownership–performance relationship, full 175 firm sample size
Explanatoryvariables
OLS-estimates 2SLS-estimates
Q (eq. 1) Importantshareholdings
(eq. 2)
Q (eq. 1) Importantshareholdings
(eq. 2)
Constant 0.174 (0.318) 0.848 (14.301) 0.374 (0.640) 0.484 (1.775)Important
shareholdings1.372 (3.586) 1.399 (3.639)
Managerialshareholdings
0.297 (1.755) 0.251 (1.631)
Distr 1.769 (1.002) 1.598 (0.899)Debt
−
3.245 (
−
1.962) 0.153 (0.427)
−
3.051 (
−
1.826) 0.542 (1.016)CR4 1.521 (1.603) 1.007 (0.918)Q 0.075 (4.761) 0.214 (1.987)Firm size
−
0.00003 (−3.117) −0.00004 (−1.567)Media −0.643 (−0.767) 0.377 (2.202) −0.524 (−0.615) 0.341 (1.589)F −1.371 (−1.762) 0.256 (1.232) −1.307 (−1.668) 0.598 (1.411)U −1.342 (−0.801) 0.169 (0.474) −1.184 (−0.701) 0.362 (0.799)SE 2.284 0.496Adj-R2 0.177 0.202
Notes: Ordinary Least Squares and Two-Stages Least Squares estimation of Ownership–performancerelationship. t-statistics are in parentheses. SE is the standard error of the estimate.
CORPORATE OWNERSHIP STRUCTURE AND FIRM PERFORMANCE 153
© 2007 The AuthorsJournal compilation © Blackwell Publishing Ltd. 2007
Volume 15 Number 2 March 2007
does on managerial shareholdings. Therefore,as the findings suggest, important SH is likelyto be more strongly endogenous.
The low value of the simple correlationcoefficient between Tobin’s Q and the account-ing profit rate (0.157) suggests that we cannotconsider the two measures of performance tobe redundant. Therefore, we can re-estimateequations (1) and (2) using the accounting rateof return as an alternative measure of firm per-formance in place of Tobin’s Q.15 We note thatthe coefficients that link ownership variablesto firm profitability are weaker compared withthe estimates obtained using Tobin’s Q.Specifically, important shareholdings con-tinue to have a positive and significant(although at a lower than 10 per cent level)effect on profit rate, whereas managerialshareholdings are everywhere insignificant.Moreover, in all estimates of the ownershipstructure equation (of either sample size), theprofit rate positively and significantly affectsmanagerial shareholdings. Overall, the resultsprovide no reason to alter considerably theconclusions we reach concerning the owner-ship–performance relationship.
Conclusions
This paper brings together various aspects ofcorporate finance and firm performance and
examines whether variations across firms inobserved ownership structures result in sys-tematic variations in observed firm perfor-mance in the context of a small Europeancapital market. We test this hypothesis byassessing the impact of the structure of own-ership on performance using data for 175Greek listed firms. We use two measures ofperformance – namely, Tobin’s Q and theaccounting profit rate – and consider twomeasures of ownership – namely, the fractionof shares owned by management and the frac-tion of shares owned by important investors.The paper is primarily motivated by a lack ofevidence regarding the relationship betweenownership structure and firm performancein Greek firms. Moreover, ownership ismodelled as multi-dimensional and endoge-nously determined.
Empirical findings indicate that there existsa linear positive relationship between profit-ability and ownership structure. Both meas-ures of ownership, managerial shareholdingsand important shareholdings, positively influ-ence Tobin’s Q. The results suggest that thegreater the degree to which shares are concen-trated in the hands of outside or inside share-holders, the more effectively managementbehaviour is monitored and disciplined, thusresulting in better performance.
The results from our study also yield evi-dence for the endogeneity of ownership struc-
Table 6: Estimates of ownership–performance relationship, 163 firm sample size (excluding utilities andfinancial services)
Explanatoryvariables
OLS-estimates 2SLS-estimates
Q (eq. 1) Importantshareholdings
(eq. 2)
Q (eq. 1) Importantshareholdings
(eq. 2)
Constant 0.064 (0.113) 0.858 (13.797) 0.303 (0.500) 0.494 (1.783)Important
shareholdings1.562 (3.701) 1.602 (3.772)
Managerialshareholdings
0.179 (1.806) 0.116 (1.677)
Distr 2.226 (1.190) 2.052 (1.089)Debt −3.669 (−2.105) 0.334 (0.894) −3.448 (−1.961) 0.612 (1.144)CR4 1.409 (1.438) 0.772 (0.684)Q 0.073 (4.634) 0.206 (1.946)Firm size −0.00001 (−1.197) −0.00001 (−0.785)Media −0.687 (−0.798) 0.382 (2.226) −0.539 (−0.616) 0.351 (1.661)SE 2.343 0.496Adj-R2 0.161 0.159
Notes: Ordinary Least Squares and Two-Stages Least Squares estimation of Ownership–performancerelationship. t-statistics are in parentheses. SE is the standard error of the estimate.
154 CORPORATE GOVERNANCE
© 2007 The AuthorsJournal compilation © Blackwell Publishing Ltd. 2007
Volume 15 Number 2 March 2007
ture. We find that profitability is a positivepredictor of ownership structure measures,suggesting that the coefficient of a single equa-tion model on the ownership–profitabilityrelationship is biased because of its failure totake into account the complexity of interestsinvolved in an ownership structure. On theone side, Greek data reveal a significant posi-tive impact of ownership structure on profit-ability. On the other side, there exists evidencethat superior firm performance leads to anincrease in the value of stock options ownedby management or large shareholders, whichif exercised, would increase their shareownership.
We also find that profitability is negativelyrelated to the debt-to-assets ratio. This evi-dence reveals the existence of reducing effectsof the differences between the interest obliga-tions incurred when borrowing took place andthe interest rates that prevailed during thesample period. The statistical insignificanceof the relationship between profitability anddistribution-to-sales ratio indicates that ourmodel fails to explain differences in measure-ments of Tobin’s Q that are caused by account-ing artefacts. Lastly, we find that profitabilityis positively related to market concentration(measured by CR4 concentration ratio). Thiscan be considered either as the result of scaleeconomies in most of the sectors of our sampleor as a consequence of the fact that larger firmsin markets with oligopoly structure are able toexercise market power. However, when weuse the Herfindahl index as a proxy for thedegree of concentration, we cannot detect astrongly significant relationship with firmperformance.
A striking evidence of our empirical analy-sis is the significant positive relationshipfound between media dummy and ownershipstructure. This result, in conjunction with thefinding that the media dummy enters nega-tively the profitability equation (even thoughit is insignificant), means that firms in themedia industry with high “amenity potential”could not be used to produce these non-profitamenities if they were more diffused. Thisresult might explain the recent attempts of theGreek government to reform the corporategovernance legislation so as to forbid concen-tration of a share above 1 per cent in the handsof the same shareholder. This legal reformaims at excluding chiefly those that undertakethe construction of public works from a strictmanagement control of media firms so as toreduce corruption incentives.
A caveat is in order. As we have alreadymentioned, the Athens Stock Exchange re-ports only the percentage of shares that iseither equal or larger than 5 per cent of out-
standing shares. According to the current in-stitutional framework, firms do not have thelegal obligation to announce changes in vot-ing rights for those owners with a share be-low 5 per cent. Consequently, the lack of datafor equity owners with a share below 5 percent imposes a constraint on our empiricalanalysis. It causes a discontinuity in the ob-servations used in the construction of theownership structure variable. A more rigor-ous definition of that variable would take intoaccount the fraction of shares owned by afirm’s shareholders or management, each ofwhom owns at least 1 per cent of outstandingshares.
Suggestions for further research include thedevelopment and estimation of a generalisednon-linear model specification. Some authors(Morck et al., 1988; Welch, 2003) have esti-mated the relationship between managerialshare ownership and profitability in the con-text of a non-linear single equation model.However, they do not control for the possibleendogeneity of a firm’s ownership structure. Itmight be interesting to address the issue of anon-monotonic relationship by developing anon-linear equation model taking into accountboth endogeneity and non-linearity. Further,the data sample used in this study covers arelatively large number of Greek listed firmsfor the year 2000. One would expect to calcu-late the variables for a longer period of two orfive years so as to avoid the impact of thebusiness cycle. Data availability is a seriousconstraint in our analysis. The Athens StockExchange started to publish information con-cerning the changes in voting rights only from2000. Therefore, it might be informative toreplicate the estimates using panel data forsome years after 2000. In this case, however,the firm sample would change and the resultsmight not be comparable.16 Also, firm cover-age would be limited, since we require a min-imum of a three-year presence for each firm inthe sample.
Acknowledgements
An earlier version of the paper has greatlybenefited from the valuable comments andsuggestions of two anonymous referees. Weare indebted to Heather Gibson and GeorgeTavlas for useful comments made on an earlierversion of the paper. Thanks should be ex-pressed to Themis Antoniou for his valuableinformation on a part of the data. We wouldlike also to thank the Division of BankingSupervision of the Bank of Greece for kindlyproviding the data for distribution expensesfor the banking industry. Needless to say, the
CORPORATE OWNERSHIP STRUCTURE AND FIRM PERFORMANCE 155
© 2007 The AuthorsJournal compilation © Blackwell Publishing Ltd. 2007
Volume 15 Number 2 March 2007
views expressed here are those of the authorsand do not necessarily represent those of theEmporiki Bank or the Bank of Greece, whileany remaining errors are solely the authors’responsibility.
Notes
1. Although the recent reforms arrangedunder the landmark Sarbanes-Oxley Actimpose tougher auditing standards, opin-ion polls among the institutional investorsand outside directors reveal that they pre-fer companies to move towards separatingthe roles of the CEO and the chairman ofthe Board (Felton, 2004).
2. Recently, Karathanassis and Drakos (2004)examined whether corporate performanceis affected by ownership structure usingdata for Greek listed firms. They find nosupport for a relationship between cor-porate value and insiders’ ownership.However, their sample includes relativelyfew firms (59) and they do not take intoaccount the possible endogeneity of bothownership as well as performance.
3. The most diffused firms are financial ser-vices companies (49.9 per cent), construc-tion companies (48.3 per cent) and healthservices companies (39.1 per cent). Theless diffused firms are the media sector(14.5 per cent) and public sector compa-nies (19.2 per cent). Dispersion is meas-ured as the percentage of shares owned byshareholders that hold stakes less than 1and at least 5 per cent respectively.
4. Firms with lower levels of shareholderconcentration are more vulnerable to take-overs and hence managers have a strongincentive to maximize shareholders valuein order to protect against takeover –which can lead to job losses. At middlelevels of management, it is a lack of con-cern about possible job losses or it is asso-ciated with the fact that any takeoverwould be unlikely to succeed.
5. The Athens Stock Exchange reports onlythe percentage of shares that is eitherequal to, or larger than, 5 per cent of out-standing shares. To calculate managerialSH, we examine companies’ annual re-ports that provide information about thepotential interdependencies and inter-relations among shareholders.
6. In the estimation procedure, we use bothtransformed and non-transformed vari-ables of ownership. The empirical resultsseem to be unaffected by the transforma-tion and, therefore, the general nature ofthe paper’s conclusions does not change.
7. For an analytical discussion of the aspectsin which these two measures of firm per-formance differ and their advantages anddisadvantages, see Smirlock et al. (1984)and Shepherd (1986).
8. According to the Lindberg and Rossmodel (1981) replacement cost can bemeasured by using a perpetual inventorymethod and making sensible adjustmentsfor capital goods price inflation, the de-preciation rate and technological pro-gress. See also Dickerson et al. (2002) for acalculation of the replacement cost forthe UK companies in manufacturing.
9. In our analysis, we do not follow Lindbergand Ross (1981) method to calculate thereplacement cost of tangible capital, sinceit would require time-series data on indi-vidual firms which we do not have.
10. Observable measures of these intangibleassets include R & D expenditures, land,building and equipment expenditures oreven distribution expenses. In our data set,distribution expenses cover mainly adver-tising and marketing expenses. However,data for capital and R & D expendituresdo not exist for most of the firms in oursample.
11. The variable U takes the value 1 if a firmis a utility and zero elsewhere; F takes thevalue 1 if a firm is a financial institution;Media takes the value 1 if a firm is a mediaindustry.
12. The results obtained using the Herfindahlindex are available from the authors uponrequest.
13. Before using any method to deal withendogeneity, we first test for the endo-geneity of the ownership structure andfirm performance by carrying out theDurbin-Wu-Hausman test (see Hausman,1978). It is based upon a direct comparisonof coefficient values and is carried out byrunning an auxiliary regression (see alsoDavidson and Mackinnon, 1993). It is anasymptotic t-test with the null hypothesisof no endogeneity. The t-values foundreject the null hypothesis.
14. The utilities dummy variable used refersto the public sector companies. Therefore,the findings concerning U dummy couldprovide useful policy implementationresults, especially in the light of the on-going debate in the Greek economyabout the performance and efficiency ofstated-owned companies.
15. The results obtained using the accountingrate of return are available from theauthors upon request.
16. Balance-sheet data are now available until2003. In the period 2001–2003, many firms
156 CORPORATE GOVERNANCE
© 2007 The AuthorsJournal compilation © Blackwell Publishing Ltd. 2007
Volume 15 Number 2 March 2007
became new members of the Athens StockExchange Market.
Data Appendix
We use the standard industry classification fol-lowed by the Athens Stock Exchange Market.Firms are selected from all sectors of the Greekeconomy. These are: Banks (5 firms), Insurance(3 firms), Leasing Companies (2 firms), Infor-mation Technology (10 firms), Telecommuni-cations (3 firms), Oil Refineries (1 firm), WaterSupply (1 firm), Passenger Shipping (3 firms),Shipyards (1 firm), Publishing and Printing (7firms), Television and Entertainment (2 firms),Health (3 firms), Metals (9 firms), Metal Prod-ucts (7 firms), Machinery and Appliances (2firms), Cables (1 firms), Electronic Equipment(1 firm), Industrial Minerals (7 firms), Whole-sale Trade (21 firms), I.T. Equipment (5 firms),Retail Trade (7 firms), Mobile Telephony RetailServices (1 firm), Food (13 firms), Tobacco(1 firm), Restaurants (3 firms), Textiles (10firms), Clothing (3 firms), Real Estate (3 firms),Construction (15 firms), Chemicals (2 firms),Plastics and Rubber (5 firms), Paper and Pack-aging (1 firm), Wood and Cork Products (2firms), Furniture (3 firms), Vehicle Manufac-turing (1 firm), Motor Vehicle Trade and Main-tenance (1 firm), Transport Rental Services (1firm), Freight Forwarding (1 firm), Jewellery (1firm), Fish Farming (3 firms), Agriculture andFarming (3 firms). It is worth noting that thesample includes 9 firms from the media indus-try, 10 from financial services and 2 utilityfirms.
Firm capitalisation as a percentage of mar-ket capitalisation ranges from 0.01 per cent to8.62 per cent, around a mean of 0.46 per centwith a standard deviation of 1.18 per cent.Firm capitalisation is below 0.5 per cent ofmarket capitalisation for 149 firms, is between0.5 to 1 per cent for 13 firms, 2–5 per centfor 9 firms and 5–9 per cent for 4 firms inour sample. As the data for important andmanagerial shareholdings show, importantshareholders have the ability to control man-agement. Further, a simple inspection of thefirms’ annual reports reveals that in theirmajority the firms used in our sample arefamily-owned, where the family of the ownerhas the control of the management. Specifi-cally, based on the voting rights and accord-ing to the identity of the largest direct owner,75.4 per cent of the firms in our sample areclassified as family-owned, 5.1 per cent asstate-owned, 6.3 per cent as private widely-held and 13.1 per cent are held by a largeshareholder.
Q: Tobin’s Q. The numerator is the firm’s mar-ket value of common stock plus the bookvalue of its debt in 2000 (end-of-year). Thedenominator is the book value of total assetsin 2000 (end-of-year). Annual data for theyear 2000, in thousand euros. Source: Ath-ens Stock Exchange Market, Annual Statisti-cal Bulletin, Trading of Bonds and Stocks(2001).
Prate: Accounting profit rate defined as theratio of net income to book value of equity(end-of-year). Annual data of net incomeand of equity (book value) for the year 2000,in thousand euros. Source: Athens StockExchange Market, Yearbook 2001, BalanceSheets.
Important SH: The logarithm of [percentageownership/(100-percentage ownership)].Percentage ownership is measured as thefraction of shares owned by a firm’s impor-tant shareholders, each of whom owns atleast 5 per cent of outstanding shares. Thedata refer to 2000; voting rights measure-ment. Source: http://www.ase.gr.
Managerial SH: The logarithm of [percentageownership/(100-percentage ownership)].Percentage ownership is measured as thefraction of shares owned by a firm’s man-agement (top management, CEO, boardmembers), each of whom owns at least 5per cent of outstanding shares. The datarefer to 2000; voting rights measurement.Source: http://www.ase.gr.
Debt: Long-term liabilities to total assets.Annual data on liabilities and assets for theyear 2000, in thousand euros (end-of-year).Source: Athens Stock Exchange Market,Yearbook 2001, Balance Sheets.
Firm size: Total assets (end-of-year). Annualdata for the year 2000, in thousands euros.Source: Athens Stock Exchange Market,Yearbook 2001, Balance Sheets.
Distr: Distribution expenses to sales (end-of-year). Annual data for the year 2000, inthousand euros. Source: Athens StockExchange Market, Yearbook 2001, BalanceSheets, and Bank of Greece.
CR4: Top 4 firm concentration index computedas the sum of the market shares of four larg-est firms in the market. Market share is com-puted as the ratio of total assets of the ithfirm to total assets of all firms in the market(in thousand euros). End-of-year data for2000. Source: Greek Financial Directory,ICAP, 2002.
Hindex: Herfindahl concentration index, com-puted as the sum of the squared marketshares of all firms in the market. Marketshare is computed as the ratio of total assetsof the ith firm to total assets of all firms inthe market (in thousand euros). End-of-year

CORPORATE OWNERSHIP STRUCTURE AND FIRM PERFORMANCE 157
© 2007 The AuthorsJournal compilation © Blackwell Publishing Ltd. 2007
Volume 15 Number 2 March 2007
data for 2000. Source: Greek Financial Direc-tory, ICAP, 2002.
Media: It takes the value 1 if a firm is a mediaindustry and 0 elsewhere.
F: It takes the value 1 if a firm is a financialinstitution and 0 elsewhere.
U: It takes the value 1 if a firm is a utility and0 elsewhere.
References
Berle, A. A. and Means, G. C. (1932) The ModernCorporation and Private Property. New York:Harcourt, Brace and World.
Bhagat, S. and Jefferis, R. (2002) The Econometrics ofCorporate Governance. Cambridge, MA: The MITPress.
Bhagat, S., Carey, D. and Elson, C. (1999) DirectorOwnership, Corporate Performance and Man-agement Turnover, The Business Lawyer, 54, 885–919.
CMC (2001a) Diffused Ownership in the Greek ListedFirms, Hellenic Republic Capital Market Commission,June 2001 (in Greek), http://www.hcmc.gr, Pub-lications, Studies.
CMC (2001b) Diffused Ownership in the Greek ListedFirms, Hellenic Republic Capital Market Commission,December 2001 (in Greek), http://www.hcmc.gr,Publications, Studies.
Cho, M. H. (1998) Ownership Structure, Invest-ment, and the Corporate Value: An EmpiricalAnalysis, Journal of Financial Economics, 47, 103–121.
Chung, K. H. and Pruitt, S. W. (1996) ExecutiveOwnership, Corporate Value and ExecutiveCompensation: A Unifying Framework, Journal ofBanking and Finance, 20, 1135–1159.
Davidson, R. and Mackinnon, J. G. (1993) Estimationand Inference in Econometrics. New York: OxfordUniversity Press.
Demsetz, H. (1983) The Structure of Ownership andthe Theory of the Firm, Journal of Law and Eco-nomics, 26, 375–390.
Demsetz, H. and Lehn, K. (1985) The Structure ofCorporate Ownership: Causes and Consequences,Journal of Political Economy, 93, 1155–1177.
Demsetz, H. and Villalonga, B. (2001) OwnershipStructure and Corporate Performance, Journal ofCorporate Finance, 7, 209–233.
Dickerson, A. P., Gibson, H. D. and Tsakalotos, E.(2002) Takeover Risk and the Market for Corpo-rate Control: the experience of British Firms in the1970s and 1980s, International Journal of IndustrialOrganization, 20, 1167–1195.
Felton, R. (2004) A New Era in Corporate Gover-nance, The McKinsey Quarterly, 2, 28–41.
Hausman, J. A. (1978) Specification Tests in Econo-metrics, Econometrica, 46, 1251–1272.
Hermalin, B. and Weisbach, M. (1988) The Determi-nants of Board Composition, Rand Journal of Eco-nomics, 19, 589–606.
Hermalin, B. and Weisbach, M. (1991) The Effects ofBoard Composition and Direct Incentives onFirm Performance, Financial Management, 20, 101–112.
Himmelberg, C., Hubbard, G. and Palia, D. (1999)Understanding the Determinants of ManagerialOwnership and the Link between Ownershipand Performance, Journal of Financial Economics,53, 353–384.
Karathanassis, G. A. and Drakos, A. A. (2004) ANote on Equity Ownership and Corporate Valuein Greece, Managerial and Decision Economics, 25,537–547.
La Porta, R., Lopez-de-Silanes, F. and Shleifer, A.(1999) Corporate Ownership Around the World,Journal of Finance, LIV, 471–517.
Lindberg, E. and Ross, S. (1981) Tobin’s Q Ratio andIndustrial Organization, Journal of Business, 51, 1–32.
Loderer, C. and Martin, K. (1997) Executive StockOwnership and Performance: Tracking FaintTraces, Journal of Financial Economics, 45, 223–255.
McConnell, J. and Servaes, H. (1990) AdditionalEvidence on Equity Ownership and CorporateValues, Journal of Financial Economics, 27, 595–612.
Morck, R and Steier, L. (2005) The Global Historyof Corporate Governance: An Introduction.NBER, Working Paper No. 11062.
Morck, R., Shleifer, A. and Vishny, R. (1988) Man-agement Ownership and Market Valuation: AnEmpirical Analysis, Journal of Financial Economics,20, 293–315.
Palia, D. and Lichtenberg, F. (1999) ManagerialOwnership and Firm Performance: A Re-examination Using Productivity Measurement,Journal of Corporate Finance, 5, 323–339.
Shepherd, W. G. (1986) Tobin’s Q and the Structure-Performance Relationship: Comment, AmericanEconomic Review, 76, 1205–1210.
Shepherd, W. G. (1990) The Economics of IndustrialOrganization. Englewood Cliffs, NJ: Prentice HallInternational Editions.
Sheu, H.-J. and Yang, C.-Y. (2005) Insider Owner-ship Structure and Firm Performance: A Produc-tivity Perspective Study in Taiwan’s ElectronicsIndustry, Corporate Governance, 13, 326–337.
Short, H. and Keasey, K. (1999) Managerial Owner-ship and the Performance of Firms: Evidencefrom the UK, Journal of Corporate Finance, 5, 79–101.
Smirlock, M., Gilligan, T. and Marshall, W. (1984)Tobin’s Q and Structure-Performance Relation-ship, American Economic Review, 74, 1051–1060.
Villalonga, B. and Amit, R. (2004) How Do FamilyOwnership, Control and Management AffectFirm Value? Journal of Financial Economics(forthcoming).
Welch, E. (2003) The Relationship between Owner-ship Structure and Performance in Listed Austra-lian Companies, Australian Journal of Management,28, 287–305.
Panayotis Kapopoulos is currently working atEmporiki Bank. He is the Head of the RiskManagement Division. He has worked as aneconomic analyst in the Alpha Bank. He is alsoa visiting professor at the Athens Universityof Economics and Business (postgraduate
158 CORPORATE GOVERNANCE
© 2007 The AuthorsJournal compilation © Blackwell Publishing Ltd. 2007
Volume 15 Number 2 March 2007
studies). He obtained his PhD in Macro-economics from the Athens University ofEconomics and Business and EUI (Florence) in1993. He has published many papers in aca-demic journals. His book on the Dynamics ofFinancial System (in Greek) has won the prizeof the Athens Academy of Sciences for the year2003. His current research interests concernbanking and finance.
Sophia Lazaretou is currently working as aneconomist-researcher in the Economic Re-search Department of the Bank of Greece. Shewas a lecturer on International Monetary Eco-nomics at the University of Macedonia (1994–
97). She was also a visiting Professor at theUniversity of Crete (1993–94). Currently, sheis a visiting professor at the Hellenic OpenUniversity. She obtained her PhD in Interna-tional Monetary Economics from the AthensUniversity of Economics and Business andEUI (Florence) in 1993. She has publishedmany papers in academic journals. Her bookon The Drachma. From the Phoenix to the Euro(2nd edition, in Greek, co-authored by GeorgeAlogoskoufis) has won the prize of theAthens Academy of Sciences for the year2002. Her current research interests concernbanking, central banking and monetaryeconomics.
Related Documents