Corporate Governance, Shareholder Rights and Firm Diversification: An Empirical Analysis Pornsit Jiraporn* Department of Accounting, Economics and Finance Texas A&M International University Laredo, Texas 78041 Phone: (956) 326-2518 Email: [email protected] Young Sang Kim Department of Economics and Finance Northern Kentucky University Phone: (859) 572-5160 Email: [email protected] Wallace N. Davidson III Department of Finance College of Business and Administration Southern Illinois University, Carbondale Phone: (618) 453-1429 Email: [email protected] Manohar Singh Associate Professor of Finance Atkinson Graduate School of Management Willamette University, Salem Phone: (503) 698-1947 Email: [email protected] Date: June 27, 2005 JEL Classification: G30, G32, G34 Keywords: diversification, corporate governance, shareholder rights * Correspondence author

Welcome message from author
This document is posted to help you gain knowledge. Please leave a comment to let me know what you think about it! Share it to your friends and learn new things together.
Transcript
Corporate Governance, Shareholder Rights and Firm
Diversification: An Empirical Analysis
Pornsit Jiraporn* Department of Accounting, Economics and Finance
Texas A&M International University Laredo, Texas 78041
Phone: (956) 326-2518 Email: [email protected]
Young Sang Kim
Department of Economics and Finance Northern Kentucky University
Phone: (859) 572-5160 Email: [email protected]
Wallace N. Davidson III Department of Finance
College of Business and Administration Southern Illinois University, Carbondale
Phone: (618) 453-1429 Email: [email protected]
Manohar Singh
Associate Professor of Finance Atkinson Graduate School of Management
Willamette University, Salem Phone: (503) 698-1947
Email: [email protected]
Date: June 27, 2005
JEL Classification: G30, G32, G34
Keywords: diversification, corporate governance, shareholder rights
* Correspondence author
2
Corporate Governance, Shareholder Rights and Firm
Diversification: An Empirical Analysis
Abstract
Grounded in agency theory, this study investigates how the strength of shareholder rights influences the extent of firm diversification and the excess value attributable to diversification. The empirical evidence reveals that the strength of shareholder rights is inversely related to the probability to diversify. Furthermore, firms where shareholder rights are more suppressed by restrictive corporate governance suffer a deeper diversification discount. Specifically, we document a 1.1-1.4% decline in firm value for each additional governance provision imposed on shareholders. An explicit distinction is made between global and industrial diversification. Our results support agency theory as an explanation for the value reduction in diversified firms. The evidence in favor of agency theory appears to be more pronounced for industrial diversification than for global diversification.
3
Corporate Governance, Shareholder Rights and Firm
Diversification: An Empirical Analysis
I. Introduction
Considerable research has explored the issue of corporate diversification. One
critical question is whether corporate diversification enhances or destroys value. Early
researchers argued in favor of diversification citing factors such as greater operating
efficiency, the presence of an internal capital market, greater debt capacity, and lower
taxes (for example, Fluck and Lynch, 1999; Bradley, Desai, and Kim, 1988; Kaplan and
Weisbach, 1992; Porter, 1987; Ravenscraft, 1987; among others). During the 1950’s and
1960’s, many corporations took on various diversification programs. Recently, however,
the trend has reversed and many firms have returned to specialization.
Several academic studies in the 1990’s provide evidence on the destructive effect
on firm value of corporate diversification (for example, Comment and Jarrell, 1995;
Liebeskind and Opler, 1995; Lang and Stulz, 1994; Servaes, 1996; Berger and Ofek,
1995; Denis, Denis, and Yost, 2002, among others). More recently, arguments have been
advanced and new evidence presented that diversification may be beneficial or, at the
minimum, not value-destroying (Villalonga, 2004; Whited, 2001; Campa and Kedia,
2002; and Mansi and Reeb, 2002). Others have suggested that it may be the acquisition
of poorly performing units (Graham, Lemmon and Wolf, 2002) or miscalculations of
Tobin’s q (Whited, 2001) that explain the diversification discount. Hence, the debate on
the impact of diversification still continues in the literature.
Motivated by agency theory, we contribute to the literature in this area by
exploring the role of the agency costs in explaining the value discount (or premium?)
4
caused by diversification. In so doing, we examine the relation between firm value,
corporate governance, shareholder rights and the propensity to diversify. We employ the
Governance Index developed by Gompers, Ishii, and Metrick (2003) to represent the
strength of shareholder rights. Gompers et al (2003) construct a Governance Index on the
basis of how many corporate governance provisions exist that restrict shareholder rights,
with a higher index indicating weaker shareholder rights.
This study examines the influence of shareholder rights both on the extent of
diversification and on the excess value arising from diversification. First, we investigate
the relation between the propensity to diversify and the strength of shareholder rights.
We find evidence that firms where shareholder rights are weak are more likely to be
industrially diversified. This evidence is in favor of the explanation that managers exploit
the weak shareholder rights and diversify the firm unwisely. As a result, industrially
diversified firms exhibit a reduction in value. The evidence on global diversification,
however, is more ambiguous. We find no relation between the strength of shareholder
rights and the propensity to be diversified globally. Hence, global diversification does not
appear to be motivated by managers taking advantage of weak shareholder rights. The
value reduction affiliated with global diversification (Denis, Denis, and Yost, 2002),
therefore, may not be explained by the agency cost perspective.
Second, we investigate the impact of shareholder rights on firm value. To measure
the valuation effects, we use the concept of excess value, first developed by Berger and
Ofek (1995). We document that more restrictive corporate governance is associated with
lower excess value in diversified firms. Apparently, where shareholder rights are weaker,
firms suffer a more severe reduction in value. The detrimental effect on firm value of
5
weak shareholder rights is found in all of the diversification categories except for global
diversification. This evidence is consistent with an agency cost explanation. Diversified
firms where shareholder rights are weak (and, therefore, management powers are strong)
are expected to suffer from acute agency costs created by the separation of ownership and
control. More specifically, we document that each additional restrictive governance
provision imposed on the shareholders diminishes the excess value by approximately 1.1-
1.4% on average1.
The study is organized as follows. We discuss our hypotheses in Section II. The
sample selection criteria and data are discussed in Section III. Then, Section IV displays
the empirical evidence and, finally, Section V concludes.
II. Hypothesis Development
A. Propensity to diversify and shareholder rights
Jensen (1986) argues that, when managers have access to free cash flow, they
tend to spend it unwisely reducing shareholder wealth. There are several ways in which
the free cash flow could be “wasted”. One possibility might be for managers to consume
extra perquisites that are unnecessary. Another possibility could be managers attempting
to expand the firm through acquisitions in unrelated business segments that may not
supply adequate returns to the shareholders. We make an explicit distinction between
global and industrial diversification and argue that weak shareholder rights enable
managers to diversify the firm (perhaps, unwisely) either globally or industrially or both.
Hence, we hypothesize an inverse relation between the strength of shareholder rights and
the propensity for diversification, the weaker the shareholder rights, the more diversified
1 As shown later in the paper, the average firm has about 9 governance provisions. Thus, the average discount that can be attributed to restriction on shareholder rights is roughly 9.9-12.6%, which is both statistically and economically significant.
6
the firm is expected to be. Our first three hypotheses are related to the strength of
shareholder rights and the propensity to diversify globally, industrially or both.
H1: When shareholder rights are more restricted, firms are more likely to be globally diversified.
H2: When shareholder rights are more restricted, firms are more likely to be
industrially diversified. H3: When shareholder rights are more restricted, firms are likely to be both globally
and industrially diversified. B. Shareholder rights and firm value
As discussed earlier, we contend that weaker shareholder rights lead to a larger
extent of corporate diversification either globally, industrially or both. The overall effects
of diversification on firm value continue to be debated in the literature. Several studies
document a diversification discount whereas others offer evidence of a diversification
premium. Motivated by agency theory, we argue that diversification that results from
agency conflicts is likely to be value-destroying. Since agency conflicts are likely more
severe in firms with weaker shareholder rights, we hypothesize a positive association
between the strength of shareholder rights and firm value.
H4: When shareholder rights are more restricted, firms experience a deeper diversification discount.
III. Sample Selection and Data
A. Sample selection
The initial sample is obtained from the Research Insight COMPUSTAT Industrial
Segment file (CIS) and the Geographic Segment file (CGS) over the period 1993-1998.2
2 Since the segment data are available only for active firms in COMPUSTAT, there may be some survivorship bias in our sample. However, as noted by Denis et al (2002), this bias may not be significant
7
A firm is classified as industrially diversified if it reports more than one segment in the
CIS file. A firm is regarded as geographically diversified if it reports foreign sales in the
CGS file. Under SFAS No.14 (Statement of Financial Accounting Standards, 1976) and
SEC Regulation S-K, firms are required to report information on industry and geographic
segments whose sales, assets, or profits exceed 10% of the consolidated totals.
Firms are excluded that have segments in the financial industry (SIC codes 6000-
6999) and the utility industry (SIC codes 4900-4999) because these industries are subject
to regulations, rendering the characteristics of their financial information incomparable to
those in other industries. Additional constraints are imposed as in Berger and Ofek
(1995). We exclude firms with sales less than $20 million and firms where the difference
between the sum of the segment sales and total sales exceed 1%.
We further reduce the sample by excluding those observations that do not have
data on the Governance Index in the Investor Responsibility Research Center (IRRC).
The IRRC collects data on corporate governance. However, the IRRC collects data only
periodically and our sample is, therefore, restricted to the years in which the IRRC has
data. For our study, we use data from 1993, 1995 and 1998. The IRRC does not have
governance data for 1994, 1996 and 1997.
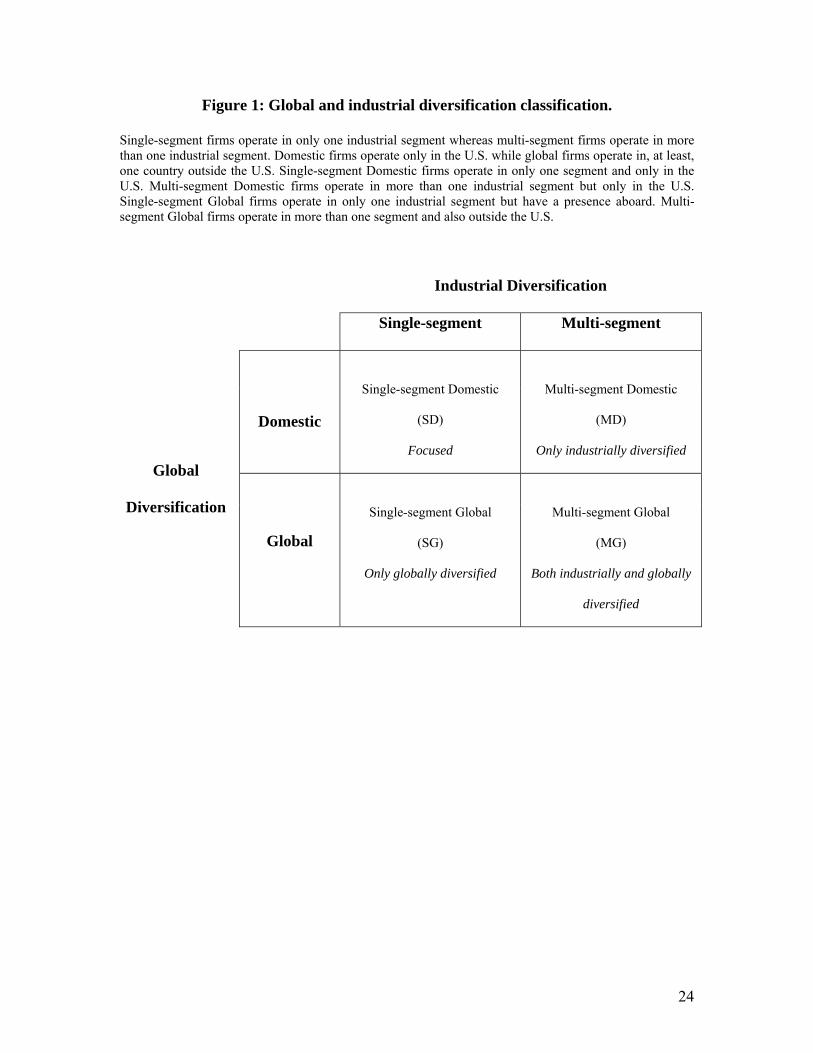
Each firm in the final sample is, then, classified into one of the four
diversification categories. Figure 1 shows the four diversification regimes classified
along two diversification dimensions, industrial and global. The final sample consists of a
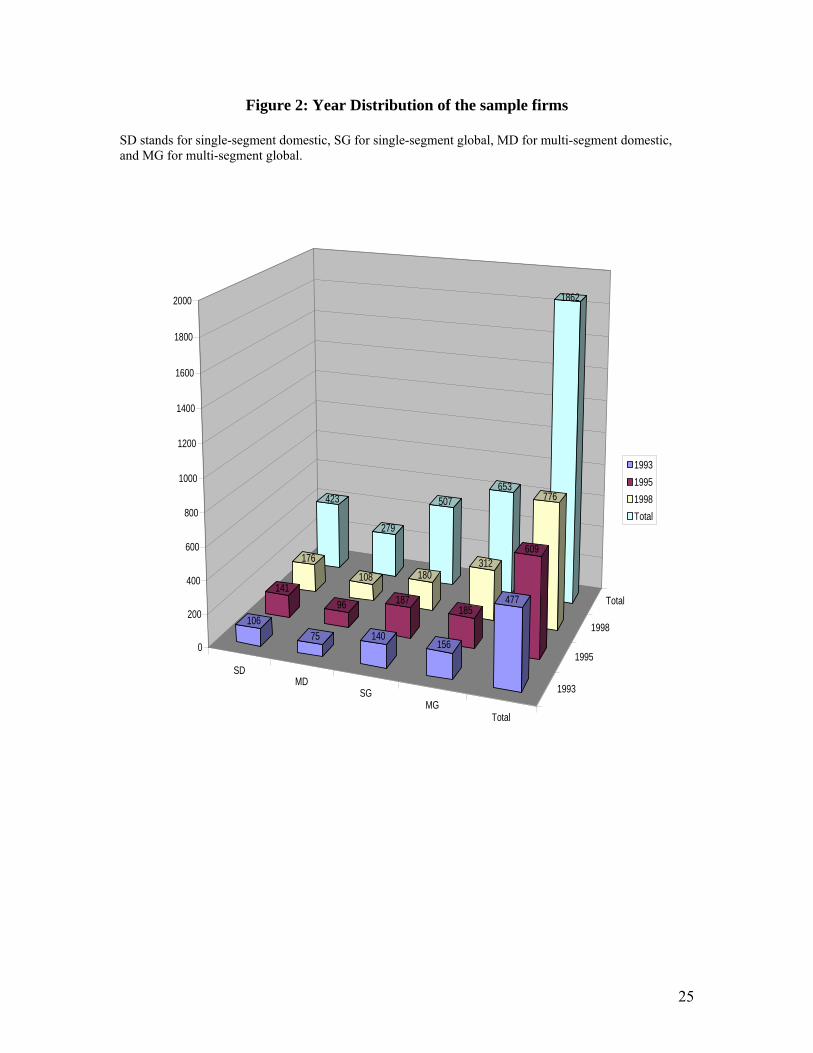
total of 1,862 firm-year observations. Figure 2 presents the year distribution of firms in
the sample.
enough to contaminate the results. In fact, our empirical results are similar to those of Denis et al (2002), implying that survivorship bias does not distort our results.
8
-----Insert Figure 1 about here----- -----Insert Figure 2 about here-----
B. The Governance Index (GINDEX)
To measure the strength of shareholder rights, we employ the Governance Index
(GINDEX) developed by Gompers, Ishii, and Metrick (2003) - henceforth GIM. They
use data from the Investor Responsibility Research Center (IRRC), which publishes
detailed listings of corporate governance provisions for individual firms in Corporate
Takeover Defenses (Rosenbaum, 1993, 1995, and 1998). The data on governance
provisions are derived from various sources, such as corporate bylaws, charters, proxy
statements, annual reports, as well as 10-K and 10-Q documents filed with the Security
and Exchange Commission (SEC). The individual governance provisions included in the
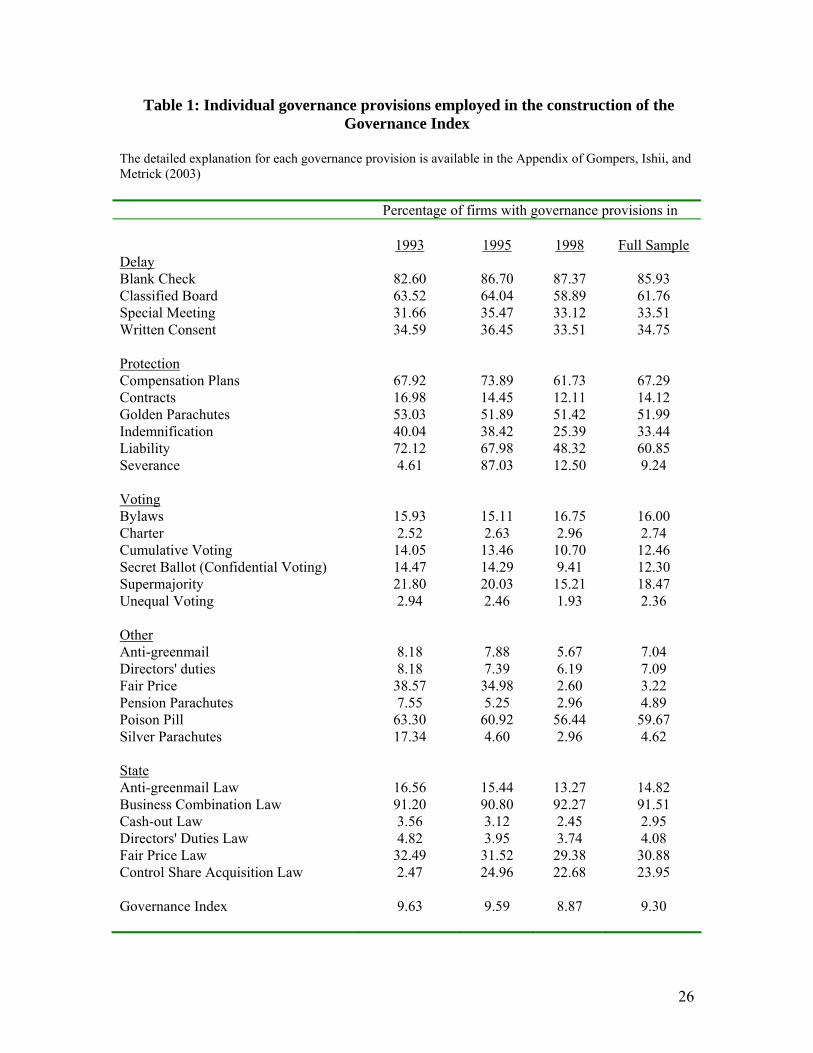
construction of the Governance Index are displayed in Table 1. The detailed explanation
for each governance provision is available in the appendix of GIM. They classify
provisions into 5 categories: tactics for delaying hostile bidders (Delay); voting rights
(Voting); director/officer protection (Protection); other takeover defenses (Other); and
state laws (State). Table 1 shows the percentage of firms in our sample that have each
provision in each sample year.
-----Insert Table 1 about here----- The Governance Index is constructed as follows; for every firm, GIM add one
point for every provision that restricts shareholder rights (increases managerial power).
While this index does not accurately reflect the relative impacts of the various provisions,
it has the advantage of being transparent and easily reproducible. The index does not
9
require any judgments about the efficacy or wealth effects of any of these provisions;
GIM only considers the impact on the balance of power.
To clarify the logic behind the construction of the Governance Index, GIM use the
following example; consider classified boards, a provision that staggers the terms and
elections of directors and, thus, can be employed to slow down a hostile takeover. If
management uses this power judiciously, it could possibly lead to an increase in overall
shareholder wealth; if management, however, uses this power to maintain private benefits
of control, then this provision would diminish shareholder wealth. Either way, it is
apparent that classified boards enhance the power of managers and weaken the control
rights of large shareholders. Hence, the Governance Index captures the balance of power
between management and shareholders.
Most provisions other than classified boards can be viewed with the same logic.
Almost every provision enables management to resist different types of shareholder
activism, such as calling special meetings, changing the firm’s charter or bylaws, suing
the directors, or replacing them all at once. GIM note, however, that there are two
exceptions, secret ballots (confidential voting) and cumulative voting. A secret ballot or
confidential voting designates a third party to count proxy votes and, therefore, prevents
management from observing how specific shareholders vote. Cumulative voting enables
shareholders to concentrate their directors’ votes so that a large minority shareholder can
ensure some board representation. These two provisions are usually proposed by
shareholders and opposed by management because they enhance shareholder rights and
diminish the power of management. Thus, for each one, GIM add one point to the
Governance Index when firms do not have it. For all other provisions, GIM add one point
10
when firms do have each of the provisions. In summary, the Governance Index is simply
the sum of one point for the presence (or absence) of each provision.
C. Excess Value
To measure the value of globally and industrially diversified firms, we use the
excess value measure following the modified version of Berger and Ofek (1995). We use
the single-segment domestic firm as the benchmark to compute excess value. We argue
that the excess value measure is superior to Tobin’s q (Lang and Stulz (1994)) because
Tobin’s q requires replacement cost in the denominator and neither foreign inflation rates
nor the exchange rate effect are taken into account. The excess value measure is
computed following Berger and Ofek (1995) with the modification in Bodnar, Tang, and
Weintrop (1999), and is defined as follows.
EVi,t= log (MVi,t / Imputed Value i,t)
Imputed Value i,t = ∑ (SSale i,t× Multiplier)
Where: EVi,t is the excess value for firm i in year t; MVi,t is the firm’s market
capitalization (market value of common equity plus book value of debt) for firm i in year
t; and Imputed Value is the sum of segment sales multiplied by the sales multiplier. The
Multiplier is measured as the median total market capitalization to sales for the single-
segment domestic firms in the same industry in the same year. A positive excess value
indicates that the entire firm is worth as a whole more than the sum of its segments
whereas a negative excess value shows that the firm as a whole is worth less than the sum
of its segments. Thus, a positive excess value implies a diversification premium while a
negative excess value indicates a diversification discount.
IV. Empirical Evidence
11
A. Summary statistics
Descriptive statistics for selected firm characteristics for our sample appear in
Table 2 Panel A. The multi-segment domestic firm is not significantly larger than its
single-segment counterpart in terms of sales but significantly larger in terms of total
assets (2,605.62 vs. 2,846.33 in sales and 2,021.95 vs. 2,575.76 in total assets). Multi-
segment global firms, however, are considerably larger than single-segment firms both in
terms of sales and total assets (2,910.84 vs. 6,093.77 in sales and 2,725.20 vs. 6, 524.77
in total assets). Multi-segment firms have larger debt ratios, smaller capital expenditures,
and smaller R&D expenditures. Likewise, global firms have larger debt ratios, lower
capital expenditures and smaller R&D expenditures. In terms of managerial (executives
and board members) ownership, there is no significant difference between single-segment
domestic (SD) firms and multi-segment domestic (MD) firms (14.13% vs. 12.69%).
However, the difference is significant between single-segment global (SG) firms and
multi-segment global (MG) firms (10.74% vs. 8.46%).
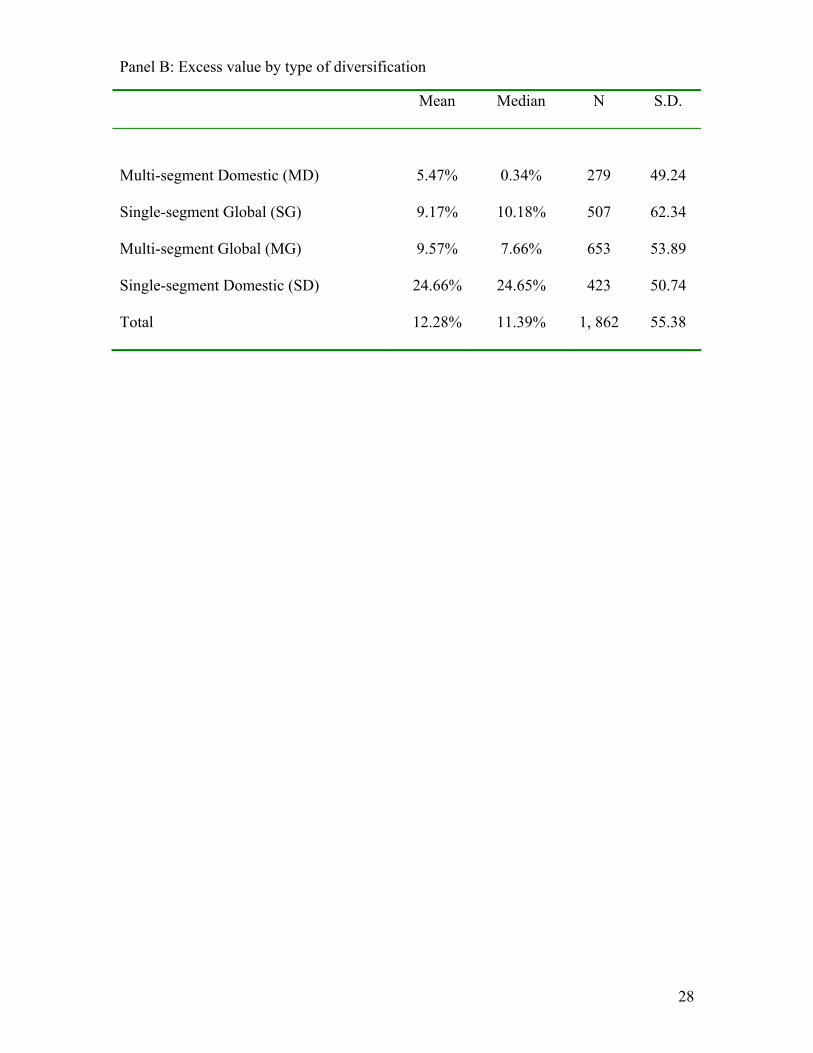
-----Insert Table 2 about here----- Panel B of Table 2 displays the excess value3 by diversification type. It should be
noted that the excess value for single-segment domestic firms is the highest, suggesting
that focused firms are more valuable. As mentioned earlier, we do not concentrate on
ascertaining whether the excess value is, on average, positive or negative. Rather, our
3 The excess value is constructed as described in Berger and Ofek (1995). The benchmark firm is the single-segment domestic firm. In computing the excess value, we use the entire universe of firms with available data on COMPUSTAT. Then, we retain only the observations where the Governance Index is available. The summary statistics shown here are only for the observations that remain in the final sample. Firms that are followed by the IRRC tend to be large and well-established. Hence, firms with low excess value are, perhaps, less likely to be included. This may explain why both the mean and the median are positive although diversification is found to be value-destroying.
12
focus is on determining the association between the excess value and the strength of
shareholder rights.
B. Propensity to diversify and shareholder rights
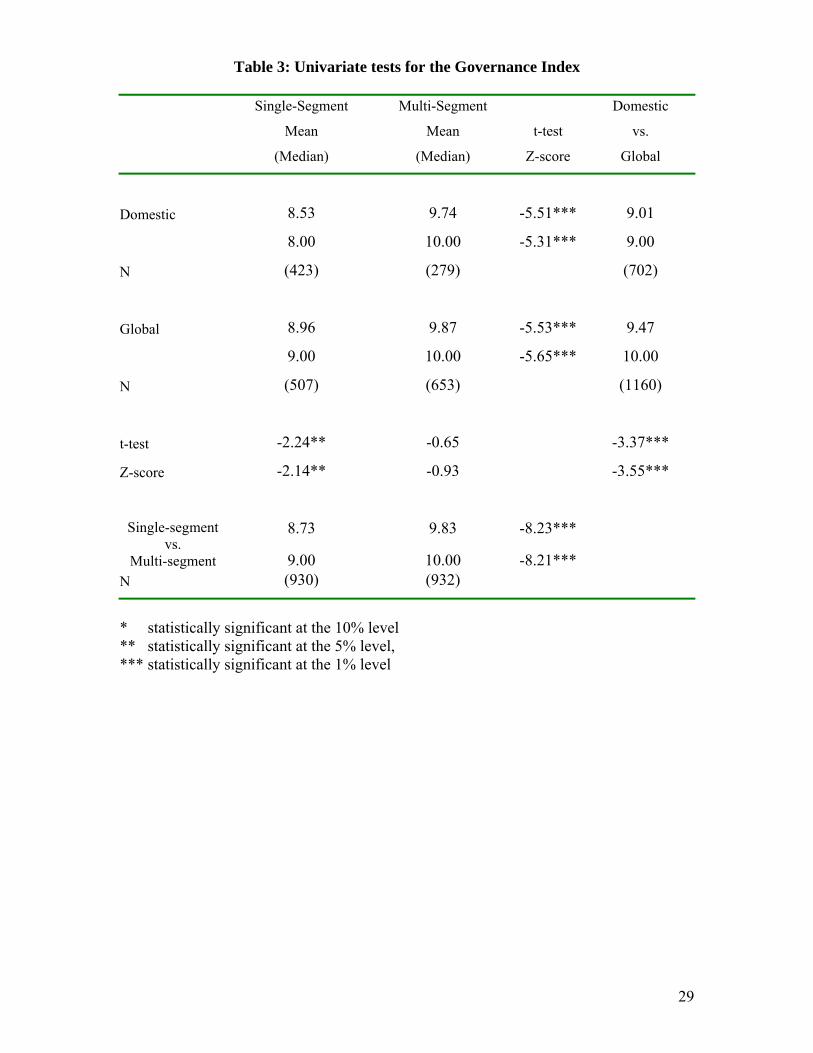
Table 3 presents the univariate analysis for the Governance Index and the extent
of firm diversification. In the last column, we test domestic firms against global firms
regardless of whether they are industrially diversified or not. The average number of
governance provision for the domestic firm is 9.01 (median 9.00) and that for the global
firm is 9.47 (median 10.00). The different is statistically significant at the 1% level both
in the t-test and in the distribution-free non-parametric test (Z-score). The evidence
reveals that weaker shareholder rights (more restrictive governance) are associated with
global diversification.
------Insert Table 3 about here-----
In the last row of Table 3, we compare single-segment firms with multi-segment
firms, regardless of whether they operate globally or just domestically. The average
number of governance provisions of the single-segment firm is 8.73 (median 9.00) while
that for the multi-segment firm is 9.83 (median 10.00). The difference is statistically
significant at the 1% level. Firms where shareholder rights are weak seem to be
industrially diversified.
We also divide the sample further into single-segment domestic (SD), single-
segment global (SG), multi-segment domestic (MG) and multi-segment global (MD)
firms. The multi-segment global firm (MG) has 9.87 governance provisions on average
(median 10.00). This is higher than the numbers of governance provisions in the other
13
three groups. The results imply that weaker shareholder rights are associated with a
combination of both global and industrial diversification.
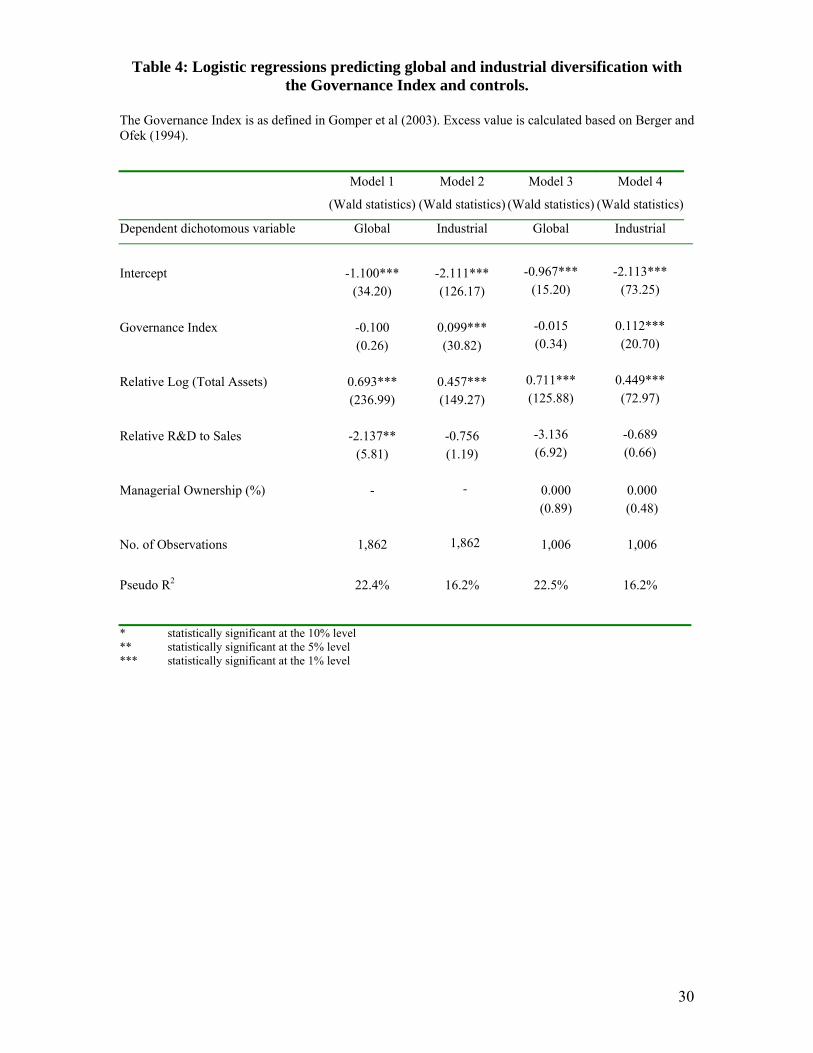
We enhance the univariate analysis with a logistic regression analysis presented in
Table 4. A number of control variables are included4. First, several prior studies show
that firm size impacts the extent of corporate diversification. For instance, Dennis et al
(1997) provide evidence that the number of business segments in which a firm operates is
positively related to firm size. Similarly, Singh et al (2004) provide evidence that firm
size is a positive predictor of firm diversification in that larger firms have greater
propensity to be diversified. As a result, we employ the logarithm of total assets to
control for firm size. Furthermore, Denis, Denis, and Sarin (1997) suggest that certain
firms are characterized by the need for large amounts of firm-specific knowledge that is
not easily transferable to other lines of business. Thus, we control for firm-specific
knowledge by including a measure of R&D intensity (R&D/Sales). Finally, within
Jensen’s agency framework (1986), firms where managerial ownership is high tend to
have shareholders’ and managers’ interests better aligned and, therefore, suffer less
agency costs. Morck et al (1988) and McConnell et al (1990) provide evidence of a
predominantly positive relation between corporate value and managerial ownership. With
respect to the relation between diversification and agency costs, managerial ownership is
found to be an important determinant of corporate diversification (Denis, Denis, and
Sarin, 1997). Thus, we include managerial ownership as a control variable as well. Our
managerial ownership variable measures the direct stock ownership by managers and
4 Alternative control variables are used and produce qualitatively similar results. To capture the potential industry effects, we industry-adjust the control variables by subtracting the industry median from the value of each variable for a given firm. The first two digits of the SIC codes are employed to identify the industry.
14
board of directors and is computed as the number of shares of stock held by the
executives and board members as a percentage of total shares outstanding.
In Model 1, the dependent variable is a dichotomous variable that is equal to 1 if
the firm is globally diversified and 0 otherwise. The coefficient of the Governance Index
in Model 1 is not statistically significant, suggesting no relation between the strength of
shareholder rights and the propensity to be globally diversified. Thus, hypothesis 1 (H1)
does not seem to be supported here.
------Insert Table 4 about here-----
In Model 2, the dependent variable is a dichotomous variable that takes the value
of 1 if the firm is industrially diversified and 0 otherwise. The Governance Index has a
positive and highly significant coefficient. Hence, a higher number of governance
provisions that limit shareholder rights are associated with a higher probability to be
industrially diversified. This evidence is consistent with hypothesis 2 (H2). In Model 3
and Model 4, we include managerial ownership as a control variable5 and obtain
qualitatively similar results on the Governance Index.
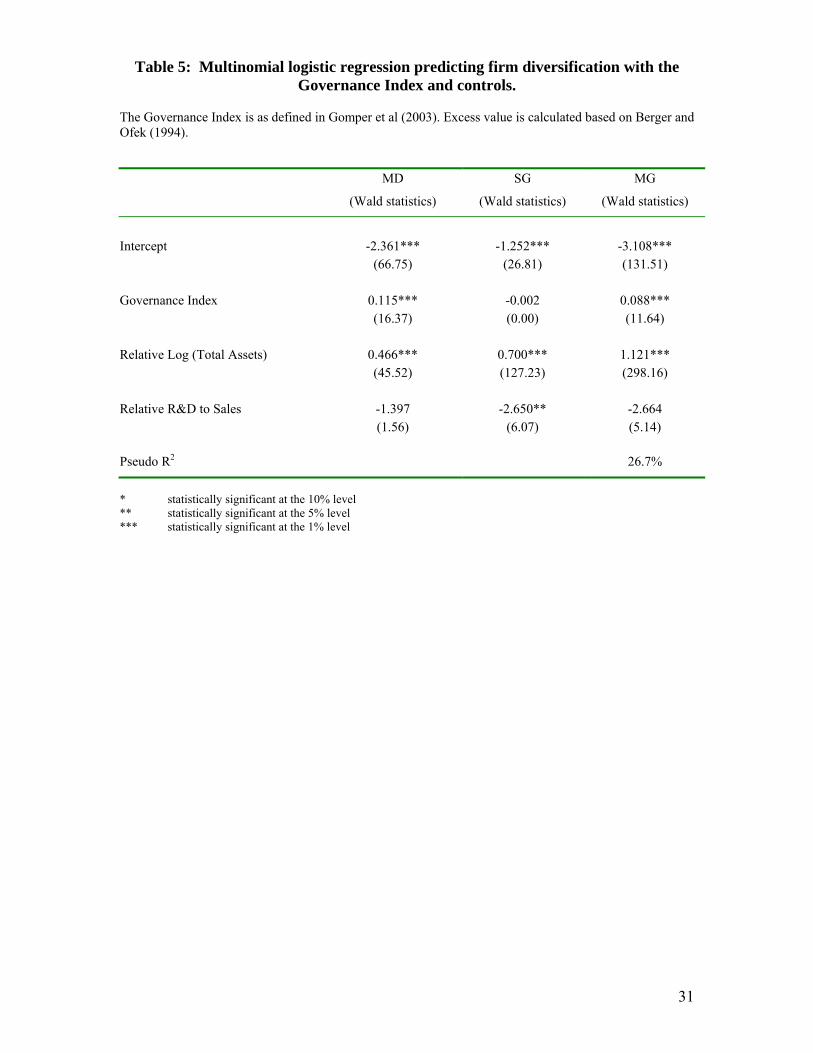
To test hypothesis 3 (H3), we estimate a multinomial logistic regression where the
dependent variable is a discrete variable that takes on four possible values (1 if single-
segment domestic (SD), 2 if multi-segment domestic (MD), 3 if single-segment global
(SG) and 4 if multi-segment global (MG)). These four diversification regimes represent
the four possible combinations of global and industrial diversification. The results of the
multinomial logistic regression are displayed in Table 5. The last column of the table
shows the results for the multi-segment global (MG) firm. This group represents firms
5 The data on managerial ownership are available for only 971 firms in the sample. Hence, we include managerial ownership in a separate set of regressions.
15
that are both globally and industrially diversified. The Governance Index has a positive
and significant estimated coefficient.6 The evidence indicates that a higher number of
governance provisions (weaker shareholder rights) contributes to a greater likelihood that
the firm is both globally and industrially diversified. The evidence lends support to
hypothesis 3 (H3).
------Insert Table 5 about here-----
It can be argued that governance structure and diversification are endogenously
determined. If this is the case, then, the simultaneous equations framework may be more
suitable for testing H1, H2, and H3. As a robustness check, we run Hausman’s
specification test to check for the presence of simultaneity. The Hausman tests are all
statistically insignificant. There is no evidence of simultaneity. We conclude that
endogeneity does not seem to impact the results.
In conclusion, we find support for H2 and H3 but not for H1. More restrictive
governance, which suppresses shareholder rights, is associated with a higher degree of
industrial diversification and the combination of both global and industrial diversification
(but not global diversification alone).
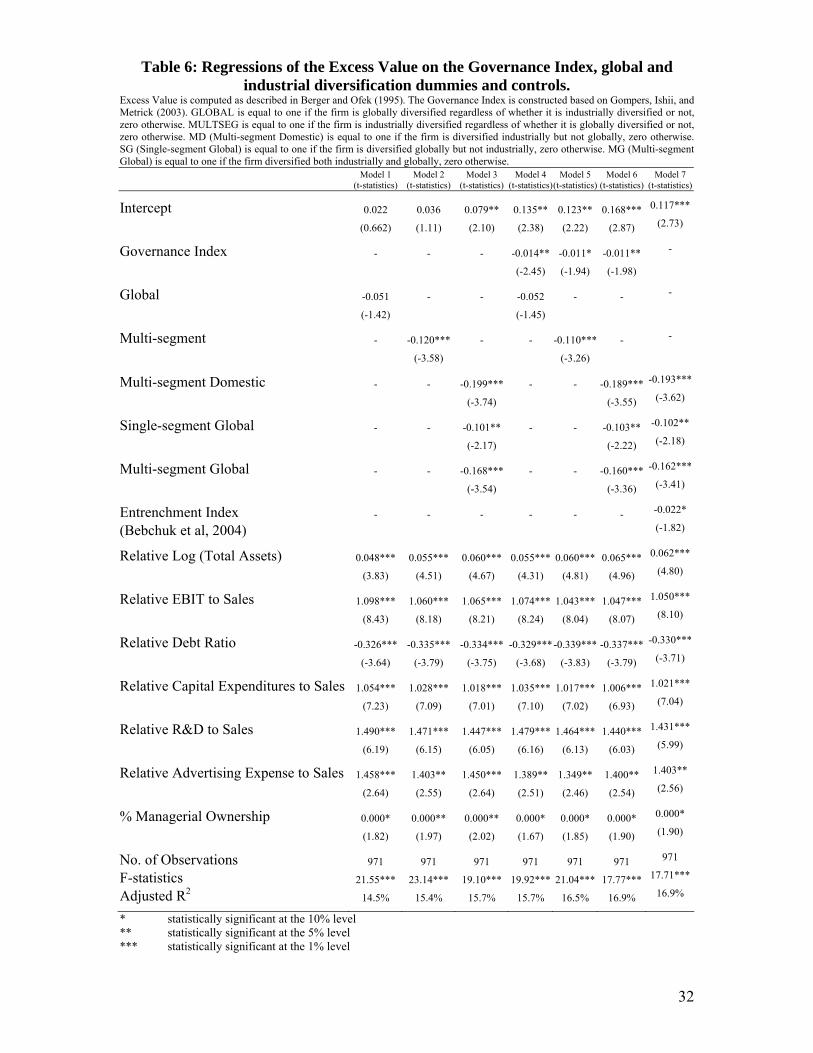
C. Shareholder rights and firm value
We test H4 in a multiple regression framework to control for firm specific
characteristics other than governance and diversification attributes. In Table 6, the results
of a regression analysis are shown. The dependent variable is the excess value (calculated
as in Berger and Ofek, 1994). The test variable is the Governance Index. A number of
control variables are included; global and industrial diversification, firm size (Log of total
6 An alternative regression is run where managerial ownership is included (results omitted). The results remain similar.
16
assets), profitability (EBIT/sales), debt ratio, growth opportunities (CAPX/sales),
informational asymmetry (R&D/ sales), advertising expenses, and percentage of
managerial ownership. These control variables are employed in a number of prior studies
on diversification (Dennis, Dennis, and Yost, 2002; Berger and Ofek, 1995; among
others).
------Insert Table 6 about here----- We run two sets of regressions. First, we attempt to replicate the results of other
previous studies by regressing the excess value on the diversification dummies and the
control variables. Then, in the second set of regressions, we add the Governance Index in
the regressions to ascertain the impact of the strength of shareholder rights on firm value.
In the first three models in Table 6 (where the Governance Index is not included), all of
the diversification dummies (except the global dummy7) exhibit negative and significant
coefficients, suggesting that diversification reduces firm value.
Then, to determine the impact of the strength of shareholder rights on firm value,
we add the Governance Index in Models 4, 5, and 6. In Model 4, we include the
Governance Index, the global diversification dummy, and the control variables. The
estimated coefficient of the Governance Index is negative and statistically significant.
The evidence is consistent with the hypothesis that firms where shareholder rights are
restricted (high GINDEX) experience low excess value. In Model 5, we replace the
global dummy with the multi-segment dummy. The estimated coefficient for the
Governance Index remains negative and significant. In model 6, we use various
diversification dummies to capture the influence of dual-global and industrial-
diversification strategies and obtain similar results. The results suggest that firms with 7 The coefficient of the global dummy is significant at the 15% level, however.
17
weak shareholder rights (restrictive governance) suffer a deeper diversification discount8.
The predictions of H4 are, therefore, supported. Notably, consistent with prior empirical
evidence, a higher degree of managerial ownership seems to alleviate agency conflict as
we find that the excess value positively associates with managerial ownership.
The estimated coefficient of the Governance Index varies from -0.011 to -0.014,
indicating that for each additional governance provision imposed on shareholder rights,
the excess value declines by approximately 1.1-1.4%. Because the average firm in the
sample has about 9 governance provisions, the average discount on firm value is about
9.9-12.6% that can be attributed to the suppression of shareholder rights through strict
corporate governance. A discount of this magnitude is both statistically and economically
significant.
Finally, a recently study by Bebchuk, Cohen, and Ferrell (2004) constructs an
“Entrenchment Index” based on 6 of the 24 governance provisions9 in Gompers et al
(2003). They contend that this index can better explain firm value (represented by
Tobin’s q) and stock returns than the Governance Index- specifically, the higher the
Entrenchment Index, the lower the firm value. Following Bebchuk et al (2004), we create
the Entrenchment Index and include it in the regression in Model 7. The coefficient of the
Entrenchment Index is negative and significant, suggesting that managerial entrenchment
is associated with a value reduction. Therefore, our results agree with those in Bebchuk,
Cohen, and Ferrell (2004). 8 As a robustness check, we replace the global dummy with foreign sales as a continuous alternative measure of global diversification and re-run the regression (results omitted). The results are similar. Likewise, we replace the multi-segment dummy with the Herfindahl index as a continuous alternative measure of industrial diversification and re-run the regression (results not shown). The results are, again, consistent with the results arrived at using dummy variable specification. 9 The six provisions included in the Entrenchment Index are staggered boards, limits to shareholder bylaw amendments, supermajority requirements for mergers, supermajority requirements for charter amendments, poison pills, and golden parachutes.
18
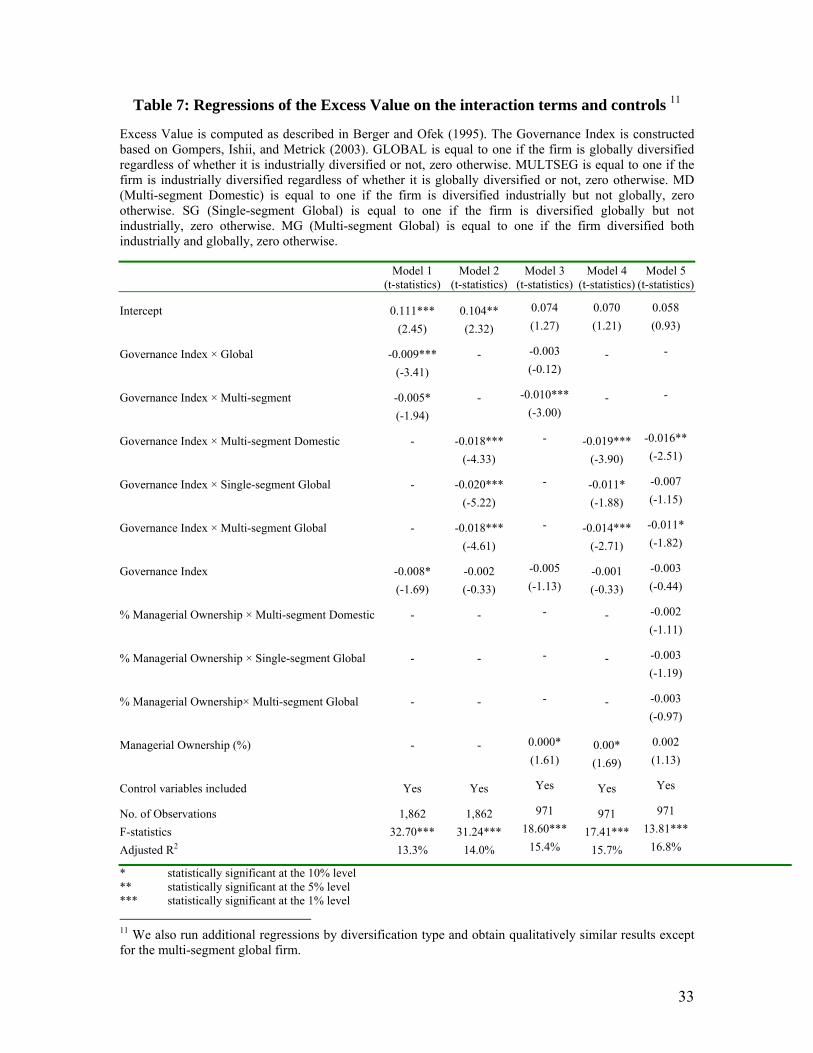
We now examine whether the detrimental effect is uniform across different
diversification categories. We accomplish this by constructing a number of interaction
terms between the Governance Index and the various diversification dummies. The
results of the regressions with the interaction terms appear in Table 7. Model 1 includes
two interaction terms, one that combines the Governance Index with the global dummy
variable and another that combines the Governance Index with the multi-segment dummy
variable. Both of these interaction terms produce negative and significant estimated
coefficients. The results reveal that restrictive governance reduces firm value both in the
presence of global diversification and industrial diversification.
------Insert Table 7 about here-----
In Model 2, we include three interaction terms in the regression, each term
corresponding to the Governance Index interacting with each diversification dummy. All
of the interaction terms in Model 2 display negative and statistically significant estimated
coefficients, implying that restrictive governance provisions destroy value in all of these
diversification categories.
We repeat the previous regressions in Model 3 and Model 4 but add managerial
ownership as a control variable. Interestingly, in Model 3, when managerial ownership is
included, the estimated coefficient of the interaction term between the Governance Index
and global diversification becomes insignificant. The results for the rest of the interaction
terms are qualitatively similar to those in Model 1 and Model 2. The results in Model 3
indicate that, after controlling for managerial ownership, restrictive governance (weak
shareholder rights) does not reduce the excess value in firms that are globally diversified.
It does so, however, in the other diversification regimes.
19
Finally, in Model 5, we control for the interaction effects between managerial
ownership and diversification. The three variables that interact ownership with the
diversification dummies are added as controls in Model 5. The results in Model 5 are
similar to those in Model 4 except for the interaction term between the Governance Index
and the single-segment global dummy, which loses its significance. This is hardly
surprising, however, given that the Governance Index does not explain global
diversification as much as industrial diversification in the previous analyses.
In summary, there is a positive (negative) relationship between the strength of
shareholder rights (corporate governance) and firm value. The diversification discount is
more severe when the firm has more governance provisions that restrict shareholder
rights. This relation does hold in all of the diversification categories except for global
diversification even after controlling for ownership structure.
V. Concluding Remarks
Corporate diversification has been a topic of interest for researchers in the past
couple of decades. The main thrust of the research in this area is to identify whether
diversification is beneficial or detrimental to firm value. Having enjoyed support in the
1960’s and 1970’s, the benefits of diversification have been viewed with skepticism in
the 1990’s. A number of studies have uncovered the “diversification discount”. The
discount has been corroborated in several recent studies (Comment and Jarrell (1995),
Lang and Stulz (1994), Servaes (1996), Berger and Ofek (1995)). Nevertheless, several
studies published after 2000 have cast doubt on the diversification discount and offer new
perspectives based on more sophisticated methods (Villalonga, 2004; Whited, 2001,
among others).
20
Because of the on-going debate on the costs and benefits of diversification, we
contribute to the literature by empirically examining the potential connections between
corporate governance, shareholder rights, firm value, and the propensity for a firm to be
diversified. The Governance Index developed by Gompers, Ishii, and Metrick (2003) is
employed as the measure of the strength of shareholder rights. There is evidence that
when shareholder rights are more restricted, the firm is more likely to be diversified. We
argue that weak shareholder rights allow management to diversify the firm unwisely,
resulting in a decline in value.
The excess value developed by Berger and Ofek (1995) is used as a proxy for
firm value. The evidence in our study reveals that firms where shareholder rights are
more suppressed by restrictive governance provisions suffer a deeper diversification
discount. This is true for all diversification categories except for global diversification.
When shareholder rights are weak, agency costs created by the separation of ownership
and control are likely to be more acute. As a result, the diversification discount is more
severe.
Our study contributes to the literature both in corporate diversification and agency
theory. In corporate diversification, our results complement findings of those studies that
identify agency costs as responsible for the value reduction (Denis, Denis, and Sarin,
1997; Hyland and Diltz, 2002; among others). Consistent with the agency theory
perspective, we demonstrate that restrictive corporate governance provisions may enable
management to pursue strategies that are not necessarily consistent with shareholders’
wealth maximization (in this particular instance, suboptimal diversification that destroys
firm value). Our study also contributes by considering the relative effects of global and
21
industrial diversification separately whereas most other studies take into account only
industrial diversification (with a notable exception of Denis, Denis, and Yost, 2002).
In conclusion, our results complement those of Denis, Denis, and Sarin (1997).
Both studies find empirical support for agency theory. Unlike Denis, Denis, and Sarin
(1997), however, our focus is on the strength of shareholder rights and corporate
governance whereas theirs is on managerial ownership. The results of both studies,
nevertheless, are remarkably similar in the sense that they provide support for agency
conflict as responsible for the diversification discount.
22
References
Bebchuk, Lucian, Alma Cohen, and Allen Ferrell, 2004, “What matters in corporate governance?” Harvard University and National Bureau of Economic Research, Working paper. Berger, Philip G., and Eli Ofek, 1995, “Diversification’s effect on firm value”, Journal of Financial Economics 37, 39-65. Bradley, M., A. Desai, and E. Kim, 1998, “Synergistic gains from corporate acquisitions and their division between the stockholders of target and acquiring firms”, Journal of Financial Economics 21, 3-40. Billett, M., and D. Mauer, 2000, “Diversification and the value of internal capital markets: The case of tracking stock”, Journal of Banking and Finance 24, 1457-1490. Billett, M., and D. Mauer, 2003, “Cross subsidies, external financing constraints, and the contribution of the internal capital market to firm value”, Review of Financial Studies 16 (4), 1167-1201 Bodnar, Gordon M., Charles Tang, and Joseph Weintrop, 1999, “both sides of corporate diversification”: The value impacts of geographic and industrial diversification, Working paper, Johns Hopkins University. Campa, J.M., and S. Kedia, 2002, “Explaining the diversification discount,” Journal of Finance 57, 1731-1762. Comment, R., and G. Jarrell, 1995, “Corporate focus and stock returns”, Journal of Financial Economics 37, 67-88. Denis, D. J., D. K. Denis, and A. Sarin, 1997, “Agency problems, equity ownership, and corporate diversification”, Journal of Finance 52, 135-160. Denis, D. J., D.K. Denis, and K. Yost, 2002, “Global diversification, industrial diversification, and firm value”, Journal of Finance 57, 1951-1979 Fluck, Z., and A. Lynch, 1999, “Why do firms merge and then divest?: A theory of financial synergy”, Journal of Business 72, 319-346. Gompers, Paul, Joy Ishii, and Andrew Matrick, 2003, “Corporate governance and equity prices”, Quarterly Journal of Economics 118, 107-155. Graham, J.R., M. Lemmon, and J. Wolf, 2002, “Does corporate diversification destroy value?” Journal of Finance 59, 695-720.
23
Hadlock, C., M. Ryngaert, and S. Thomas, 2001, “Corporate structure and equity offerings: Are there benefits to diversification?” Journal of Business 74 (4), 613-635. Hyland, David, and David Diltz, “Why firms diversify? : An empirical examination”, Financial Management 31, 51-82. Jensen, M., 1986, “Agency costs of free cash flow, corporate finance, and takeovers”, American Economic Review 76, 323-329. Kaplan, S., and M. Weisbach, 1992, “The success of acquisitions: Evidence from divestitures”, Journal of Finance 48, 107-138. Lang, Larry H. P., and Rene Stulz, 1994, “Tobin’s q, corporate diversification and firm performance”, Journal of Political Economy 102, 1248-1280. Liebeskind, J., and T. Opler, 1995, “The causes of corporate refocusing: Evidence from the 1980’s”, University of Southern California, Working paper. Mansi, Sattar, and David M. Reeb, 2002, “Corporate diversification: What gets discounted?” Journal of Finance 57, 2167-2184. McConnell, J. and H. Servaes (1990). “Additional Evidence on Equity Ownership and Corporate Value.” Journal of Financial Economics 27: 595-612. Morck, R., A. Shleifer, and R. Vishny (1988). “Management Ownership and Market Valuation: An Empirical Analysis.” Journal of Financial Economics 20: 293-316. Porter, M., 1987, “From competitive advantage to corporate strategy”, Harvard Business Review 65, 43-59. Ravenscraft, D., 1987, “The 1980s mergers wave: An industrial organization perspective”, in The Merger Boom: An Overview, edited by L. Browne and E. Rosengren, Boston: Federal Reserve Bank of Boston, 17-37. Singh, Manohar, I. Mathur, K. C. Gleason, 2004 “An Analysis of Interrelationship among Corporate Governance, Ownership Structure and Diversification Strategies,” Financial Review 39, 489-526 Servaes, Henri, 1996, “The value of diversification during the conglomerate merger wave”, Journal of Finance 51, 1201-1225. Villalonga, Belen, 2004, “Does diversification cause the “diversification discount” Financial Management 33, 5-28 Whited Toni, 2001, “Is it efficient investment that causes the diversification discount?” Journal of Finance 56, 1667-1692
24
Figure 1: Global and industrial diversification classification. Single-segment firms operate in only one industrial segment whereas multi-segment firms operate in more than one industrial segment. Domestic firms operate only in the U.S. while global firms operate in, at least, one country outside the U.S. Single-segment Domestic firms operate in only one segment and only in the U.S. Multi-segment Domestic firms operate in more than one industrial segment but only in the U.S. Single-segment Global firms operate in only one industrial segment but have a presence aboard. Multi-segment Global firms operate in more than one segment and also outside the U.S.
Industrial Diversification
Single-segment Multi-segment
Domestic
Single-segment Domestic
(SD)
Focused
Multi-segment Domestic
(MD)
Only industrially diversified
Global
Diversification
Global
Single-segment Global
(SG)
Only globally diversified
Multi-segment Global
(MG)
Both industrially and globally
diversified
25
Figure 2: Year Distribution of the sample firms
SD stands for single-segment domestic, SG for single-segment global, MD for multi-segment domestic, and MG for multi-segment global.
SDMD
SGMG
Total
1993
1995
1998
Total
423
279
507653
1862
176
108 180312
776
14196 187
185
609
10675 140
156
477
0
200
400
600
800
1000
1200
1400
1600
1800
2000
199319951998Total
26
Table 1: Individual governance provisions employed in the construction of the Governance Index
The detailed explanation for each governance provision is available in the Appendix of Gompers, Ishii, and Metrick (2003) Percentage of firms with governance provisions in
1993
1995
1998
Full Sample Delay Blank Check 82.60 86.70 87.37 85.93 Classified Board 63.52 64.04 58.89 61.76 Special Meeting 31.66 35.47 33.12 33.51 Written Consent 34.59 36.45 33.51 34.75 Protection Compensation Plans 67.92 73.89 61.73 67.29 Contracts 16.98 14.45 12.11 14.12 Golden Parachutes 53.03 51.89 51.42 51.99 Indemnification 40.04 38.42 25.39 33.44 Liability 72.12 67.98 48.32 60.85 Severance 4.61 87.03 12.50 9.24 Voting Bylaws 15.93 15.11 16.75 16.00 Charter 2.52 2.63 2.96 2.74 Cumulative Voting 14.05 13.46 10.70 12.46 Secret Ballot (Confidential Voting) 14.47 14.29 9.41 12.30 Supermajority 21.80 20.03 15.21 18.47 Unequal Voting 2.94 2.46 1.93 2.36 Other Anti-greenmail 8.18 7.88 5.67 7.04 Directors' duties 8.18 7.39 6.19 7.09 Fair Price 38.57 34.98 2.60 3.22 Pension Parachutes 7.55 5.25 2.96 4.89 Poison Pill 63.30 60.92 56.44 59.67 Silver Parachutes 17.34 4.60 2.96 4.62 State Anti-greenmail Law 16.56 15.44 13.27 14.82 Business Combination Law 91.20 90.80 92.27 91.51 Cash-out Law 3.56 3.12 2.45 2.95 Directors' Duties Law 4.82 3.95 3.74 4.08 Fair Price Law 32.49 31.52 29.38 30.88 Control Share Acquisition Law 2.47 24.96 22.68 23.95 Governance Index 9.63 9.59 8.87 9.30
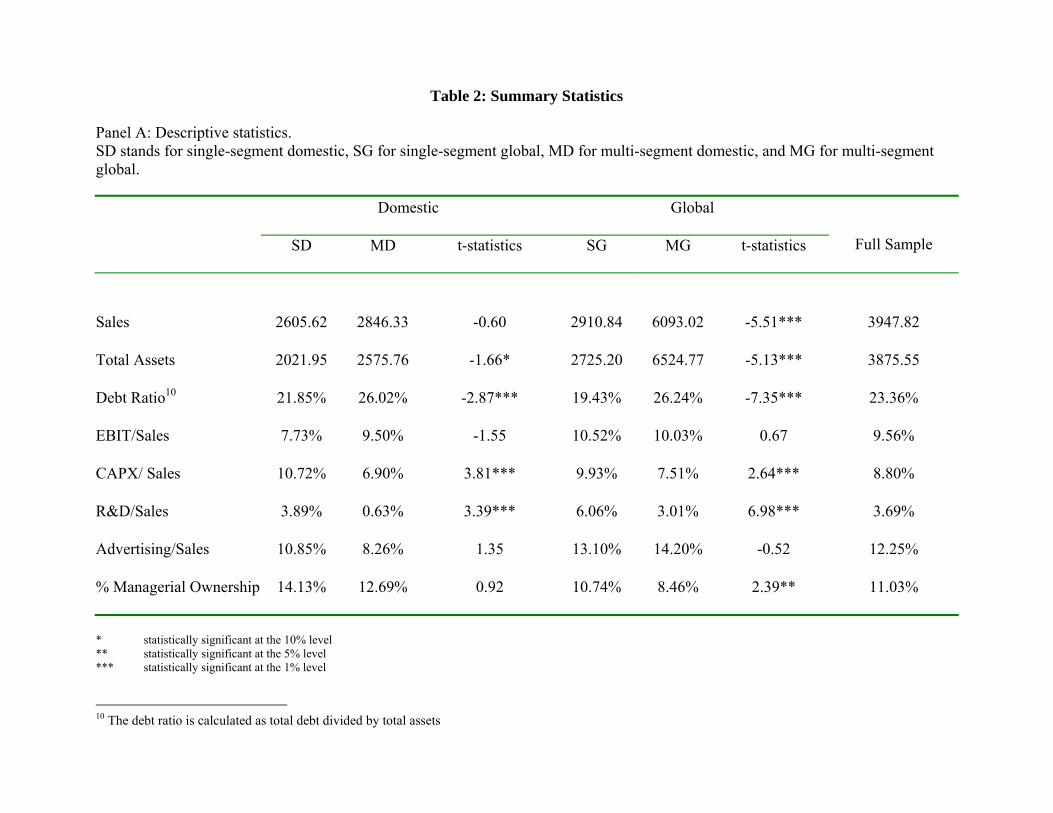
Table 2: Summary Statistics Panel A: Descriptive statistics. SD stands for single-segment domestic, SG for single-segment global, MD for multi-segment domestic, and MG for multi-segment global.
Domestic Global
SD MD t-statistics SG MG t-statistics
Full Sample
Sales 2605.62 2846.33 -0.60 2910.84 6093.02 -5.51*** 3947.82
Total Assets 2021.95 2575.76 -1.66* 2725.20 6524.77 -5.13*** 3875.55
Debt Ratio10 21.85% 26.02% -2.87*** 19.43% 26.24% -7.35*** 23.36%
EBIT/Sales 7.73% 9.50% -1.55 10.52% 10.03% 0.67 9.56%
CAPX/ Sales 10.72% 6.90% 3.81*** 9.93% 7.51% 2.64*** 8.80%
R&D/Sales 3.89% 0.63% 3.39*** 6.06% 3.01% 6.98*** 3.69%
Advertising/Sales 10.85% 8.26% 1.35 13.10% 14.20% -0.52 12.25%
% Managerial Ownership 14.13% 12.69% 0.92 10.74% 8.46% 2.39** 11.03%
* statistically significant at the 10% level ** statistically significant at the 5% level *** statistically significant at the 1% level
10 The debt ratio is calculated as total debt divided by total assets
28
Panel B: Excess value by type of diversification Mean Median N S.D.
Multi-segment Domestic (MD) 5.47% 0.34% 279 49.24
Single-segment Global (SG) 9.17% 10.18% 507 62.34
Multi-segment Global (MG) 9.57% 7.66% 653 53.89
Single-segment Domestic (SD) 24.66% 24.65% 423 50.74
Total 12.28% 11.39% 1, 862 55.38
29
Table 3: Univariate tests for the Governance Index
Single-Segment
Mean
(Median)
Multi-Segment
Mean
(Median)
t-test
Z-score
Domestic
vs.
Global
Domestic 8.53 9.74 -5.51*** 9.01
8.00 10.00 -5.31*** 9.00
N (423) (279) (702)
Global 8.96 9.87 -5.53*** 9.47
9.00 10.00 -5.65*** 10.00
N (507) (653) (1160)
t-test -2.24** -0.65 -3.37***
Z-score -2.14** -0.93 -3.55***
8.73 9.83 -8.23*** Single-segment vs.
Multi-segment 9.00 10.00 -8.21*** N (930) (932)
* statistically significant at the 10% level ** statistically significant at the 5% level, *** statistically significant at the 1% level
30
Table 4: Logistic regressions predicting global and industrial diversification with the Governance Index and controls.
The Governance Index is as defined in Gomper et al (2003). Excess value is calculated based on Berger and Ofek (1994).
Model 1
(Wald statistics)
Model 2
(Wald statistics)
Model 3
(Wald statistics)
Model 4
(Wald statistics)
Dependent dichotomous variable Global Industrial Global Industrial
Intercept -1.100*** -2.111*** -0.967*** -2.113*** (34.20) (126.17) (15.20) (73.25) Governance Index -0.100 0.099*** -0.015 0.112*** (0.26) (30.82) (0.34) (20.70) Relative Log (Total Assets) 0.693*** 0.457*** 0.711*** 0.449*** (236.99) (149.27) (125.88) (72.97) Relative R&D to Sales -2.137** -0.756 -3.136 -0.689 (5.81) (1.19) (6.92) (0.66) Managerial Ownership (%) - - 0.000 0.000 (0.89) (0.48) No. of Observations 1,862 1,862 1,006 1,006
Pseudo R2 22.4% 16.2% 22.5% 16.2%
* statistically significant at the 10% level ** statistically significant at the 5% level *** statistically significant at the 1% level
31
Table 5: Multinomial logistic regression predicting firm diversification with the Governance Index and controls.
The Governance Index is as defined in Gomper et al (2003). Excess value is calculated based on Berger and Ofek (1994).
MD
(Wald statistics)
SG
(Wald statistics)
MG
(Wald statistics)
Intercept -2.361*** -1.252*** -3.108*** (66.75) (26.81) (131.51) Governance Index 0.115*** -0.002 0.088*** (16.37) (0.00) (11.64) Relative Log (Total Assets) 0.466*** 0.700*** 1.121*** (45.52) (127.23) (298.16) Relative R&D to Sales -1.397 -2.650** -2.664 (1.56) (6.07) (5.14) Pseudo R2 26.7%
* statistically significant at the 10% level ** statistically significant at the 5% level *** statistically significant at the 1% level
32
Table 6: Regressions of the Excess Value on the Governance Index, global and industrial diversification dummies and controls.
Excess Value is computed as described in Berger and Ofek (1995). The Governance Index is constructed based on Gompers, Ishii, and Metrick (2003). GLOBAL is equal to one if the firm is globally diversified regardless of whether it is industrially diversified or not, zero otherwise. MULTSEG is equal to one if the firm is industrially diversified regardless of whether it is globally diversified or not, zero otherwise. MD (Multi-segment Domestic) is equal to one if the firm is diversified industrially but not globally, zero otherwise. SG (Single-segment Global) is equal to one if the firm is diversified globally but not industrially, zero otherwise. MG (Multi-segment Global) is equal to one if the firm diversified both industrially and globally, zero otherwise.
Model 1
(t-statistics)Model 2
(t-statistics)Model 3
(t-statistics)Model 4
(t-statistics)Model 5
(t-statistics) Model 6
(t-statistics) Model 7
(t-statistics)
Intercept 0.022 0.036 0.079** 0.135** 0.123** 0.168*** 0.117***
(0.662) (1.11) (2.10) (2.38) (2.22) (2.87) (2.73)
Governance Index - - - -0.014** -0.011* -0.011** -
(-2.45) (-1.94) (-1.98)
Global -0.051 - - -0.052 - - -
(-1.42) (-1.45)
Multi-segment - -0.120*** - - -0.110*** - -
(-3.58) (-3.26)
Multi-segment Domestic - - -0.199*** - - -0.189*** -0.193***
(-3.74) (-3.55) (-3.62)
Single-segment Global - - -0.101** - - -0.103** -0.102**
(-2.17) (-2.22) (-2.18)
Multi-segment Global - - -0.168*** - - -0.160*** -0.162***
(-3.54) (-3.36) (-3.41)
Entrenchment Index - - - - - - -0.022*
(Bebchuk et al, 2004) (-1.82)
Relative Log (Total Assets) 0.048*** 0.055*** 0.060*** 0.055*** 0.060*** 0.065*** 0.062***
(3.83) (4.51) (4.67) (4.31) (4.81) (4.96) (4.80)
Relative EBIT to Sales 1.098*** 1.060*** 1.065*** 1.074*** 1.043*** 1.047*** 1.050***
(8.43) (8.18) (8.21) (8.24) (8.04) (8.07) (8.10)
Relative Debt Ratio -0.326*** -0.335*** -0.334*** -0.329***-0.339*** -0.337*** -0.330***
(-3.64) (-3.79) (-3.75) (-3.68) (-3.83) (-3.79) (-3.71)
Relative Capital Expenditures to Sales 1.054*** 1.028*** 1.018*** 1.035*** 1.017*** 1.006*** 1.021***
(7.23) (7.09) (7.01) (7.10) (7.02) (6.93) (7.04)
Relative R&D to Sales 1.490*** 1.471*** 1.447*** 1.479*** 1.464*** 1.440*** 1.431***
(6.19) (6.15) (6.05) (6.16) (6.13) (6.03) (5.99)
Relative Advertising Expense to Sales 1.458*** 1.403** 1.450*** 1.389** 1.349** 1.400** 1.403**
(2.64) (2.55) (2.64) (2.51) (2.46) (2.54) (2.56)
% Managerial Ownership 0.000* 0.000** 0.000** 0.000* 0.000* 0.000* 0.000*
(1.82) (1.97) (2.02) (1.67) (1.85) (1.90) (1.90)
No. of Observations 971 971 971 971 971 971 971
F-statistics 21.55*** 23.14*** 19.10*** 19.92*** 21.04*** 17.77*** 17.71***
Adjusted R2 14.5% 15.4% 15.7% 15.7% 16.5% 16.9% 16.9%
* statistically significant at the 10% level ** statistically significant at the 5% level *** statistically significant at the 1% level
33
Table 7: Regressions of the Excess Value on the interaction terms and controls 11 Excess Value is computed as described in Berger and Ofek (1995). The Governance Index is constructed based on Gompers, Ishii, and Metrick (2003). GLOBAL is equal to one if the firm is globally diversified regardless of whether it is industrially diversified or not, zero otherwise. MULTSEG is equal to one if the firm is industrially diversified regardless of whether it is globally diversified or not, zero otherwise. MD (Multi-segment Domestic) is equal to one if the firm is diversified industrially but not globally, zero otherwise. SG (Single-segment Global) is equal to one if the firm is diversified globally but not industrially, zero otherwise. MG (Multi-segment Global) is equal to one if the firm diversified both industrially and globally, zero otherwise.
Model 1
(t-statistics)Model 2
(t-statistics)Model 3
(t-statistics) Model 4
(t-statistics) Model 5
(t-statistics)
Intercept 0.111*** 0.104** 0.074 0.070 0.058
(2.45) (2.32) (1.27) (1.21) (0.93)
Governance Index × Global -0.009*** - -0.003 - -
(-3.41) (-0.12)
Governance Index × Multi-segment -0.005* - -0.010*** - -
(-1.94) (-3.00)
Governance Index × Multi-segment Domestic - -0.018*** - -0.019*** -0.016**
(-4.33) (-3.90) (-2.51)
Governance Index × Single-segment Global - -0.020*** - -0.011* -0.007
(-5.22) (-1.88) (-1.15)
Governance Index × Multi-segment Global - -0.018*** - -0.014*** -0.011*
(-4.61) (-2.71) (-1.82)
Governance Index -0.008* -0.002 -0.005 -0.001 -0.003
(-1.69) (-0.33) (-1.13) (-0.33) (-0.44)
% Managerial Ownership × Multi-segment Domestic - - - - -0.002
(-1.11)
% Managerial Ownership × Single-segment Global - - - - -0.003
(-1.19)
% Managerial Ownership× Multi-segment Global - - - - -0.003
(-0.97)
Managerial Ownership (%) - - 0.000* 0.00* 0.002
(1.61) (1.69) (1.13)
Control variables included Yes Yes Yes Yes Yes
No. of Observations 1,862 1,862 971 971 971
F-statistics 32.70*** 31.24*** 18.60*** 17.41*** 13.81***
Adjusted R2 13.3% 14.0% 15.4% 15.7% 16.8%
* statistically significant at the 10% level ** statistically significant at the 5% level *** statistically significant at the 1% level 11 We also run additional regressions by diversification type and obtain qualitatively similar results except for the multi-segment global firm.
Related Documents