Corporate Governance and Firm Performance Lawrence D. Brown * J. Mack Robinson Distinguished Professor of Accountancy Georgia State University Marcus L. Caylor Ph.D. Candidate Georgia State University December 7, 2004 * Contact author, e-mail: [email protected] Performance data were obtained from Compustat. Corporate governance data were obtained from Institutional Shareholder Services. We are grateful to Paul Gompers, Joy Ishii, and Andrew Metrick for providing the Investor Research Responsibility Center data on shareholder rights. We have benefited from the comments of Orie Barron, Dennis Beresford, Paul Fischer, Jere Francis, Huong Higgins, Steve Huddart, Raffi Indjejikian, Bin Ke, Inder Kharana, Jim McKeown, Reynolde Pereira, Husayn Shahrur, Ken Shaw, Kumar Sivakumar, Dorothy Alexander-Smith, Tim Yoder, Mengxin Zhao, and participants of workshops at Boston Accounting Research Colloquium, 15 th Conference on Financial Economics and Accounting, University of Missouri, and Penn State University.

Welcome message from author
This document is posted to help you gain knowledge. Please leave a comment to let me know what you think about it! Share it to your friends and learn new things together.
Transcript

Corporate Governance and Firm Performance
Lawrence D. Brown∗ J. Mack Robinson Distinguished Professor of Accountancy
Georgia State University
Marcus L. Caylor Ph.D. Candidate
Georgia State University
December 7, 2004
∗ Contact author, e-mail: [email protected] Performance data were obtained from Compustat. Corporate governance data were obtained from Institutional Shareholder Services. We are grateful to Paul Gompers, Joy Ishii, and Andrew Metrick for providing the Investor Research Responsibility Center data on shareholder rights. We have benefited from the comments of Orie Barron, Dennis Beresford, Paul Fischer, Jere Francis, Huong Higgins, Steve Huddart, Raffi Indjejikian, Bin Ke, Inder Kharana, Jim McKeown, Reynolde Pereira, Husayn Shahrur, Ken Shaw, Kumar Sivakumar, Dorothy Alexander-Smith, Tim Yoder, Mengxin Zhao, and participants of workshops at Boston Accounting Research Colloquium, 15th Conference on Financial Economics and Accounting, University of Missouri, and Penn State University.
1
Corporate Governance and Firm Performance ABSTRACT: We create a broad measure of corporate governance, Gov-Score, based on a new dataset provided by Institutional Shareholder Services. Gov-Score is a composite measure of 51 factors encompassing eight corporate governance categories: audit, board of directors, charter/bylaws, director education, executive and director compensation, ownership, progressive practices, and state of incorporation. We relate Gov-Score to operating performance, valuation, and shareholder payout for 2,327 firms, and we find that better-governed firms are relatively more profitable, more valuable, and pay out more cash to their shareholders. We examine which of the eight categories underlying Gov-Score are most highly associated with firm performance. We show that good governance, as measured using executive and director compensation, is most highly associated with good performance. In contrast, we show that good governance as measured using charter/bylaws is most highly associated with bad performance. We examine which of the 51 factors underlying Gov-Score are most highly associated with firm performance. Some factors representing good governance that are associated with good performance have seldom been examined before (e.g., governance committee meets annually, independence of nominating committee). In contrast, some factors representing good governance that are associated with bad performance have often been examined before (e.g., consulting fees less than audit fees paid to auditors, absence of a staggered board, absence of a poison pill). Gompers, Ishii and Metrick (2003) created G-Index, an oft-used summary measure of corporate governance. G-Index is based on 24 governance factors provided by Investor Responsibility Research Center. These factors are concentrated mostly in one ISS category, charter/bylaws, which we show is less highly associated with good performance than are any of the other seven categories we examine. We document that Gov-Score is better linked to firm performance than is G-Index. Keywords: corporate governance; firm performance; gov-score; nominating committee; governance committee; option burn rate. Data Availability: All financial statement data are available from the public database identified in the paper. Governance data is provided by Institutional Shareholder Services.

2
Corporate Governance and Firm Performance
I. INTRODUCTION
Corporate governance has recently received much attention due to Adelphia,
Enron, WorldCom, and other high profile scandals, serving as the impetus to such recent
U.S. regulations as the Sarbanes-Oxley Act of 2002, considered to be the most sweeping
corporate governance regulation in the past 70 years (Byrnes et al., 2003). If better
corporate governance is related to better firm performance, better-governed firms should
perform better than worse-governed firms.
Managers have incentives to expropriate a firm’s assets by undertaking projects
that benefit themselves personally but that impact shareholder wealth adversely (Jensen
and Meckling, 1976; Fama and Jensen, 1983; Shleifer and Vishny, 1997). Effective
corporate governance reduces “control rights” stockholders and creditors confer on
managers, increasing the probability that managers invest in positive net present value
projects, (Shleifer and Vishny, 1997), suggesting that better-governed firms have better
operating performance, our first proxy for firm performance. 1
Regulators and governance advocates argue that the stock price collapse of such
former corporate stalwarts as Adelphia, Enron, Parmalat, Tyco, and WorldCom was due
in large part to poor governance. If their contentions are valid, a market premium should
exist for relatively well-governed firms. Gompers et al. (2003), Bebchuk and Cohen
(2004) and Bebchuk, Cohen and Ferrell (2004) show that firms with stronger stockholder
1 Control rights are the amount of discretion or control managers have over allocating investors’ funds (Shleifer and Vishny, 1997). Cash flow rights are another mechanism of managerial control that can be mitigated via ownership by large investors (concentrated ownership). Shleifer and Vishny (1997) state these mechanisms also have potential for abuse because large shareholders can expropriate wealth from smaller shareholders.

3
rights have higher Tobin Q’s, their proxy for firm value, suggesting that better-governed
firms are more valuable, our second measure of firm performance.
The free cash flow hypothesis (Jensen 1986) maintains that firms’ shareholders
where control lies mostly with managers are less likely to receive free cash flow via cash
dividend payouts.2 Larger free cash flow payouts reduce managers’ abilities to invest in
value-destroying projects, such as capital expenditures and acquisitions possessing
negative net present values. Consistent with the notion that earnings are retained for
empire building rather than for engaging in positive net value projects, Arnott and Asness
(2003) find that firms with relatively smaller dividend payouts have relatively lower
earnings growth, suggesting that better-governed firms pay out more cash to
shareholders, our third proxy for firm performance.
Using detailed corporate governance data provided by Institutional Shareholder
Services (ISS), encompassing 51 factors that span eight categories, we create a summary
index of firm-specific governance, “Gov-Score,” and relate it to operating performance,
valuation, and cash payouts for 2,327 firms. We show that poorly-governed firms (i.e.,
those with low Gov-Scores) have lower operating performance, lower valuations, and pay
out less cash to their shareholders, while better-governed firms have higher operating
performance, higher valuations, and pay out more cash to their shareholders.
We make several contributions to the literature. First, we develop a 51-factor
summary metric that we document is more highly associated with expected firm
performance than is the oft-used 24-factor G-Index derived by Gompers, Ishii and
2 Easterbrook (1984) hypothesizes that an additional benefit of dividend payments is that it forces firms to constantly obtain new capital, which serves as a monitoring mechanism for existing shareholders.

4
Metrick (2003).3 Second, we provide an intuitively appealing explanation for why Gov-
Score is more closely linked to firm performance than is G-Index; it focuses less on anti-
takeover measures, such as charter/bylaws, the governance category that is linked more
often to bad performance than are any of the other seven categories we examine. Third,
we identify several factors representing good governance that (as expected) are related to
good performance that have seldom been studied before (e.g., independent nominating
committee; governance committee meets annually), providing new focal points for those
seeking to link good governance to good performance. Fourth, we identify factors
presumed to represent good governance that actually are related to poor performance
(e.g., consulting fees paid to auditors less than audit fees paid to auditors), suggesting that
those seeking to link good governance to good performance may wish to either disregard
these factors or else consider them as surrogates for bad governance.
Our findings are important to regulators, investors, academics, and others who
contend that good corporate governance is important for increasing investor confidence
and market liquidity (Donaldson, 2003). With so many recent regulations focusing on
corporate governance, such as those based on the Sarbanes-Oxley Act and the recent
stock listing standards imposed by major U.S. exchanges, there is a widely held view that
better corporate governance is associated with better firm performance, but the evidence
is tenuous (LeBlanc and Gillies 2003). Our results add credence to the notion that most
measures of good corporate governance are associated with good firm performance. By
introducing a summary index that is better linked to firm performance than is the widely
3Studies using G-Index include Ashbaugh, Collins and LaFond (2004), Bebchuk and Cohen (2004), Bebchuk, Cohen and Farrell (2004), Bergstresser, Desai and Rauh (2004), Bowen, Rajgopal and Venkatachalam (2004), Christoffersen, Geczy, Musto, and Reed (2004), Core, Guay and Rusticus (2004), and DeFond, Hann and Hu (2004).

5
used G-Index, we provide future researchers with an alternative summary measure. By
identifying the categories and factors representing good governance that are most highly
associated with good performance, our findings are important to those seeking to know
where to look for such links. By identifying the categories and factors ostensibly
representing good governance that are in fact associated with bad performance, our
findings may cause regulators, academics, and others wishing to relate good governance
to good performance to reconsider whether some factors generally considered to reflect
good governance may actually reflect the opposite.
We proceed as follows. We review some related research in section II, and we
discuss data and methodology in section III. We provide descriptive results of
governance factors and relate Gov-Scores to firm performance in section IV. We relate
corporate governance categories and factors to firm performance in section V, and we
correlate firm performance with both Gov-Score and G-Index in section VI. We conduct
multivariate analyses in section VII, and we summarize and provide implications of our
results in section VIII.
II. REVIEW OF RELATED RESEARCH4
It is often alleged that boards of directors are more independent as the proportion
of their outsider directors increases (John and Senbet 1998). However, Fosberg (1989)
finds no relation between the proportion of outsider directors and various performance
measures (i.e., SG&A expenses, sales, number of employees, and return on equity);
Hermalin and Weisbach (1991) find no association between the proportion of outsider
directors and Tobin’s Q; and Bhagat and Black (2002) find no linkage between the
4 Rather than provide a review of this vast literature, we discuss a few relevant studies. See Shleifer and Vishny (1997), John and Senbet (1998) and Hermalin and Weisbach (2003) for literature reviews.

6
proportion of outsider directors and Tobin’s Q, return on assets, asset turnover and stock
returns. In contrast, Baysinger and Butler (1985) and Rosenstein and Wyatt (1990) show
that the market rewards firms for appointing outside directors; Brickley, Coles and Terry
(1994) find a positive relation between the proportion of outsider directors and the stock-
market reaction to poison pill adoptions; and Anderson, Mansi and Reeb (2004) show
that the cost of debt, as proxied by bond yield spreads, is inversely related to board
independence.
Thus, the relation between the proportion of outside directors, a proxy for board
independence, and firm performance is mixed. Studies using financial statement data and
Tobin’s Q find no link between board independence and firm performance, while those
using stock returns data or bond yield data find a positive link. Consistent with Hermalin
and Weisbach (1991) and Bhagat and Black (2002), we do not find Tobin’s Q to increase
in board independence (in fact, we find the opposite), but we do find that firms with
independent boards have higher returns on equity, higher profit margins, larger dividend
yields, and larger stock repurchases, suggesting that board independence is associated
with other important measures of firm performance aside from Tobin’s Q.
Limiting board size is believed to improve firm performance because the benefits
by larger boards of increased monitoring are outweighed by the poorer communication
and decision-making of larger groups (Lipton and Lorsch 1992; Jensen 1993). Consistent
with this notion, Yermack (1996) documents an inverse relation between board size and
profitability, asset utilization, and Tobin’s Q. Anderson et al. (2004) show that the cost
of debt is lower for larger boards, presumably because creditors view these firms as
having more effective monitors of their financial accounting processes. We add to this

7
literature by showing that firms with board sizes of between six and 15 have higher
returns on equity and higher net profit margins than do firms with other board sizes.
Klein (2002) documents a negative relation between earnings management and
audit committee independence, and Anderson et al. (2004) find that entirely independent
audit committees have lower debt financing costs. Frankel, Johnson and Nelson (2002)
show a negative relation between earnings management and auditor independence (based
on audit versus non-audit fees), but Ashbaugh, Lafond and Mayhew (2003) and Larcker
and Richardson (2004) dispute their evidence. Kinney, Palmrose and Scholz (2004) find
no relation between earnings restatements and fees paid for financial information systems
design and implementation or internal audit services, and Agrawal and Chadha (2005)
find no relation between either audit committee independence or the extent auditors
provide non-audit services with the probability a firm restates its earnings. We provide
additional evidence on the association between audit-related governance factors and firm
performance by showing that: (1) solely independent audit committees are positively
related to dividend yield, but not to operating performance or firm valuation; (2) auditors
ratified at the most recent annual meeting are unrelated to all of our performance
measures; (3) consulting fees paid to auditors less than audit fees paid to auditors are
negatively related to four of our six performance measures; and (4) company has a formal
policy on auditor rotation is positively related to return on equity but not to any of our
other five performance measures.
Several studies have examined the separation of CEO and chairman, positing that
agency problems are higher when the same person holds both positions. Using a sample
of 452 firms in the annual Forbes magazine rankings of the 500 largest U.S. public firms

8
between 1984 and 1991, Yermack (1996) shows that firms are more valuable when the
CEO and board chair positions are separate. Core, Holthausen and Larcker (1999) find
that CEO compensation is lower when the CEO and board chair positions are separate.
Consistent with Yermack (1996), we show that firms are more valuable when the CEO
and board chair positions are separate.
Botosan and Plumlee (2001) find a material effect of expensing stock options on
return on assets. They use Fortune’s list of the 100 fastest growing companies as of
September 1999, and compute the effect of expensing stock options on firms’ operating
performance. In contrast, we use a larger sample and compare firms that do and do not
expense. Based on Fortune 1000 firms during 1997-1999, Fich and Shivdasani (2004)
find that firms with director stock option plans have higher market to book ratios, higher
profitability (as proxied by operating return on assets, return on sales and asset turnover),
and they document a positive stock market reaction when firms announce stock option
plans for their directors. In contrast, we find no evidence that operating performance or
firm valuation is positively related either to stock option expensing or to directors
receiving some or all of their fees in stock.
Gompers, Ishii and Metrick (2003) [hereafter GIM] use Investor Responsibility
Research Center (IRRC) data, and conclude that firms with fewer shareholder rights have
lower firm valuations and lower stock returns. GIM classify 24 governance factors into
five groups: tactics for delaying hostile takeover, voting rights, director/ officer
protection, other takeover defenses, and state laws. Most of these factors are anti-
takeover measures so G-Index is effectively an index of anti-takeover protection
(Cremers and Nair 2003) rather than a broad index of governance. These factors are

9
generally confined to only one of the eight ISS categories we use to create Gov-Score:
charters/bylaws. Table 1 provides a complete list of the 51 factors underlying Gov-Score.
Nine factors are common to Gov-Score and G-Index. The shorthand titles GIM use in
their Table I along with the corresponding factor and category in our Table 1 are:
(1) Blank check [6th factor in Charter/Bylaws],
(2) Bylaws [4th and 7th factors in Charter/Bylaws],
(3) Charter [4th factor in Charter/Bylaws],
(4) Classified board [11th factor in Board of Directors],
(5) Cumulative voting [15th factor in Board of Directors],
(6) Poison pill [2nd factor in Charter/Bylaws],
(7) Special meeting [3rd factor in Charter/Bylaws],
(8) Supermajority [1st factor in Charter/Bylaws], and
(9) Written consent [5th factor in Charter/Bylaws].
--------------------------
Insert Table 1 here
--------------------------
The shorthand titles of the other 15 IRRC factors constituting G-Index are (see
Appendix 1 of GIM): antigreenmail / antigreenmail law, business combination law, cash-
out law, compensation plans, contracts, directors’ duties / directors’ duties law, fair price
/ fair price law, golden parachutes, indemnification, liability, pension parachutes, secret
ballot, severance, silver parachutes, and unequal voting. The sole factor in Gov-Score
that is in the ISS state of incorporation category, incorporation in a state without any anti-

10
takeover provisions, encompasses four IRRC state-law factors: cash-out law, control
share acquisition law, directors’ duties law, and fair price law.
III. DATA AND METHODOLOGY Sample Selection
We create a summary metric, Gov-Score, to measure the strength of a firm’s
governance.5 We compute Gov-Scores for 2,327 individual firms as of February 1, 2003
using data obtained from Institutional Shareholder Services (ISS).6 We code 51 factors
as either 1 or 0 depending on whether the firm’s governance standards are minimally
acceptable.7 We then sum each firm’s 51 binary variables to derive Gov-Score.8 In
theory, Gov-Score ranges from 0 to 51, but it ranges from 13 to 38 for our sample, with a
mean value of 22.50 and a standard deviation of 3.45.
We obtain data from Compustat on firm-specific performance for the 2002 fiscal
year end. We winsorize extreme (1st and 99th) percentiles of the distribution for all of our
5 G-Index is constructed to be positively related to the strength of a firm’s presumed dictatorship. In contrast, Gov-Score is constructed to be positively related to the strength of a firm’s presumed governance. 6 ISS began collecting firm-specific corporate governance data from firms’ proxy statement in mid 2002, and it expanded the number of governance factors it collected in late January 2003. One advantage of using February 1, 2003 is that it precedes the effective dates of both the relevant Sarbanes-Oxley provisions and those enacted by the major U.S. stock exchanges. 7 ISS provides 61 individual measures and three combination measures. We omit combination factors and we separate one charter/bylaws provision into two (poison pill and blank check preferred stock). We omit ten provisions applying to a subset of firms; four in the charter/bylaws category (poison pill with TIDE provision, poison pill with sunset provision, poison pill with a qualified offer clause, and poison pill has trigger threshold), and six in the state of incorporation category (not incorporated in a state with a control share acquisition statute or company opted out, not incorporated in a state with a control share cash-out statute or company opted out, not incorporated in a state with a freeze-out provision or company has opted out, not incorporated in a state with a fair price provision or company has opted out, not incorporated in a state with state stakeholder laws or company opted out, and not incorporated in a state that endorses poison pills). For consistency with GIM, we omit the ISS provision for dual class capital structure (charter/bylaws category). We include all of the ISS factors for six of the eight ISS categories: audit, board of directors, director education executive and director compensation, ownership, and progressive practices. 8 ISS does not code their data as representing minimally acceptable governance but they provide sufficient information to enable one to do so. We determine whether or not a firm’s governance is acceptable (coded 1) or unacceptable (coded 0) by perusing the detailed ISS data and the information provided in its book, ISS Corporate Governance: Best Practices User Guide and Glossary (2003).

11
performance measures and adjust them by their ISS industry means.9 We consider six
performance measures spread across three categories: operating performance, valuation
and shareholder payout. We select the three operating performance measures examined
by GIM, return on equity, profit margin and sales growth; Tobin’s Q, the single valuation
measure considered by GIM and by other economics, finance and law researchers (e.g.,
Demsetz and Lehn 1985; Morck, Shleifer and Vishny 1988; Bebchuk and Cohen 2003;
Bebchuk, Cohen and Ferrell 2004); and two measures of shareholder payout, dividend
yield and share repurchases, respectively used by Fenn and Liang (2001) and Dittmar
(2000). Appendix A shows precisely how we calculate our performance measures.
-----------------------------
Insert Appendix A here
-----------------------------
Table 1 shows the percent of sample firms with minimally acceptable governance
standards for our 51 corporate governance factors. We present this information for all ISS
governance categories, and we list factors in a category in decreasing order of the percent
of firms with minimally acceptable governance. An example of a factor with minimally
acceptable governance from each category follows:
1. Audit: Consulting fees paid to auditors are less than audit fees paid to auditors.
2. Board of directors: Board is controlled by more than 50% independent outside
directors.
3. Charter/bylaws: Company either has no poison pill or a pill that was shareholder
approved.
9 ISS defines 23 unique industry groups.

12
4. Director education: At least one member of the board has participated in an ISS-
accredited director education program.
5. Executive and director compensation: Directors receive all or a portion of their
fees in stock.
6. Ownership: All directors with more than one year of service own stock.
7. Progressive practices: Mandatory retirement age for directors exists.
8. State of incorporation: Firm is incorporated in a state without any anti-takeover
provisions.
Over 90 percent of sample firms have minimally acceptable governance for one or
more of nine factors, including no interlocking directors on the compensation committee
(98.41%), no option re-pricing in the past three years (95.19%), and all directors with
more than one year of service own stock (93.94%). In contrast, less than ten percent of
sample firms have minimally acceptable governance for one or more of 18 factors,
including existence of a mandatory retirement age for directors (7.56%), firm expenses
stock options (1.76%), and firm has a formal policy on auditor rotation (0.90%).
Methodology
We begin with two types of cross-sectional analyses. We first correlate Gov-
Score with each industry-adjusted fundamental variable using Pearson and Spearman
correlations. We then order Gov-Scores from highest to lowest (i.e., from best to worst
governance), and see if firm performance differs in the extreme governance deciles. For
example, when we examine return on equity, we compare industry-adjusted return on
equity for firms in the top Gov-Score decile with those in the bottom decile, and we use a
t-test to determine if the mean values of return on equity in the top and bottom deciles of

13
Gov-Scores differ significantly. To assess which categories and factors are associated
with expected/unexpected (good/bad) performance, we correlate the six performance
measures with the eight governance categories and 51 governance factors. We consider a
category or a factor to be associated with good/bad (expected/unexpected) performance if
it is positive/negative and significant at the 10% level or better using a one-tailed test.
IV. GOV-SCORE AND FIRM PERFORMANCE
Table 2 presents Pearson and Spearman correlations between Gov-Score and firm
performance. Excepting sales growth, all of the performance measures are significant
with their expected positive signs for at least one of the correlations, and aside from stock
repurchases (which has an insignificant Pearson), for both of them. The positive Pearson
correlations range from a low of 0.02766 (stock repurchases) to a high of 0.12596
(dividend yield), while the positive Spearman correlations range from a low of 0.06694
(net profit margin) to a high of 0.11054 (Tobin’s Q).
In contrast to GIM, who do not find a significant correlation between G-Index and
either return on equity or Tobin’s Q (see their Tables V and IX), we show that Gov-Score
is positively related to both of these performance measures.10 We also show that better
governed firms have higher dividend yields and more share repurchases, two
performance measures not considered by GIM. However, in contrast to GIM, we do not
find better-governed firms to have higher sales growth. Rather we find a negative
relation between Gov-Score and sales growth, which is significant using Pearson but not
Spearman correlations. However, its magnitude of 0.03202 is smaller than that of any of
10 While operating return on assets may be a better measure than return on equity (Barber and Lyon 1996; Core et al. 2004), we use return of equity in order to provide comparable results to GIM. We obtain qualitatively similar results using return on assets, namely the Pearson and Spearman correlations between Gov-Score and return on assets are 0.07054 (p-value = 0.0007) and 0.06948 (p-value = 0.0009).

14
the nine positive and significant correlations in the table. Moreover, Copeland, Koller
and Murrin (2000), Core, Guay and Rusticus (2004), and Palepu, Healy and Bernard
(2000) argue that sales growth is a poor indicator of operating performance for loss firms,
so we consider sales growth to be the least reliable of our six performance measures.
---------------------------
Insert Table 2 here
---------------------------
Table 3 shows the mean performance of each measure by decile sorted in
decreasing order of Gov-Score. By construction, the mean Gov-Score in a decile is about
the midpoint of the decile’s Gov-Score. For example, in the analysis of return on equity,
mean Gov-Scores for the top three Gov-Score deciles are 29.353, 26.126 and 24.668,
while those for the bottom three deciles are 17.111, 19.116 and 20.216. Table 3 reveals
significant differences in performance between the top and bottom deciles of Gov-Score
of the expected direction for four performance measures. Firms in the top and bottom
deciles of Gov-Score have:
(1) Return on equity that is 9.244% above (6.806% below) the industry
average, for a spread of 16.050% (significant at the 1% level).
(2) Net profit margin that is 45.997% above (19.518 below) the industry
average, for a spread of 65.515% (significant at the 1% level).
(3) Sales growth that is 3.544% below (0.059% below) the industry
average, for a spread of -3.485% (insignificant).
(4) Tobin’s Q that is 0.104 above (0.267 below) the industry average, for a
spread of 0.371 (significant at the 1% level).

15
(5) Dividend yield that is 0.424% above (0.232% below) the industry
average, for a spread of 0.656% (significant at the 1% level).
(6) Stock repurchases that are 0.014% below (0.018% below) the industry
average, for a spread of 0.004% (insignificant).
---------------------------
Insert Table 3 here
----------------------------
In summary, the Table 2 and Table 3 results reveal that firms with better
governance, as measured via larger Gov-Scores, have higher returns on equity, higher
profit margins, are more valuable, pay out more cash dividends, and repurchase more
shares from their shareholders. In contrast, firms with poorer governance, as measured
via lower Gov-Scores, have lower returns on equity, lower profit margins, are less
valuable, pay out less cash dividends, and repurchase fewer shares.
V. CATEGORIES AND FACTORS ASSOCIATED WITH FIRM PERFORMANCE
Categories Associated with Firm Performance
Table 4 shows the association of the eight governance categories with our six
performance measures. Return on equity is positively associated with six governance
categories and five of them are significant (state of incorporation is the exception).
Return on equity has a negative and significant relation with the other two categories,
audit and charter/bylaws. Net profit margin also is positively associated with six
categories and four of them are significant (ownership and state of incorporation are the
exceptions). Similar to the return on equity results, net profit margin has a negative and
significant relation with the other two categories, audit and charter/bylaws. Sales growth

16
is positively associated with four categories but none of the relations are significant.
Sales growth is negatively and significantly associated with both board of directors and
ownership.
Tobin’s Q is positively associated with seven categories but only two of them are
significant, i.e., the anti-takeover categories, charter/bylaws and state of incorporation.
Interestingly, the principal ISS anti-takeover category, charter-bylaws, is negatively
associated with both return on equity and net profit margin, and, as we will soon
demonstrate, both stockholder payout measures.11 Director education has the ‘wrong’
sign but its magnitude is tiny (0.00349) and the correlation is insignificant.
Dividend yield is positively associated with five categories and all the correlations
are significant. Regarding the other three categories, charter/bylaws is the only one that
has a negative and significant relation with dividend yield. Similarly, share repurchases
is positively associated with five categories but only two of them, board of directors and
progressive practices, are significant. Regarding the other three categories, audit and
charter/bylaws have a negative and significant relation with share repurchases.
Summary Analysis of Categories Associated with Firm Performance
The Table 4 results confirm with those in Table 3 that governance is related to
firm performance. With the exception of sales growth that has the ‘correct’ sign half of
the time, the other correlations have the expected (positive) sign the majority of the time
(7 of 8 for Tobin’s Q; 6 of 8 for both return on equity and net profit margin; and 5 of 8
for both dividend yield and share repurchases). Based on 48 comparisons (eight
categories times six performance measures), the correlations are positive 68.75% of the
11 Recall from Table 1 that seven of the 51 factors underlying Gov-Score fall in the charter/bylaws category whereas only one factor falls in the state of incorporation category.

17
time (33 times). And with two exceptions, sales growth and share repurchases, when the
correlations are significant, they are positive most of the time (5 of 6 for dividend yield, 5
of 7 for return on equity, 4 of 6 for net profit margin, and 2 of 2 for Tobin’s Q). In the
cases of sales growth and share repurchases, the significant correlations are positive 0 of
2 and 2 of 4 times, respectively. For the six performance measures as a group, the
correlations are positive two-thirds of the time (18/27) when they are significant. Thus,
our results indicate that good governance (based on categories) is related to good
performance the vast majority of the time.
Our results for specific governance categories can be summarized as follows
(presented in decreasing order of their conformance with expected performance):
1. Executive and director compensation is positively correlated with all
six performance measures and the relation is significant three times.
2. Progressive practices, board of directors, director education, and
ownership, and are positively correlated with five of the performance
measures and the relation is significant four, four, three, and two times,
respectively. Director education and progressive practices are not
significant when they have the ‘wrong’ sign; both board of directors
and ownership are significant with a negative sign once.
3. State of incorporation has its expected positive sign four times, once
with significance. It is never significant with the ‘wrong’ sign.
4. Audit has a positive sign only twice, and it is never significant with the
expected positive sign. In contrast, it is significant three of the four
times that it has a negative sign.

18
5. Charter/bylaws, which lie at the heart of the widely used G-Index, has
a positive sign only once. Consistent with Bebchuk and Cohen (2004),
and Bebchuk et al. (2004), it is significant with its expected sign for
Tobin’s Q. However, it has the right sign least often of any of the eight
categories and it has a significant coefficient of the wrong sign most
often (i.e., four times).
--------------------------
Insert Table 4 here
--------------------------
Factors Associated with Firm Performance
Table 5 shows the association of the 51 governance factors with performance.
Thirty-seven factors are positively associated with return on equity and 26 are significant.
The three factors with positive signs possessing the largest correlations are option burn
rate of less than 3 percent of outstanding shares, governance committee that meets
annually, and independent nominating committee.12 The three factors with unexpected
(negative) signs that have the largest correlations are: consulting fees paid to auditors are
less than audit fees paid to auditors, company does not have a poison pill or it has a
shareholder approved pill, and a simple majority vote is required to approve a merger
(not a supermajority). Five of the nine factors that are significantly negatively associated
with return on equity are in the charter/bylaws category, helping to explain why return on
equity is significantly negatively associated with charter/bylaws (see Table 4).
Nineteen of the 34 factors that are positively associated with net profit margin are
significant while only seven of the 17 factors that are negatively associated with net profit 12 For parsimony, we limit discussion to the three most important factors for each performance measure.

19
margin are significant. The three factors with positive signs that have the largest
correlations with net profit margin are the same ones shown for return on equity, namely
option burn rate of less than 3 percent of outstanding shares, governance committee that
meets annually, and independent nominating committee. Also similar to the return on
equity findings, the three factors with negative signs and the largest correlations are
consulting fees paid to auditors are less than consulting fees paid to auditors, simple
majority vote is required to approve a merger (not a super-majority), and firm does not
have a poison pill or it has one that was shareholder approved. Moreover, three of the
seven factors that are significantly negatively associated with net profit margin are in the
charter/bylaws category, helping to explain why net profit margin is significantly
negatively associated with charter/bylaws.
Only four of the 21 factors that are positively associated with sales growth are
significant, while 12 of the 30 factors that are negatively associated with sales growth are
significant. The three factors with positive signs that have the largest correlations with
sales growth are option re-pricing did not occur within the last 3 years, company does not
have a poison pill or it has a pill that was shareholder approved, and no former CEO
serves on the board. The three factors with negative signs and the largest correlations are
the CEO and chairman duties are separated or a lead director is specified, governance
committee meets at least annually, and all directors with more than one year of service
own stock. Once again it is evident that the relation of sales growth to corporate
governance is much different than that based on any of our other performance measures.
Nine of the 34 governance factors positively associated with Tobin’s Q are
significant, while only three of the 17 factors that are negatively associated with Tobin’s
20
Q are significant. The three most highly associated factors with a positive sign is whether
board members are elected annually (i.e., no staggered board), firm lacks a poison pill or
it has one that was shareholder approved, and firm has s a low option burn rate. The two
most important governance factors for Tobin’s Q are among the six IRRC factors stressed
by Bebchuk et al. (2004). The three significant factors with a negative sign are board is
controlled by more than 50% independent outside directors (independent board),
company is not authorized to issue blank check preferred stock, and directors receive all
or a portion of their fees in stock.
Twenty-five of the 35 factors that are positively associated with dividend yield are
significant, while ten of the 16 factors that are negatively associated with dividend yield
are significant. All four factors in the ownership category and all seven in the
progressive practices category are amongst the 24 factors that are positive and significant,
helping to explain why both of these categories are positively associated with dividend
yield. Executives subject to stock ownership guidelines is the most highly associated
factor with its expected sign, followed by governance committee that meets annually, and
mandatory retirement age for directors. The three most highly associated factors with a
negative sign are a simple majority is required to approve a merger (not a supermajority),
shareholders may act by written consent and the consent is non-unanimous, and company
either has no poison pill or a pill approved by the shareholders. All of these factors are in
the charter/bylaws category, helping to explain why this category is negatively associated
with dividend yield.
Thirteen of the 33 factors that are positively associated with share repurchases are
significant, while only seven of the 18 factors that are negatively associated with share

21
repurchases are significant. An independent board of directors is the most highly
associated factor with a positive sign, followed by governance committee meets annually,
and board has outside advisors. The three most highly associated factors with a negative
sign are consulting fees to auditors are less than audit fees paid to auditors, managers
respond to shareholder proposals within 12 months of shareholder meeting, and board
members are elected annually.
--------------------------
Insert Table 5 here
--------------------------
Summary of Factors Associated with Firm Performance
Our Table 5 results confirm our Tables 3 and 4 findings that governance is related
to performance. There are 306 factor-performance combinations (51 governance factors
multiplied by six performance measures). One hundred ninety four of the factors have
their expected signs so we obtain the expected result 63.40% of the time. Similarly, of
the 144 cases of significance, 96 have their expected signs, so when the results are
significant, they are as expected 66.67% of the time. Thus, our results indicate that good
governance (based on factors) is related to good performance the vast majority of the
time.
Thirteen factors have a positive and significant correlation with at least four of the
six performance measures, making them the governance factors that are most closely
linked to expected performance:
1. All directors attended at least 75% of board meetings or had a valid
excuse for non-attendance (positive sign for all performance measures),

22
2. Board is controlled by more than 50% independent outside directors
(independent board; in top three for share repurchases),
3. Nominating committee is comprised solely of independent outside
directors (in top three for both return on equity and net profit margin),
4. Governance committee that meets at least annually (in top three for
return on equity, net profit margin, dividend yield and share
repurchases),
5. Board guidelines are in each proxy statement,
6. Option re-pricing did not occur during the last three years (top three for
sales growth),
7. Option burn rates is less than 3% per year (top three for return on
equity, net profit margin, and Tobin’s Q),
8. Option re-pricing is prohibited,
9. Executives are subject to stock ownership guidelines (top three for
dividend yield),
10. Directors are subject to stock ownership guidelines,
11. Mandatory retirement age for directors exists (top three for dividend
yield),
12. Performance of the board is reviewed regularly, and
13. Board has outside advisors (top three for share repurchases).
Seven governance factors have a negative and significant correlation with three of
the six performance measures. The linkage between performance and these factors can be
interpreted as either the factors represent poor, rather than good governance, or they

23
represent good governance but our results are peculiar to our particular sample, time
period, and/or performance measures. Regardless of their interpretation, we consider
these seven factors to be most closely linked to unexpected performance:
1. Consulting fees paid to auditors are less than audit fees paid to auditors,
2. Managers respond to shareholder proposals within 12 months of shareholder
meeting,
3. Board members are elected annually (no staggered board),
4. A simple majority vote is required to approve a merger (not a supermajority),
5. Company either has no poison pill or a poison pill that was shareholder
approved,
6. A majority vote is required to amend charter/bylaws (not a supermajority),
and
7. All directors with more than one year of service own stock.
Two factors deserve additional discussion. Much of the literature that relates
corporate governance to firm performance has focused on Tobin’s Q (GIM; Bebchuk and
Cohen 2004; Bebchuk et al. 2004; Yermack 1996). Bebchuk et al. (2004) identify six of
the 24 IRRC governance factors as being most highly associated with Tobin’s Q. We
confirm their results using 51 ISS factors, showing that absence of: (1) a staggered board
and (2) a poison pill are the two most important factors for Tobin’s Q. However, we also
show that absence of a staggered board and absence of a poison pill are significantly
negatively related to most of our other performance measures. Firms with staggered
boards have higher net profit margins, higher dividend yields, and higher share

24
repurchases. Firms with poison pills have higher returns on equity, higher net profit
margins, higher dividend yields, and more share repurchases.
All performance indicators measure firm performance imprecisely. Because
measurement errors in performance indicators are not perfectly correlated, one should
examine several performance measures rather than drawing definitive conclusions by
focusing on only one of them. One should not definitively conclude that absence of a
staggered board and a poison pill are associated with good firm performance unless one
contends that firm value is the only reliable measure of firm performance, that Tobin’s Q
is the only reliable measure of firm value, and that the researchers’ measure of Tobin’s Q
is precise.
VI. THE ASSOCIATION OF FIRM PERFORMANCE WITH GOV-SCORE VERSUS G-INDEX
Gov-Score is a broad measure of corporate governance comprised of both
external and internal governance mechanisms, whereas G-Index is based mostly on anti-
takeover measures (Cremers and Nair 2003). Holmstrom and Kaplan (2001) argue that
anti-takeover measures are less important in recent years as disciplining forces on
managerial behavior, so Gov-Score is likely to be more highly associated with
performance than is G-Index. To examine how Gov-Score compares with G-Index in
their relationships with firm performance, we identify firms with valid Gov-Scores and
G-Indices, where the two summary metrics measure governance at about the same point
in time.
Of the 1,894 firms in GIM with a valid G-index for the year 2002, we retain 1,010
firms with a valid Gov-Score.13 Because both summary metrics measure governance
13 213 firms lacked Compustat data and 671 lacked Gov-Scores.
25
with error and because Gov-Score increases in good governance while G-Index decreases
in good governance, we expect the two summary metrics to be negatively correlated.
Indeed, they are (Pearson = -0.094, p-value = 0.0028), but the relation is modest,
consistent with our contention that Gov-Score and G-Index measure rather different
aspects of corporate governance.
Table 6 presents correlations of our six performance measures with both Gov-
Score and G-index. Our first three performance measures, return on equity, net profit
margin and sales growth, are the same three operating performance measures used by
GIM, and our fourth performance measure, Tobin’s Q, is the GIM valuation measure so
comparisons of our first four performance measures are biased in favor of G-Index,
GIM’s summary index.
If, as we expect, good governance is associated with good performance, Gov-
Score (G-Index) should be positively (negatively) associated with firm performance. As
expected, Gov-Score is significantly and positively related to return on equity using both
Pearson and Spearman correlations. Unexpectedly, G-Index is significantly and
positively related to return on equity using both correlations. As expected, Gov-Score is
significantly and positively related to net profit margin using both correlations. Also
unexpectedly, G-Index is positively related to net profit margin, a result that is significant
using Pearson correlations. Unexpectedly, Gov-Score is unrelated to sales growth but as
expected, G-Index is significantly and negatively related to this performance measure.
As expected, Gov-Score is significantly and positively related to Tobin’s Q using
both correlations. Unexpectedly, but consistent with the results in GIM’s own Table V,
Tobin’s Q is insignificantly associated with G-Index. As expected, Gov-Score is

26
significantly and positively related to dividend yield using both correlations.
Unexpectedly, G-Index is significantly and positively related to dividend yield using both
correlations. As expected, Gov-Score is significantly and positively related to stock
repurchases using both correlations but unexpectedly, G-Index is not significantly and
negatively related to stock repurchases using either correlation. Indeed, the relation
between G-Index and share repurchases is significant with the ‘wrong’ sign based on
Spearman correlations.
It is evident that Gov-Score is more highly associated with expected performance
than is G-Index. Based on both Pearson and Spearman correlations, Gov-Score is
significantly and (as expected) positively related to five of our six performance measures,
and when Gov-Score has the wrong sign (sales growth), the relation is insignificant. G-
Index is significantly and (as expected) negatively related to only one performance
measure, sales growth. G-Index is significant with the wrong sign twice (return on equity
and dividend yield) using both Pearson and Spearman correlations; it is significant with
the wrong sign for net profit margin using Pearson correlations; it is significant with the
wrong sign for stock repurchases using Spearman correlations; and it is insignificant for
Tobin’s Q using both Pearson and Spearman correlations.
--------------------------
Insert Table 6 here
--------------------------
VII. MULTIVARIATE ANALYSES
The evidence presented to this point is based on univariate analyses. We now
provide multivariate evidence on the association between Gov-Score and performance.

27
When GIM related operating performance to G-Index, they controlled for the log of the
book-to-market ratio, and when they related Tobin’s Q to G-Index, they controlled for the
log of assets, the log of firm age, a dummy variable for inclusion in the S&P 500 index,
and a dummy variable for incorporated in Delaware. We now repeat all analyses for
operating performance and Tobin’s Q by including the control variables that they use. We
also repeat our analyses for dividend yield and stock repurchases controlling for the log
of the book-to-market ratio, the log of assets and the log of firm age.
Table 7 provides the results. When the control variables are significant, they have
intuitively appealing signs. Sales growth is negatively related to the log of the book-to-
market ratio; Tobin’s Q is negatively related to asset size and positively related to the
S&P 500 dummy; dividend yield is positively related to asset size and firm age; and stock
repurchases is positively related to asset size. More importantly, our results for the
performance measures are qualitatively identical in Tables 2 and 7. Regardless of
whether we conduct univariate or multivariate analyses, firms with higher Gov-Scores
have higher returns on equity, higher profit margins, are more valuable, pay out more
cash dividends, and repurchase more shares from their shareholders. In contrast, firms
with lower Gov-Scores have lower returns on equity, lower profit margins, are less
valuable, pay out less cash dividends, and repurchase fewer shares.
--------------------------
Insert Table 7 here
--------------------------

28
VIII. SUMMARY AND IMPLICATIONS
We relate corporate governance to firm performance using 2,327 firms based on
51 corporate governance provisions provided by Institutional Investor Services (ISS) as
of February 1, 2003. We consider six performance measures from three categories:
operating performance (return on equity, profit margin, and sales growth), valuation
(Tobin’s Q), and shareholder payout (dividend yield and share repurchases).14 We create
a broad summary measure of corporate governance, Gov-Score, which sums 51 corporate
governance factors where each factor is coded 1 (0) if it does (not) represent minimally
acceptable governance. The 51 factors we consider cover eight governance categories:
audit, board of directors, charter/bylaws, director education, executive and director
compensation, ownership, progressive practices, and state of incorporation.
We show how often our sample firms meet each of 51 minimum governance
standards. Ninety-five percent or more of our sample firms meet at least one of five
governance provisions, including no interlocks exist among compensation committee,
and directors and the CEO serves on two or fewer boards of other public companies.
Ninety-five percent or more of our sample firms fail to meet at least one of 12 minimum
governance standards, including incorporation in a state without any anti-takeover
provisions, firm does not expense stock options, firm has no formal policy on auditor
rotation, and firm has no policy requiring outside directors to serve on, at most, five
additional boards.15
14 See Appendix A for their definitions. 15 Given the small within-sample variability of occurrence of these measures, it is not surprising that we find many factors to be unrelated to firm performance. However, not all factors adhered to by few firms are unimportant for facilitating firm performance. For example, Table 5 reveals that board guidelines included in each proxy statement are associated with five of our six performance measures. Table 1 shows that this factor occurs in our sample only 4.98% of the time.

29
With the exception of sales growth, all of our firm performance measures have
their expected positive relation with Gov-Score and are significant in our correlation
analysis (Table 2), decile analysis (Table 3), or both, suggesting that firms with relatively
poor governance are relatively less profitable (lower return on equity and profit margin),
less valuable (smaller Tobin’s Q), and pay out less cash to their shareholders (lower
dividend yield and smaller stock repurchases).
We correlate each of our six firm performance measures with each of the eight
governance categories. We find that the governance category, executive and director
compensation, is most highly associated with good performance while the governance
category, charter/bylaws, is least highly associated with good performance. The
charter/bylaws category is a major determinant of G-Index, while the executive and
director compensation category is a minor determinant of G-Index, suggesting that firm
performance is likely to be more highly correlated with Gov-Score than with G-Index.
We correlate each of the six firm performance measures with the 51 corporate
governance factors. We find that the 13 factors associated most often with good
performance are all directors attended at least 75% of board meetings or had a valid
excuse for non-attendance, board is controlled by more than 50% independent outside
directors, nominating committee is independent, governance committee meets once a
year, board guidelines are in each proxy statement, option re-pricing did not occur in the
last three years, option burn rate is not excessive, option re-pricing is prohibited,
executives are subject to stock ownership guidelines, directors are subject to stock
ownership guidelines, mandatory retirement age for directors exists, performance of the
board is reviewed regularly, and board has outside advisors.

30
We identify seven factors that are associated most often with bad performance,
namely, consulting fees paid to auditors are less than audit fees paid to auditors,
managers respond to shareholder proposals within 12 months of shareholder meeting,
board members are elected annually (no staggered board), a simple majority vote is
required to approve a merger (not a super-majority), company either has no poison pill or
a pill that was shareholder approved, a majority vote is required to amend charter/bylaws
(not a super-majority), and all directors with more than one year of service own stock.
For a 1,010 firm sub-sample for which we can obtain both Gov-Score and G-
Index, we show that expected performance is relatively more highly associated with Gov-
Score than it is with G-Index. While better governance as measured by Gov-Score is
associated with better performance for five of our performance measures (sales growth is
the exception), better governance as measured by G-Index is associated with better
performance for only one of our performance measures, sales growth. Indeed, we find
that better governance as measured by G-Index is associated with poor performance for
four performance measures (i.e., return on equity, net profit margin, dividend yield and
share repurchases) based on Pearson correlations, Spearman correlations, or both. Gov-
Score is better linked to performance than is G-Index because it is a broader index that is
focused on many important governance factors ignored by G-Index. We confirm the
GIM findings of the importance of removing takeover defenses for enhancing firm value
by showing that charter/bylaws is positively related to Tobin’s Q, but we also show that
charter/bylaws is negatively related to four other performance measures we consider.
Our results are relevant to the Sarbanes-Oxley Act and the major governance
reforms mandated by the major U.S. stock exchanges. The Sarbanes-Oxley Act of 2002

31
legislated many governance reforms, including provisions for auditors not providing most
non-audit services to clients and requiring firms’ audit committees to be completely
independent.16 Based on our findings that the governance factor, consulting fees paid to
auditors is less than audit fees paid to auditors, is highly associated with poor
performance, the first reform may actually harm firm performance. In late 2003, the SEC
approved several governance reforms proposed by the American Stock Exchange
(AMEX), the New York Stock Exchange (NYSE), and the Nasdaq Stock Market
(NASDAQ).17 All three exchanges require boards to have a majority of outside
independent directors, and firms to have independent processes for nominating directors.
NYSE requires that firms have a solely independent nominating committee, whereas
NASDAQ and AMEX require that nominations at least be made by a majority of
independent board directors. Similarly, NYSE requires firms to have compensation
committees comprised solely of independent directors, whereas NASDAQ and AMEX
require that compensation at least be determined by a majority of independent board
directors. We find that independent board of directors, nominating committees, and
compensation committees are associated with good firm performance, suggesting that
these exchange requirements may facilitate good performance. Regulators may wish to
consider requiring the presence of a separate corporate governance committee that meets
at least once a year and a provision limiting a firm’s option burn rate, two governance
factors we find to be highly related to good performance.
16 These two provisions went into effect May 6, 2003 (or after for contracts already in existence) and April 25, 2003 (though technically listed issuers are required to comply with the last provision by the earlier of their first annual shareholders meeting after January 15, 2004, or October 31, 2004), respectively. 17 The reforms proposed by NYSE and NASDAQ were approved by the SEC on November 4, 2003 (see http://www.sec.gov/rules/sro/34-48745.htm), while the reforms proposed by AMEX were approved by the SEC on December 1, 2003 (http://www.amex.com/atamex/news/34-48863_Approval_Order_on_Amex-2003-65.pdf).

32
We close with some caveats. First, we construct Gov-Score by summing 51
governance factors classified in a binary manner, a procedure that is ad hoc and that does
not maximize the linkage between performance and governance.18 Nevertheless, our
method is similar to that of GIM, who summed up 24 governance factors to derive their
widely used G-Index. Second, we relate corporate governance to firm performance on a
single calendar day so our results may not pertain to other points in time.19 Unfortunately,
we have no choice given the newness of the ISS database, and the fact that governance
data are very sticky over short time periods (Core et al. 2004; Gompers et al. 2003).
Third, we examined only six performance measures, albeit ones representing three
different aspects of performance. If we selected other performance measures, we likely
would find some changes in the factors we found to be most highly related to
expected/unexpected performance. Fourth, governance is advocated for reasons aside
from firm performance, such as fairness, equity, and appearance of propriety. Some
factors we do not find to be related to firm performance may be important for other
purposes. Finally, we associate corporate governance with firm performance, but our
results do not necessarily imply causality. Our caveat regarding absence of causality is
consistent with other studies (e.g., Larcker et al. 2004) that recognize the impossibility of
solving the endogeneity issue, especially given the very limited ISS temporal data. Far
more temporal data are needed before one can attempt to infer causality from the ISS
data, perhaps by using Granger causality.
18 Based on our evidence that 15 governance factors are not positively and significantly associated with any of our six performance measures, we could easily derive a summary governance measure that is more highly correlated with firm performance by dropping these 15 factors. In un-tabulated results, we obtain higher correlations when we construct a summary governance measure by omitting these 15 factors. 19 Use of a single time period is common in this literature (Ashbaugh et al. 2004; Larcker et al. 2004).

33
REFERENCES
Agrawal, A., and S. Chadha. 2005. Corporate governance and accounting scandals.
Journal of Law and Economics (Forthcoming).
Anderson, R., S. Mansi, and D. Reeb. 2004. Board characteristics, accounting report
integrity, and the cost of debt. Journal of Accounting and Economics 37 (September):
315-342.
Arnott, R., and C. Asness. 2003. Surprise! Higher dividends = Higher earnings growth.
Financial Analysts Journal 59 (January/February): 70-87.
Ashbaugh, H., D. Collins, and R. LaFond. 2004. The effects of corporate governance on
firms’ credit ratings. Working Paper, University of Iowa.
Ashbaugh, H., R. Lafond, and B. Mayhew. 2003. Do non-audit services compromise
auditor independence? Further evidence. Accounting Review 78 (July): 611-639.
Barber, B., and J. Lyon. 1996. Detecting long-run abnormal operating performance: The
empirical power and specification of test statistics. Journal of Financial Economics 41
(July): 359-399.
Baysinger, B., and H. Butler. 1985. Corporate governance and board of directors:
Performance effects of changes in board composition. Journal of Law, Economics and
Organization 1 (Spring): 101-124.
Bebchuk, L., and A. Cohen. 2004. The costs of entrenched boards. NBER Working Paper
10587.
Bebchuk, L., A. Cohen, and A. Ferrell. 2004. What matters in corporate governance?
Working Paper, Harvard Law School.

34
Bergstresser, D., M. Desai, and J. Rauh. 2004. Earnings manipulation, pension
assumptions and managerial investment decisions. Working Paper, Harvard University.
Bhagat, S., and B. Black. 2002. The non-correlation between board independence and
long-term firm performance. Journal of Corporation Law 27 (Winter): 231-274.
Bhattacharya, U., and A. Dittmar. 2002. Costless versus costly signaling in capital markets: Theory and evidence from share repurchases. Working Paper, Indiana University. Botosan, C., and M. Plumlee. 2001. Stock option expense: The sword of Damocles revealed. Accounting Horizons 15 (December): 311-327. Bowen, R., S. Rajgopal, and M. Venkatachalam. 2004. Accounting discretion, corporate
governance and firm performance. Working Paper, University of Washington.
Brickley, J., J. Coles, and R. Terry. 1994. Outside directors and the adoption of poison
pills. Journal of Financial Economics 35 (June): 371-390.
Byrnes, N., P. Dwyer, D. Henry and E. Thornton. September 22, 2003. Reform: Who’s
making the grade; A performance review for CEOs, boards, analysts, and others.
Business Week.
Christoffersen, S., C. Geczy, D. Musto, and A. Reed. 2004. How and why do investors
trade votes, and what does it mean? Working Paper, University of Pennsylvania.
Copeland, T., T. Koller, and J. Murrin. 2000. Valuation: Measuring and managing the
value of companies, (John Wiley and Sons, Inc.).
Core, J., R. Holthausen, and D. Larcker. 1999. Corporate governance, chief executive
compensation, and firm performance. Journal of Financial Economics 51 (March): 371-
406.
35
Core, J., W. Guay, and T. Rusticus. 2004. Does weak governance cause weak stock
returns? An examination of firm operating performance and analysts’ expectations.
Working Paper, University of Pennsylvania.
Cremers, K. J. M., and V. B. Nair. 2003. Governance mechanisms and equity prices.
Working Paper, Yale University.
DeFond, M., R. Hann, and X. Hu. 2004. Does the market value financial expertise on
audit committees of boards of directors? Working Paper, University of Southern
California.
Demsetz, H., and K. Lehn. 1985. The structure of corporate ownership: Causes and
consequences. Journal of Political Economy 93 (December): 1155-1177.
Dittmar, A. 2000. Why do firms repurchase stock? Journal of Business 73 (July): 331-
355.
Donaldson, W. 2003. Congressional testimony concerning the implementation of the
Sarbanes-Oxley Act of 2002.
Easterbrook, F. 1984. Two agency-cost explanations of dividends. American Economic
Review 74 (September): 650-659.
Fama, E., and M. Jensen. 1983. Separation of ownership and control. Journal of Law and
Economics 26 (June): 301-325.
Fenn, G., and N. Liang. 2001. Corporate payout policy and managerial stock incentives.
Journal of Financial Economics 60 (April): 45-72.
Fich, E., and A. Shivdasani. 2004. The impact of stock-option compensation for outside
directors on firm value. Journal of Business (Forthcoming).

36
Fosberg, R. 1989. Outside directors and managerial monitoring. Akron Business and
Economic Review 20 (Summer): 24-32.
Frankel, R., M. Johnson, and K. Johnson. 2002. The relation between auditors’ fees for
non-audit services and earnings management. Accounting Review 77 (Supplement): 71 –
105.
Gompers, P., J. Ishii, and A. Metrick. 2003. Corporate governance and equity prices.
Quarterly Journal of Economics 118 (February): 107-155.
Hermalin, B., and M. Weisbach. 1991. The effects of board composition and direct
incentives on firm performance. Financial Management 20 (Winter): 101-112.
Hermalin, B., and M. Weisbach. 2003. Board of directors as an endogenously determined
institution: A survey of the economic literature. Economic Policy Review 9 (April): 7-26.
Holmstrom, B., and S. Kaplan. 2001. Corporate governance and merger activity in the
United States: Making sense of the 1980s and 1990s. Journal of Economic Perspectives
15 (Spring): 121-144.
ISS Corporate Governance: Best Practices User Guide & Glossary. 2003. Rockville, MD.
Jensen, M. 1986. Agency costs of free cash flow, corporate finance, and takeovers.
American Economic Review 76 (May): 323-329.
Jensen, M. 1993. The modern industrial revolution, exit, and the failure of internal
control systems. Journal of Finance 48 (July): 831-880.
Jensen, M., and W. Meckling. 1976. Theory of the firm: Managerial behavior, agency
costs, and ownership structure. Journal of Financial Economics 3 (October): 305-360.
John, K., and L. W. Senbet. 1998. Corporate governance and board effectiveness. Journal
of Banking & Finance 22 (May): 371-403.

37
Kaplan, S., and L. Zingales. 1997. Do investment-cash flow sensitivities provide useful
measures of financing constraints? Quarterly Journal of Economics 112 (February): 169-
216.
Kinney, W., Z. Palmrose, and S. Scholz. 2004. Auditor independence, non-audit services,
and restatements: Was the U.S. government right? Journal of Accounting Research 42
(June): 561-588.
Klein, A. 2002. Audit committee, board of director characteristics, and earnings
management. Journal of Accounting and Economics 33 (August): 375-400.
Larcker, D., and S. Richardson. 2004. Fees paid to audit firms, accrual choices, and
corporate governance. Journal of Accounting Research 42 (June): 625-658.
Larcker, D., S. Richardson, and I. Tuna. 2004. How important is corporate governance?
Working Paper, University of Pennsylvania.
Leblanc, R., and J. Gillies. 2003. The coming revolution in corporate governance. Ivey
Business Journal 68 (September/October): 1-11.
Lipton, M., and J. Lorsch. 1992. A modest proposal for improved corporate governance.
Business Lawyer 59 (November): 59-77.
Morck, R., A. Shleifer, and R. Vishny. 1988. Management ownership and market
valuation: An empirical analysis. Journal of Financial Economics 20 (March): 293-315.
Palepu, K., P. Healy, and V. Bernard. 2000. Business Analysis and Valuation, Using
Financial Statements, (South Western College Publications).
Rosenstein, S., and J. Wyatt. 1990. Outside directors: Board independence and
shareholder wealth. Journal of Financial Economics 26 (August): 175-191.

38
Shleifer, A., and R. Vishny. 1997. A survey of corporate governance. Journal of Finance
52 (June): 737-783.
Yermack, D. 1996. Higher market valuation for firms with a small board of directors.
Journal of Financial Economics 40 (February): 185-211.

39
TABLE 1: Descriptive Statistics of 51 Corporate Governance Provisions (2,327 firms)
Minimum Governance Standard Percent of firms with minimum governance
standard Audit Audit committee consists solely of independent outside directors. 71.64% Auditors were ratified at the most recent annual meeting. 53.93% Consulting fees paid to auditors are less than audit fees paid to auditors. 53.12% Company has a formal policy on auditor rotation. 0.90%
Board of Directors Managers respond to shareholder proposals within 12 months of shareholder meeting.
99.44%
CEO serves on no more than two additional boards of other public companies.
95.57%
All directors attended at least 75% of board meetings or had a valid excuse for non-attendance.
91.96%
Size of board of directors is at least six but not more than 15 members. 85.60% No former CEO serves on board. 81.87% CEO is not listed as having a “related party transaction” in proxy statement. 76.49% Board is controlled by more than 50% independent outside directors. 73.87% Compensation committee is comprised solely of independent outside directors.
66.18%
The CEO and chairman duties are separated or a lead director is specified. 51.65% Shareholders vote on directors selected to fill vacancies. 43.70% Board members are elected annually. 39.79% Shareholder approval is required to change board size. 28.84% Nominating committee is comprised solely of independent outside directors. 26.77% Governance committee meets at least once during the year. 17.53% Shareholders have cumulative voting rights to elect directors. 6.70% Board guidelines are in each proxy statement. 4.98% Policy exists requiring outside directors to serve on no more than five additional boards.
0.39%
Charter / Bylaws A simple majority vote is required to approve a merger (not a supermajority). 74.47% Company either has no poison pill or a pill that was shareholder approved. 55.22% Shareholders are allowed to call special meetings. 48.69% A majority vote is required to amend charter/bylaws (not a supermajority). 46.07% Shareholders may act by written consent and the consent is non-unanimous. 25.78% Company is not authorized to issue blank check preferred stock. 9.93% Board cannot amend bylaws without shareholder approval or can only do so under limited circumstances.
2.49%

40
Director Education At least one member of the board has participated in an ISS-accredited director education program.
2.75%
Executive and Director Compensation No interlocks exist among directors on the compensation committee. 98.41% Non-employees do not participate in company pension plans. 95.62% Option re-pricing did not occur within last three years. 95.19% Stock incentive plans were adopted with shareholder approval. 92.26% Directors receive all or a portion of their fees in stock. 91.02% Company does not provide any loans to executives for exercising options. 89.82% The last time shareholders voted on a pay plan, ISS did not deem its cost to be excessive.
62.40%
The average options granted in the past three years as a percentage of basic shares outstanding did not exceed 3% (option burn rate).
52.81%
Option re-pricing is prohibited. 20.37% Company expenses stock options. 1.76%
Ownership All directors with more than one year of service own stock. 93.94% Officers’ and directors’ stock ownership is at least 1% but not over 30% of total shares outstanding.
74.77%
Executives are subject to stock ownership guidelines. 9.15% Directors are subject to stock ownership guidelines. 5.67% Progressive Practices Mandatory retirement age for directors exist. 7.56% Performance of the board is reviewed regularly. 6.15% A board-approved CEO succession plan is in place. 4.08% Board has outside advisors. 4.13% Directors are required to submit their resignation upon a change in job status. 3.61% Outside directors meet without the CEO and disclose the number of times they met.
1.16%
Director term limits exist. 0.77%
State of Incorporation Incorporation in a state without any anti-takeover provisions. 3.39%

41
TABLE 2: Correlations of Gov-Score with Six Industry-adjusted Performance Measures
Pearson and Spearman correlations of performance measures with Gov-Scores are presented for measures of operating performance, valuation, and shareholder payout. All performance measures are industry mean adjusted, using the 23 ISS defined industries, after winsorizing the top and bottom 1% of each fundamental’s respective distribution. The fundamental variables are defined in Appendix A. *** (**) (*) indicates significance at 1% (5%) (10%) one tailed level. Bold indicates significant and of the expected direction. Italics indicate significant and of the unexpected direction.
Performance Measure Number of Observations
Expected Direction
Pearson Spearman
Return on Equity 2,072 Positive 0.10234*** 0.09465*** Net Profit Margin 2,210 Positive 0.04913*** 0.06694*** Sales Growth 2,212 Positive -0.03202* -0.01512 Tobin’s Q 1,873 Positive 0.05114** 0.11054*** Dividend Yield 2,282 Positive 0.12596*** 0.09850*** Stock Repurchases 1,664 Positive 0.02766 0.10442***

42
TABLE 3: Decile Means of Six Industry-adjusted Performance Measures Sorted in Descending Order by Gov-Score
Decile Gov-Score Return on Equity
Gov-Score Net Profit Margin
Gov-Score Sales Growth
1 29.353 9.244% 29.253 45.997% 29.253 -3.544% 2 26.126 1.410% 26.032 1.253% 26.036 -4.383% 3 24.668 1.231% 24.629 4.075% 24.631 1.426% 4 23.618 2.122% 23.575 7.137% 23.579 3.492% 5 22.783 0.989% 22.742 0.726% 22.742 -1.976% 6 21.976 -0.075% 21.973 -39.629% 21.968 3.465% 7 21.000 -3.522% 21.000 1.783% 21.000 0.260% 8 20.216 -2.075% 20.190 10.850% 20.189 0.956% 9 19.116 -2.514% 19.041 -12.672% 19.032 0.352%
10 17.111 -6.806% 17.086 -19.518% 17.086 -0.059%
Expected Sign Positive Positive Positive Decile 1 – 10 16.050% 65.515% -3.485% Significance
level 1% 1% Insignificant
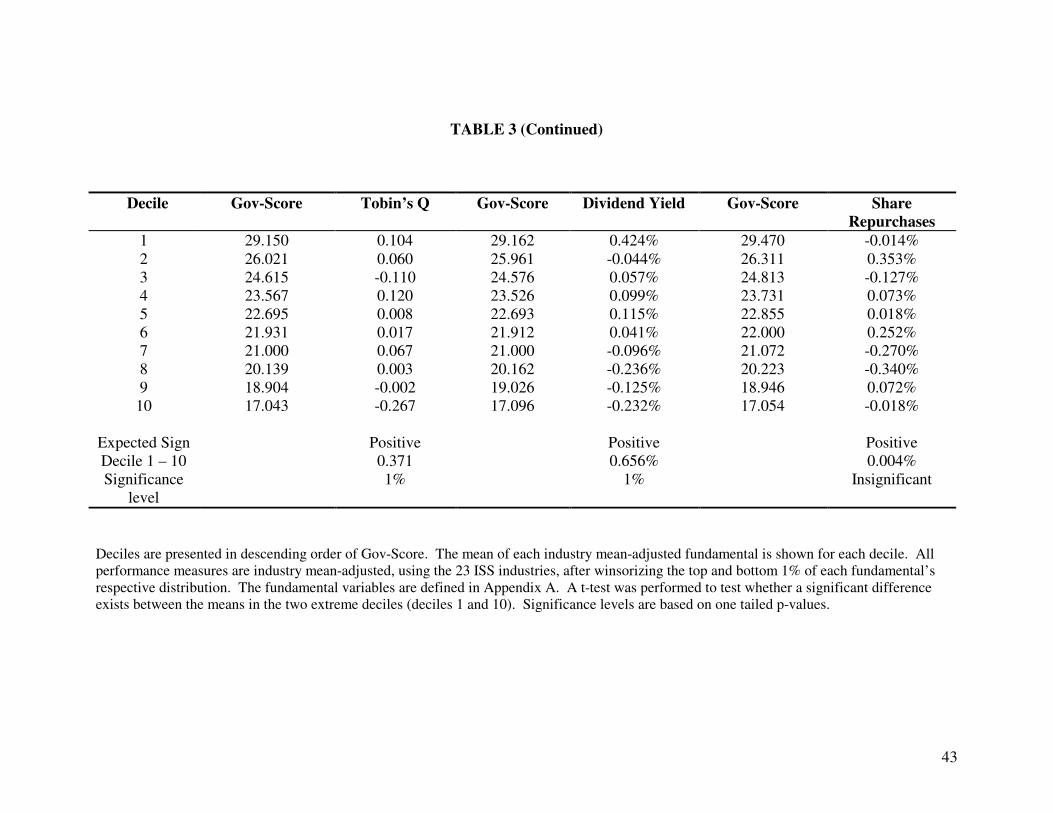
43
TABLE 3 (Continued)
Deciles are presented in descending order of Gov-Score. The mean of each industry mean-adjusted fundamental is shown for each decile. All performance measures are industry mean-adjusted, using the 23 ISS industries, after winsorizing the top and bottom 1% of each fundamental’s respective distribution. The fundamental variables are defined in Appendix A. A t-test was performed to test whether a significant difference exists between the means in the two extreme deciles (deciles 1 and 10). Significance levels are based on one tailed p-values.
Decile Gov-Score Tobin’s Q Gov-Score Dividend Yield Gov-Score Share Repurchases
1 29.150 0.104 29.162 0.424% 29.470 -0.014% 2 26.021 0.060 25.961 -0.044% 26.311 0.353% 3 24.615 -0.110 24.576 0.057% 24.813 -0.127% 4 23.567 0.120 23.526 0.099% 23.731 0.073% 5 22.695 0.008 22.693 0.115% 22.855 0.018% 6 21.931 0.017 21.912 0.041% 22.000 0.252% 7 21.000 0.067 21.000 -0.096% 21.072 -0.270% 8 20.139 0.003 20.162 -0.236% 20.223 -0.340% 9 18.904 -0.002 19.026 -0.125% 18.946 0.072%
10 17.043 -0.267 17.096 -0.232% 17.054 -0.018%
Expected Sign Positive Positive Positive Decile 1 – 10 0.371 0.656% 0.004% Significance
level 1% 1% Insignificant

44
TABLE 4: Eight ISS Categories Associated with the Six Industry-adjusted Performance Measures
Pearson correlations of the six industry-adjusted performance measures with category scores formed from the eight ISS categories. *** (**) (*) indicates significance at 1% (5%) (10%) one tailed level. Bold indicates significant and of the expected direction. Italics indicate significant and of the unexpected direction.
Return on Equity
Net Profit Margin
Sales Growth Tobin’s Q Dividend Yield
Share Repurchases
Sig. Positive
Sign
Sig. Negative
Sign Audit -0.05825*** -0.03050* 0.00135 0.02195 -0.01718 -0.03372* 0 3 Board of Directors 0.11931*** 0.06614*** -0.05038*** 0.02884 0.11099*** 0.05577** 4 1 Charter / Bylaws -0.10669*** -0.04730** -0.00105 0.03964** -0.11513*** -0.04026** 1 4 Director Education 0.06445*** 0.03995** 0.00862 -0.00349 0.05245*** 0.01330 3 0 Executive and Director Compensation
0.14279*** 0.07077*** 0.01612 0.01406 0.14430*** 0.01479 3 0
Ownership 0.09827*** 0.013345 -0.03842** 0.01742 0.15657*** 0.02471 2 1 Progressive Practices 0.09263*** 0.04365** -0.01327 0.01315 0.13252*** 0.04315** 4 0 State of Incorporation 0.00766 0.004265 0.02240 0.04016** -0.02396 -0.02501 1 0

45
TABLE 5: Corporate Governance Measures Associated with the Six Industry-adjusted Performance Measures
Return on Equity
Net Profit Margin
Sales Growth
Tobin’s Q Dividend Yield
Share Repurchases
Sig. Positive
Sign
Sig. Negative
Sign Audit Audit committee consists solely of independent outside directors.
0.01712 0.02007 -0.01762 -0.01908 0.04224** 0.01253 1 0
Auditors were ratified at the most recent annual meeting.
0.01563 -0.00371 0.02203 0.02526 0.01856 0.02614 0 0
Consulting fees paid to auditors are less than audit fees paid to auditors.
-0.13429*** -0.06770*** -0.00794 0.02646 -0.08963*** -0.09490*** 0 4
Company has a formal policy on auditor rotation.
0.03130* 0.01239 0.02125 0.01095 0.02283 0.01131 1 0
Board of Directors Managers respond to shareholder proposals within 12 months of shareholder meeting.
-0.05435*** -0.02838* 0.01412 0.01447 -0.08901*** -0.06002*** 0 4
CEO serves on no more than two additional boards of other public companies.
-0.02584 -0.02326 0.00676 0.02258 -0.04541** -0.00175 0 1
All directors attended at least 75% of board meetings or had a valid excuse for non-attendance.
0.03197* 0.01087 0.01971 0.04027** 0.04306** 0.04301** 4 0
Size of board of directors is at least six but not more than 15 members.
0.06399*** 0.05708*** -0.01603 -0.02302 0.02615 0.01688 2 0
No former CEO serves on board. 0.04290** -0.00415 0.04390** -0.00551 -0.00977 -0.00148 2 0 CEO is not listed as having a “related 0.01628 0.01782 -0.03933** 0.02111 0.03713** 0.05753*** 2 1

46
party transaction” in proxy statement. Board is controlled by more than 50% independent outside directors.
0.06125*** 0.05248*** -0.03625** -0.04706** 0.09532*** 0.06423*** 4 2
Compensation committee is comprised solely of independent outside directors.
0.06717*** 0.03236* -0.03160* 0.00299 0.06866*** 0.00585 3 1
The CEO and chairman duties are separated or a lead director is specified.
-0.03293* 0.02806* -0.04842** 0.03682* 0.00750 0.02831 2 2
Shareholders vote on directors selected to fill vacancies.
0.01180 -0.01598 -0.02081 0.01445 -0.02027 -0.03523* 0 1
Board members are elected annually. -0.02490 -0.02962* -0.00104 0.07270*** -0.06542*** -0.04507** 1 3 Shareholder approval is required to change board size.
0.01897 0.02371 0.01984 -0.02188 0.00821 -0.00298 0 0
Nominating committee is comprised solely of independent outside directors.
0.13287*** 0.06049*** -0.03004* -0.00533 0.13193*** 0.05234** 4 1
Governance committee meets at least once during the year.
0.13716*** 0.06333*** -0.04797** 0.00007 0.17374*** 0.06173*** 4 1
Shareholders have cumulative voting rights to elect directors.
0.01444 0.00674 -0.01288 0.00435 0.01547 0.02081 0 0
Board guidelines are in each proxy statement.
0.08249*** 0.03641** -0.02106 0.03341* 0.09963*** 0.05254** 5 0
Policy exists requiring outside directors to serve on no more than five additional boards.
0.03356* 0.01331 -0.01048 0.00902 0.01121 0.01922 1 0
Charter / Bylaws A simple majority vote is required to approve a merger (not a supermajority).
-0.07310*** -0.05073*** 0.00754 -0.00245 -0.12878*** -0.03501* 0 4
Company either has no poison pill or a pill that was shareholder approved.
-0.10191*** -0.04221** 0.04654** 0.06905*** -0.10785*** -0.04322** 2 4
Shareholders are allowed to call special -0.05125*** -0.01695 -0.01719 0.02342 0.01663 -0.01916 0 1

47
meetings. A majority vote is required to amend charter/bylaws (not a supermajority).
-0.06605*** -0.04019** -0.03879** 0.01971 -0.05656*** -0.02685 0 4
Shareholders may act by written consent and the consent is non-unanimous.
-0.06714*** -0.02161 0.01754 0.03767** -0.10802*** -0.00881 1 2
Company is not authorized to issue blank check preferred stock.
0.05337*** 0.02867* -0.03305* -0.03933** 0.03320* 0.01033 3 2
Board cannot amend bylaws without shareholder approval or can only do so under limited circumstances.
-0.00614 0.02328 0.01449 -0.01774 -0.00212 0.00432 0 0
Director Education At least one member of the board has participated in an ISS-accredited director education program.
0.06445*** 0.03995** 0.00862 -0.00349 0.05245*** 0.01330 3 0
Executive and Director Compensation No interlocks exist among directors on the compensation committee.
-0.02201 -0.02192 -0.01243 0.01855 -0.03727** 0.01607 0 1
Non-employees do not participate in company pension plans.
-0.01559 -0.01609 -0.00585 0.01695 -0.03501** -0.01705 0 1
Option re-pricing did not occur within last three years.
0.06674*** 0.04216** 0.05251*** 0.03167* 0.02880* 0.03016 5 0
Stock incentive plans were adopted with shareholder approval.
0.02464 0.01293 0.00985 -0.01403 0.01990 -0.04287** 0 1
Directors receive all or a portion of their fees in stock.
0.00829 0.02319 -0.00170 -0.03129* -0.00693 0.04222** 1 1
Company does not provide any loans to executives for exercising options.
0.00404 0.01379 0.03125* -0.01318 -0.01418 0.00897 1 0
The last time shareholders voted on a pay 0.03740** 0.01828 -0.00287 -0.01005 0.11035*** -0.01874 2 0

48
plan, ISS did not deem its cost to be excessive. The average options granted in the past three years as a percentage of basic shares outstanding did not exceed 3% (option burn rate).
0.15854*** 0.06628*** -0.00529 0.04438** 0.16277*** 0.00030 4 0
Option re-pricing is prohibited. 0.10615*** 0.05390*** 0.00373 0.00619 0.08121*** 0.04324** 4 0 Company expenses stock options. 0.02277 -0.00387 0.00633 -0.00086 0.02512 0.00476 0 0 Ownership All directors with more than one year of service own stock.
-0.03072* -0.02914* -0.04477** 0.00864 0.04887*** -0.01678 1 3
Officers’ and directors’ stock ownership is at least 1% but not over 30% of total shares outstanding.
0.05777*** -0.01049 0.00828 0.01063 0.06351*** 0.01090 2 0
Executives are subject to stock ownership guidelines.
0.10010*** 0.04515** -0.04410** 0.00238 0.18473*** 0.03198* 4 1
Directors are subject to stock ownership guidelines.
0.09166*** 0.03259* -0.02959* 0.02073 0.07418*** 0.03083* 4 1
Progressive Practices Mandatory retirement age for directors exist.
0.09787*** 0.04241** -0.03106* -0.00023 0.16805*** 0.04174** 4 1
Performance of the board is reviewed regularly.
0.05633*** 0.03488** 0.01152 0.01302 0.09080*** 0.03441* 4 0
A board-approved CEO succession plan is in place.
0.06423*** 0.03230* -0.00999 0.01660 0.09609*** 0.02531 3 0
Board has outside advisors. 0.07154*** 0.02784* -0.00850 0.01773 0.07201*** 0.06001*** 4 0 Directors are required to submit their resignation upon a change in job status.
0.08394*** 0.03936** -0.00845 0.00809 0.09429*** 0.02253 3 0

49
Outside directors meet without the CEO and disclose the number of times they met.
0.04476** 0.02423 -0.02329 0.01673 0.07792*** -0.00821 2 0
Director term limits exist. 0.03807** 0.01087 0.00337 -0.00664 0.03694** 0.02451 2 0 State of Incorporation Incorporation in a state without any anti-takeover provisions.
0.00766 0.00427 0.02240 0.04016** -0.02396 -0.02501 1 0
Pearson correlations of the six industry-adjusted performance measure with 51 binary indicator variables representing the 51 governance factors. *** (**) (*) indicates significance at 1% (5%) (10%) one tailed level. Bold indicates significant and of the expected direction. Italics indicate significant and of the unexpected direction.
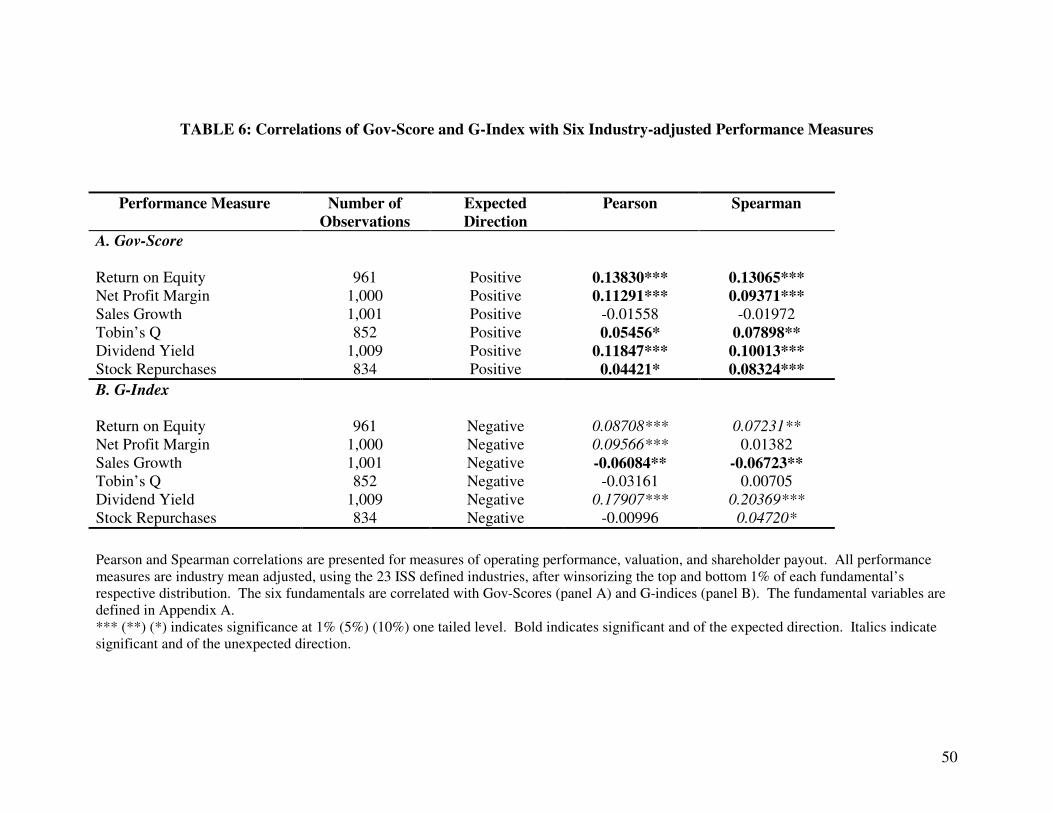
50
TABLE 6: Correlations of Gov-Score and G-Index with Six Industry-adjusted Performance Measures
Pearson and Spearman correlations are presented for measures of operating performance, valuation, and shareholder payout. All performance measures are industry mean adjusted, using the 23 ISS defined industries, after winsorizing the top and bottom 1% of each fundamental’s respective distribution. The six fundamentals are correlated with Gov-Scores (panel A) and G-indices (panel B). The fundamental variables are defined in Appendix A. *** (**) (*) indicates significance at 1% (5%) (10%) one tailed level. Bold indicates significant and of the expected direction. Italics indicate significant and of the unexpected direction.
Performance Measure Number of Observations
Expected Direction
Pearson Spearman
A. Gov-Score Return on Equity 961 Positive 0.13830*** 0.13065*** Net Profit Margin 1,000 Positive 0.11291*** 0.09371*** Sales Growth 1,001 Positive -0.01558 -0.01972 Tobin’s Q 852 Positive 0.05456* 0.07898** Dividend Yield 1,009 Positive 0.11847*** 0.10013*** Stock Repurchases 834 Positive 0.04421* 0.08324*** B. G-Index Return on Equity 961 Negative 0.08708*** 0.07231** Net Profit Margin 1,000 Negative 0.09566*** 0.01382 Sales Growth 1,001 Negative -0.06084** -0.06723** Tobin’s Q 852 Negative -0.03161 0.00705 Dividend Yield 1,009 Negative 0.17907*** 0.20369*** Stock Repurchases 834 Negative -0.00996 0.04720*

51
TABLE 7: OLS Regressions of Six Industry-adjusted Performance Measures on Gov-Score and Controls
OLS regressions are presented for measures of operating performance, valuation, and shareholder payout on Gov-Score. All performance measures are industry mean adjusted, using the 23 ISS defined industries, after winsorizing the top and bottom 1% of each fundamental’s respective distribution. The fundamentals are then regressed on Gov-Score and control variables. Log (B/M), log (Assets) and Log (Firm Age) are winsorized at the top and bottom 1% of their respective distributions. All coefficient estimates except Tobin’s Q are shown in percentage form. The performance measures are defined in Appendix A. The control variables are the natural logarithm of the book-to-market ratio, the natural logarithm of total assets, the natural logarithm of firm age as measured in fiscal quarters, a dummy variable indicating inclusion in the S&P 500, and a dummy variable indicating whether a firm is incorporated in the state of Delaware or not. *** (**) (*) indicates significance at 1% (5%) (10%) one tailed level. Bold indicates significant and of the expected direction. Italics indicate significant and of the unexpected direction.
Performance Measure
Number of Observations
Intercept Gov-Score log (B/M) log (Assets) log (Firm Age)
S&P 500 Dummy
Delaware Dummy
Adj. R2
Return on Equity 1,726 -27.20%*** 1.16%*** -1.00% N/A N/A N/A N/A 1.05% Net Profit Margin 1,744 -87.64%** 4.29%*** -1.71% N/A N/A N/A N/A 0.27% Sales Growth 1,745 9.38%** -0.55%** -7.91%*** N/A N/A N/A N/A 3.58% Tobin’s Q 1,873 0.32245* 0.02054** N/A -0.16811*** 0.00927 0.89577*** 0.04775 5.79% Dividend Yield 1,758 -1.83%*** 0.02%** -0.02% 0.08%*** 0.25%*** N/A N/A 5.55% Stock Repurchases 1,489 -0.30% -0.01% -0.06% 0.13%*** -0.08% N/A N/A 0.59%

52
APPENDIX A: Definitions of the Six Firm Performance Measures* OPERATING PERFORMANCE Return on Equity = Income Before Extraordinary Items Available for Common Equity (Compustat Annual Item 237) / Average Total Common Equity (the average of Compustat Annual Item 60 for the current and the previous fiscal years). Net Profit Margin = Income Before Extraordinary Items Available for Common Equity / Net Sales (Compustat Annual Item 12). Sales Growth = (Net Salest - Net Salest-1) / Net Salest-1.
VALUATION Tobin’s Q = (Total Assets (Compustat Annual Item 6) + Market Value of Equity (Stock Price Fiscal Year Close (Compustat Annual Item 199) * Common Shares Outstanding (Compustat Annual Item 25)) – Total Common Equity (Compustat Annual Item 60) – Deferred Taxes (Balance Sheet) (Compustat Annual Item 74)) / Total Assets Our definition of Q is common in the economics, law and finance literatures (e.g., Kaplan and Zingales (1997); Gompers et al. (2003); Bebchuk and Cohen (2004); among others). SHAREHOLDER PAYOUT Dividend Yield = Dividends per share – Payable Date (Compustat Annual Item 201) / Stock Price Fiscal Year Close. Share Repurchases = (Purchases of Common and Preferred Stock (Compustat Annual Item 115) – Decrease in Preferred Stock (from previous year)) / Market Value of Equity. Consistent with Dittmar (2000) and Bhattacharya and Dittmar (2002), we reduce purchases of common and preferred stock purchases of by the decrease in preferred stock.
* All Compustat data uses 2002 fiscal year.
Related Documents