The efficacy of principle-based corporate governance practices and firm financial performance An empirical investigation Krishna Reddy, Stuart Locke and Frank Scrimgeour University of Waikato, Hamilton, New Zealand Abstract Purpose – This paper seeks to address the effect that principle-based corporate governance practices have on the financial performance of large publicly-listed companies. In 2004, the New Zealand Securities Commission (NZSC) promulgated nine high level principles and guidelines for all business entities with an aim of improving corporate governance practices and boosting investor confidence in the New Zealand capital market. This event provides a point for empirically testing companies’ responses. Design/methodology/approach – Panel data for the NZX top 50 companies over the period 1999-2007 are analysed using ordinary least squares (OLS) and two stage least squares (2SLS) regression techniques to evaluate whether: those firms that were continuously compliant with the NZSC requirements perform better; and the firm performance post-NZSC recommendations is better than pre-NZSC recommendations. Tobin’s Q, market-to-book (MB) and return on assets (ROA) metrics are used as dependent variables.. Findings – The findings indicate that large listed companies have universally adopted the Securities Commission recommendations, establishing subcommittees for audit and remuneration, and having a majority of non-executive/independent directors on the board which, on average, have seven members. There is support for the view that the NZSC recommendations have had positive influence on firm performance measured by Tobin’s Q, MB and ROA. The results show that the presence of a remuneration committee has had a positive influence on firm performance. Research limitations/implications – This study provides empirical support for the corporate governance recommendations made by the NZSC in 2004, giving support to the principle-based corporate governance practices to be adopted in New Zealand. The sequential testing of each NZSC recommendation provides a comprehensive picture of performance outcomes which has not been achieved in prior research. The interdependency issues are of interest and the correlation between recommendations provides useful insights. Originality/value – This study offers insights for policy makers interested in adopting principle-based corporate governance practices within their country. Within New Zealand, public policy developments and stock exchange listing requirements/regulatory issues with associated compliance burdens are better informed as a consequence of the research. Keywords Corporate governance, Boards of directors, Corporate ownership, Financial performance, New Zealand Paper type Research paper 1. Introduction This study addresses the question whether principle based-corporate governance practices have a positive impact on financial performance of large listed companies in New Zealand. There are theoretical reasons to assume that improved governance practices will lead to better financial performance through: . an increase expected cash flows accruing to the investors; and . a reduction in the cost of capital. The current issue and full text archive of this journal is available at www.emeraldinsight.com/1743-9132.htm IJMF 6,3 190 International Journal of Managerial Finance Vol. 6 No. 3, 2010 pp. 190-219 q Emerald Group Publishing Limited 1743-9132 DOI 10.1108/17439131011056224

Welcome message from author
This document is posted to help you gain knowledge. Please leave a comment to let me know what you think about it! Share it to your friends and learn new things together.
Transcript
The efficacy of principle-basedcorporate governance practicesand firm financial performance
An empirical investigation
Krishna Reddy, Stuart Locke and Frank ScrimgeourUniversity of Waikato, Hamilton, New Zealand
AbstractPurpose – This paper seeks to address the effect that principle-based corporate governance practiceshave on the financial performance of large publicly-listed companies. In 2004, the New Zealand SecuritiesCommission (NZSC) promulgated nine high level principles and guidelines for all business entities withan aim of improving corporate governance practices and boosting investor confidence in the NewZealand capital market. This event provides a point for empirically testing companies’ responses.
Design/methodology/approach – Paneldatafor theNZXtop50companiesovertheperiod1999-2007are analysed using ordinary least squares (OLS) and two stage least squares (2SLS) regression techniquesto evaluate whether: those firms that were continuously compliant with the NZSC requirements performbetter; andthefirmperformancepost-NZSC recommendations isbetter thanpre-NZSCrecommendations.Tobin’s Q, market-to-book (MB) and return on assets (ROA) metrics are used as dependent variables..
Findings – The findings indicate that large listed companies have universally adopted the SecuritiesCommission recommendations, establishing subcommittees for audit and remuneration, and having amajority of non-executive/independent directors on the board which, on average, have seven members.There is support for the view that the NZSC recommendations have had positive influence on firmperformance measured by Tobin’s Q, MB and ROA. The results show that the presence of aremuneration committee has had a positive influence on firm performance.
Research limitations/implications – This study provides empirical support for the corporategovernance recommendations made by the NZSC in 2004, giving support to the principle-basedcorporate governance practices to be adopted in New Zealand. The sequential testing of each NZSCrecommendation provides a comprehensive picture of performance outcomes which has not beenachieved in prior research. The interdependency issues are of interest and the correlation betweenrecommendations provides useful insights.
Originality/value – This study offers insights for policy makers interested in adoptingprinciple-based corporate governance practices within their country. Within New Zealand, publicpolicy developments and stock exchange listing requirements/regulatory issues with associatedcompliance burdens are better informed as a consequence of the research.
Keywords Corporate governance, Boards of directors, Corporate ownership, Financial performance,New Zealand
Paper type Research paper
1. IntroductionThis study addresses the question whether principle based-corporate governancepractices have a positive impact on financial performance of large listed companies inNew Zealand. There are theoretical reasons to assume that improved governancepractices will lead to better financial performance through:
. an increase expected cash flows accruing to the investors; and
. a reduction in the cost of capital.
The current issue and full text archive of this journal is available at
www.emeraldinsight.com/1743-9132.htm
IJMF6,3
190
International Journal of ManagerialFinanceVol. 6 No. 3, 2010pp. 190-219q Emerald Group Publishing Limited1743-9132DOI 10.1108/17439131011056224
Shareholders believe that with improved governance practices more of the firm’s freecash flow will be returned to them as dividends rather than being expropriated by themanagers who control the firm (Jensen, 1986; La Porta et al., 2002; Shleifer andWolfenzon, 2002). Empirical studies support the view that improved governancepractices lead to better firm financial performance (MacAvoy and Millstein, 2003;Millstein and MacAvoy, 1998). Studies using data from large economies show thatbetter-governed firms reduce control rights, which stockholders and creditors conferon managers, increasing the probability that managers invest in shareholder valuecreating projects (Shleifer and Vishny, 1997)
Consistent with this perspective regulators and governance advocates, after thefailure of high profile companies such as Adelphia, Enron, Parmalat, Tyco andWorldCom, considered ways in which corporate governance practices could beimproved. In New Zealand, the debate focused primarily on whether to adopt a flexibleprinciple-based governance approach[1] compared to a “one size fits all” rule-basedapproach that was adopted by the USA namely Sarbanes-Oxley Act, 2002. NewZealand adopted a principle-based approach similar to the UK, Canada and Australiawith the view this will minimise the compliance costs. Several empirical studies in theUSA investigate the effect that a rule-based governance model has on firmperformance. However, investigations focusing on the principle-based model arerelatively scarce. This study, by reporting the findings of empirical tests in aprinciple-based environment and contrasting these with those previously conducted inthe US rule-based environment, makes an important contribution to understandingcorporate governance in a global context.
New Zealand is a particularly interesting case to analyse for a number of reasons.First, the passage of the Companies Act 1993, the Financial Reporting Act 1993 andrelated legislation made it mandatory for publicly listed companies to reportgovernance related information in their annual reports. An increase in reported cases ofpoor financial performances has been associated with poor governance practices inmany sectors of the New Zealand economy. Sufficient time has now passed since theimplementation of the revised governance practices in 2003 to make it possible to studywhether they had any effect on the financial performance of listed companies in NewZealand. Is the corporate governance principles adopted in New Zealand are similar tothose implemented in other overseas jurisdictions it is possible in further research tomake international comparisons.
Although New Zealand did not suffer scandals to the extent reported in largereconomies, such as the USA, UK and Australia, concern with poor performance (Healy,2003) and sub-standard governance practices were highlighted by both local andinternational market participants (Godfrey and Horsely, 2003). The failures andsub-standard corporate governance practices signal that urgent attention is requiredfrom the policy makers should New Zealand wish to maintain integrity in the capitalmarket.
To harmonise corporate governance practices with trading partners and to boostinvestor confidence, the New Zealand Securities Commission (NZSC), in 2004,promulgated nine high level principles and guidelines that are intended to contribute tohigh standards of corporate governance in New Zealand entities. The aim is to increaseshareholder confidence in the governance processes. The three key elements of theNZSC’s principles and guidelines that are also found in the corporate governance rules
Principle-basedcorporate
governance
191
and codes in the USA, the UK, Canada and Australia include: independence of chair,non-executive/independent director, and board committees. It is assumed that theadoption of such international best practices will lead to an improvement in thecorporate governance practices in New Zealand listed companies. Although the NZSCrecommendations are not mandatory, all companies listed on the stock exchange in(NZX) are required to observe NZSC guidelines to the fullest extent effective from 29October 2003[2]. The companies reporting on corporate governance practices arerequired to cover all the recommended principles, and departures from these must beexplained to the shareholders (NZSC, 2004).
This study extends the current literature on the corporate governance practices,examining the efficacy of the corporate governance practices recommended by theNZSC (soft regulation) on large listed companies’ financial performance. This adds tothe understanding of the workings of the underlying mechanisms of so-called “softregulations” and its effect on financial performance. The results will also contribute tounderstanding of how good governance mechanisms work in the global economy. Thecomparative analysis of findings from a principle based framework with the findingsof the studies conducted under the US rule-based model will contribute a morefundamental understanding of the governance-financial performance nexus. Theensuing discussion of the effects that the rule-based versus principle-based model haveon financial performance from an international perspective, including the effect (if any)of international financial reporting standards (IFRS) will have on such practices in thefuture, contributes significantly to understanding how governance contributes tovalue.
The next section reviews prior research and is followed by a description of themethods and procedures used for this empirical study. The results and conclusionsthen follow.
2. Literature reviewAgency problems arising from the separation of ownership and control are studied bya long tradition of scholars from Smith (1776), Berle and Means (1932), Jensen andMeckling (1976), Fama and Jensen (1983) and Shleifer and Vishny (1997) among others.They postulate that the diffuse ownership structure provides incentives for managersto expropriate firms’ assets in a manner that adversely affects shareholder wealth. Thecorporate governance literature identifies a variety of mechanisms that are available tothe shareholders to ensure managers act in the best interest of the shareholders. Thesemechanisms are classified as both internal, such as ownership by managers and theboard, independence of the board, size of the board and the establishment of the boardcommittees and external, such as block ownership, the level of debt financing, themarket for corporate control, and product market competition (Barnhart andRosenstein, 1998; Denis, 2001). However, most of the studies on corporate governanceconcentrate mainly on a specific aspect of governance, such as insider ownership(Mehran, 1995), blockholding (Demsetz and Lehn, 1985; McConnell and Servaes, 1990;Mikkelson and Ruback, 1985); board composition (Bhagat and Black, 2002; Denis andSarin, 1997; Hossain et al., 2001), and leverage (Agrawal and Knoeber, 1996; Begley andFeltham, 1999). The study uses an extensive set of governance variables which providecomprehensive picture of the company and industry level governance practices and themechanisms that have been recommended internationally to improve governance
IJMF6,3
192

practices. The study includes three additional control variables, that is, auditcommittee, remuneration committee and dividends.
A problem of endogeneity, which plagued many previous corporate governancestudies (Himmelberg et al., 1999; Holderness et al., 1999; McConnell and Servaes, 1990;Morck et al., 1988), will also be addressed in this paper. Himmelberg et al. (1999) andPalia (2001) argue that endogeneity in the performance-ownership relationship mayhave been caused by omitted variables that have a potential to affect both performanceand ownership, thus leading to spurious relationships. Himmelberg et al. (1999)suggests that the unobserved level of intangible assets induces a positive correlationbetween managerial ownership and performance (Tobin’s Q). Firms with a highproportion of unobserved intangible assets will require a higher level of managerialownership to align interests. At the same time, they will also have a higher Tobin’s Qvalue because the market will value intangibles while the book value of assets (in thedenominator of Tobin’s Q) will understate the value of intangibles.
The quality of monitoring technology is another unobserved variable that has thepotential to affect both, the level of insider ownership and firm value. Those firms thathave superior monitoring technology may need lower levels of insider ownership toalign incentives resulting in and have higher firm value because fewer resources willbe diverted to managerial perquisites.
2.1 Ownership structureThe interest alignment hypothesis posits that equity ownership by insiders (officersand directors) will better align managers’ goals with shareholders’ goals (see Berle andMeans, 1932; Jensen and Meckling, 1976). As the managers’ proportion of equityownership increases, their interests coincide more closely with those of outsideshareholders, reducing the agency problems and improving firm financialperformance. Demsetz (1983) argues that firm performance will only increase if theownership structure is in disequilibrium. Some studies find a positive relationshipbetween an out-of-equilibrium level of insider equity ownership and firm performance.For example, Mehran (1995) examines the executive compensation structure of 153randomly-selected manufacturing firms and reports that firm performance (measuredas Tobin’s Q and ROA) is positively related to the percentage of equity held bymanagers as well as to the percentage of their compensation that is equity-based.
From a corporate governance perspective, managerial ownership is a new conceptfor New Zealand; however, the trend to issuing warrants and shares to senior staff isgrowing. The evidence available (Elayan et al., 2003; Hossain et al., 2001; Reddy et al.,2008a) supports the view that the proportion of managerial ownership in New Zealandcompanies is still less than optimal. Therefore, it is assumed that any increase inmanagerial ownership is likely to have a positive effect on financial performance.
Therefore,the first hypothesis is:
H1a. Insider ownership is positively associated with a company’s financialperformance.
A shareholding of 5 percent or more of a company’s stock is considered to be asignificant constituting a blockholding (Denis, 2001; NZSC, 2006). Such blockholdersmay be individuals, corporations, or institutional investors. Shleifer and Vishny (1986)provide support for the view that block holdings are important elements for controlling
Principle-basedcorporate
governance
193
agency cost. The average block ownership of 76.3 percent in New Zealand firms(Hossain et al., 2001) is consistent with New Zealand’s weak minority shareholderrights. Also, the existence of weak regulations regarding shareholder rights allowsinitial owners to continue to hold large blocks of shares in companies after goingpublic. Since blockowners hold undiversified large stakes it is argued, consistent withthe interest alignment hypothesis that the blockholders will provide a similar level ofvigilance as if they owned the company themselves. Blockholding also solves thefree-riding problem making manager monitoring easier (Agrawal and Mandelker,1990; Hill and Snell, 1988, Hill and Snell, 1989; Shleifer and Vishny, 1986). Sinceblockholding is an important feature of the company ownership structure in NewZealand, it is assumed that the presence of blockholders will have a positive effect onfirm financial performance.
Thus the second hypothesis is:
H1b. Blockholders will be positively associated with a company’s financialperformance.
2.2 Board structureThe NZSC (2004) recommends that the boards of New Zealand publicly-listedcompanies should have an independent chair, the majority of members should benon-executive directors and a minimum of one third of the members should beindependent directors[3]. However, the debate in the corporate governance literaturecontinues as to whether an increased participation of outside directors on the boardleads to an improvement in the business’ financial performance.
Hence the third hypothesis is:
H2a. The proportion of non-executive/independent directors is positivelyassociated with the company’s financial performance.
There is no one optimal “size” for a board. However, organisational behaviour researchsuggests that as group sizes grow larger, total productivity exhibits diminishingreturns (Hackman, 1990). Consistent with this view, Jensen (1983) suggests that a boardshould have a maximum of seven or eight members to function effectively. InAustralia, the boards of the 250 largest companies have on average 6.89 members(Psaros, 2009). From an agency perspective, smaller boards are more likely to reachconsensus and also allow members to engage in genuine debate and interaction(Firstenberg and Malkiel, 1994). Alternatively, larger boards tend to provide anincreased pool of expertise, greater management oversight, access to wider range ofcontracts and resources (Goostein et al., 1994; Psaros, 2009). However, Forbes andMilliken (1999), Yawson (2006), Pye (2000), and Mak and Kusnadi (2005) argue thatlarger boards suffer from higher agency problems because it is difficult to coordinateand have difficulty making value maximising strategic decisions.
In New Zealand there is only a small pool of directors available from whichcompanies may choose and may be difficult to obtain the right balance in terms ofskills, expertise and environmental linkages required in the board room with a smallerboard size. It is argued that to balance skills required in the board room, New Zealandcompanies may require a larger board size than might otherwise be the case in largereconomies. Therefore, it is assumed that board size will have a positive effect on firmfinancial performances.
IJMF6,3
194
In line with the prior literature the fourth hypothesis is:
H2b. Board size is positively associated with a company’s financial performance.
2.3 Use of debt and dividend policyPrevious studies provide both theoretical and empirical support that use of both debtand dividend helps to discourage overinvestment of free cash flow by self-servingmanagers. Debt acts as a corporate governance mechanism that can voluntarily be usedto transfer the functions of monitoring and evaluating managerial performance to theparticipants of the capital market (debtholders) (Agrawal and Knoeber, 1996; Begley andFeltham, 1999; Jensen, 1986). Conversely, Agrawal and Knoeber (1996) and Beiner et al.(2003) find that there is no relationship between debt and firm performance. Fama (1980)states that when managers are less diversified than their shareholders’ i.e. in addition toholding stock and stock options, their human capital is also specific to the firm.Consequently, the managers may increase leverage beyond the “optimal capitalstructure” to increase the voting power of their equity stakes and reduce the likelihood ofa takeover and the resulting possible loss of job tenure. In New Zealand companies haverelied on debt as a source of capital and debtholders have a tendency to safeguard theirinvestment, monitoring firm performance on a regular basis. It is assumed that the use ofdebt will have a positive effect on firm financial performance.
Similarly, companies may set a target ratio of dividend to earnings as a controlinstrument similar to debt financing. The higher the payout ratio, the smaller theamount of free cash flows. Also, Crutchley and Hansen (1989) show evidence ofdividend policy acting as a corporate monitoring vehicle. Farinha (2003) providesempirical evidence of dividend policy reducing agency problems either by increasingthe frequency of external capital raising and associated monitoring by investmentbankers and investors (Easterbrook, 1984) or it is reasonable to assume that dividendpayouts will have a positive effect on company performance.
Basing on the literature it is assumed that the use of both debt and dividend willlead to improved firm performance.
Therefore, the fifth and sixth hypotheses are:
H3a. Debt will be positively associated with a company’s financial performances.
H3b. Dividend payouts will be positively associated with a company’s financialperformance.
2.4 Board committeesEmpirical research provide support that the presence of an audit committee isassociated with fewer financial reporting problems (McMullen, 1996). Klein (2002)shows that independent audit committees reduce the likelihood of earningsmanagement thus improving transparency.
On the other hand, both Main and Johnston (1998) and Weir and Laing (2000) reportedthat the existence of a remuneration committee has positive effect on performance. Klein(1998) finds evidence of a positive relationship between the presence of a remunerationcommittee and performance but notices this relationship is not highly significant.
Despite the NZSC recommendations and guidelines to incorporate boardcommittees, very few studies, to date, focus on their relationship with firm financialperformance. Dalton et al. (1998) provide a similar view that relatively little research
Principle-basedcorporate
governance
195

has been undertaken in the relationship between board sub committees andperformance. However, the international evidence suggests that it is likely thatempirical research in New Zealand will find a positive link between boardsub-committees and company performances.
The seventh and eighth hypotheses are:
H4a. The presence of an Audit Committee will be positively associated with acompany’s financial performance.
H4b. The presence of a Remuneration Committee will be positively associatedwith a company’s financial performance.
3. Methodology and procedure of analysisSeveral studies look at the effect that corporate governance practices have on financialperformance measured by Tobin’s Q. However, these studies do not account for thepossible interrelationships among different control mechanisms resulting fromendogeneity issues (Beiner et al., 2004). Also, these studies’ do not include mechanismssuch as board sub-committees (audit and remuneration) and dividends, which ifincluded may influence the results. Therefore, this study broadens the scope ofprevious investigations by including a wider set of mechanisms, controlling for theproblem of endogeneity and the issue of whether compliance with NZSCrecommendations leads to an improved performance.
3.1 Data and data sourcesData for this study are obtained from NZX Deep Archive for the top 50 publicly-listedcompanies on the NZX for the period 1999 through 2007. The top 50 companies arechosen because they constitute the NZX50 index and the findings of this study will bemore readily comparable to international studies of the larger company sector inrespective countries. It is to be noted that the NZX50 was introduced in New Zealandon 3 March, 2003, and prior to this date, the top 40 companies are used to determine theNZX40 index. Therefore, the sampling period 1999 to 2002 uses top 40 firms in eachyear, and the years 2003 to 2007 includes top 50 companies in each year. In total, thereare 410 firms included in the sample covering all sectors of the economy, includingprimary, energy, goods, property, service and investments. A total of 70 firms areexcluded from the sample because they did not have all the information while theremaining 340 firms (78.3 per cent of the sample) have all the information and areincluded in the pooled data set for this study.
3.2 Dependent variablesTobin’s Q as the performance measure is commonly used as a dependent variable(Agrawal and Knoeber, 1996; Chung and Pruitt, 1994; Hossain et al., 2001; Kang andStulz, 1996; Loderer and Peyer, 2002; Perfect and Wiles, 1994; Reddy et al., 2008a). Anaccounting-based performance measure return on assets (ROA) has been used byDemsetz and Villalonga (2001), Finch and Shivadasani (2006), Thomsen et al. (2006).Demsetz and Villalonga (2001) argue that both performance measures have pitfalls. Forexample, futuristic and forward-looking measure Tobin’s Q is typically estimated as:
IJMF6,3
196

Tobin’sQ ¼MVE þ L =T Debt þ Net S =T Debt
Total Assets
Where MVE (the market value estimate) is the product of a firm’s share price and thecommon stock outstanding, L/T Debt is the book value of long term liabilities; Net S/TDebt is the book value of current liabilities less current assets. Demsetz and Villalonga(2001) argue that although the numerator of Tobin’s Q partly reflects the value thatinvestors assign to a company’s intangible assets, the denominator does not include theinvestment the company has in intangible assets, such as, advertisement and researchand development. These items are simply treated as expenses. This distorts theperformance comparison of firms that rely on the differing degrees of intangible capital(see Demsetz, 1979; Telser, 1969; Weiss, 1969). To overcome this problem recent studiesuse depreciated book value of tangible assets. Tobin’s Q is estimated in the same wayfor this study as well.
The accounting-based performance measure return of assets (ROA) is also used inthis study. The accounting-based profit measure is criticised as beingbackward-looking and it only partially estimates future events in the form ofdepreciation and amortization. On the other hand, Tobin’s Q is greatly influenced by awide range of unstable factors, such as, investor psychology, and market forecasts.Considering the above concerns, both measures of performance are used in this study.
The ratio of market value to book value of assets (MB) is also used in this research:
MB ¼Stock Price*No: of Shares
Total Equity ðTEÞ
where TE is equal to net assets, that is, assets less debt (TE ¼ A2 L).
3.3 Independent variablesThe independent and control variables employed in this study are factors identified inprior research as influences performance, either positively or negatively. The variablesand the way in which they are determined in this study are:
. Insider ownership (IOWN) is the proportion of shares held by all members of theboard of directors divided by total ordinary shares outstanding.
. Blockholding (BOWN) is the proportion of shares held by the 20 largestshareholders of the company.
. Non-executive/independent directors (NED) is the proportion of thenon-executive/independent directors on the board.
. The board size (BDS) is the natural log of the total number of directors on theboard.
. Leverage (LEV) is the proportion of the debt defined as long term liabilities plusshort-term liabilities divided by the total assets.
. Firm size (Log (TA)) is the natural log of total assets which is a proxy for size.
. Dividend (DIV2TA) is the dollar amount of the dividend paid by the companydivided by book value of the total assets.
. To study the effect these committees have on firms’ financial performance, twodummy variables are created. The Audit Committee (ACOM) is the dummy
Principle-basedcorporate
governance
197

variable set equal to 1 if companies have an audit committee; otherwise it is setequal to 0. A Remuneration committee (RCOM) is the dummy variable set equalto 1 if companies have a remuneration committee; otherwise it is set equal to 0.
. Firm level risk (FMRISK) is the standard deviation of the daily stock price of thefirm for the period 1999 through to 2007.
. The firm business risk (BUSRISK) is the standard deviation of the five yearreturn on assets.
. To study the effect of the timing of NZSC recommendations on the companyperformance, a dummy variable AFTER2003 is created. AFTER2003 is equal to1 if the year is after 2003; otherwise it is set equal to 0.
. A dummy variable COMPLIED measure the effect NZSC recommendations hason the performance of companies that continuously were in compliance with theNZSC recommendations during the sampling period. COMPLIED is equal to 1 ifcompany complies with the NZSC recommendations (that is, has non-executivedirectors, audit committee and remuneration committee); otherwise equal to 0.
. To study the effect of compliance with NZSC recommendations on companyperformance after 2004 is captured by the variable ComAft, which is determinedby multiplying COMPLY by AFTER2003.
. To study the effect growth of the New Zealand economy had on companies’financial performance a variable RGDP is created. RGDP is the yearly realgrowth rate.
In practice, each firm has different corporate governance structures and thosestructures are assumed to be similar for companies that are in the same industry.Previous studies have looked at the industry effect on companies’ performance. Tostudy the effect corporate governance practices have on performance industry dummyvariables are created. NZX classifies all listed companies into seven sectors, namely,primary (agriculture and fishing, mining, forestry, and building), energy, goods (food,textile and apparel, intermediate and durables), property, service (transport, port,leisure and tourism, media and communication, finance and other services), investmentand overseas. Using NZX classification, seven industry dummy variables areintroduced. IND1 is the dummy variable equal to 1 if the company belongs to primaryindustry, otherwise equal to 0. IND2 is the dummy variable equal to 1 if the companybelongs to energy industry, otherwise equal to 0. IND3 is the dummy variable equal to1 if the company belongs to goods industry, otherwise equal to 0. IND4 is the dummyvariable equal to 1 if the company belongs to property industry, otherwise equal to 0.IND5 is the dummy variable equal to 1 if the company belongs to service industry,otherwise equal to 0. IND6 is the dummy variable equal to 1 if the company belongs toinvestment industries, otherwise equal to 0. IND7 is the dummy variable equal to 1 ifthe company belongs to overseas, otherwise equal to 0.
There are a number of companies that were in the NZX Top40 list in 1999 that arenot in NZX Top50 list in 2007 raising concerns regarding the effect that non-survivingfirms have on the results. To control the effect of non-survivorship firms on the results,a dumpy variable SURV is created which is equal to 1 if the firm is continuouslypresent in all the years of the sampling period from 1999 to 2007, otherwise it is equalto 0. The variable CSURV measures the effect firms that survived through the
IJMF6,3
198
sampling period and also complied with NZSC recommendations on firm performance.It is calculated by multiplying COMPLIED by SURV.
3.4 Model specificationMost of the literature uses univariate or multivariate regression analysis to test therelationship between corporate governance factors and firm financial performance.These studies consider ownership as an exogenous variable. Based on these priorstudies an ordinary least squares regression (OLS), allowing ownership to have asimple linear relationship to establish if governance and control mechanisms have aneffect on firm performance is employed. The models estimated are:
FP ¼ a1 þ b11IOWN þ b12BOWN þ b13NED þ b14BDS þ b15LEV
þ b16DIV2TA þ b17 logðTAÞ þ b18ACOM þ b19RCOM þ b20FMRISK
þ b21BUSRISK þ b22SURV þ b23RDGP þ b24IND1 þ b25IND2
þ b26IND3 þ b27IND4 þ b28IND5 þ b29IND6 þ b30IND7 þ e ð1Þ
FP ¼ a2 þ b21IOWN þ b22BOWN þ b23NED þ b24BDS þ b25LEV
þ b26DIV2TA þ b27 logðTAÞ þ b28ACOM þ b29RCOM þ b30FMRISK
þ b31BUSRISK þ b32ComAft þ b33SURV þ b34RDGP þ b35IND1
þ b36IND2 þ b37IND3 þ b38IND4 þ b39IND5 þ b40IND6 þ b41IND7 þ e ð2Þ
FP ¼ a3 þ b31IOWN þ b32LESS1 þ b33BET510 þ b34BET1020 þ b35OVER20
þ b36BOWN þ b37NED þ b38BDS þ b39LEV þ b40DIV2TA
þ b41logðTAÞ þ b42ACOM þ b43RCOM þ b44FMRISK þ b45BUSRISK
þ b46ComAFT þ b47CSURV þ b48IND1 þ b49IND2 þ b50IND3
þ b51IND4 þ b52IND5 þ b53IND6 þ b54IND7 þ e ð3Þ
where FP ¼ Firm Performance measured by Tobin’s Q, MB and ROA.Equation (1) determines the relationship between performance and governance
mechanisms of firms that were continuously noncompliant with NZSC recommendationssince 1999. This is undertaken for the three firm performance measures. Equation (2)determines the relationship between performance and governance mechanisms for firmsthat complied with the NZSC recommendations after 2003. Also determines the effect ofsurvivorship on performance. The analyses are undertaken for three performancemeasures. Equation (3) estimates whether a piecewise linear relationship exists betweeninsider ownership and firm performance. This is undertaken for IOWN less than 1percent, between 1 percent and 5 percent, between 5 percent and 10 percent, between 10
Principle-basedcorporate
governance
199

percent and 20 percent and over 20 percent. Dummy variable LESS1 is equal to 1 ifIOWN is less than 1 otherwise equal to 0. Dummy variable BET15 is equal to 1 if IOWNis less than 1 otherwise equal to 0. Dummy variable BET510 is equal to 1 if IOWN is lessthan 1 otherwise equal to 0. Dummy variable BET1020 is equal to 1 if IOWN is less than1 otherwise equal to 0. Dummy variable OVER20 is equal to 1 if IOWN is less than 1otherwise equal to 0.
To study whether the firms that complied with NZSC recommendations after 2003improved performance compared to the period before 2003, a performance measureFPdiffAV is created. FPdiffAV is the difference between average firm performance forthe period 2004-2007 and 1999-2003:
FPdiffAV ¼ a3 þ b31IOWN þ b32BOWN þ b33NED þ b34BDS þ b35LEV
þ b36DIV2TA þ b37logðTAÞ þ b38ACOM þ b39RCOM
þ b40FMRISK þ b41BUSRISK þ b42CSURV þ e: ð4Þ
4. Empirical results4.1 Descriptive statisticsTable I provides a summary of the sample descriptive statistics for the pooled data.The mean Tobin’s Q ratio is 3.26, with a median of 1.83. A Tobin’s Q ratio greater thanone is favourable, indicating the firm did create value for shareholders. The mean MBis 0.50 and median is 0.45 indicating that market value of firms’ shares is 50 percentless than the book value of the firms’ equity. The mean of ROA ratio is 0.07 with amedian of 0.06 indicating that large firms on average have positive performance. Themean proportion of managerial ownership (IOWN) is 12 per cent but the median is only1 per cent. The 25th percentile is 0 per cent and 75th percentile is 16 per cent. Hossainet al. (2001) study 633 firms of different sizes and report mean (median) managerialownership for the period 1991/1997 of 6.8 per cent (0.6 per cent) and lower and upperquartiles of 0.1 per cent and 5 per cent respectively. These indicate that managerialownership in large firms is slightly higher in New Zealand. According to Hembry(2008), the trend is growing as more firms are linking managerial remuneration withthe firm’s performance.
The mean (median) proportion of stock held by the 20 largest shareholders (BOWN)is 63 per cent (65 per cent). The inter-quartile range for BOWN is 48 per cent-78 percent. Hossain et al. report a mean (median) BOWN of 76.3 per cent (78.3 per cent) andinter-quartile range of 68.7 per cent-87.3 per cent. Chen et al. (2008) report that 60 percent of stocks are held by five largest shareholders which are institutions. Althoughblock ownership in New Zealand has declined from an average of 76.3 per cent during1991/1997 period to 63 per cent in 1999/2007, it is still relatively high. A comparison toeconomies with similar financial systems where the fraction of shares held by thenon-controlling shareholder is 80 per cent and 90 per cent for the top 20 US and UKfirms, respectively (Kapopoulas and Lazaretou, 2007), New Zealand is very low. Thisindicates that New Zealand needs strong protection of minority shareholder rights tosafeguard their interest which may in turn increase liquidity in the stock market(Healey, 2003). In summary, there is evidence that large New Zealand firmsincreasingly use incentive-based mechanisms (such stock ownership) to motivate
IJMF6,3
200

managers and directors and therefore, manage agency conflicts. Since BOWN isrelatively high, this suggests IOWN is not a strong mechanism itself to deal withagency problems in large firms in New Zealand.
The mean (median) proportion of non-executive/independent directors is 76 per cent(80 per cent) with an inter-quartile range of 64 per cent-88 per cent. The typical(median) board has seven directors with a fairly narrow inter-quartile range of six toeight which is similar to Fox (1996) who notes that board size declined in New Zealandfrom seven members in 1970 to six members in 1983. The mediannon-executive/independent directors and size of the board remains relativelyconstant through the periods 1991/1997 and 1999/2007. This indicates that the sizeof boards, of large companies in New Zealand is appropriate for its size and the role itplays in terms of managing agency conflict.
On average, 96 per cent of the firms have an Audit Committee and 78 per cent have aRemuneration Committee. A high percentage of the large companies have boardcommittees recognising the important role they play in mitigating agency conflict.This is supported by the fact that the NZSC recommendations regarding boardcommittees came into effect after 2003, the results show that large companies have had
Variable Mean Median Min. Max. Inter-quartile range
Q-ratio 3.26 1.83 20.21 40.48 1.09-3.78MB 0.50 0.45 0.02 1.43 0.33-0.64ROA 2.84 1.85 0.05 25.62 1.12-3.34IOWN 0.12 0.01 0.00 1.000 0.00-0.16BOWN 0.62 0.65 0.05 0.95 0.47-0.77NED 0.76 0.80 0.0 1.00 0.64-0.88BDS 6.98 7.00 3 13 6-8ACOM 0.96 1.00 0 1RCOM 0.78 1.00 0 1LEV 0.47 0.44 22.04 0.98 0.32-0.63DIV2TA 0.06 0.04 0.000 1.00 0.02-0.06Log(TA) 5.85 5.75 4.44 8.59 5.26-6.29FMRISK 0.68 0.35 0.02 5.21 0.18-0.79BUSRISK 0.92 0.48 0 6.746 0.19-1.15
Notes: This table presents the descriptive statistics for the dependent and independent variables. Themeasurement of each variable is explained given as follows: Q ratio is Tobin’s Q approximated bytaking the sum of the market value of common equity, book value of long term liabilities, book value ofnet short term debt divided by the net fixed assets. MB is the market to book value of shareholders’equity. ROA is the net income dived by book value of total assets. IOWN is the proportion shares heldby all members of the board of directors, including top officers of the firm who are members of theboard to total shares outstanding. BOWN is the proportion of shares held by 20 largest shareholders ofthe firm. NED is the number of independent non-executive directors. BDS is the size of the board ofdirectors. ACOM is dummy variable set equal to 1 if companies have an audit committee, otherwise itis set equal to 0. RCOM is dummy variable set equal to 1 if companies have remuneration committee,otherwise it is set equal to 0. LEV is the proportion of the debt defined as long term liabilities plus shortterm liabilities divided by the total assets. DIV2TA is the dividend divided by book value of the totalassets. Log (TA) is the log of total assets is proxy for size. FMRISK is the standard deviation of thedaily stock price of the firm’s stock for each year from 1999 to 2007. BUSRISK is the standarddeviation of the five year return on assets
Table I.Pooled cross-section
time-series sampledescriptive statistics for
selected variables
Principle-basedcorporate
governance
201
board committees since 1999. In 1999, (on average) 86 per cent of the companies in thesample had audit committees and 64 per cent had remuneration committees. In 2006, 95per cent of the companies had audit committee and 91 per cent have remunerationcommittees.
The mean (median) dividend to total assets is 6 per cent (4 per cent) andinter-quartile range of 2 per cent-6 per cent, indicating that dividend payout is not highin large companies. This may be attributable to the fact that these larger companies arenot making a high profit and/or the small nature of New Zealand capital market makesit difficult to raise capital. Accordingly, profit is usually retained for future investmentpurposes. The mean (median) leverage is 47 per cent (44 per cent). The leverageincreased from 40.5 per cent in 1991/1997 to 47 per cent in 1999/2007. A simple T-testshows that the mean of leverage is significantly different for the period 1999/2007compared to the period 1991/1997. The result is statistically significant at the 1 per centsignificance level. An increase in leverage shows that a proportion of the cash flow isused to service debt. The mean (median) Log(TA) is 5.85 (5.75). The mean (median)firm level risk is 0.68 (0.35) and the inter-quartile range of 0.18-0.79. The mean (median)business level risk is 0.92 (0.48) and the inter-quartile range of 0.19 to 1.15.
On average, 16 per cent of the companies in the sample belong to primary industry,8 per cent energy, 21 per cent goods, 13 per cent property, 37 per cent service, 3 per centinvestment and 3 per cent overseas. This provides an opportunity to study thedifferences in the corporate governance practices in different industries in NewZealand.
4.2 Correlation analysisTable II presents a pairwise correlation matrix for the independent variables.Governance variables are not highly correlated with each other. There is a positivecorrelation between BDS and board sub-committees (ACOM and RCOM). Thisindicates that larger boards tend to have sub-committees. Block ownership (BOWN) ispositively correlated with IOWN indicating that firms that have block owners alsotends to have higher insider ownership. Company size is positively correlated withBOWN, NED, BDS and board sub-committees. The highest correlation of theindependent variables is between IND4 and RCOM at 20.62. None of the pairwisecorrelations between independent variables are above 0.62, indicating that thelikelihood of multicollinearity issues arising in the OLS regressions is low.
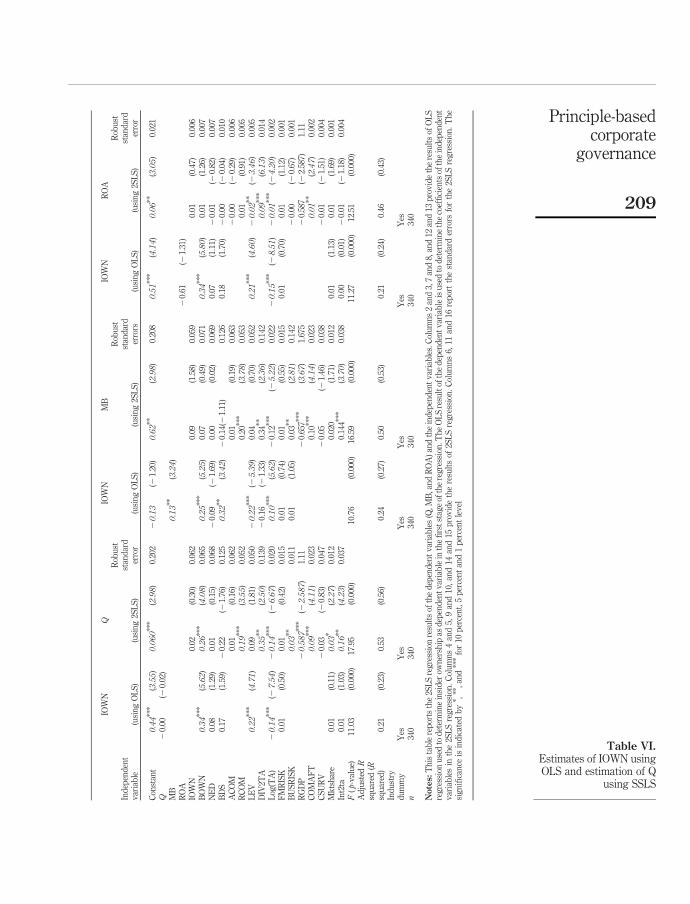
4.3 OLS regression of Tobin’s Q, MB and ROA on ownership, control variables andcompliance variablesTable III presents the OLS regression of equation (2)[4]. Columns 2 and 3, 5 and 6, and 8and 9 of Table III provide coefficients of independent variables that are used inequation (2). Table III, columns 2 and 3 provides coefficients of the independentvariables using Tobin’s Q as a dependent variable. The independent variables BOWNand DIV2TA have positive coefficients, indicating that these variables have a positiveeffect on firms’ financial performance measured by Tobin’s Q. Both these variables arestatistically significant at 5 per cent level.A negative coefficient for Log(TA), which is statistically significant at 1 per cent level,indicates that size has a negative effect on Tobin’s Q. This raises questions about thesize of large companies in New Zealand as to whether they increase size to derive
IJMF6,3
202

LO
WN
BO
WN
NE
DB
DS
LE
VD
IV2T
AA
CO
MR
CO
ML
og(T
A)
FM
RIS
KB
US
RIS
K
IOW
N–
BO
WN
0.211
**(0.000
)–
NE
D2
0.01
4(0
.793
)2
0.03
7(0
.497
)–
BD
S0.
055
(0.3
14)
0.319
**(0.000
)2
0.01
0(0
.858
)–
LE
V0.
015
(0.7
87)
20.
025
(0.6
46)
0.144
**(0.008
)0.209
**(0.000
)–
DIV
2TA
0.03
2(0
.558
)2
0.01
1(0
.842
)2
0.06
9(0
.207
)0.
008
(0.8
76)
20.180
**(0.001
)–
AC
OM
20.164
**(0.002
)2
0.02
8(0
.609
)0.
047
(0.3
86)
0.134
*(0.014
)0.108
*(0.046
)2
0.04
4(0
.420
)–
RC
OM
20.
016
(0.7
74)
20.
063
(0.2
50)
0.06
8(0
.209
)0.411
**(0.000
)0.276
**(0.000
)0.113
*(0.037
)0.264
**(0.000
)–
Log
(TA
)20.294
**(0.000
)0.190
**(0.000
)0.190
**(0.000
)0.361
**(0.000
)0.512
**(0.000
)20.243
**(0.000
)(0.144
)**(0.000
)0.
080
(0.1
42)
–F
MR
ISK
20.
016
(0.7
74)
0.196
**(0.000
)0.172
**(0.002
)0.313
**(0.000
)0.201
**(0.000
)0.
075
(0.1
70)
0.05
7(0
.298
)0.239
**(0.000
)0.359
**(0.000
)–
BU
SR
ISK
0.118
*(0.029
)0.175
**(0.001
)0.
016
(0.7
75)
0.201
**(0.000
)0.113
*(0.037
)0.108
*(0.046
)0.
084
(0.1
24)
0.132
*(0.000
)0.133
*(0.014
)0.369
**(0.000
)–
Notes:
Th
ista
ble
rep
orts
pai
rwis
eco
rrel
atio
ns
bet
wee
nal
lth
ein
dep
end
ent
var
iab
les
wh
ere
* ind
icat
essi
gn
ifica
nce
atth
e5
per
cen
tle
vel
;**
ind
icat
essi
gn
ifica
nce
at1
per
cen
tle
vel
Table II.Correlation matrix forindependent variables
Principle-basedcorporate
governance
203

Eq
uat
ion
2Q
MB
RO
A
Ind
epen
den
tv
aria
ble
Sta
nd
ard
erro
raf
ter
adju
sted
for
clu
ster
ing
Sta
nd
ard
erro
raf
ter
adju
sted
for
clu
ster
ing
Sta
nd
ard
erro
raf
ter
adju
sted
for
clu
ster
ing
Con
stan
t0.684
**
(3.06
)0.
244
0.841
**
*(3.93
)0.
213
0.02
9(1
.23)
0.02
3IO
WN
0.02
8(0
.44)
0.06
320.137
*(2
2.27
)0.
060
20.
007
(21.
01)
0.00
7B
OW
N0.199
**
(2.81
)0.
071
0.282
**
*(4.17
)0.
068
0.012
*(1.97
)0.
007
NE
D2
0.00
1(2
0.20
)0.
071
0..0
09(0
.15)
0.06
82
0.00
5(2
0.75
)0.
007
BD
S0.
186
(1.4
2)0.
150
20.
181
(21.
45)
0.12
52
0.00
1(2
0.11
)0.
013
AC
OM
20.
005
(20.
08)
0.06
30.
068
(0.1
3)0.
060
0.00
2(0
.35)
0.00
6R
CO
M0.165
**
(3.61
)0.
046
0.206
**
(2.45
)0.
043
0.023
**
(2.67
)0.
005
LE
V0.
078
(1.4
2)0.
055
0.252
**
(4.83
)0.
052
20.016
**
(23.96
)0.
005
DIV
2TA
0.291
*(2.01
)0.
145
0.351
*(2.54
)0.
138
0.087
**
*(5.91
)0.
015
Log
(TA
)20.127
**
*(2
5.68
)0.
023
20.107
**
*(2
5.04
)0.
021
20.009
**
*(2
3.92
)0.
002
FM
RIS
K0.
002
(0.1
2)0.
015
0.02
3(1
.57)
0.01
50.
002
(1.1
4)0.
002
BU
SR
ISK
0.032
**
(2.85
)0.
011
0.02
0(1
.85)
0.01
02
0.00
1(2
0.71
)0.
001
Com
Aft
0.092
**
*(3.46
)0.
006
0.117
**
*(4.88
)0.
043
0.009
**
(2.90
)0.
005
SU
RV
0.10
7(1
.30)
0.05
00.
126
(1.6
0)0.
047
0.002
**
(2.71
)0.
005
RG
DP
20.913
**
(2.56
)1.
390.
003
(0.0
0)1.
330.
147
(1.0
4)0.
141
Ad
just
edR
squ
ared
(Rsq
uar
ed)
0.49
(0.5
2)0.
40(0
.44)
0.44
(0.4
7)F
(p-v
alu
e)15
.88
(0.0
00)
11.0
9(0
.000
)12
.90
(0.0
00)
Ind
ust
ryd
um
my
Yes
yes
Yes
n34
034
034
0
Notes:
Th
ista
ble
rep
orts
the
OL
Sre
gre
ssio
nre
sult
sb
etw
een
the
dep
end
ent
var
iab
les
and
the
ind
epen
den
tv
aria
ble
s.C
olu
mn
s2
and
3,5
and
6,an
d8
and
9p
rov
ide
coef
fici
ents
ofth
ein
dep
end
ent
var
iab
les.
Th
eco
lum
ns
4,7
and
10re
por
tsst
and
ard
erro
rfo
rea
chin
dep
end
ent
var
iab
leaf
ter
ith
asb
een
adju
sted
for
clu
ster
ing
.T
he
sig
nifi
can
ceis
ind
icat
edb
y* ,
** ,
and
**
*fo
r10
per
cen
t,5
per
cen
tan
d1
per
cen
tle
vel
Table III.OLS regression estimatesusing Tobin’s Q, MB andROA as the dependentvariables
IJMF6,3
204

personal benefits for the managers. The coefficient of all the industry dummy variables(not reported)[5] are positive (accept IND6) and statistically significant at 5 per centlevel. This indicates that governance practices in these industries contribute positivelytowards Tobin’s Q. The coefficient of the RGDP (real annual GDP) is negative andstatistically significant at 5 per cent level indicating that growth in the New Zealandeconomy during the period contributed negatively towards Tobin’s Q. This may be thecase because growth in New Zealand economy was largely attributable to agriculturalexports and the same growth was not experienced by the others sectors of theeconomy.
Table III, column 4 provides coefficients of independent variables for equation (2)using MB as a dependent variable. The results are very similar to columns 2 and 3apart from insider ownership that has a negative coefficient and is statisticallysignificant at 10 percent level. This shows that insider ownership contributesnegatively towards firm performance measured by MB. The other statisticallysignificant results are for BOWN, LEV and DIV2TA, each having positive coefficients.The results indicate that blockholding, leverage and dividend payouts contributepositively towards firm performance measured by MB. Firm size (log (TA)) also has anegative coefficient which is significant at 1 per cent level. This confirms earlierfindings that size is optimal for large companies in New Zealand. The coefficient of theRGDP is negative and is not statistically significant.
Table III, columns 5 and 6 provides coefficients of independent variables forequation (2) using ROA as the dependent variable. The results are similar to columns 2and 3, and 4. The coefficients of BOWN and DIV2TA are positive and statisticallysignificant at 10 per cent and 1 per cent levels, respectively. However, coefficient ofLEV is negative and is statistically significant at 5 per cent level. The coefficient of thefirm size (Log(TA)) is negative and is statistically significant at 1 per cent level. Thecoefficient of IND3 (Goods) is positive (not reported) and statistically significantindicating that governance practices of firms in the Goods industry contributepositively towards performance measured by ROA.
The effect of the time period after the NZSC corporate governance recommendationsbecame effective is captured by the dummy variable AFTER2003. Also to capture theeffect of the NZSC recommendation on companies that were always in compliance withthe NZSC recommendations the dummy variable COMPLIED is used. The effect on thecompanies that consistently complied with the NZSC recommendations onperformance since 1999 is captured by the variable COMPLIED. The companies thatwere continuously present throughout the sampling period are measured by thedummy variable SURV. The variable ComAft measures the effect of complying withthe NZSC recommendations after 2003 on performance. ComAft is calculated bymultiplying COMPLIED by AFTER2003.
ComAft has a positive coefficient and is statistically significant at the 1 per centlevel providing evidence that performance is positively associated with the NZSCcompliance after 2003. The results for the time period before year 2004 show thatcompliance is negatively associated with firm performance and it is statisticallysignificant at 1 per cent significance level. This suggests that the time period before2004 had negative effects on performance and the years after 2004 have a positiveeffect on performance. This evidence supports the view that the promulgation of theNZSC recommendations has a positive effect on performance measured by Tobin’s Q,
Principle-basedcorporate
governance
205

MB and ROA. The companies that survived as NZX listings from 1999 did not showsignificant results. The variable SURV is positive and is statistically significant at 5per cent percent level. The companies that survived the sampling period were moreadaptive to the NZSC recommendations. In summary, the OLS regression supports thehypothesis that blockholding, leverage, dividend payouts and complying with theNZSC recommendations after 2003 have a positive effect on company performance.The hypotheses regarding blockholding (H1b), leverage (H3) and dividend payout (H4)are supported. However, the hypotheses regarding insider ownership (H1a), boardindependence (H2a) and board size (H2b) are not supported. The Sheffield surveyshows that managers in New Zealand are often rewarded for reasons other thanmeeting performance targets which points to insider ownership not being linked tofirm performance in New Zealand (Hembry, 2008). There is evidence of a positiverelationship between governance practices in different industries, such as, IND3(Goods) and IND7 (Overseas) on performance. This evidence supports the view that theprinciple-based governance approach has allowed different industries to developindustry specific governance structures which have a positive effect on performance.There is consistent evidence of company size having a negative effect on performance.
OLS results in Table III show that tolerance (1 2 R 2) ranges from 0.46 to 0.60 andvariance inflation factor (VIF) (1/Tolerance) range from 1.67 to 1.96, are withinacceptable range. According to Menard (1995) tolerance below 0.2 and VIF above 10are worthy of concern, which needs to be investigated.
The next stage of the analysis looks at whether there is any evidence of piecewiserelationship between insider ownership and firm performance, similar to the studies ofMorck et al. (1988) and McConnell and Servaes (1990).
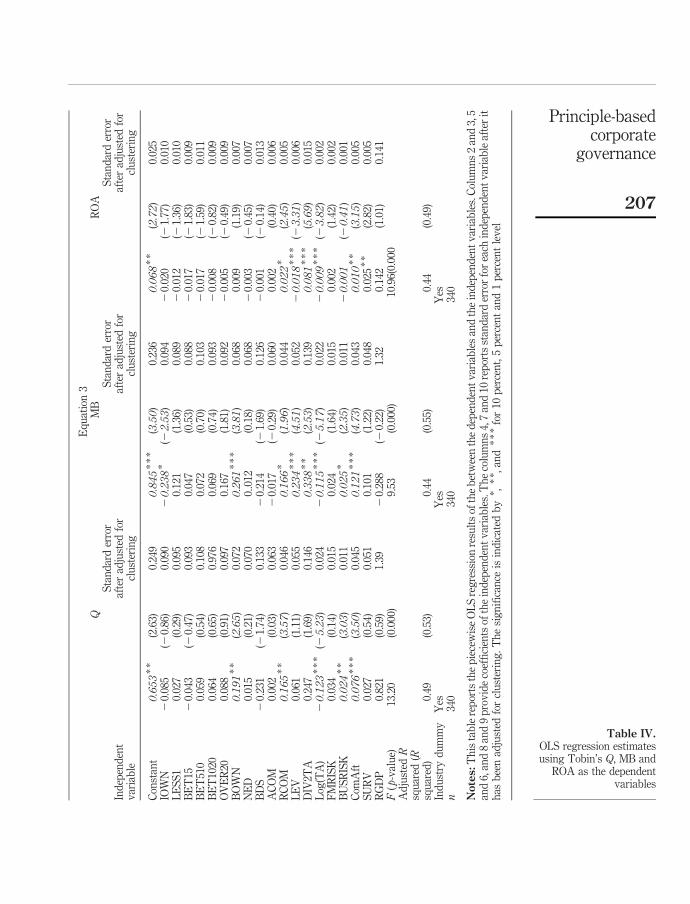
4.5 Piecewise regressionsA survey by Denis and McConnell (2003) show that there is no consensus about thelinearity of the relationship between ownership structure and performance. Table IVshows results of equation (3). There is no evidence of piece-wise relationship betweeninsider ownership in large companies in New Zealand and performance. Considerationof IOWN2, IOWN3 and BOWN2 finds no significant results[6].
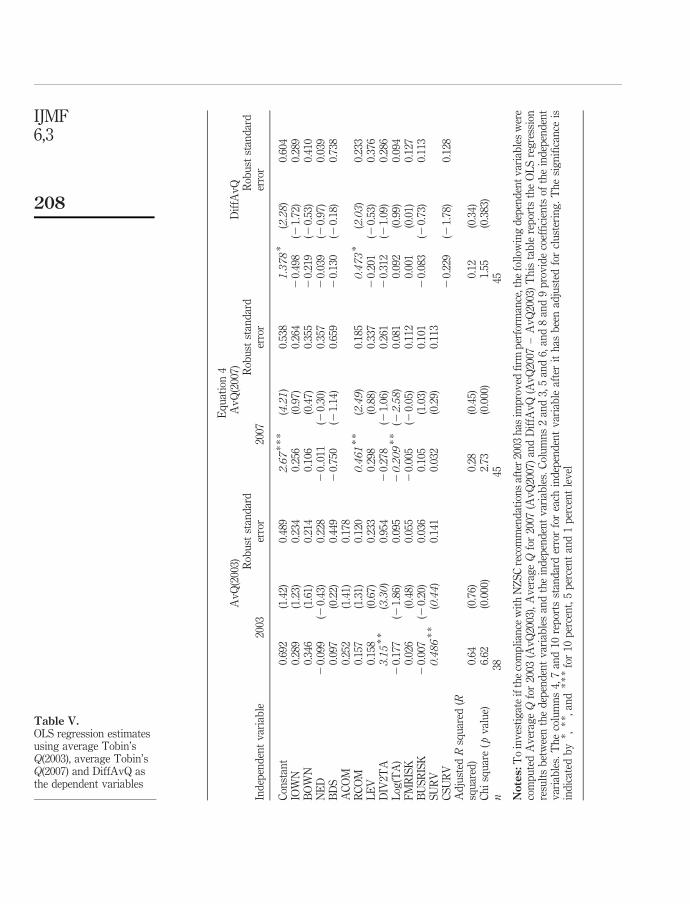
4.6 Linear regression of on difference in Tobin’s Q (between 2003 and 2007) onownership and control variablesTables V show the regression results of equation (4). The dependent variable for 2003is the average of Tobin’s Q for the years 1999 to 2003 which is regressed on the firmdata for 2003. The dependent variable for 2007 is the average of the Tobin’s Q for theyear 2004 to 2007 which is regressed on the firm data for 2007. The dependent variableDiffAvQ is the difference between AvQ(2007) and AvQ(2003). DiffAvQ measureswhether the companies that comply with NZSC recommendations in 2007 createpositive value compared to the firms in 2003. The AvQ(2003) is 0.95 and AvQ(2007) is1.09 and DiffAvQ is 1.53. Since DiffAvQ is positive it indicates that companies in 2007,on average, created more value than in 2003. The results in columns 4 and 5 of Table VIsuggest that only RCOM has a positive coefficient which is statistically significant at10 per cent level. The results show that an increase in company value in 2007 isinfluenced by the establishment of remuneration committees and a positive constant.
IJMF6,3
206
Eq
uat
ion
3Q
MB
RO
A
Ind
epen
den
tv
aria
ble
Sta
nd
ard
erro
raf
ter
adju
sted
for
clu
ster
ing
Sta
nd
ard
erro
raf
ter
adju
sted
for
clu
ster
ing
Sta
nd
ard
erro
raf
ter
adju
sted
for
clu
ster
ing
Con
stan
t0.653
**
(2.6
3)0.
249
0.845
**
*(3.50
)0.
236
0.068
**
(2.72
)0.
025
IOW
N2
0.08
5(2
0.86
)0.
090
20.238
*(2
2.53
)0.
094
20.
020
(21.
77)
0.01
0L
ES
S1
0.02
7(0
.29)
0.09
50.
121
(1.3
6)0.
089
20.
012
(21.
36)
0.01
0B
ET
152
0.04
3(2
0.47
)0.
093
0.04
7(0
.53)
0.08
82
0.01
7(2
1.83
)0.
009
BE
T51
00.
059
(0.5
4)0.
108
0.07
2(0
.70)
0.10
32
0.01
7(2
1.59
)0.
011
BE
T10
200.
064
(0.6
5)0.
976
0.06
9(0
.74)
0.09
32
0.00
8(2
0.82
)0.
009
OV
ER
200.
088
(0.9
1)0.
097
0.16
7(1
.81)
0.09
22
0.00
5(2
0.49
)0.
009
BO
WN
0.191
**
(2.65
)0.
072
0.261
**
*(3.81
)0.
068
0.00
9(1
.19)
0.00
7N
ED
0.01
5(0
.21)
0.07
00.
.012
(0.1
8)0.
068
20.
003
(20.
45)
0.00
7B
DS
20.
231
(21.
74)
0.13
32
0.21
4(2
1.69
)0.
126
20.
001
(20.
14)
0.01
3A
CO
M0.
002
(0.0
3)0.
063
20.
017
(20.
29)
0.06
00.
002
(0.4
0)0.
006
RC
OM
0.165
**
(3.57
)0.
046
0.166
*(1.96
)0.
044
0.022
*(2.45
)0.
005
LE
V0.
061
(1.1
1)0.
055
0.234
**
*(4.51
)0.
052
20.018
**
*(2
3.31
)0.
006
DIV
2TA
0.24
7(1
.69)
0.14
60.338
**
(2.53
)0.
139
0.081
**
*(5.69
)0.
015
Log
(TA
)20.123
**
*(2
5.23
)0.
024
20.115
**
*(2
5.17
)0.
022
20.009
**
*(2
3.82
)0.
002
FM
RIS
K0.
034
(0.1
4)0.
015
0.02
4(1
.64)
0.01
50.
002
(1.4
2)0.
002
BU
SR
ISK
0.024
**
(3.03
)0.
011
0.025
*(2.35
)0.
011
20.001
(20.41
)0.
001
Com
Aft
0.076
**
*(3.50
)0.
045
0.121
**
*(4.73
)0.
043
0.010
**
(3.15
)0.
005
SU
RV
0.02
7(0
.54)
0.05
10.
101
(1.2
2)0.
048
0.02
5*
*(2
.82)
0.00
5R
GD
P0.
821
(0.5
9)1.
392
0.28
8(2
0.22
)1.
320.
142
(1.0
1)0.
141
F(p
-val
ue)
13.2
0(0
.000
)9.
53(0
.000
)10
.96(
0.00
0A
dju
sted
Rsq
uar
ed(R
squ
ared
)0.
49(0
.53)
0.44
(0.5
5)0.
44(0
.49)
Ind
ust
ryd
um
my
Yes
Yes
Yes
n34
034
034
0
Notes:
Th
ista
ble
rep
orts
the
pie
cew
ise
OL
Sre
gre
ssio
nre
sult
sof
the
bet
wee
nth
ed
epen
den
tv
aria
ble
san
dth
ein
dep
end
ent
var
iab
les.
Col
um
ns
2an
d3,
5an
d6,
and
8an
d9
pro
vid
eco
effi
cien
tsof
the
ind
epen
den
tv
aria
ble
s.T
he
colu
mn
s4,
7an
d10
rep
orts
stan
dar
der
ror
for
each
ind
epen
den
tv
aria
ble
afte
rit
has
bee
nad
just
edfo
rcl
ust
erin
g.
Th
esi
gn
ifica
nce
isin
dic
ated
by
* ,*
* ,an
d*
**
for
10p
erce
nt,
5p
erce
nt
and
1p
erce
nt
lev
el
Table IV.OLS regression estimatesusing Tobin’s Q, MB and
ROA as the dependentvariables
Principle-basedcorporate
governance
207
Eq
uat
ion
4A
vQ
(200
3)A
vQ
(200
7)D
iffA
vQ
Ind
epen
den
tv
aria
ble
2003
Rob
ust
stan
dar
der
ror
2007
Rob
ust
stan
dar
der
ror
Rob
ust
stan
dar
der
ror
Con
stan
t0.
692
(1.4
2)0.
489
2.67
**
*(4.21
)0.
538
1.378
*(2.28
)0.
604
IOW
N0.
289
(1.2
3)0.
234
0.25
6(0
.97)
0.26
42
0.49
8(2
1.72
)0.
289
BO
WN
0.34
6(1
.61)
0.21
40.
106
(0.4
7)0.
355
20.
219
(20.
53)
0.41
0N
ED
20.
099
(20.
43)
0.22
82
0..0
11(2
0.30
)0.
357
20.
039
(20.
97)
0.03
9B
DS
0.09
7(0
.22)
0.44
92
0.75
0(2
1.14
)0.
659
20.
130
(20.
18)
0.73
8A
CO
M0.
252
(1.4
1)0.
178
RC
OM
0.15
7(1
.31)
0.12
00.461
**
(2.49
)0.
185
0.473
*(2.03
)0.
233
LE
V0.
158
(0.6
7)0.
233
0.29
8(0
.88)
0.33
72
0.20
1(2
0.53
)0.
376
DIV
2TA
3.15
**
(3.30
)0.
954
20.
278
(21.
06)
0.26
12
0.31
2(2
1.09
)0.
286
Log
(TA
)2
0.17
7(2
1.86
)0.
095
20.209
**
(22.58
)0.
081
0.09
2(0
.99)
0.09
4F
MR
ISK
0.02
6(0
.48)
0.05
52
0.00
5(2
0.05
)0.
112
0.00
1(0
.01)
0.12
7B
US
RIS
K2
0.00
7(2
0.20
)0.
036
0.10
5(1
.03)
0.10
12
0.08
3(2
0.73
)0.
113
SU
RV
0.486
**
(0.44
)0.
141
0.03
2(0
.29)
0.11
3C
SU
RV
20.
229
(21.
78)
0.12
8A
dju
sted
Rsq
uar
ed(R
squ
ared
)0.
64(0
.76)
0.28
(0.4
5)0.
12(0
.34)
Ch
isq
uar
e(p
val
ue)
6.62
(0.0
00)
2.73
(0.0
00)
1.55
(0.3
83)
n38
4545
Notes:
To
inv
esti
gat
eif
the
com
pli
ance
wit
hN
ZS
Cre
com
men
dat
ion
saf
ter
2003
has
imp
rov
edfi
rmp
erfo
rman
ce,t
he
foll
owin
gd
epen
den
tv
aria
ble
sw
ere
com
pu
ted
Av
erag
eQ
for
2003
(Av
Q20
03),
Av
erag
eQ
for
2007
(Av
Q20
07)
and
Dif
fAv
Q(A
vQ
2007
–A
vQ
2003
)T
his
tab
lere
por
tsth
eO
LS
reg
ress
ion
resu
lts
bet
wee
nth
ed
epen
den
tv
aria
ble
san
dth
ein
dep
end
ent
var
iab
les.
Col
um
ns
2an
d3,
5an
d6,
and
8an
d9
pro
vid
eco
effi
cien
tsof
the
ind
epen
den
tv
aria
ble
s.T
he
colu
mn
s4,
7an
d10
rep
orts
stan
dar
der
ror
for
each
ind
epen
den
tv
aria
ble
afte
rit
has
bee
nad
just
edfo
rcl
ust
erin
g.
Th
esi
gn
ifica
nce
isin
dic
ated
by
* ,*
* ,an
d*
**
for
10p
erce
nt,
5p
erce
nt
and
1p
erce
nt
lev
el
Table V.OLS regression estimatesusing average Tobin’sQ(2003), average Tobin’sQ(2007) and DiffAvQ asthe dependent variables
IJMF6,3
208
IOW
NQ
IOW
NM
BIO
WN
RO
A
Ind
epen
den
tv
aria
ble
(usi
ng
OL
S)
(usi
ng
2SL
S)
Rob
ust
stan
dar
der
ror
(usi
ng
OL
S)
(usi
ng
2SL
S)
Rob
ust
stan
dar
der
rors
(usi
ng
OL
S)
(usi
ng
2SL
S)
Rob
ust
stan
dar
der
ror
Con
stan
t0.44
***
(3.55
)0.060
***
(2.98
)0.
202
20.13
(21.
20)
0.62
**(2.98
)0.
208
0.51
***
(4.14
)0.06
**(3.05
)0.
021
Q2
0.00
(20.
02)
MB
0.13
**(3.24
)R
OA
20.
61(2
1.31
)IO
WN
0.02
(0.3
0)0.
062
0.09
(1.5
8)0.
059
0.01
(0.4
7)0.
006
BO
WN
0.34
***
(5.62
)0.26
***
(4.08
)0.
065
0.25
***
(5.25
)0.
07(0
.49)
0.07
10.34
***
(5.80
)0.
01(1
.26)
0.00
7N
ED
0.08
(1.2
9)0.
01(0
.15)
0.06
82
0.09
(21.
69)
0.00
(0.0
2)0.
069
0.07
(1.1
1)2
0.01
(20.
82)
0.00
7B
DS
0.17
(1.5
9)2
0.22
(21.
76)
0.12
50.32
**(3.42
)2
0.14
(21.
11)
0.12
60.
18(1
.70)
20.
00(2
0.04
)0.
010
AC
OM
0.01
(0.1
6)0.
062
0.01
(0.1
9)0.
063
20.
00(2
0.29
)0.
006
RC
OM
0.19
***
(3.55
)0.
052
0.20
***
(3.78
)0.
053
0.01
(0.9
1)0.
005
LE
V0.22
***
(4.71
)0.
09(1
.81)
0.05
020.22
***
(25.39
)0.
04(0
.70)
0.05
20.21
***
(4.60
)20.02
**(2
3.46
)0.
005
DIV
2TA
0.35
**(2.50
)0.
139
20.
16(2
1.33
)0.
34**
(2.36
)0.
142
0.09
***
(6.13
)0.
014
Log
(TA
)20.14
***
(27.54
)20.14
***
(26.67
)0.
020
0.10
***
(5.62
)2
0.12
***
(25.22
)0.
022
20.15
***
(28.51
)20.01
***
(24.20
)0.
002
FM
RIS
K0.
01(0
.50)
0.01
(0.4
2)0.
015
0.01
(0.7
4)0.
01(0
.55)
0.01
50.
01(0
.70)
0.01
(1.1
2)0.
001
BU
SR
ISK
0.03
**0.
011
0.01
(1.0
5)0.
03**
(2.81
)0.
142
20.
00(2
0.67
)0.
001
RG
DP
20.587
***
(22.587
)1.
112
0.65
7***
(3.67
)1.
675
20.
587
(22.
587)
1.11
CO
MA
FT
0.09
***
(4.11
)0.
023
0.10
***
(4.14
)0.
023
0.01
**(2.47
)0.
002
CS
UR
V2
0.03
(20.
83)
0.04
72
0.05
(21.
46)
0.03
82
0.01
(21.
51)
0.00
4M
kts
har
e0.
01(0
.11)
0.03
*(2.27
)0.
012
0.02
0(1
.71)
0.01
20.
01(1
.13)
0.01
(1.6
9)0.
001
Int2
ta0.
01(1
.03)
0.16
**(4.23
)0.
037
0.14
4***
(3.70
)0.
038
0.00
(0.0
1)2
0.01
(21.
18)
0.00
4F
(p-v
alu
e)11
.03
(0.0
00)
17.9
5(0
.000
)10
.76
(0.0
00)
16.5
9(0
.000
)11
.27
(0.0
00)
12.5
1(0
.000
)A
dju
sted
Rsq
uar
ed(R
squ
ared
)0.
21(0
.23)
0.53
(0.5
6)0.
24(0
.27)
0.50
(0.5
3)0.
21(0
.24)
0.46
(0.4
3)In
du
stry
du
mm
yY
esY
esY
esY
esY
esY
esn
340
340
340
340
340
340
Notes:
Th
ista
ble
rep
orts
the
2SL
Sre
gre
ssio
nre
sult
sof
the
dep
end
ent
var
iab
les
(Q,M
B,a
nd
RO
A)
and
the
ind
epen
den
tv
aria
ble
s.C
olu
mn
s2
and
3,7
and
8,an
d12
and
13p
rov
ide
the
resu
lts
ofO
LS
reg
ress
ion
use
dto
det
erm
ine
insi
der
own
ersh
ipas
dep
end
ent
var
iab
lein
the
firs
tst
age
ofth
ere
gre
ssio
n.T
he
OL
Sre
sult
ofth
ed
epen
den
tv
aria
ble
isu
sed
tod
eter
min
eth
eco
effi
cien
tsof
the
ind
epen
den
tv
aria
ble
sin
the
2SL
Sre
gre
ssio
n.
Col
um
ns
4an
d5,
9an
d10
,an
d14
and
15p
rov
ide
the
resu
lts
of2S
LS
reg
ress
ion
.C
olu
mn
s6,
11an
d16
rep
ort
the
stan
dar
der
rors
for
the
2SL
Sre
gre
ssio
n.
Th
esi
gn
ifica
nce
isin
dic
ated
by
* ,**
,an
d**
*fo
r10
per
cen
t,5
per
cen
tan
d1
per
cen
tle
vel
Table VI.Estimates of IOWN usingOLS and estimation of Q
using SSLS
Principle-basedcorporate
governance
209
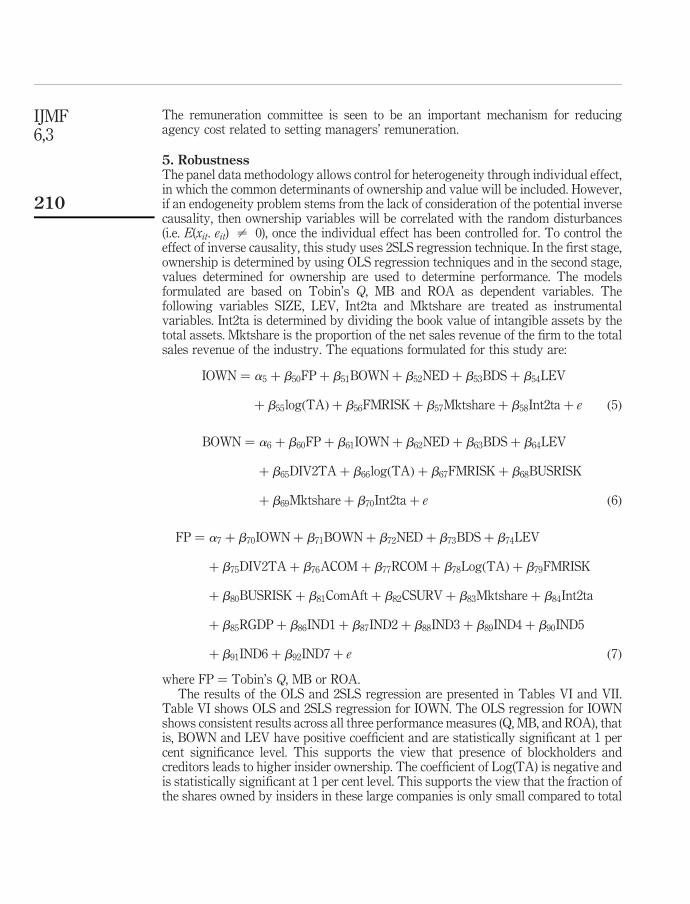
The remuneration committee is seen to be an important mechanism for reducingagency cost related to setting managers’ remuneration.
5. RobustnessThe panel data methodology allows control for heterogeneity through individual effect,in which the common determinants of ownership and value will be included. However,if an endogeneity problem stems from the lack of consideration of the potential inversecausality, then ownership variables will be correlated with the random disturbances(i.e. E(xit. eit) – 0), once the individual effect has been controlled for. To control theeffect of inverse causality, this study uses 2SLS regression technique. In the first stage,ownership is determined by using OLS regression techniques and in the second stage,values determined for ownership are used to determine performance. The modelsformulated are based on Tobin’s Q, MB and ROA as dependent variables. Thefollowing variables SIZE, LEV, Int2ta and Mktshare are treated as instrumentalvariables. Int2ta is determined by dividing the book value of intangible assets by thetotal assets. Mktshare is the proportion of the net sales revenue of the firm to the totalsales revenue of the industry. The equations formulated for this study are:
IOWN ¼ a5 þ b50FP þ b51BOWN þ b52NED þ b53BDS þ b54LEV
þ b55logðTAÞ þ b56FMRISK þ b57Mktshare þ b58Int2ta þ e ð5Þ
BOWN ¼ a6 þ b60FP þ b61IOWN þ b62NED þ b63BDS þ b64LEV
þ b65DIV2TA þ b66logðTAÞ þ b67FMRISK þ b68BUSRISK
þ b69Mktshare þ b70Int2ta þ e ð6Þ
FP ¼ a7 þ b70IOWN þ b71BOWN þ b72NED þ b73BDS þ b74LEV
þ b75DIV2TA þ b76ACOM þ b77RCOM þ b78LogðTAÞ þ b79FMRISK
þ b80BUSRISK þ b81ComAft þ b82CSURV þ b83Mktshare þ b84Int2ta
þ b85RGDP þ b86IND1 þ b87IND2 þ b88IND3 þ b89IND4 þ b90IND5
þ b91IND6 þ b92IND7 þ e ð7Þ
where FP ¼ Tobin’s Q, MB or ROA.The results of the OLS and 2SLS regression are presented in Tables VI and VII.
Table VI shows OLS and 2SLS regression for IOWN. The OLS regression for IOWNshows consistent results across all three performance measures (Q, MB, and ROA), thatis, BOWN and LEV have positive coefficient and are statistically significant at 1 percent significance level. This supports the view that presence of blockholders andcreditors leads to higher insider ownership. The coefficient of Log(TA) is negative andis statistically significant at 1 per cent level. This supports the view that the fraction ofthe shares owned by insiders in these large companies is only small compared to total
IJMF6,3
210
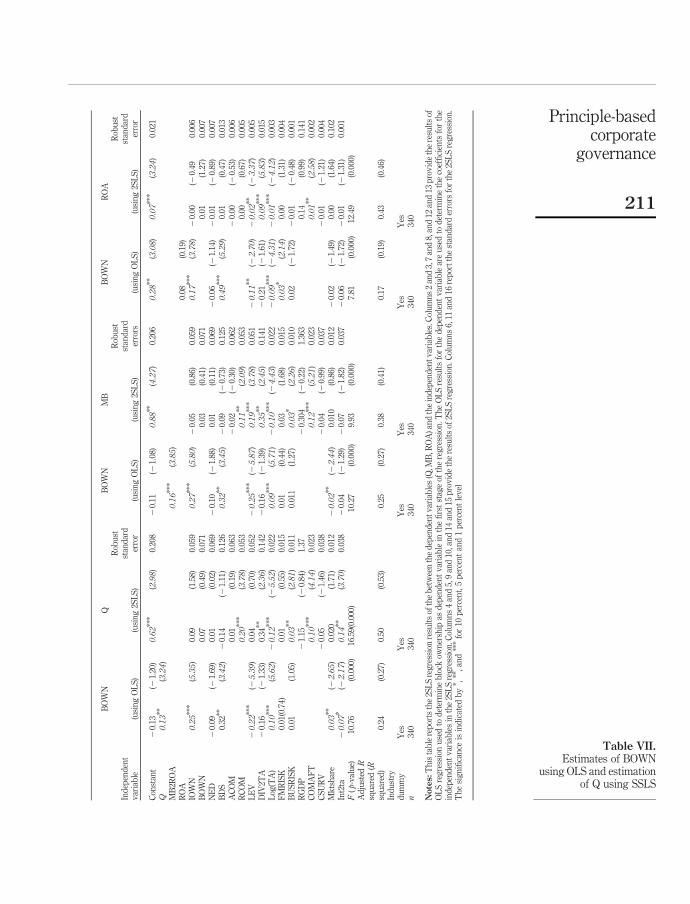
BO
WN
QB
OW
NM
BB
OW
NR
OA
Ind
epen
den
tv
aria
ble
(usi
ng
OL
S)
(usi
ng
2SL
S)
Rob
ust
stan
dar
der
ror
(usi
ng
OL
S)
(usi
ng
2SL
S)
Rob
ust
stan
dar
der
rors
(usi
ng
OL
S)
(usi
ng
2SL
S)
Rob
ust
stan
dar
der
ror
Con
stan
t2
0.13
(21.
20)
0.62
***
(2.98
)0.
208
20.
11(2
1.08
)0.88
**(4.27
)0.
206
0.28
**(3.08
)0.07
***
(3.24
)0.
021
Q0.13
**(3.24
)M
B2R
OA
0.16
***
(3.85
)R
OA
0.08
(0.1
9)IO
WN
0.25
***
(5.35
)0.
09(1
.58)
0.05
90.27
***
(5.80
)2
0.05
(0.8
6)0.
059
0.17
***
(3.78
)2
0.00
(20.
490.
006
BO
WN
0.07
(0.4
9)0.
071
0.03
(0.4
1)0.
071
0.01
(1.2
7)0.
007
NE
D2
0.09
(21.
69)
0.01
(0.0
2)0.
069
20.
10(2
1.88
)0.
01(0
.11)
0.06
92
0.06
(21.
14)
20.
01(2
0.89
)0.
007
BD
S0.
32**
(3.42
)2
0.14
(21.
11)
0.12
60.32
**(3.45
)2
0.09
(20.
73)
0.12
50.49
***
(5.29
)0.
01(0
.47)
0.01
3A
CO
M0.
01(0
.19)
0.06
32
0.02
(20.
30)
0.06
22
0.00
(20.
53)
0.00
6R
CO
M0.20
***
(3.78
)0.
053
0.11
**(2.09
)0.
053
0.00
(0.6
7)0.
005
LE
V20.22
***
(25.39
)0.
04(0
.70)
0.05
220.25
***
(25.87
)0.19
***
(3.78
)0.
051
20.11
**(2
2.70
)20.02
**(2
3.37
)0.
005
DIV
2TA
20.
16(2
1.33
)0.
34**
(2.36
)0.
142
20.
16(2
1.39
)0.35
**(2.45
)0.
141
20.
21(2
1.61
)0.09
***
(5.83
)0.
015
Log
(TA
)0.10
***
(5.62
)20.12
***
(25.52
)0.
022
0.09
***
(5.71
)20.10
***
(24.43
)0.
022
20.09
***
(24.31
)20.01
***
(24.12
)0.
003
FM
RIS
K0.
01(0
.74)
0.01
(0.5
5)0.
015
0.01
(0.4
4)0.
03(1
.68)
0.01
50.03
*(2.14
)0.
00(1
.31)
0.00
4B
US
RIS
K0.
01(1
.05)
0.03
**(2.81
)0.
011
0.01
1(1
.27)
0.03
*(2.26
)0.
010
0.02
(21.
72)
20.
01(2
0.48
)0.
001
RG
DP
21.
15(2
0.84
)1.
372
0.30
4(2
0.22
)1.
363
0.14
(0.9
9)0.
141
CO
MA
FT
0.10
***
(4.14
)0.
023
0.12
***
(5.21
)0.
023
0.01
**(2.58
)0.
002
CS
UR
V2
0.05
(21.
46)
0.03
82
0.04
(20.
99)
0.03
72
0.01
(21.
21)
0.00
4M
kts
har
e0.03
**(2
2.65
)0.
020
(1.7
1)0.
012
20.02
**(2
2.44
)0.
010
(0.8
6)0.
012
20.
02(2
1.49
)0.
00(1
.64)
0.10
2In
t2ta
20.07
*(2
2.17
)0.14
**(3.70
)0.
038
20.
04(2
1.29
)2
0.07
(21.
82)
0.03
72
0.06
(21.
72)
20.
01(2
1.31
)0.
001
F(p
-val
ue)
10.7
6(0
.000
)16
.59(
0.00
0)10
.27
(0.0
00)
9.93
(0.0
00)
7.81
(0.0
00)
12.4
9(0
.000
)A
dju
sted
Rsq
uar
ed(R
squ
ared
)0.
24(0
.27)
0.50
(0.5
3)0.
25(0
.27)
0.38
(0.4
1)0.
17(0
.19)
0.43
(0.4
6)In
du
stry
du
mm
yY
esY
esY
esY
esY
esY
esn
340
340
340
340
340
340
Notes:
Th
ista
ble
rep
orts
the
2SL
Sre
gre
ssio
nre
sult
sof
the
bet
wee
nth
ed
epen
den
tv
aria
ble
s(Q
,MB
,RO
A)a
nd
the
ind
epen
den
tv
aria
ble
s.C
olu
mn
s2
and
3,7
and
8,an
d12
and
13p
rov
ide
the
resu
lts
ofO
LS
reg
ress
ion
use
dto
det
erm
ine
blo
ckow
ner
ship
asd
epen
den
tv
aria
ble
inth
efi
rst
stag
eof
the
reg
ress
ion
.Th
eO
LS
resu
lts
for
the
dep
end
ent
var
iab
lear
eu
sed
tod
eter
min
eth
eco
effi
cien
tsfo
rth
ein
dep
end
ent
var
iab
les
inth
e2S
LS
reg
ress
ion
.Col
um
ns
4an
d5,
9an
d10
,an
d14
and
15p
rov
ide
the
resu
lts
of2S
LS
reg
ress
ion
.Col
um
ns
6,11
and
16re
por
tth
est
and
ard
erro
rsfo
rth
e2S
LS
reg
ress
ion
.T
he
sig
nifi
can
ceis
ind
icat
edb
y* ,
**,
and
***
for
10p
erce
nt,
5p
erce
nt
and
1p
erce
nt
lev
el
Table VII.Estimates of BOWN
using OLS and estimationof Q using SSLS
Principle-basedcorporate
governance
211

shares issued. When insider ownership is considered to be endogenous, variable IOWNis no longer statistically significant across all performance measures. The coefficientsof 2SLS regression for the independent variables are listed in columns 4 and 5, 9 and 10and 14 and 15 of Table VI. Variables BOWN, RCOM, LEV, DIV2TA, and ComAft arepositive and are statistically significant. This confirms the earlier findings of Tables III,IV and V that the presence of blockholding, remuneration committee and compliance toNZSC recommendations leads to an improvement in the performance of largecompanies in New Zealand.
This study does not support the view that insider ownership has had a positiveeffect on firm performance measured by Q, MB and ROA. The use of variables, such as,mktshare and int2ta has improved the predictive power of the model as indicated byboth the adjusted R 2 and R 2. The results in Table VI show that both variables arepositive and statistically significant at 5 percent and 10 percent level, respectively. Theadjusted R2 (R 2) increased from 0.49 (0.52) in Table IV to 0.53 (0.56) in Table VI. Thisprovides evidence that the effect of the unobservable values in the model have beencaptured by these variables, therefore rejecting the hypothesis that E(xit.ut – 0). Theargument by Demsetz and Lehn that insider ownership does not affect performance issupported. The results for 2SLS regression treating IOWN as endogenous is similar tothe OLS regression results given in Tables III, IV and V. The test for the hypothesisthat E(xit. eit) – 0) is rejected because p-value is high[7] and therefore, supporting theview that there is no evidence of endogeneity associated with insider ownership.
These findings differ from Hossain et al. (2001) who suggest that there is a linkbetween insider ownership and performance. Their sample included both small andlarge firms. In New Zealand, small companies tend to have a higher proportion ofinsider ownership (on average 31.3 per cent) compared to large firms (12 per cent)(Reddy et al., 2008a).
The coefficients of the independent variables for the OLS regression for BOWN aregiven in columns 2 and 3, 7 and 8 and 12 and 13 of Table VII. The results are consistentacross all three performance measures (Q, MB, and ROA), indicating that insiderownership (IOWN), board size (BDS) and firm size (Log(TA) have positive coefficientsand are statistically significant at 5 per cent level. This shows that the presence ofinsider ownership, large board and large companies contribute positively towardsblock holding. The variables LEV and Marketshare have negative coefficients and arestatistically significant at 5 per cent level, showing that higher levels of leverage andmarket share tends to lower the level of block holding in large companies.
The results of 2SLS regression are given in columns 4 and 5, 9 and 10, 14 and 15 ofTable VII. When block ownership is considered to be endogenous, the 2SLS results areconsistent across all three performance measures, that is, Q, MB and ROA. Theownership variables BOWN and IOWN are not statistically significant across allperformance measures. The evidence supports the view that the inclusion of thevariables mktshare and int2ta have improved the explanatory power of the model, thatis, adjusted R 2 (R 2) increased from 0.49 (0.52) in Table IV to 0.50 (0.53) in Table VII.The values of the unobservable characteristics of the model are captured by thesevariables and not supporting hypothesis that E(xit.ut – 0). On the other hand resultsfor the 2SLS regression support the view postulated by Demsetz and Lehn (1985) andDemsetz and Villalonga (2001) that when reverse causality is considered, therelationship between ownership and performance disappears. The test finds evidence
IJMF6,3
212

of reserve causality between block ownership and performance, supporting thehypothesis E(xit. eit) – 0).
The results in Table VII also show that the coefficients of independent variablesRCOM, DIV2TA, BUSRISK and ComAft are positive and statistically significantacross all performance measures, that is, Q, MB and ROA. The firm size and leveragetend to have negative coefficients and are statistically significant. The results supportthe view that variation in firm performance is explained by factors other thanownership.
In summary, the OLS and 2SLS regression of the two ownership variables showsinconsistent results while insider ownership shows consistent findings. The effect ofinsider ownership on performance is insignificant, supporting the findings of thesurvey undertaken by Sheffield in 2007, that there is no link between pay andperformance in New Zealand. However, the OLS and 2SLS regressions forblockholding show inconsistent results. The OLS results show that blockholdingcontribute positively towards firm performance measured by Tobin’s Q, MB and ROAand, therefore, can be regarded as an effective mechanism to mitigate agency problemsin large companies in New Zealand. However, 2SLS regressions results in Table VIIshow that when inverse causality is considered, the effect of blockholding onperformance is not significant. This supports the findings of Demsetz (1983), Demsetzand Lehn (1985), Himmelberg et al. (1999) and Demsetz and Villalonga (2001). There isevidence that the variation in performance is explained by variables other thanownership. The results are consistent across different performance measures (Q, MBand ROA) and also for OLS and 2SLS regressions. The results show that RCOM andDIV2TA have a positive effect on performance. The positive and statisticallysignificant coefficient of ComAft supports the view that compliance with NZSCrecommendations has a positive effect of company performance. The results also showthat the companies that comply with NZSC recommendations after 2003 have apositive effect on performance. There are consistent results suggesting firm size andLEV are inversely related to firm performance.
6. ConclusionThe aim of this study was to explore the efficacy of the principle-based corporategovernance practices on company financial performance, as measured by Tobin’s Q,market to book (MB) and return on assets (ROA). In order to achieve the aim twoimportant questions are addressed:
(1) Does compliance with NZSC recommendations lead to an improvement inperformance?
(2) Do companies that comply with NZSC recommendations after 2003 improveperformance?
The governance factors, namely, non-executive directors and board committeesrecommended by the NZSC in 2004 are of particular interest. The findings reveal thatlarge companies in New Zealand, in general, have complied with the SecuritiesCommission’s guidelines. The findings indicate that large companies in New Zealandhave good governance practices such as non-executive/independent directors andboard committees dating from 1999. Their results show that board independence andboard size do not have any significant effect on firm performance across all
Principle-basedcorporate
governance
213

performance measures. This finding is consistent with the studies conducted in theUSA, which follows a rule-based governance system. Further, the findings areconsistent with the analyses of Agrawal and Knoeber (1996); Bhagat and Black (1998);Yermack (1996); Klein (1998); Baxter (2006) and Reddy et al. (2008a).
The results categorically support the view that compliance with NZSC requirementshas improved firm financial performance. The presence of a remuneration committeehas a positive effect of firm performance measured by Q, MB and ROA. The coefficientof audit committee (ACOM) is mixed and not statistically significant indicating thataudit committees do not enhance performance.
The empirical results do indicate that other governance mechanisms, namely,dividend payout, can be utilised to minimise agency problems in an efficient manner.Dividend payouts have also contributed positively towards firm financial performance.Business risk seems to be positively associated with firm performance.
Block ownership is quite high in New Zealand companies, when compared to othercountries, and the OLS regression shows that blockholding is contributing positivelytowards creation of shareholder value. However, when endogeneity is considered, theeffect of blockholding on performance disappears. The size of the company is inverselyrelated to financial performance indicating managers have increased company size forpersonal benefits rather than to increase shareholder value. Also leverage is inverselyrelated to performance indicating that the cost of servicing debt outweighs anymonitoring benefit that is provided.
The question of whether NZSC guidelines cause firms to be more compliancefocused or more strategically focused is dependent on the effect of the governancefactors on performance. The findings strongly support the view that the companyperformance is strongly associated with the time period after 2003, indicatingperformance does improve after the new mandatory requirements are introduced. Thissupports the view that the NZSC recommendations have a positive influence oncompany performance measured by Tobin’s Q, MB and ROA.
The evidence also provides support to the view that principle-based governanceapproach has allowed different industries to develop industry specific governancestructures. The empirical results reported in Table III show that IND3 (goods) andIND7 (Overseas) have a positive effect on performance.
The question left unanswered is why the empirical results for the NZSCrecommendations of having non-executive/independent directors do not appear to bestatistically significantly related to performance. The reason could be that thecompanies already have good governance structures in place and havingnon-executive independent directors does not result in any significant improvementin performance. Alternatively, non-executive/independent directors are appointed tofulfil the NZSC recommendations and they lack knowledge about the firm/industryand therefore, add no value to the company.
Lastly, jurisdictions around the world are adopting the International FinancialReporting Standards (IFRS). In New Zealand, the Accounting Standard Review Board(ASRB) in December 2002 determined that entities required to comply with NZ GAAPunder the Financial Reporting Act 1993 would be required to apply NZ IFRS in thepreparation of their financial statements for periods commencing on or after January2007, with the option to apply from reporting periods beginning on or after 1 January2005. NZSC (2008) provides evidence that for companies with balance dates from 31
IJMF6,3
214
March 2006 to 30 September 2006 a number have complied with the NZ IFRS. Thecompliance with NZ IFRS will have an impact on the way financial data are collatedand reported. The effect of the change in reporting requirements from NZ GAAP to NZIRFS have had on data collected for companies that has reported under NZ IRFS isdifficult to identify. Therefore, the readers should apply discretion when trying toduplicate or extend this study cognisant of the discontinuity in the data series relatingto IFRS introduction.
Notes
1. Is also referred as “Codes of Best Practice” in some countries. These are “soft law” (seeMorth, 2004) or “soft regulation” (see Sahlin-Andersson, 2004) that are non-binding and areissued by a collective body relating to the internal governance of corporations (Weil, Gotshaland Manges, LLP, 2004). The first serious “Code of Best Practice” was the Cadbury Report1992 that issued by a Committee that was set up by the London Stock Exchange and theFinancial Reporting Council. The precursors of the Cadbury Report were the code issued inthe USA in 1978 and Hong Kong in 1989. However, these codes were relatively general anddid not receive much attention (Seidl, 2006).
2. The New Zealand Securities Commission (NZSC), New Zealand Institute of Directors (IOD)and the New Zealand Stock Exchange (NZX) in 2002 jointly promulgated therecommendations for the corporate governance practices in New Zealand. On 29 October2003, NZX adopted those recommendations for the listed companies and on March 2004,NZSC released those recommendations as a guideline for all New Zealand entities.
3. A non-executive director is classified independent only when he or she does not represent asubstantial shareholder and where the board is satisfied that he or she has no other direct orindirect interest or relationship that could reasonably influence their judgement and decisionmaking as a director.
4. Results for equation (1) can be obtained from the authors if required.
5. Can be obtained from the authors if required.
6. Results can be obtained from the authors if required.
7. Test iown_res ¼ 0, F(1,317) ¼ 0.09, Prob . F ¼ 0.7636.
References
Agrawal, A. and Knoeber, C.R. (1996), “Firm performance and mechanisms to control agencyproblems between managers and shareholders”, Journal of Financial and QuantitativeAnalysis, Vol. 31, pp. 377-97.
Agrawal, A. and Mandelker, G. (1990), “Large shareholders and the monitoring of managers: thecase of Antitakeover Charter Amendments”, Journal of Financial and QuantitativeAnalysis, Vol. 25 No. 2, pp. 143-61.
Barnhart, H.G. and Rosenstein, S. (1998), “Board composition, managerial ownership and firmperformance: an empirical analysis”, The Financial Review, Vol. 33, pp. 1-16.
Baxter, P. (2006), “The relationship between audit committees and financial reporting quality:a pilot study”, unpublished.
Begley, J. and Feltham, G.A. (1999), “An empirical examination of the relation between debtcontracts and management incentives”, Journal of Accounting and Economics, Vol. 27No. 2, pp. 335-44.
Principle-basedcorporate
governance
215
Beiner, S., Drobetz, W., Schmid, M.M. and Zimmermann, H. (2003), “Is board size an independentcorporate governance mechanism?”, working paper, University of Basel, Basel.
Beiner, S., Drobetz, W., Schmid, M.M. and Zimmermann, H. (2004), “An integrated framework ofcorporate governance and firm valuation – evidence from Switzerland”, Finance Workingpaper No. 34/2004, available at: www.ecgi.org/wp (accessed 25 February).
Berle, A.A. and Means, G.C. (1932), The Modern Corporation and Private Property, Macmillan,New York, NY.
Bhagat, S. and Black, B. (1998), “Board independence and long-term performance”, workingpaper No. 143, Centre for Law and Economics Studies, Columbia Law School, New York,NY.
Bhagat, S. and Black, B. (2002), “The non-correlation between board independence and long-termfirm performance”, Journal of Corporate Law, Vol. 27, pp. 231-73.
Chen, J., Blenman, L. and Chen, D.-H. (2008), “Does institutional ownership create values?The New Zealand case”, paper presented at the 12th New Zealand Finance Colloquium,Massey University, Palmerston North, 13 -15 February.
Chung, K.H. and Pruitt, S.W. (1994), “A simple approximation of Tobin’s Q”, FinancialManagement, Vol. 23, pp. 70-4.
Crutchley, C. and Hansen, R. (1989), “A test of the agency theory of managerial ownership,corporate leverage and corporate dividends”, Financial Management, Vol. 18, pp. 36-76.
Dalton, D.R., Daily, C.M., Ellstrand, A.E. and Johnson, J.L. (1998), “Meta-analytic reviews ofboard composition, leadership structure, and financial performance”, StrategicManagement Journal, Vol. 19, pp. 269-90.
Demsetz, H. (1979), “Accounting for advertising as a barrier to entry”, Journal of Business Ethics,Vol. 52, pp. 345-60.
Demsetz, H. (1983), “The structure of ownership and the theory of the firm”, Journal of Law andEconomics, Vol. 26, pp. 375-90.
Demsetz, H. and Lehn, K. (1985), “The structure of corporate ownership: causes andconsequences”, Journal of Political Economy, Vol. 93, pp. 1155-77.
Demsetz, H. and Villalonga, B. (2001), “Ownership structure and corporate performance”, Journalof Corporate Finance, Vol. 7, pp. 209-33.
Denis, D. (2001), “Twenty-five years of corporate governance research . . . and counting”, Reviewof Financial Economics, Vol. 10, pp. 191-212.
Denis, D. and McConnell, J. (2003), “International corporate governance”, International Journal ofFinancial and Quantitative Analysis, Vol. 38, pp. 1-36.
Denis, D. and Sarin, A. (1997), “Ownership and board structures in publicly traded corporations”,Working paper.
Easterbrook, F.H. (1984), “Two agency-cost explanations of dividends”, American EconomicReview, Vol. 74, pp. 650-9.
Elayan, F.A., Lau, J.S.C. and Meyer, T.O. (2003), “Executive incentive compensation schemes andtheir impact on corporate performance: evidence from new zealand since compensationdisclosure requirements became effective”, Studies in Economics and Finance, Vol. 21 No. 1,pp. 54-92.
Fama, E.F. (1980), “Agency problems and the theory of the firm”, Journal of Political Economy,Vol. 88, pp. 288-307.
Fama, E.F. and Jensen, M.C. (1983), “Separation of ownership and control”, Journal of Law andEconomics, Vol. 26 No. 2, pp. 301-25.
IJMF6,3
216

Farinha, J. (2003), “Dividend policy, corporate governance and the managerial entrenchmenthypothesis: an empirical analysis”, Journal of Business Finance & Accounting, Vol. 30No. 9, pp. 1173-209.
Finch, E.M. and Shivadasani, A. (2006), “Are busy boards effective monitors?”, The Journal ofFinance, Vol. 61 No. 2, pp. 689-724.
Firstenberg, P.B. and Malkiel, B.G. (1994), “The twenty-first century boardroom: who will be incharge”, Sloan Management Review, Vol. 36 No. 1, pp. 27-35.
Forbes, D.P. and Milliken, F.J. (1999), “Cognition and corporate governance: understandingboards of directors as strategic decision-making groups”, Academy of ManagementReview, Vol. 24, pp. 489-505.
Fox, M.A. (1996), “Corporate control and financial performance of New Zealand companies”,Department of Economics and Marketing Discussion Paper No. 14, Lincoln University,Canterbury.
Godfrey, A. and Horsely, J. (2003), “Steady shake-up in NZ’s corporate governance, boards,communication and shareholder value”, The Independent, pp. 27-8.
Goodstein, L., Gautam, K. and Boeker, W. (1994), “The effects of board size and diversity onstrategic change”, Strategic Management Journal, Vol. 15, pp. 241-50.
Hackman, J.R. (Ed.) (1990), Groups that Work, Jossey-Bass, San Francisco, CA.
Healy, J. (2003), Corporate Governance and Wealth Creation in New Zealand, Dunmore Press,Palmerston North.
Hembry, O. (2008), “Chiefs’ big rewards for poor results”, The New Zealand Herald, p. C3.
Hill, C.W.L. and Snell, S.A. (1988), “External control, corporate strategy, and firm performance inresearch-incentive industries”, Strategic Management Journal, Vol. 32 No. 1, pp. 577-90.
Hill, C.W.L. and Snell, S.A. (1989), “Effects of ownership and control on corporate productivity”,Academy of Management Journal, Vol. 32 No. 1, pp. 32-46.
Himmelberg, C.P., Hubbard, R.G. and Palia, D. (1999), “Understanding the determinants ofmanagerial ownership and the link between ownership and performance”, Journal ofFinancial Economics, Vol. 53, pp. 353-84.
Holderness, C.G., Kroszner, R.S. and Sheehan, D.P. (1999), “Were the good old days that good?Changes in managerial stock ownership since the Great Depression”, The Journal ofFinance, Vol. 54 No. 2, pp. 435-69.
Hossain, M., Prevost, A.K. and Rao, R.P. (2001), “Corporate governance in New Zealand: the effectof the 1993 Companies Act on the relation between board composition and firmperformance”, Pacific-Basin Finance Journal, Vol. 9, pp. 119-45.
Jensen, M.C. (1983), “Organization theory and methodology”, The Accounting Review, Vol. LVIIINo. 2, pp. 319-33.
Jensen, M.C. (1986), “Agency costs of free cash flow, corporate finance, and takeovers”, AmericanEconomic Review, Vol. 76, pp. 323-9.
Jensen, M.C. and Meckling, W. (1976), “Theory of the firm: managerial behavior, agency cost andownership structure”, Journal of Financial Economics, Vol. 3, pp. 305-60.
Kang, J.-K. and Stulz, R.M. (1996), “How different is Japanese corporate finance? An investigationof the information content of new security issues”, Review of Financial Studies, Vol. 9,pp. 109-39.
Kapopoulas, P. and Lazaretou, S. (2007), “Corporate ownership structure and firm performance:evidence from Greek firms”, Corporate Governance, Vol. 15 No. 2, pp. 144-58.
Principle-basedcorporate
governance
217
Klein, A. (1998), “Firm performance and board committee structure”, Journal of Law andEconomics, Vol. 41, pp. 275-303.
Klein, A. (2002), “Audit committee, board of director characteristics, and earnings management”,Journal of Accounting and Economics, Vol. 33, pp. 375-400.
La Porta, R., Lopez-de-Silanes, F., Shleifer, A. and Vishny, R.W. (2002), “Investor protection andcorporate valuation”, Journal of Finance, Vol. 57, pp. 1147-70.
Loderer, C. and Peyer, U. (2002), “Board overlap, seat accumulation and share prices”, EuropeanFinancial Management, Vol. 8, pp. 165-92.
MacAvoy, P.W. and Millstein, I.S. (2003), The Recurrent Crisis in Corporate Governance,Palgrave, New York, NY.
McConnell, J.J. and Servaes, H. (1990), “Additional evidence on equity ownership and corporatevalue”, Journal of Financial Economics, Vol. 27 No. 2, pp. 595-612.
McMullen, D.A. (1996), “Audit committee performance: an investigation of the consequencesassociated with audit committees”, Auditing: A Journal of Practice and Theory, Vol. 15,pp. 87-103.
Main, B.G.M. and Johnston, J. (1998), “Remuneration committee and corporate governance”,Accounting and Business Research, Vol. 23, pp. 351-62.
Mak, Y. and Kusnadi, Y. (2005), “Size really matters: further evidence on the negativerelationship between board size and firm value”, Pacific-Basin Finance Journal, Vol. 13No. 3, pp. 301-18.
Mehran, H. (1995), “Executive compensation, ownership, and firm performance”, Journal ofFinancial Economics, Vol. 38 No. 2, pp. 163-84.
Menard, S. (1995), Applied Logistic Regression Analysis, Sage University, Thousand Oaks. CA.
Mikkelson, W.H. and Ruback, R.S. (1985), “An empirical analysis of the interfirm equityinvestment process”, Journal of Financial Economics, Vol. 14, pp. 523-53.
Millstein, I.S. and MacAvoy, P.W. (1998), “The active board of directors and performance of thelarge publicly traded corporations”, Columbia Law Review, pp., p. 98.
Morck, R., Shleifer, A. and Vishny, R.W. (1988), “Management ownership and market valuation:an empirical analysis”, Journal of Financial Economics, Vol. 20 No. 1, pp. 293-315.
Morth, U. (Ed.) (2004), Soft Law in Governance and Regulation: An Interdisciplinary Analysis,Edward Elgar, Cheltenham.
New Zealand Securities Commission (NZSC) (2004), New Zealand Securities CommissionCorporate Governance in New Zealand Principles and Guidelines: A Handbook forDirectors, Executives, and Advisers, NZSC, Wellington.
New Zealand Securities Commission (NZSC) (2006), “Securities Commission review revealsshortcomings in 2005 financial reports”, NZSC, Wellington.
New Zealand Securities Commission (NZSC) (2008), Annual Report 2008, Vol. 2008, Wellington.
Palia, D. (2001), “The endogeneity of managerial compensation in firm valuation: a solution”,The Review of Financial Studies, Vol. 14 No. 3, pp. 735-64.
Perfect, S. and Wiles, K. (1994), “Alternative construction of Tobin’s Q – an empiricalcomparison”, Journal of Empirical Finance, Vol. 1, pp. 313-41.
Psaros, J. (2009), Australian Corporate Governance: A Review and Analysis of Key Issues, PearsonEducation Australia, Frenchs Forest.
Pye, A. (2000), “Changing scenes in, from and outside the boardroom: UK corporate governancepractice from 1989 to 1999”, Corporate Governance: An International Review, Vol. 8 No. 4,pp. 335-46.
IJMF6,3
218

Reddy, K., Locke, S.M., Scrimgeour, F.G. and Gunasekarage, A. (2008a), “Corporate governancepractices of small cap companies and their financial performance: an empirical study inNew Zealand”, International Journal of Business Governance and Ethics, Vol. 1 No. 4,pp. 51-78.
Sahlin-Andersson, K. (2004), “Emergent cross-sectional soft regulations: dynamics at play in theglobal compact initiative”, in Morth, U. (Ed.), Soft Law in Governance and Regulation:An Interdisciplinary Analysis, Edward Elgar, Cheltenham.
Seidl, D. (2006), Regulating Organizations through Codes of Corporate Governance, workingpaper No. 338, Centre for Business Research, University of Cambridge, Cambridge,pp. 1-32.
Shleifer, A. and Vishny, R. (1986), “Large shareholders and corporate control”, Journal of PoliticalEconomy, Vol. 94 No. 3, pp. 737-83.
Shleifer, A. and Vishny, R.W. (1997), “A Survey of corporate governance”, Journal of Finance,Vol. 52 No. 2, pp. 737-83.
Shleifer, A. and Wolfenzon, D. (2002), “Investor protection and equity markets”, Journal ofFinancial Economics, Vol. 66, pp. 3-27.
Smith, A. (1776), An Inquiry into the Nature and Causes of the Wealth of Nations, The ClarendonPress, Oxford.
Telser, L. (1969), “Comment”, American Economic Review, Vol. 59, pp. 121-3.
Thomsen, S., Pedersen, T. and Kvist, H. (2006), “Blockholder ownership: effects on firm value inmarket and control based governance systems”, Journal of Corporate Finance, Vol. 12,pp. 246-69.
Weil, Gotshal and Manges, LLP (2004), International Comparison of Selected CorporateGovernance Guidelines and Codes of Best Practice, Well, Gotshal and Manges LLP, NewYork, NY.
Weir, C.M. and Laing, D. (2000), “The performance-governance relationship: the effects ofCadbury compliance on UK quoted companies”, Journal of Management and Governance,Vol. 4 No. 4, pp. 265-81.
Weiss, L. (1969), “Advertising, profits, and corporate taxes”, Review of Economics and Statistics,Vol. 51, pp. 421-30.
Yawson, A. (2006), “Evaluating the characteristics of corporate boards associated with layoffdecisions”, Corporate Governance: An International Review, Vol. 14 No. 2, pp. 75-84.
Yermack, D. (1996), “Higher market valuation of companies with a small board of directors”,Journal of Financial Economics, Vol. 40, pp. 185-211.
Corresponding authorKrishna Reddy can be contacted at: [email protected]
Principle-basedcorporate
governance
219
To purchase reprints of this article please e-mail: [email protected] visit our web site for further details: www.emeraldinsight.com/reprints
Related Documents