WP/04/124 Corporate Financial Structure and Financial Stability E. Philip Davis and Mark R. Stone

Welcome message from author
This document is posted to help you gain knowledge. Please leave a comment to let me know what you think about it! Share it to your friends and learn new things together.
Transcript

WP/04/124
Corporate Financial Structure and Financial Stability
E. Philip Davis and Mark R. Stone
© 2004 International Monetary Fund WP/04/124
IMF Working Paper
Monetary and Financial Systems Department
Corporate Financial Structure and Financial Stability
Prepared by E. Philip Davis and Mark R. Stone1
Authorized for distribution by Arne B. Petersen
July 2004
Abstract
This Working Paper should not be reported as representing the views of the IMF. The views expressed in this Working Paper are those of the author(s) and do not necessarily represent those of the IMF or IMF policy. Working Papers describe research in progress by the author(s) and are published to elicit comments and to further debate.
This paper uses flow-of-funds and balance sheet data to analyze the impact of financial crises on corporate financing and GDP in a range of countries. Post-crisis GDP contractions are mainly accounted for by declines in investment and inventory and are more severe for emerging market countries. Post-crisis investment and inventory declines are correlated with the corporate debt-equity ratio. Although companies in emerging market countries hold more liquidity, this is not sufficient to prevent a greater response of expenditures to shocks. Industrial countries appear to benefit from an offsetting increase in bond issuance. JEL Classification Numbers: E22, E44, G31 Keywords: Corporate finance, financial instability Author’s E-Mail Address: [email protected]; [email protected]
1 E. Philip Davis’s address is: Brunel University, Uxbridge, Middlesex, UB8 3PH, United Kingdom; Mark R. Stone’s is: International Monetary Fund, Washington DC, 20431, USA. The authors thank Charles Goodhart, Chris Green, Andy Mullineux, and participants in seminars at Birmingham University and the IMF for helpful comments. Sandra Marcelino provided excellent research assistance.
- 2 -
Contents Page
I. Introduction ............................................................................................................................4
II. Literature Review..................................................................................................................4
III. Corporate Financial Structure for Industrial and Emerging Market Countries ...................7 A. Stock Data .................................................................................................................7 B. Flow Data ................................................................................................................10 C. Crises Data ..............................................................................................................11
IV. Corporate Financial Structure and Financial Stability: Descriptive Analysis ...................11 A. Impact of Crisis on the Level and Composition of GDP ........................................12 B. Corporate Financial Structure and Impact of Crisis on GDP..................................14
V. Corporate Financial Structure and Financial Stability: Econometric Analysis ..................15 A. Fixed Investment and Inventory Accumulation......................................................16 B. Corporate Sector Flow of Funds .............................................................................18
VI. Conclusion .........................................................................................................................21
References................................................................................................................................44 Tables 1. Key Aggregate Corporate Balance Sheet Indicators, 1999 or Latest Year......................23 2. Total Corporate Liabilities to GDP, Percent Changes, 1970–99 .....................................24 3. Loans/liabilities, Percent Change, 1970–99.....................................................................25 4. Debt-Equity Ratio, Percent Change, 1970–99.................................................................26 5. Loans plus Bonds to GDP, Percent Change, 1970–99.....................................................27 6. Liquidity Ratio, Percent Change, 1970–99......................................................................28 7. Aggregate Corporate Flow of Funds, 1995–99................................................................29 8. Gross Financing to GDP, 1970–99 ..................................................................................30 9. Loan Share of Total Financing, 1970-99 .........................................................................31 10. Bond Share of Total Financing, 1970-99.........................................................................32 11. Equity Share of Total Financing, 1970–99 ......................................................................33 12. Accumulation of Liquid Assets, 1970–99 .......................................................................34 13. Crisis Episodes.................................................................................................................35 14. Cumulative Change in Expenditure Components Relative to Trend in Banking and
Currency Crisis Years t and t +1......................................................................................36 15. Change in Flow of Funds/GDP in year of Crisis .............................................................36 16. Tobin’s Q Investment Function .......................................................................................37 17. Jorgensen Investment Function........................................................................................38 18. Inventory Adjustment Function .......................................................................................39 19. Bank Lending Function....................................................................................................39 20. Bond Issuance function ....................................................................................................40 21. Equity Issuance Function.................................................................................................40
- 3 -
22. External Financing Function............................................................................................41 23. Liquidity Accumulation Function....................................................................................41 24. Summary Table of Significant Dummy Variables ..........................................................42 25. Number of Crises for Each Equation...............................................................................42 Figures 1. Private Fixed Investment Deviation from Trend Growth ................................................43 2. Private Fixed Inventory Deviation from Trend Growth ..................................................43 Appendices I. Cumulative Change in Contribution of Expenditure Components to Change in GDP....47
- 4 -
I. INTRODUCTION
This paper examines how corporate financial structure shapes the impact of a financial crisis on the real sector by way of its effects on flows of funds and on corporate real expenditures. It is one of the first papers to utilize extensive cross-country flow and balance sheet data and also to examine subcomponents of GDP in the wake of banking and currency crises rather than focusing exclusively on aggregate GDP. The analysis in this paper compares and contrasts corporate financing and expenditure patterns during periods of financial crisis in member countries of the Organization for Economic Cooperation and Development (OECD) and emerging market economy countries (EMEs). The implications of corporate financial structure for financial fragility are measured here empirically by examining shifts in the size and composition of financial flows and expenditures by the corporate sector during a crisis, controlling for normal shifts in financing or expenditures that take place over the cycle. The analysis suggests that investment and inventory contractions are the main contributors to lower GDP growth after crises and the effect is much greater in emerging market countries. There is a marked correlation of the debt-equity ratio with investment and inventory declines following crises. Financial crises have a greater and more consistently negative impact on corporate sectors in emerging markets than in industrial countries, although even in the latter the impact is not negligible. Industrial countries benefit from the existence of multiple channels of intermediation in that bond issuance is shown to increase in the wake of banking crises. The paper is structured as follows: section II comprises a review of the relevant theoretical and empirical literature and suggests some testable hypotheses drawn from that literature. Section III outlines the data and illustrates broad corporate financing patterns, sections IV and V provide empirical analyses of corporate financial flows during financial turbulence, and section VI concludes.
II. LITERATURE REVIEW This paper draws from several disparate financial and economic literatures, beginning with the general determinants of corporate financial structure. The first modern theory of the general determinants of corporate financial structure was the proof by Modigliani and Miller (1958) that under simplifying assumptions the balance sheet structure of a firm is irrelevant to the cost of capital. However, introducing differential microeconomic costs of bankruptcy between equity holders and debt holders stimulates firms to issue only equity. Conversely, the tax deductibility of interest payments encourages debt finance, with firms consequently absorbing “unnecessary” levels of business cycle risk and raising the risk of default (Gertler and Hubbard, 1989).
- 5 -
The understanding of corporate balance sheet structure was further refined by the introduction of asymmetric information and consequent adverse selection and moral hazard in the context of incomplete contracts. The availability of internal financing may thus impact on real decisions (Fazzari, Hubbard, and Petersen, 1988) as firms prefer to—or are constrained to—finance themselves by internal rather than external funds. Internal funds are more plentiful for large and established firms than in small and new firms, where the latter may be more typical of emerging market countries. A corollary is that financial systems that cope better with agency costs will supply more external financing, all things being equal. The literature on economic and financial development provided insights into the different corporate financial structures of industrial and emerging market countries. King and Levine (1993) found that financial variables have a strong relation to capital accumulation, economic growth and productivity growth. Levine and Zervos (1998) concluded that stock market liquidity (but not size, international integration or volatility), as well as banking development, was related to growth. An implication of this and related papers is that the overall development of financial services is important to growth and not just its bias to bank or market financing. Financial systems seem to go through stages of development in which corporate sources of financing are mainly: (i) internal, (ii) banks due to information collection efficiencies, (iii) equity issuance for more diversity, and (iv) bonds when information collection costs become sufficiently low. Demirgüç-Kunt and Levine (2000) showed that banks, nonbanks and stock markets are larger, more active and more efficient in richer countries; although Rajan and Zingales (2000) show financial development has not been monotonic over a long-time horizon. Furthermore, in OECD countries, stock markets become more active and efficient relative to banks, and there is some tendency for financial systems to become more market oriented as they become richer. The legal system also helps shape the weight of bank versus nonbank financing. Rajan and Zingales (1998) found a link from financial development to growth via dependence of industries most dependent in external finance. Levine (2000) found little evidence that a bank-based system is “better” for overall economic performance. The “financial accelerator” and “credit channel” approaches to business cycles help set the stage for recent theories for the role of the corporate sector in financial crises. The financial accelerator is the procyclicality of borrower net worth due to adverse selection and information asymmetries which amplifies the impact on the economy of changes in the stance of monetary policy by increasing risk premia (Bernanke and Gertler 1995). An indicator of this “financial accelerator” which applies to debt in general is the debt-equity ratio. Other work on the related “credit channel” has focused on bank credit as such, implying a relevance for the bank loan/debt ratio (Gertler and Gilchrist, 1994, 1992). This paper also draws from the theories of financial crisis and their application to corporate financial structure. Corporate financial structure had little or no role in the early theoretical crisis literature which began with “first generation” currency crisis models stressing government debt (Krugman, 1979), and “second generation” models (Obstfeld,1994), which
- 6 -
took into account a broader government’s objective function. The introduction of banks into more recent models allowed them to cover patterns of liquidity and foreign currency denominated debt (Velasco, 1987; Mishkin, 1997; and Goldfajn and Valdes, 1995). The relatively recent foreign exchange liquidity approach explicitly addresses joint currency and bank crisis dynamics arising from a shortfall of foreign exchange liquidity, including to the corporate sector (Chang and Velasco, 1999). Many of the more recent theoretical models of crises are rooted in problems associated with the collateral that backs up corporate borrowing. Gertler, Gilchrist, and Natalucci (2000) show that microeconomic rigidities can amplify corporate balance sheet channels in an open economy framework. The collateral approach has been extended based on more recent theoretical models that stress macroeconomic rigidities in the form of underdeveloped domestic financial sectors and fragile corporate and financial sector balance sheets (Kiyotaki and Moore, 1997). The dynamic interaction between credit limits and asset prices is a powerful transmission mechanism by which the effects of shocks persist, amplify, and spill over to other sectors. Caballero and Krishnamurthy (1999) extend the Kiyotaki/Moore model to use shortfalls of the collateral that is necessary to get domestic and international financing to explain crisis vulnerability. These shortfalls are rooted in weak governance and legal systems. Kim and Stone (1999) model a similar emphasis on wasteful capital sales owing to a drop in collateral value. The role of financial breadth, or the availability of a broad range of financing alternatives to the corporate sector, is generally recognized as helping limit the impact of a crisis on the real sector, but is only beginning to attract theoretical and empirical analysis. The large output contraction caused by the recent Asian crisis has been attributed in part to the lack of nonbank financing alternatives (Chatu Mongol, 2000), whereas nonbank financing helped limit the impact of the slowdown of American bank lending in 1990 that resulted from a collapse in the value of real estate collateral (Greenspan, 1999). Using data from the United States, the United Kingdom, Japan and Canada, Davis (2001) concluded that the existence of active securities markets alongside banks (“multiple avenues of intermediation”) is beneficial to the stability of corporate financing, both during cyclical downturns and during banking and securities market crises. These benefits increase in the similarity of the size of securities market and intermediated financing, and in the proportion of companies with access to both loan and securities markets. This paper is an extension of the small literature on corporate financial structure and post-crisis output contractions which we extend to cover disaggregated output and financial flow and balance sheet variables. Bordo and others (2000) examined output contractions over the past 120 years and concluded that the probability of crisis has increased but intensity has not. They attribute the increased probability to capital mobility and financial safety nets. Hoggarth, Reis, and Sapporta (2001) explore a variety of measures of output losses, including measures based on benchmarks of pre-crisis trend growth, a forecast based on the absence of a crisis, and comparison with similar countries that did not experience a crisis. Stone (2000) looked at the impact of financial crises on output via the corporate sector and concluded that crisis-induced output contractions are associated with high levels of corporate
- 7 -
debt, openness, and exchange rate over-appreciation. Stone and Weeks (2001) found that output contractions are driven by the degree of cut-off of private capital inflows, corporate balance sheet indicators, and to a lesser extent imports to GDP and financial breadth. Reflecting such conclusions, the role of private sector balance sheet indicators has been stressed more recently in analysis of crisis prevention. In their estimate of a monthly “early warning system” Mulder, Perrelli, and Rocha (2001) found that the corporate indicators of leveraged financing, short-term debt to working capital and shareholders rights help predict crises. Davis (1995) used flow-of-funds data to look at pre- and post-crisis changes in corporate balance sheets for industrial countries.
III. CORPORATE FINANCIAL STRUCTURE FOR INDUSTRIAL AND EMERGING MARKET COUNTRIES
This paper analyzes a new cross-country data set of aggregate corporate sector financial data. Flow-of-funds, corporate asset and liability stock data are reported for all the Group of Seven (G-7) countries and 10 small industrial countries. Flow-of-funds data are available for five emerging market countries (the Czech Republic, India, the Republic of Korea, South Africa, and Thailand) and balance sheets for four (Croatia, the Czech Republic, Israel, and Korea). The time intervals for the data vary considerably, with data available for most G-7 and emerging market countries since the 1970s, but only in the 1990s for most of the smaller industrial economies. Total corporate liabilities for both stocks and flows were organized into the following categories: (i) loans, (ii) bonds, (iii) equities, (iv) trade credit, and (v) a residual “other” group for some countries. In addition, liquid assets are reported. The flow data are likely to be more directly comparable than stock data, where there remains a risk that valuation conventions may differ. The literature suggests a few prior considerations for cross-country patterns in corporate financial structure data. The size of corporate sector balance sheets can be expected to be greater for industrial countries owing to their larger and more developed financial sectors. The corporate sectors of emerging market countries are expected to borrow more, especially from banks, since firms are on average at an earlier stage of development with less internal cash generation relative to investment needs, while securities markets are less developed. In addition, emerging market corporate sectors are expected to maintain higher levels of liquidity to offset their greater vulnerability to shocks.
A. Stock Data
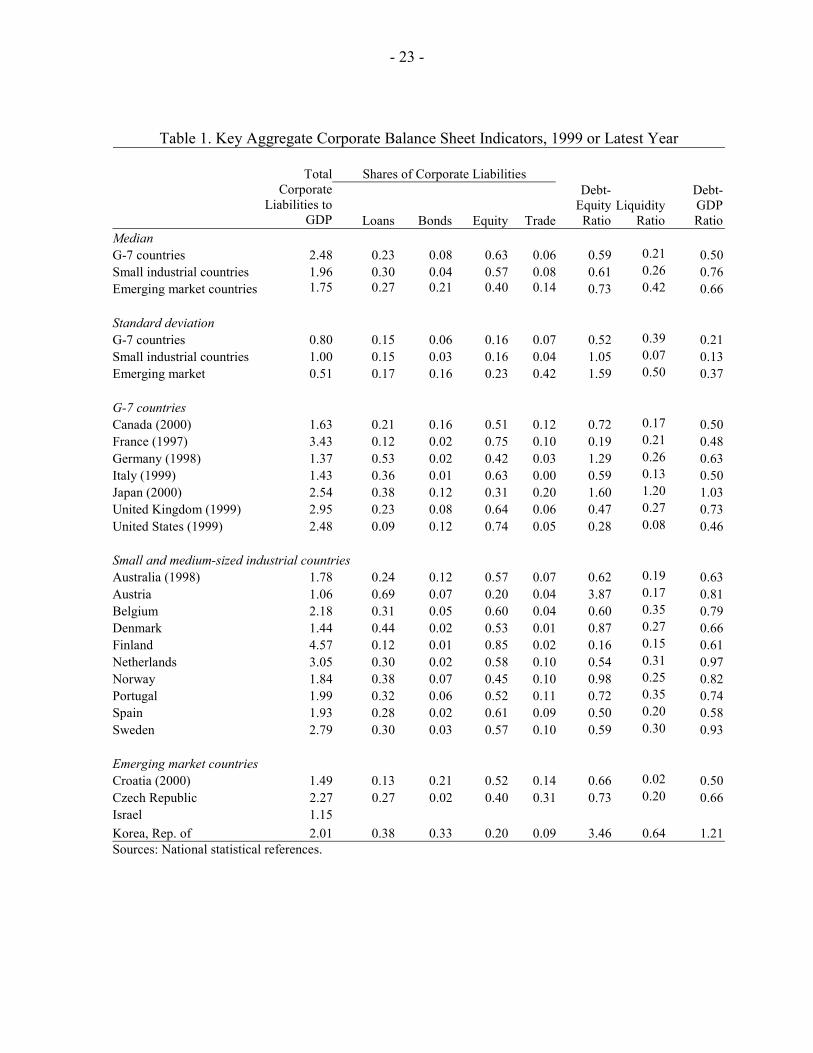
Cross-country comparisons The size of corporate balance sheets tends to be highest for G-7 countries and lowest for emerging market countries, although there is a fairly wide range across countries (Table 1). The country groups that are larger and more developed have larger financial sectors and thus larger corporate sector balance sheets. This pattern holds notwithstanding the combination of bank and market related financial systems included in each subgroup. In other words, the size
- 8 -
of corporate balance sheets is determined more by level of development than by whether a country has a bank-based or market-based financial system. The share of corporate liabilities accounted for by loans is decreasing in the level of economic development, also as expected. G-7 countries have about 20 percent of liabilities as bank loans, versus around 30 percent for the small industrial and emerging market countries. As countries develop, they move away from bank financing and toward securities (and internal financing which boosts equity values), again despite the mix of bank and market-based financial systems. The share of trade credit is also decreasing in the level of economic development. Trade credit accounts for 6 and 8 percent of G-7 and small and medium-sized industrial country corporate liabilities and about 20 percent of liabilities for the three emerging market countries with available data. This pattern may reflect the importance of supplier credits for countries with less-sophisticated financial markets. Suppliers may have more scope to reduce asymmetric information and exert corporate control more readily than banks in many emerging market countries. As a corollary, G-7 country balance sheets are dominated by securities (bonds and equities) relative to small industrial countries and emerging market countries. Besides financial development per se, this seems to reflect the development of nonbank financial markets in larger countries which enjoy economies of scale. The surprisingly high share of bond financing for emerging market countries is due to the large share of financing in Korea, which dominates the small sample. Perhaps surprisingly, emerging market countries are not markedly more highly leveraged than other countries. The debt-equity ratio (at market value) is the most common indicator of corporate leverage. The debt-equity is marginally higher for the smaller industrial countries vis-à-vis the G-7, and somewhat higher for the emerging market countries, although this is largely due to Korea. Total corporate debt to GDP is highest for small industrial countries. The relatively high level of loans borrowed by small industrial country corporate sectors outweighs their relatively low level of outstanding bonds. The debt to GDP of the three emerging market countries covers a wide range. Emerging market corporate sectors are the most liquid while G-7 country corporate sectors are the least liquid. The lower level of liquidity for the G-7 would appear to reflect their access to external financing in the event of a shock, which allows them to maintain lower levels of precautionary liquidity. Trends The data demonstrate the rapid expansion in the potential impact of corporate finances on the real sector. Owing to data availability, the analysis of trends focuses on the G-7 countries
- 9 -
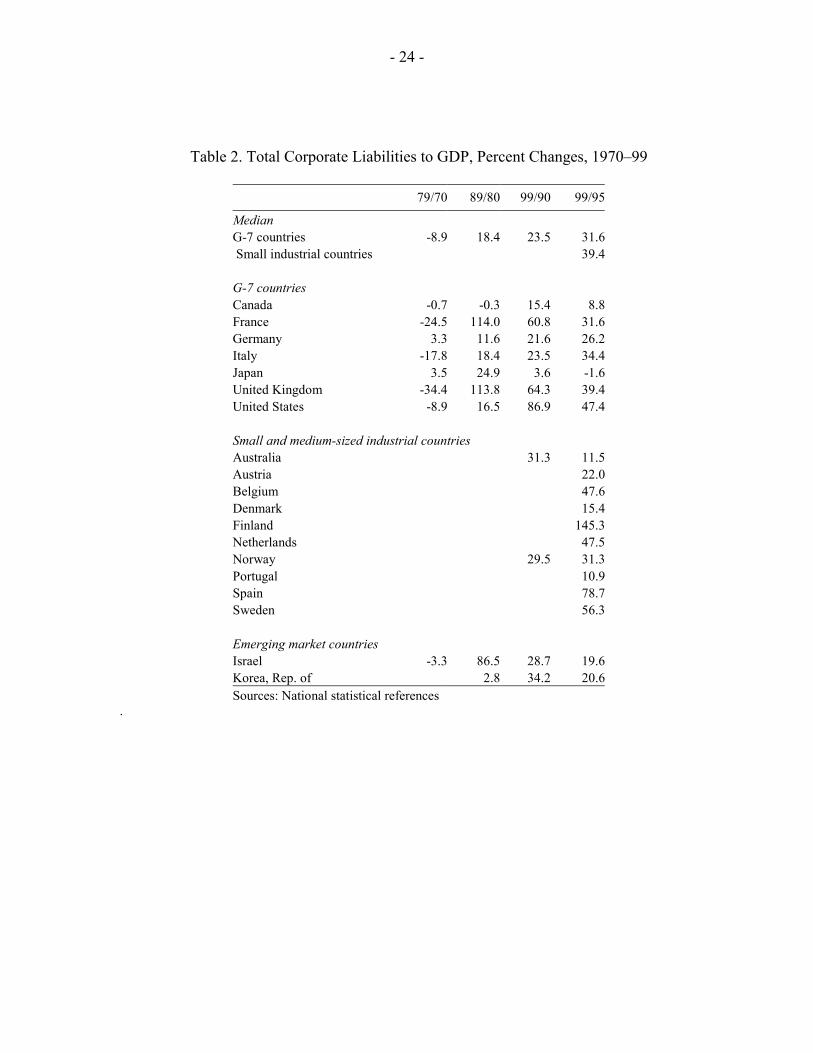
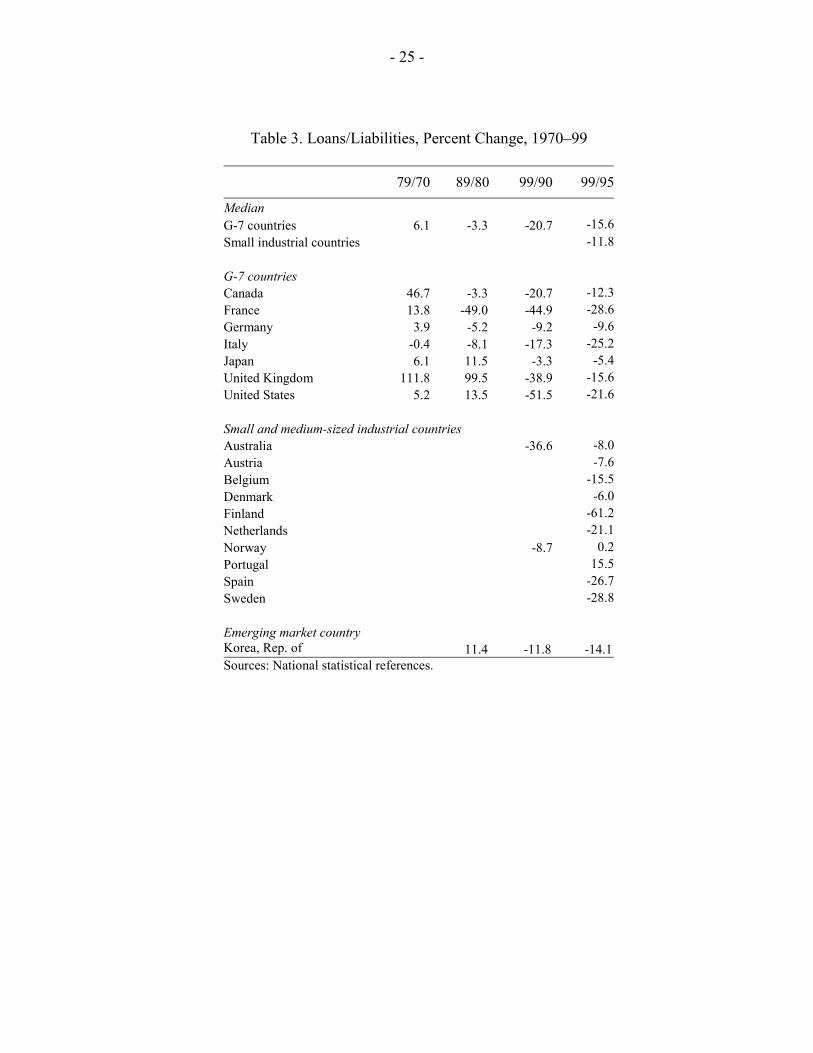
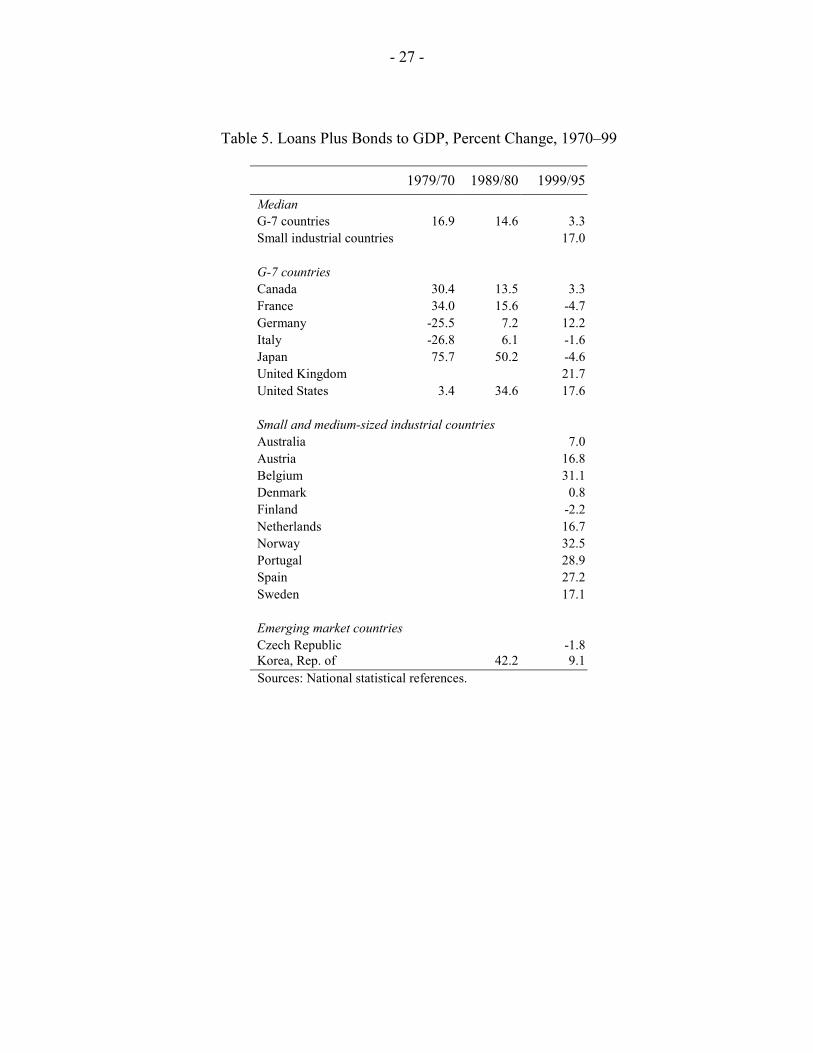
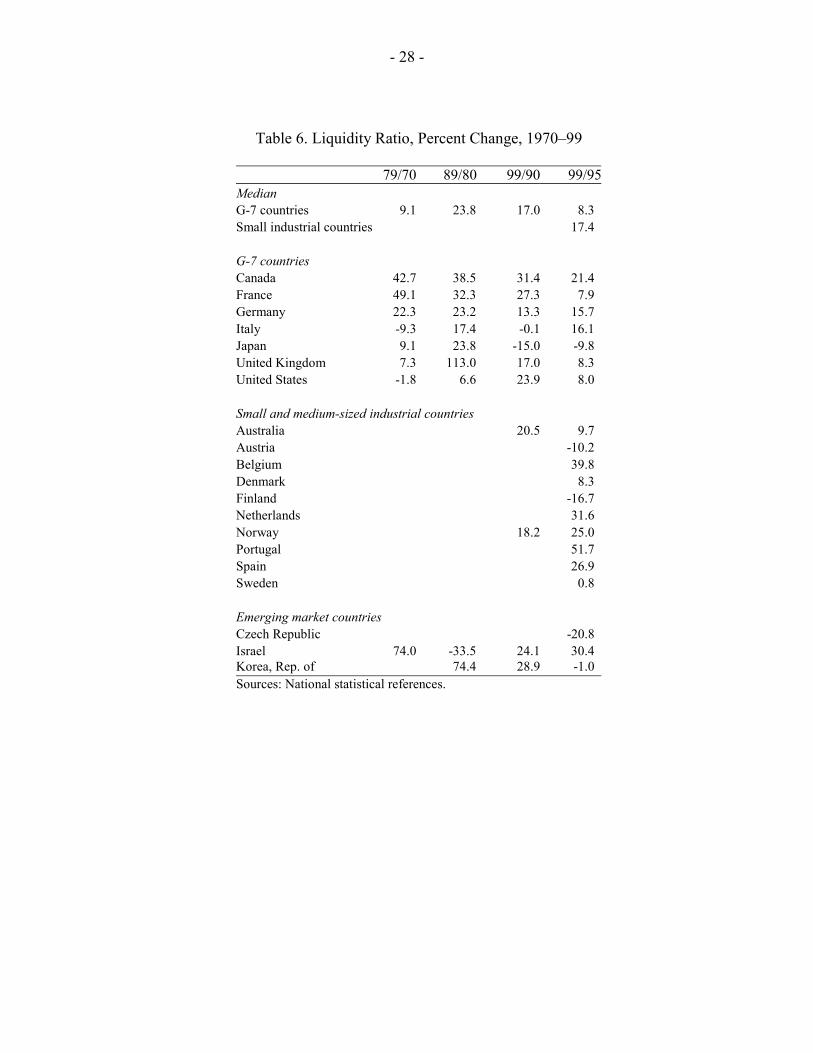
since 1970 and on the small industrial countries mainly during the last half of the 1990s. The total size of corporate balance sheets scaled by GDP has been expanding sharply in recent years (Table 2). G-7 corporate balance sheets contracted in relation to GDP during the 1970s, but have increased sharply since then, and at an accelerating pace. The corporate balance sheets of small industrial countries during the last half of the 1990s expanded even faster than the G-7 countries.2 As the small industrial countries are in Europe—except for Australia—this expansion may reflect the development of EMU as well as differential patterns of equity prices. Finally, the size of the corporate balance sheets for Israel and Korea also increased sharply since 1980. Equity financing expanded during the 1990s at the expense of bank financing, reflecting to some extent the pattern of equity prices (Table 3). Banks’ share of total liabilities expanded during the 1970s for all but one of the G-7 countries. The equity share of financing rose for all of the G-7 countries during the 1990s. In a similar vein, all but two of the small industrial countries experienced reductions in bank debt as a share of total corporate liabilities during the 1990s and increases in equity. Bank debt also fell in Korea, the only emerging market country with complete data. Corporate leverage has diminished in the past twenty years (Table 4). During the 1970s, the debt-equity ratio rose sharply in most of the G-7 countries. However, the debt-equity ratio fell for several of the G-7 countries during the 1980s and declined across all seven countries in the 1990s. Similarly, the debt-equity ratio fell for all the small industrial countries in the late 1990s. For Korea, corporate leverage rose overall during the 1990s, but fell after the crisis of 1997–98. A comparison of changes on equity and debt show that the decline in corporate leverage reflects strong growth in equity outstripping increases in debt. The growth of corporate debt has leveled off in G-7 countries, but continues to rise in small industrial countries (Table 5). Indeed, corporate debt to GDP fell in four G-7 countries during the last half of the 1990s. In contrast, corporate debt rose sharply in the small industrial countries, with most recording increases in excess of 15 percent. The accumulation of corporate debt was less pronounced in the emerging market countries. Interestingly, liquidity increased steadily during the past 30 years (Table 6). Corporations generally hold cash to offset potential distress arising from adverse shocks that cannot be offset by borrowing from capital markets. The swelling of corporate balance sheets indicates that corporate access to financing increased in recent years. However, with only a few exceptions, the ratio of liquid assets to total assets rose for every country over every decade. One explanation of the increased preference for cash is that the potential risks arising from larger financial positions outweighed the increased access to finance, thereby motivating corporations to hold more rather than less cash. Another possibility is that financial 2 Developments in Finland reflect the very strong expansion in the Finnish stock market (in particular Nokia) since the early 1990s.
- 10 -
liberalization and money market development is allowing corporations to earn interest on their liquidity, thereby reducing the opportunity cost (Teplin, 2001).
B. Flow Data
The flow data capture the sources of financing for corporate sectors across the country groups and in many cases over an extended time period. The net financing/GDP flows data gauge the change in the net financial position of the aggregate corporate sector, which is equivalent to its net cash flow. Typically, corporations are net borrowers because of large investment needs relative to revenue, so that they operate with negative net financing. Gross financing/GDP measures the overall level of funding to the corporate sector on a gross basis. The level of gross financing indicates the overall access of the corporate sector to outside financing, which may be broken down into components of bank lending, equity financing, bond financing and trade credit. Liquidity accumulation is simply the change in the liquid asset position of the corporate sector. Cross-country comparisons
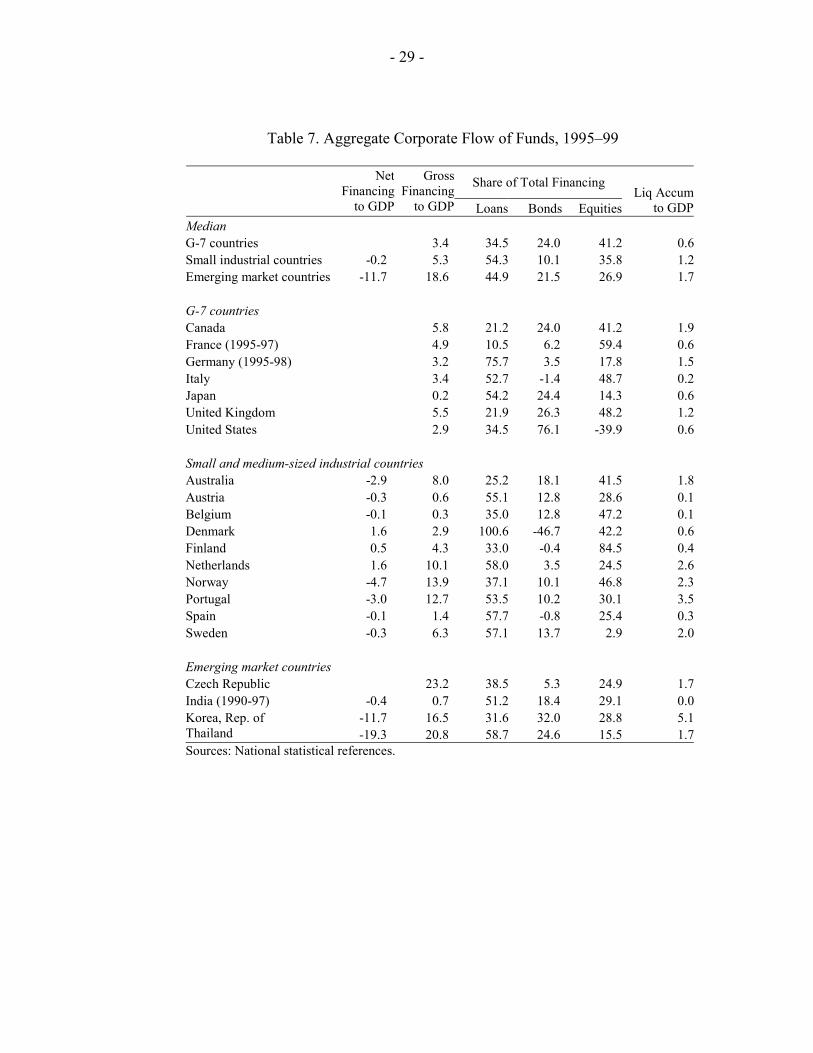
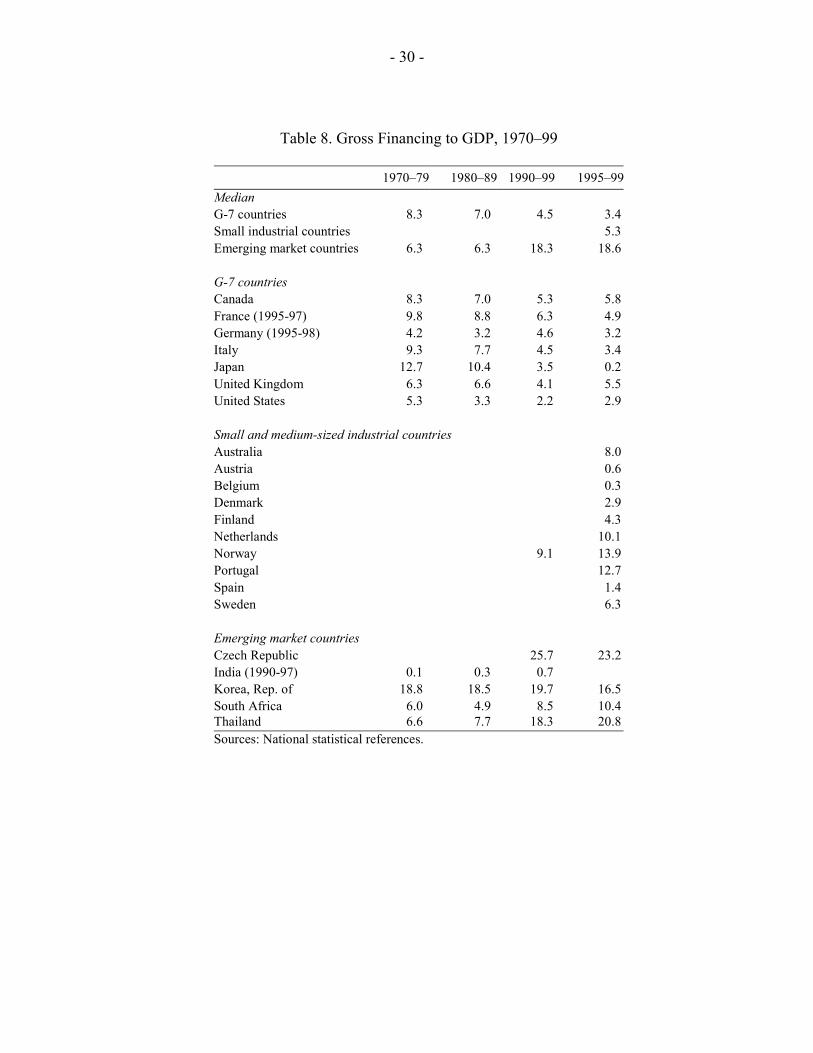
Period averages are used owing to the volatility of flows for individual years. Cross-section data for 1995–99 show how corporate financing patterns differ across countries (Table 7). Of course, the data will also reflect to some degree country specific shocks. As expected, almost all countries operate with a negative net financing/GDP flow, especially the emerging market countries. Gross financing flows vary considerably; again, the emerging market countries seem to have the highest levels of gross financing, as expected. Bonds and equities account for most G-7 corporate financing, reflecting their more sophisticated financial systems. The surprisingly large share of bond financing for the emerging market countries can be attributed to the sharp growth in the bond markets of Korea and Thailand after the 1997–98 crisis. Finally, liquidity accumulation is lowest for the G-7 countries and highest for the emerging market countries, presumably owing to the relatively higher vulnerability of the latter to financial shocks, especially during the late 1990s. Trends Gross financing could be expected to increase over time as markets become more developed, particularly for emerging market countries (Table 8). However, for G-7 countries gross financing seems to be on a trend decline, even after taking out Japan, which is a special case. In contrast, gross financing for the emerging market countries is generally on an upward trend, as expected. These patterns suggest that gross corporate financing could be relatively low at early stages of development, high for middle-income countries, before declining again for the most developed countries, as with monetization (Bordo and Jonung, 1987). Equity is partly replacing loans as a source of corporate financing around the world. The flow of loans relative to GDP declined sharply from the 1980s to the 1990s for all the G-7
- 11 -
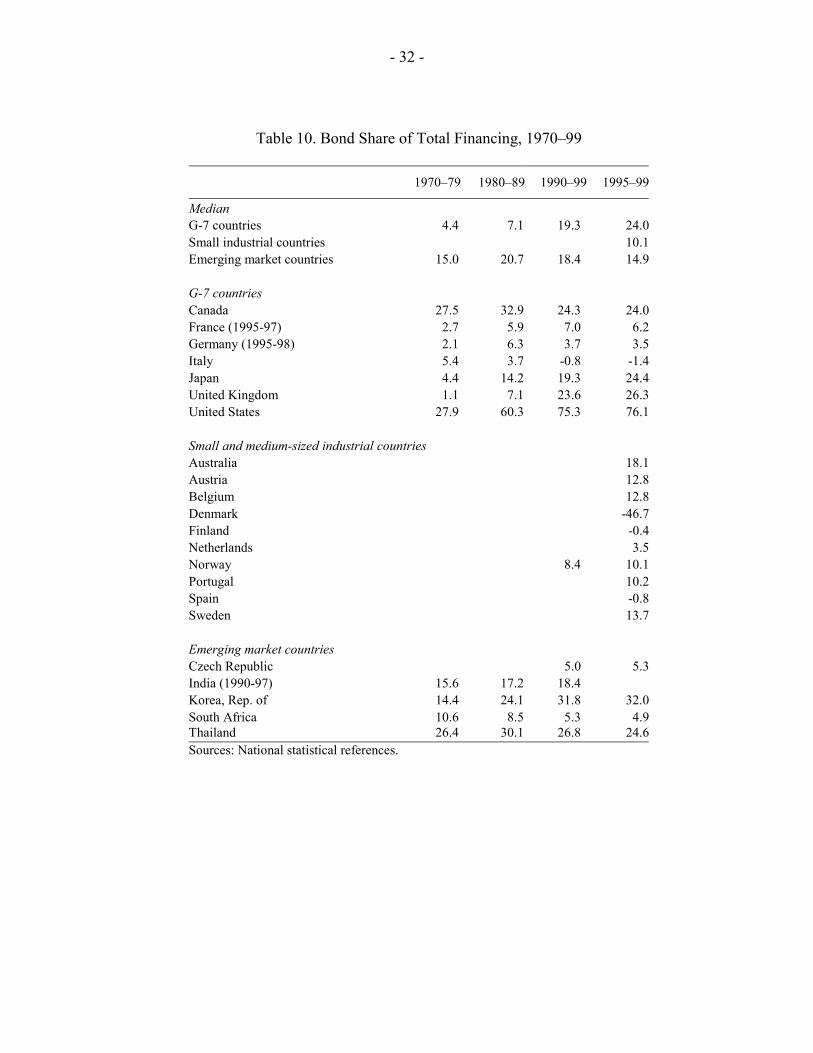
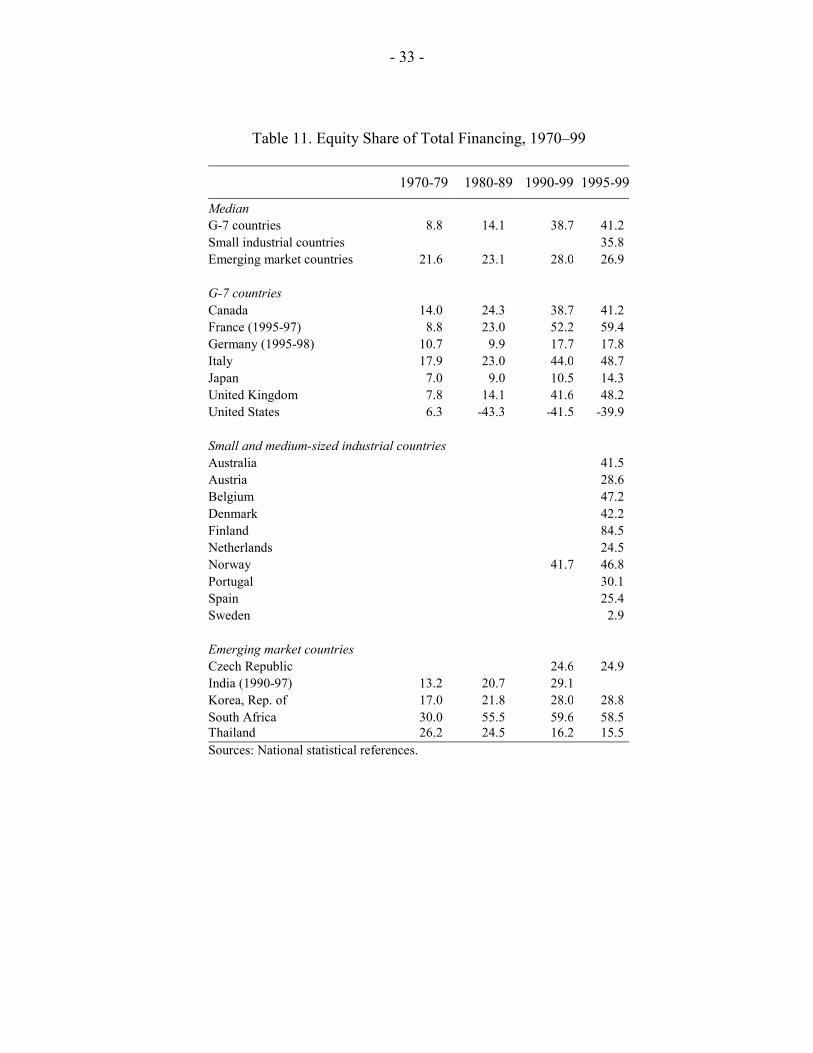
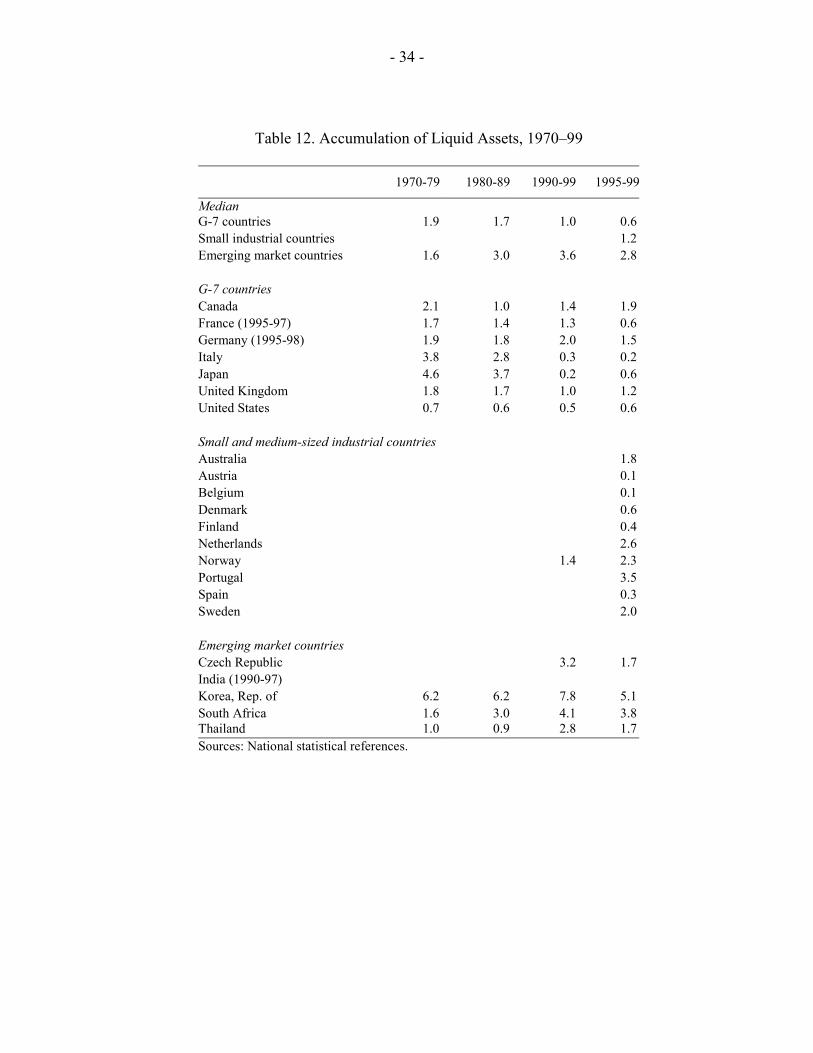
countries and for Norway (Table 9). Loans also declined as a source of financing for three of the four emerging market countries with data for the 1980s. Bond financing rose for the U.S., the U.K., and Japan, and was broadly unchanged for the other countries during the 1980s and 1990s (Table 10). Note that there are differences in the overall level of bond financing between countries reflecting bank- and market-related financial systems. At the same time, the share of equity financing rose from the 1980s to the 1990s for 11 of the 12 countries with available data (Table 11). Finally, the accumulation of liquid assets was on a downward trend for industrial countries and an upward trend for emerging market countries (Table 12). This divergence suggests that these emerging market countries became more vulnerable to shocks, and that they were compelled to hold more cash owing to less insurance provided by their financial sectors.
C. Crises Data
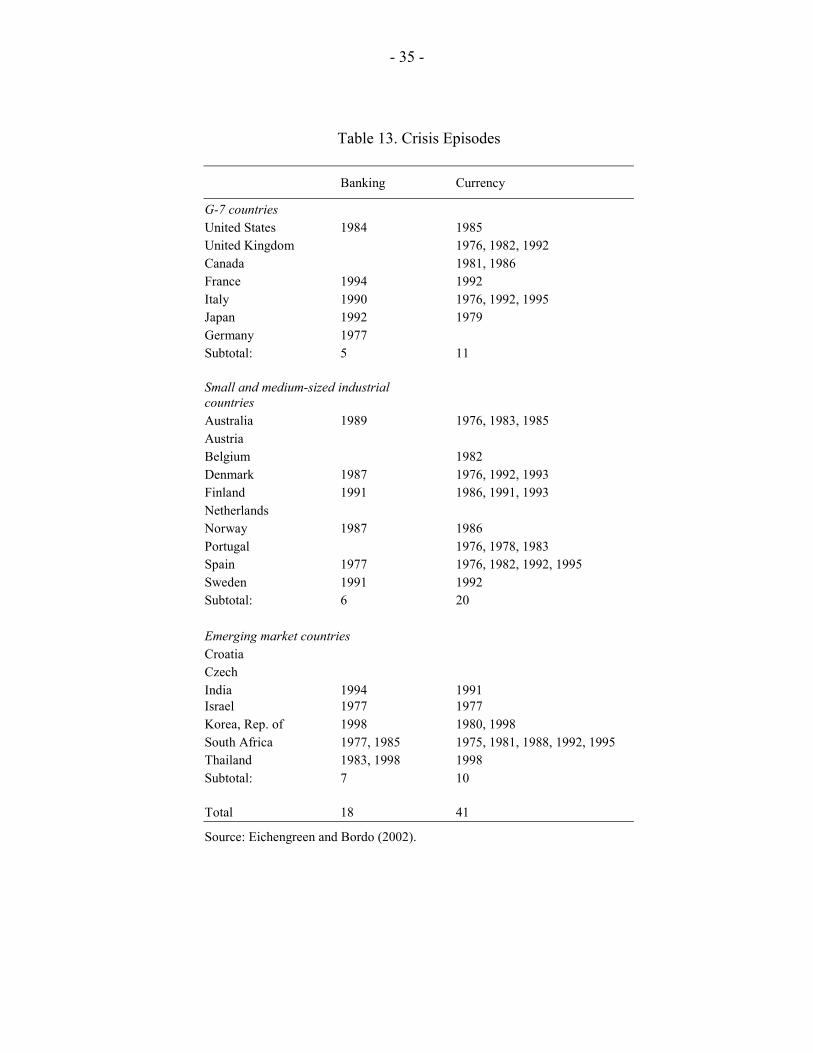
The financial crises in this paper encompass bank and currency crises. The source is Eichengreen and Bordo (2002), who define financial crises for a large group of industrial and emerging market countries. In their work, currency crises are defined by an index of exchange market pressure, or a forced change in parity, abandonment of a pegged exchange rate, or an international rescue.3 Banking crisis involve bank runs, widespread bank failures and the suspension of convertibility of deposits into currency, or significant banking sector problems that result in the erosion of most or all of banking system collateral. For the 29 countries in this study, 59 crisis episodes occurred during 1977–99 (Table 13), including 18 banking crises and four twin bank-currency crises. Emerging market countries accounted for 17 of the crises, and 23 of the crises occurred during the 1990s. Corporate balance sheet data are available for 41 of the 59 episodes. For currency crises, cross-checks on the Bordo/Eichengreen list were made with Aziz, Caramazza, and Salgado (2000), and for banking crises with Caprio and Klingebiel (1996), extended in each case by Stone and Weeks (2001). The resulting lists of crises were virtually identical.4
IV. CORPORATE FINANCIAL STRUCTURE AND FINANCIAL STABILITY: DESCRIPTIVE ANALYSIS
This section describes the impact of a crisis on the level and composition of GDP and the relationship between this impact and corporate financial structure. The analysis is based on 59 crisis bank and currency crisis episodes chosen using standard methodologies as described above. The number of crises used in the analysis is often smaller due to data availability. 3 The index is calculated as a weighted average of the percentage change in the exchange rate, the change in the short-term interest rate, and the percentage change in reserves, all relative to the same variables in the center country. A crisis occurs when this index exceeds one and a half standard deviations above its mean. 4 Of course it must be kept in mind that the timing and even incidence of crises does vary with the methodology chosen (e.g., Kaminsky and Reinhart, 1999; Honkapohja and Koskela, 1999).
- 12 -
A. Impact of Crisis on the Level and Composition of GDP
The aim of this subsection is to shed light on how corporate financial structure shapes the level and composition of changes in GDP triggered by a systemic financial crisis. As noted in Section II above, most of the post-crisis output contraction literature extensive work focuses on the response of the aggregate level of GDP. The data for real GDP and its components are expressed in terms of contributions to deviations of growth from trend, rather than as growth per se. The use of growth for cross-country comparisons of crisis severity would be distorted by different levels of country trend growth. (Hoggarth, Reis, and Sapporta, 2001). Deviation of growth from the trend was calculated as follows:
(i) Data for real GDP and its components were retrieved from the IMF’s World Economic Outlook database and in some cases adjusted to ensure that the components added up to the total;
(ii) the data were transformed into the contribution of growth of each component;
(iii) the deviation of the contribution to growth of each component was calculated as the difference between the contribution to growth of each component for each year less the average contribution of the previous eleven years; and
(iv) the effect of the crisis on GDP was calculated as the product of the deviation of the contribution to growth for crisis year t and year t+1.
Data for real GDP and its components are available for 14 emerging market countries and 24 industrial countries, with 37 currency crises and 18 banking crises, with 3 of these being twin crises.
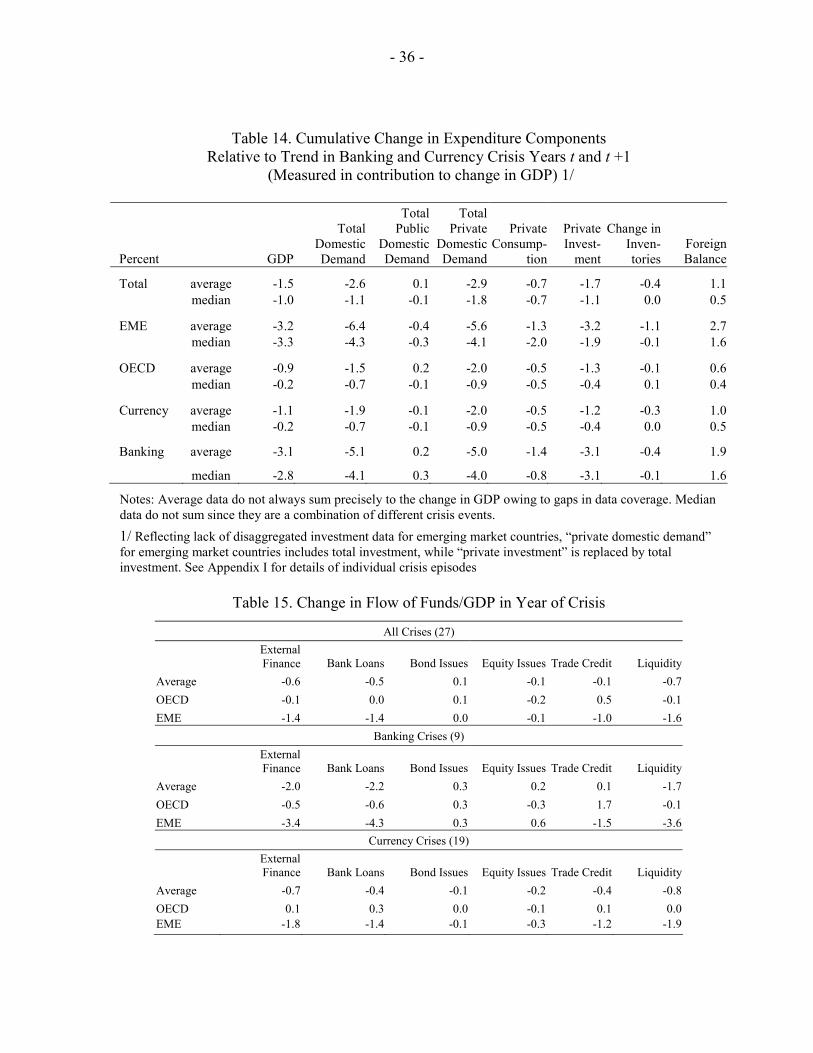
The response to crises of both kinds is a decline in GDP. The average is a 1.5 percent fall in GDP, and the median is one percent, suggesting a degree of skewness with a few very serious crises and a number of mild ones. The data show that financial crises have a bigger impact on the real sector of emerging market countries compared to industrial countries (Table 14). The average (median) negative deviation of real GDP growth from trend is 3.2 (3.3) percent for emerging market compared to just 0.9 (0.2) percent for industrial countries. The greater real impact of financial crises for emerging market countries shows their greater vulnerability to shocks.
The range of post-crisis output responses is quite wide (see the country-by-country data in Appendix I). Emerging market country crisis GDP output changes range from −13 percent (Korea and Thailand in the late 1990s) to 4 percent (South Africa in 1995). Interestingly, the range for industrial countries is even wider, largely due to an outlier for Japan in 1979. Domestic demand bears the brunt in these crisis-induced recessions for both groups of countries. Indeed, on average foreign demand (exports less imports) positively contributes to
- 13 -
growth, probably because the trade balance must shift in a positive direction to offset the sudden cessation of capital inflows that often triggers the crisis. The change in public sector demand following the crises (the sum of public sector consumption and investment) is broadly neutral for both groups of countries. The signs of the average and median contribution to growth of the public sector are negative for the emerging market countries—perhaps owing to a larger decline in revenues from the impact on growth and lesser ability to expand borrowing given lower creditworthiness of the government. The post-crisis change in real GDP is dominated by private domestic demand. The contraction in private demand for the emerging market countries is of a large order of magnitude (an average of 5.6 percent compared with 2 percent). Private investment explains the bulk of the contraction for the limited number of observations available for the emerging market countries (average 3.2 percent).5 For the industrial country episodes, private investment is again a key contributor to the crisis-induced contraction (average of 1.3 percent). The range of investment growth after a crisis is some 10 percent for both groups of countries. The selling off of inventories is also an important drag on economic activity in the wake of a financial crisis for the emerging market countries. The contraction of inventories contributes negatively to growth for 11 of the 14 emerging country crisis episodes for an average (median) of −1.1 percent (−0.1 percent) of GDP. Inventory changes are on average negative for the industrial countries, but the average is rather small and the median is zero. Consumption is surprisingly robust in the wake of the crises. For emerging market countries the decline is equivalent to 1.3 percent of GDP on average, while in OECD countries it is 0.5 percent. Consumers seek to draw on saving to sustain consumption, while labor income is typically more stable than profits. Banking crises have a more severe impact on GDP than currency crises. The average fall in GDP for both OECD and EME countries is 3.1 percent for banking crises compared with 1.1 percent for currency crises. The relative magnitude of the contributions is similar to those discussed above, with a particularly negative effect from domestic demand, and therein private investment and inventories. Public demand rises in the wake of banking crises while it contracts slightly after currency crises. The net foreign balances rise much more strongly after banking crises, giving a partial offset to the contraction generated by private domestic demand. For most of the data, the average and median are close for banking crises but the median falls far short of the average for currency crises. The data for banking crises seem thus to be more homogenous and normally distributed than the data for currency crises. 5 Private investment data that is comparable across countries are not available for several of the emerging market countries prior to the 1990s.
- 14 -
The change in the composition of GDP growth induced by a financial crisis raises several important questions regarding corporate financial structural. Post-crisis contractions in GDP are dominated by a downward shift in private domestic demand, which in turn is explained mostly by investment drops and depletion of inventories. Given that most private investment is financed by corporate liabilities, an important question is whether there are cross-country differences in corporate financial structure shown in section III that could help explain the wide range in the severity of crisis-induced recessions.
B. Corporate Financial Structure and Impact of Crisis on GDP
This section discusses the correspondence between key balance sheet measures of the corporate financial structure and GDP contractions and its key components. Large corporate liabilities do not in and of themselves induce large crisis-induced declines in output. Regressions of the corporate liabilities to GDP ratio on overall contraction in GDP growth, contributions of private fixed investment, or of inventory investment do not suggest a strong negative relationship. This result may not be surprising since the size of balance sheets is largest in the most stable economies of the G-7. In contrast, corporate leverage does correspond to larger GDP declines. The simple correlation coefficient between the GDP contraction itself and the debt-equity ratio is a weak -0.22. However, the correlation between debt-equity ratio and the deviation from the trend contribution to GDP of private fixed investment across the crises is −0.47 (Figure 1), and the correlation between inventory accumulation and the debt-equity ratio is -0.42 (Figure 2). On the other hand, GDP declines do not exhibit strong correlations with corporate liquidity or the loan to liability ratio. The data do not generate the expected positive correlation could be expected between liquidity and GDP declines or a negative correlation between loan dependency and a crisis-induced contraction.
We examine next the average change in financial flows as a proportion of GDP during the year of the crisis to give an idea of the financing changes which underlie the expenditure shifts by the corporate sector. Note that since flow/GDP data do not inherently follow a trend, they do not need to be measured relative to a trend as is the case for GDP components––but bear in mind that there could be adjustment for “normal” cyclical changes that might have occurred (we address this issue in the econometric results in section V). Because of limitations on the flow-of-funds data, we can use only a subset of the 59 crises set forth in Table 13. Post-crisis changes in financial flows are larger for emerging market countries and for bank crises (Table 15). For the 27 crises for which the flow data are available, the average fall in external finance was equivalent to −0.6 percent of GDP, the bulk being from bank loans (−0.5 percent). Liquidity also fell markedly, by −0.7 percent of GDP on average. Slight declines in equity issues and trade credit occur, while bond issues rise.
- 15 -
Interesting contrasts arise between the OECD and emerging market economies. The fall in external finance is much greater for the latter, at −1.4 percent of GDP, which is wholly accounted for by bank lending. There is also a very sharp fall in liquidity of -1.6 percent of GDP for emerging market countries and a −1 percent of GDP fall in trade credit. In contrast, OECD countries have on average only slight falls in external finance, largely due to equity issues, and a sharp rise of 0.5 percent of GDP in trade credit. These results show the much greater vulnerability of emerging market countries to financial instability. OECD countries’ corporate sectors on average are not required to draw heavily on liquidity while trade credit performs an interesting stabilizing function. Further and more precise results can be obtained by separate consideration of banking crises and currency crises (there is one twin crisis). For banking crises, results are similar in sign for OECD countries and emerging market countries, but different in magnitude. In each case there is a fall in total external financing; the decline is on average −2 percent of GDP, but with only −0.5 percent for the OECD and no less than −3.4 percent for emerging market countries. The fall is more than accounted for by the decline in bank lending which is −2.2 percent on average, −0.6 percent in the OECD and −4.3 percent in emerging market countries. On the other hand, bond issuance rises everywhere to 0.3 percent of GDP, showing the benefits of “multiple avenues of intermediation.” Liquidity contracts in each case. There are some contrasts for equity issues, which fall in OECD countries but rise in emerging market countries, while trade credit rises in the OECD and falls for emerging market countries. Again, trade credit stabilizes in the OECD, substituting to some extent for bank credit. Currency crises are clearly far more serious in terms of financing for emerging market countries—in OECD countries, total external financing rose in the year of crisis. In emerging market countries, external financing fell −1.8 percent of GDP in the crisis year, corresponding to declines in all subcomponents—bank lending, bond issuance, and equity issuance—as well as trade credit and liquidity. This pattern may reflect among other things the common withdrawal of foreign bank finance in the wake of EME currency crises. Direct comparison of these data with the expenditure components in Table 14 is not possible, since the expenditures are defined relative to trend GDP growth. However, given that for both OECD countries and emerging market countries trend growth is positive, it can be suggested that the falls in external finance as well as trade credit and liquidity may account for a substantial part of the fall in corporate expenditures. This is notably the case for the emerging market countries, where falls in investment of over 4 percent relative to trend could easily be accounted for largely by a 1.4 percent fall in external finance/GDP.
V. CORPORATE FINANCIAL STRUCTURE AND FINANCIAL STABILITY: ECONOMETRIC ANALYSIS
The econometric work is in two main parts. First, we estimate equations for fixed investment and inventory accumulation, the key corporate components of GDP. In each case, we tested
- 16 -
for the significance of dummies for currency and banking crises as shown in Table 12. Second, we tested for effects of crises on the components of corporate sector flow of funds. We made estimates for the full sample of countries and data for which information was available before focusing more closely on emerging market economies and OECD countries. Normal cyclical relationships in the variables of interest were estimated before testing whether crises had additional effects. This approach distinguished crisis effects from cyclical or policy-induced changes that would occur in the absence of the crisis. The estimates were made using a cross-section weighted generalized least squares (GLS) unbalanced panel with fixed effects for each country and cross-section weights. These weights allow for the common disturbances that affect the panel, such as world economic growth, growth in world trade, share prices and global bond yields. We considered this more appropriate than the alternative seemingly unrelated regressions (SUR) owing to the strength of the relations between equations. The fixed effects should deal with the inevitable heterogeneity between countries in the panel, in terms of levels of the variables concerned. The standard errors are White heteroskedasticity-consistent.
A. Fixed Investment and Inventory Accumulation
Fixed investment The first variable to be addressed was private fixed investment. This is a broader concept than business investment, as it also includes residential investment. However, since the latter is typically undertaken largely by construction companies, and its variability is considered to be an important effect of financial crises, we considered this aggregation an appropriate one. Note that only this breakdown is available for several emerging market economies. Our preferred specification is one with the valuation ratio as a key independent variable. As discussed in Ashworth and Davis (2001), Tobin (1969) and Brainard and Tobin (1968) maintain that investment should be an increasing function of the ratio of the capitalized financial value of the firm relative to the replacement (purchase) cost of the unit of capital. The key variable is marginal q, the ratio of the future marginal returns on investment relative to the current marginal costs of investment. Marginal q is unobservable, however, when the production and adjustment cost functions adhere to certain homogeneity conditions (implying inter alia that there is no market power) then marginal and average q are equal. Therefore, in line with other empirical researchers we have included measures of average q (logged and lagged) in the investment equation. Other variables included are the growth in income and lagged growth in investment, to allow for dynamics, and a lagged ratio of investment to output as an error correction term. The results suggest that financial crises have an independent and significant impact on investment (Table 16). Results were generated for all countries and OECD countries only because we have the equity and capital stocks for only two emerging market countries. All the variables are significant at 95 percent with the expected signs and magnitudes.
- 17 -
Investment is highly sensitive to output, with a first period elasticity of 2.3. Fourteen percent of the disequilibrium between output and investment is removed each year. A one percent rise in q leads to a 1.1 percent rise in the level of investment in the long term. The banking and currency crisis dummies were entered as a lag since gestation lags in investment mean changes in plans take time to come to fruition. They both have a significant effect on investment, with an average impact of around 3 percent (for all countries) and 2 percent (for OECD countries—although in the basic equation the banking crisis dummy was not significant). Bank credit seems to magnify the impact of financial crises on investment. The debt-equity ratio (the balance sheet channel) and the bank loan to total debt ratio (the credit channel) were both tested. In practice, the latter was dominant. A rise in bank debt as a share of the total has a significant positive effect on investment, consistent with the “specialness” of bank credit. Since there are fixed effects, we are not merely capturing cross-country differences. In the presence of bank debt, the entire crisis effects are significant, and somewhat larger (3–4 percent). A final experiment with these equations was to test for additional interaction effects between the credit channel and the crises. We considered if there was already a high level of bank lending in debt, whether a subsequent crisis had greater or lesser impact? There was tentative evidence that a banking crisis had a worse effect in this case, although the result only came through for the panel which included two emerging market countries. We estimated an alternative investment specification that would enable us to use the EME countries as a separate group given the data limitations for balance sheet variables. The specification was based on the neo-classical model first proposed by Jorgensen (1963), where the simple accelerator model was augmented to include the effects of relative price variables, specifically a proxy for the user cost of capital. By assuming either that net investment was determined as a distributed lag process of changes in the desired capital stock, or that there were explicit costs of adjustment, a specification was suggested where investment depended on distributed lags of output and itself, as well as a cost of capital term. Consistent with Bean (1981), we also included one long-run term ensuring homogeneity between investment and output as implied by the constant elasticity of substitution (CES) production function. Results are shown in Table 17. Here our full sample of 517 observations can be used rather than 258 for the Tobin specification. Note that we have used the simplest possible cost of capital variable, which is the nominal money market rate. In many of these countries, long-term bonds are not in existence. The bank and currency crisis effects are both significant and negative for the full panel and for the OECD countries, while for the emerging market countries it is the banking crisis effect that is significant. Again, the key variables are significant and correctly signed. We have both a long- and a short- run negative effect from the cost of capital, along with dynamic and error correction terms similar to those in the Tobin specification. The effect of a banking crisis on investment is much greater in emerging market countries, with a 7.3 percent fall instead of around 2 percent in the OECD countries (the OECD effect is itself comparable to that in the Tobin equation, despite an additional 200 observations).
- 18 -
In the Jorgensen framework, the results indicated an impact of a high debt-equity ratio on investment. Here, many observations were lost, with the sample comprising mainly OECD countries. The debt-equity ratio had a significant negative effect on investment over the full sample, but also interaction terms with the bank and currency crisis dummies were significant. A higher debt-equity ratio at the onset of a crisis significantly worsened the impact on investment in each case. We also investigated the bank lending to total debt ratio as above. It was again significant in itself but not interacting with the dummies. When we entered both together, the debt-equity ratio and its interaction terms remained significant while the bank-lending ratio became significant for banking crises only. We also attempted to estimate the equation with the flow variables total external finance to GDP and bank lending to GDP, but neither they themselves nor their interactions with the dummies were significant. Inventory accumulation Next, we estimated a simple inventory adjustment function, where the dependent variable was the change in inventories as a proportion of GDP (Table 18). The independent variables were a lagged dependent variable and terms in GDP growth, the change in the interest rate (showing monetary tightening) and the level of the interest rate. The coefficients indicated that more rapid growth increases inventory accumulation, and there also was a lagged effect (a positive or negative adjustment tends several years to complete). The interest rate effects are positive. While this may seem surprising, it is consistent with the results of Christiano, Eichenbaum, and Evans (1996), who found that, after a monetary tightening, net funds raised increased for a year or so. They attributed this to inability to cut expenditures immediately, with inventories being a case in point. As regards crisis effects, the aggregate and OECD equations suggest that there is a positive effect of a banking crisis on inventories (as shown in Table 14, the median response is zero). This may be consistent with the immediate impact of a crisis being on aggregate activity, which leads to involuntary inventory accumulation. Note however, that in emerging market countries there is an immediate negative effect, suggesting a banking crisis there leads to inventory cuts via credit rationing. We again tried to estimate inventory functions with the bank lending/debt ratio and the debt- equity ratio and their interaction with the crisis dummies. In this case, the results (not reported in detail) were much poorer than for the investment function, suggesting balance sheets have less impact on inventory accumulation than on fixed investment. Again, this was also true for the external finance and bank lending flow/GDP ratios and their interactions with the dummies.
B. Corporate Sector Flow of Funds
We now move to equations that aim to capture empirically shifts in flows that accompany the declines in investment and inventories. Note that the results do not prove that rationing of finance caused the fall in expenditure since there may be supply and demand side influences on a given flow. Equally, we have not shown a direct link from flows per se to aggregate
- 19 -
corporate expenditures. But the results are suggestive, as well as being of interest in themselves. The variables concerned are bank lending to companies, bond issuance, equity issuance, and trade credit and, on the asset side, the flows to liquidity. All are defined as linear variables (as they can be negative) and relative to GDP. Accordingly, in each equation we have as a dependent variable the change in the flow relative to GDP, while independent variables are the lagged flow/GDP ratio, economic growth terms, changes in the interest rate and the lagged interest rate. Together these seek to capture “transactions demand” for funds and “portfolio balance” effects in each case (although portfolio effects are not comprehensively captured, since we lack the necessary data for bond and equity yields, bank loans and costs of trade credit). We then add current and lagged crisis dummies. Note that the data for flows are more comprehensive than for stocks; accordingly, although we have fewer observations than for the Jorgensen investment function and the inventories equation, we have 100 more than for the Tobin investment function. The coverage of emerging market countries by flow data is sufficiently good (over 100 observations covering 6 countries) to warrant separate estimation for them. Bank lending The first equation shown in Table 19 is for bank lending, which in most countries is the most important source of funds for corporations. All of the independent variables are significant. The bank lending/GDP ratio rises when there is economic growth and contracts in recession, consistent with a cyclical pattern of external financing. The interest rate effect is positive, consistent with the Christiano, Eichenbaum, and Evans (1996) result cited above, and possibly also with the increased obligations on firms when interest rates rise and their debt is floating rate, and the lower sensitivity to credit quality of banks than other sources of funds. The crisis dummies are consistently negative and significant, in both level and lag, for emerging market countries, and for all countries other than the level dummy for currency crises. The overall impact of a banking crisis is around 3 times greater for emerging market countries than for OECD countries, with a fall of 3 percent in lending relative to GDP in the former and only 1 percent in the latter. In contrast, for OECD countries, the impact of a crisis on bank lending comes only with a lag. Note that since GDP itself typically falls after a crisis, the absolute fall in bank lending is likely to be much larger. Also, since the levels of bank lending/GDP are often fairly low, the change of 3 percentage points may change from expansion to contraction. Bond issuance Bond issuance is evidently less cyclical than bank lending and seems to offset to some extent the crisis-induced drop in bank lending (Davis, 2001). A rise in interest rates tends to cut bond issuance, notably in OECD countries, consistent with a greater sensitivity to credit quality of bond markets than on the part of banks (Table 20). On the other hand, there is strong evidence for OECD countries, which carries over to the full sample that banking crises lead to increases in bond and other securities issuance. This is consistent with the idea of
- 20 -
effective “multiple channels of intermediation” as cited in Greenspan (1999), whereby a shock to banks, which does not impact on the credit quality of firms, can be compensated by availability of securities finance. Note that this effect does not apply during a currency crisis in OECD countries or emerging market countries, effects of which on bond issuance are negative. Equity issuance The results for equity issuance are not as definitive as for the other components of financing (Table 21). There is some evidence for OECD countries that equity flows are countercyclical, with a negative sign on GDP growth, whereas in emerging market countries the corresponding variable has a positive sign. This may be consistent with more efficient equity markets, where purchasers of new issues are willing to look ahead for profits growth, although it could also reflect distress-driven rights issues, which are common in recessions. There is a negative interest rate effect on equity issuance—where a fall in interest rates entails a lower discount rate on future profits. The only crisis effects to be significant are in the OECD countries, where there is a negative effect on equity issuance from both banking and currency crises. The effect is larger for banking crises (a 4 percent fall in the equity flow/GDP ratio) than for currency crises (1 percent). One explanation is the loss of beneficial information spillovers from bank lending to equity pricing. Trade credit The results for trade credit (not reported) are also weak, which may not be surprising given that this is one of the more difficult variables for statisticians to identify. There remain some plausible coefficients, with credit increasing in OECD countries during the cycle, while for all countries; it is raised when interest rates increase. This may reflect rationing from regular sources of fund for firms at the margin, as well as possible substitution from more expensive sources. Crisis effects only become significant for the full sample, when there is lower trade credit one period after a crisis. Since this result does not carry over to either of the subsamples, it should be viewed with caution. Total external financing The results of total external financing flows show important differences between EMEs and OECD countries (Table 22). It can also be seen that total financing is strongly cyclical, in addition to having a positive relation to interest rates in the short run. The effect of crises for the full sample is restricted to the lagged effect, with the effect of a banking crisis being three times larger than that of a currency crisis. There are contrasts between the subgroups, with the emerging market result showing a significant first period effect, which persists into the second period for banking crisis episodes. In contrast, the industrial country result is in line with the full sample, with only the lag showing significant effects.
- 21 -
Liquidity accumulation
Finally, we examined the behavior of liquidity accumulation and considered the question of when firms build up or reduce their short-term financial assets (Table 23). Cyclical effects are significant only for the emerging market countries. There is a negative effect of monetary tightening in OECD countries, suggesting that the inflexibility of expenditure requires firms to cut liquidity as well as borrowing from banks. Crisis effects arise significantly only for OECD countries in the wake of currency crises. It may be that even after a banking crisis, debt securities and trade credit are sufficient to leave firms able to maintain their precautionary liquidity. Summary The significant dummy crisis variables are summarized in Table 24. There is a preponderance of negative effects on expenditure and financing in the wake of crises, as would be expected, going beyond the normal behavior of the variables in question (as captured by the rest of the equation). This is particularly the case for emerging market countries, where all the significant dummies are negative, while the coefficients for the emerging market countries are also generally larger. This illustrates the more adverse impact of crises, both from the currency or banking side, for emerging market countries than OECD countries. That said, the effects in OECD countries are not negligible. Investment, bank lending, and equity issuance are consistently reduced by banking and currency crises. On the other hand, the positive sign for bond issuance in the wake of banking crises shows the helpful effect of “multiple avenues of intermediation,” absent for emerging market countries. Finally, Table 25 provides background information on the number of crisis episodes covered by the respective datasets. Generally, the coverage is better for OECD countries than for emerging markets, partly reflecting the lesser number of emerging market countries covered. The best level of coverage is for inventories and the Jorgensen investment function, with the total number of crises being around 50, of which two-thirds are currency crises. Three-quarters of the crises covered are in OECD countries. The number of crises is lower for the flow-of-funds equations, reflecting the lesser data availability for the flows. For all countries, we now have 30 crises, although these are helpfully distributed fairly evenly between emerging market countries and OECD countries. Finally, for the Tobin investment function, we have 15 crises for OECD countries.
VI. CONCLUSION
This paper has provided evidence of the impact of financial crises on corporate financing and expenditures in a range of countries, both advanced and emerging markets. We find that the average level of corporate financing differs markedly between country groups, with emerging market corporate sectors being more dependent on external finance and also more dependent on banks. Further, the corporate sectors in emerging markets have higher debt-equity ratios but also smaller corporate liabilities (including equity) as well as higher liquidity ratios than their counterparts in industrial countries.
- 22 -
Investment and inventory contractions are the main contributors to post-crisis GDP contractions, and these contractions are correlated with corporate financial structure. There is a marked correlation of the debt-equity ratio with investment and inventory declines following crises. Changes in corporate financial flows after crises impinge largely on bank lending and are greater in magnitude for emerging market countries and after banking crises than, respectively, for OECD countries or after currency crises. Econometric analysis suggests that financial crises have a greater and more consistently negative impact on corporate sectors in emerging markets than in industrial countries, although even in the latter the impact is not negligible. Industrial countries benefit from the existence of multiple channels of intermediation, in that bond issuance is shown to pick up in the wake of banking crises. We believe these results strengthen the case for more intense surveillance of the corporate sector by national governments and international financial institutions. A closer focus on corporate sector performance could enhance the assessment of overall economic vulnerability to crisis. Specifically, financial stability indicators should include corporate sector balance sheet and flow indicators as a priority. In order for this to become operational, countries need to be encouraged to produce flow-of-funds and sectoral balance sheet data. In addition, further analysis of the components of expenditure in the wake of crises would help improve understanding of the crisis channels between the corporate sector and the rest of the economy.
Finally, governments should think seriously about reshaping corporate incentives to enhance financial stability (Stone, 2001). The links between corporate financial structure and post-crisis contractions in GDP indicate an important externality that is only now receiving much attention. The externality is the absence of market punishment for corporate managers who make financing decisions that help propagate systemic financial crises. The social costs of crises could be internalized for corporate managers through policies that improve corporate governance and establish proper legal, regulatory, and judicial arrangements. We hope that these policy responses will reduce the economic and social costs of modern financial crises.
- 23 -
Table 1. Key Aggregate Corporate Balance Sheet Indicators, 1999 or Latest Year
Shares of Corporate Liabilities
Total Corporate
Liabilities toGDP Loans Bonds Equity Trade
Debt-Equity Ratio
LiquidityRatio
Debt-GDPRatio
Median G-7 countries 2.48 0.23 0.08 0.63 0.06 0.59 0.21 0.50Small industrial countries 1.96 0.30 0.04 0.57 0.08 0.61 0.26 0.76Emerging market countries 1.75 0.27 0.21 0.40 0.14 0.73 0.42 0.66 Standard deviation G-7 countries 0.80 0.15 0.06 0.16 0.07 0.52 0.39 0.21Small industrial countries 1.00 0.15 0.03 0.16 0.04 1.05 0.07 0.13Emerging market 0.51 0.17 0.16 0.23 0.42 1.59 0.50 0.37 G-7 countries Canada (2000) 1.63 0.21 0.16 0.51 0.12 0.72 0.17 0.50France (1997) 3.43 0.12 0.02 0.75 0.10 0.19 0.21 0.48Germany (1998) 1.37 0.53 0.02 0.42 0.03 1.29 0.26 0.63Italy (1999) 1.43 0.36 0.01 0.63 0.00 0.59 0.13 0.50Japan (2000) 2.54 0.38 0.12 0.31 0.20 1.60 1.20 1.03United Kingdom (1999) 2.95 0.23 0.08 0.64 0.06 0.47 0.27 0.73United States (1999) 2.48 0.09 0.12 0.74 0.05 0.28 0.08 0.46 Small and medium-sized industrial countries Australia (1998) 1.78 0.24 0.12 0.57 0.07 0.62 0.19 0.63Austria 1.06 0.69 0.07 0.20 0.04 3.87 0.17 0.81Belgium 2.18 0.31 0.05 0.60 0.04 0.60 0.35 0.79Denmark 1.44 0.44 0.02 0.53 0.01 0.87 0.27 0.66Finland 4.57 0.12 0.01 0.85 0.02 0.16 0.15 0.61Netherlands 3.05 0.30 0.02 0.58 0.10 0.54 0.31 0.97Norway 1.84 0.38 0.07 0.45 0.10 0.98 0.25 0.82Portugal 1.99 0.32 0.06 0.52 0.11 0.72 0.35 0.74Spain 1.93 0.28 0.02 0.61 0.09 0.50 0.20 0.58Sweden 2.79 0.30 0.03 0.57 0.10 0.59 0.30 0.93 Emerging market countries Croatia (2000) 1.49 0.13 0.21 0.52 0.14 0.66 0.02 0.50Czech Republic 2.27 0.27 0.02 0.40 0.31 0.73 0.20 0.66Israel 1.15 Korea, Rep. of 2.01 0.38 0.33 0.20 0.09 3.46 0.64 1.21Sources: National statistical references.
- 24 -
Table 2. Total Corporate Liabilities to GDP, Percent Changes, 1970–99
79/70 89/80 99/90 99/95
Median G-7 countries -8.9 18.4 23.5 31.6Small industrial countries 39.4
G-7 countries Canada -0.7 -0.3 15.4 8.8France -24.5 114.0 60.8 31.6Germany 3.3 11.6 21.6 26.2Italy -17.8 18.4 23.5 34.4Japan 3.5 24.9 3.6 -1.6United Kingdom -34.4 113.8 64.3 39.4United States -8.9 16.5 86.9 47.4 Small and medium-sized industrial countries Australia 31.3 11.5Austria 22.0Belgium 47.6Denmark 15.4Finland 145.3Netherlands 47.5Norway 29.5 31.3Portugal 10.9Spain 78.7Sweden 56.3 Emerging market countries Israel -3.3 86.5 28.7 19.6Korea, Rep. of 2.8 34.2 20.6Sources: National statistical references
.
- 25 -
Table 3. Loans/Liabilities, Percent Change, 1970–99
79/70 89/80 99/90 99/95
Median G-7 countries 6.1 -3.3 -20.7 -15.6Small industrial countries -11.8 G-7 countries Canada 46.7 -3.3 -20.7 -12.3France 13.8 -49.0 -44.9 -28.6Germany 3.9 -5.2 -9.2 -9.6Italy -0.4 -8.1 -17.3 -25.2Japan 6.1 11.5 -3.3 -5.4United Kingdom 111.8 99.5 -38.9 -15.6United States 5.2 13.5 -51.5 -21.6 Small and medium-sized industrial countries Australia -36.6 -8.0Austria -7.6Belgium -15.5Denmark -6.0Finland -61.2Netherlands -21.1Norway -8.7 0.2Portugal 15.5Spain -26.7Sweden -28.8 Emerging market country Korea, Rep. of 11.4 -11.8 -14.1 Sources: National statistical references.

- 26 -
Table 4. Debt-Equity Ratio, Percent Change, 1970–99
79/70 89/80 99/90 99/95
Median G-7 countries 64.5 -16.4 -41.0 -31.3Small industrial countries -24.9 G-7 countries Canada 52.1 13.8 -13.9 -9.2France 114.8 -71.1 -54.6 -36.2Germany -1.2 -45.2 -41.0 -31.3Italy -18.5 -24.0 -35.2 -44.7Japan 84.6 -8.9 -19.7 -16.9United Kingdom -49.6 -21.3United States 76.9 13.1 -66.5 -37.3 Small and medium-sized industrial countries Australia -57.1 -5.6Austria -21.4Belgium -21.6Denmark -28.2Finland -71.2Netherlands -38.2Norway -30.1 -9.2Portugal 20.7Spain -48.9Sweden -45.9 Emerging market countries Czech Republic 20.2Korea, Rep. of 5.4 8.2 -15.2Sources: National statistical references.
- 27 -
Table 5. Loans Plus Bonds to GDP, Percent Change, 1970–99
1979/70 1989/80 1999/95 Median G-7 countries 16.9 14.6 3.3 Small industrial countries 17.0 G-7 countries Canada 30.4 13.5 3.3 France 34.0 15.6 -4.7 Germany -25.5 7.2 12.2 Italy -26.8 6.1 -1.6 Japan 75.7 50.2 -4.6 United Kingdom 21.7 United States 3.4 34.6 17.6 Small and medium-sized industrial countries Australia 7.0 Austria 16.8 Belgium 31.1 Denmark 0.8 Finland -2.2 Netherlands 16.7 Norway 32.5 Portugal 28.9 Spain 27.2 Sweden 17.1 Emerging market countries Czech Republic -1.8 Korea, Rep. of 42.2 9.1 Sources: National statistical references.
- 28 -
Table 6. Liquidity Ratio, Percent Change, 1970–99
79/70 89/80 99/90 99/95Median G-7 countries 9.1 23.8 17.0 8.3 Small industrial countries 17.4 G-7 countries Canada 42.7 38.5 31.4 21.4 France 49.1 32.3 27.3 7.9 Germany 22.3 23.2 13.3 15.7 Italy -9.3 17.4 -0.1 16.1 Japan 9.1 23.8 -15.0 -9.8 United Kingdom 7.3 113.0 17.0 8.3 United States -1.8 6.6 23.9 8.0 Small and medium-sized industrial countries Australia 20.5 9.7 Austria -10.2 Belgium 39.8 Denmark 8.3 Finland -16.7 Netherlands 31.6 Norway 18.2 25.0 Portugal 51.7 Spain 26.9 Sweden 0.8 Emerging market countries Czech Republic -20.8 Israel 74.0 -33.5 24.1 30.4 Korea, Rep. of 74.4 28.9 -1.0 Sources: National statistical references.
- 29 -
Table 7. Aggregate Corporate Flow of Funds, 1995–99
Share of Total Financing Net
Financingto GDP
Gross Financing
to GDP Loans Bonds EquitiesLiq Accum
to GDPMedian G-7 countries 3.4 34.5 24.0 41.2 0.6Small industrial countries -0.2 5.3 54.3 10.1 35.8 1.2Emerging market countries -11.7 18.6 44.9 21.5 26.9 1.7 G-7 countries Canada 5.8 21.2 24.0 41.2 1.9France (1995-97) 4.9 10.5 6.2 59.4 0.6Germany (1995-98) 3.2 75.7 3.5 17.8 1.5Italy 3.4 52.7 -1.4 48.7 0.2Japan 0.2 54.2 24.4 14.3 0.6United Kingdom 5.5 21.9 26.3 48.2 1.2United States 2.9 34.5 76.1 -39.9 0.6 Small and medium-sized industrial countries Australia -2.9 8.0 25.2 18.1 41.5 1.8Austria -0.3 0.6 55.1 12.8 28.6 0.1Belgium -0.1 0.3 35.0 12.8 47.2 0.1Denmark 1.6 2.9 100.6 -46.7 42.2 0.6Finland 0.5 4.3 33.0 -0.4 84.5 0.4Netherlands 1.6 10.1 58.0 3.5 24.5 2.6Norway -4.7 13.9 37.1 10.1 46.8 2.3Portugal -3.0 12.7 53.5 10.2 30.1 3.5Spain -0.1 1.4 57.7 -0.8 25.4 0.3Sweden -0.3 6.3 57.1 13.7 2.9 2.0 Emerging market countries Czech Republic 23.2 38.5 5.3 24.9 1.7India (1990-97) -0.4 0.7 51.2 18.4 29.1 0.0Korea, Rep. of -11.7 16.5 31.6 32.0 28.8 5.1Thailand -19.3 20.8 58.7 24.6 15.5 1.7Sources: National statistical references.
- 30 -
Table 8. Gross Financing to GDP, 1970–99
1970–79 1980–89 1990–99 1995–99Median G-7 countries 8.3 7.0 4.5 3.4 Small industrial countries 5.3 Emerging market countries 6.3 6.3 18.3 18.6 G-7 countries Canada 8.3 7.0 5.3 5.8 France (1995-97) 9.8 8.8 6.3 4.9 Germany (1995-98) 4.2 3.2 4.6 3.2 Italy 9.3 7.7 4.5 3.4 Japan 12.7 10.4 3.5 0.2 United Kingdom 6.3 6.6 4.1 5.5 United States 5.3 3.3 2.2 2.9 Small and medium-sized industrial countries Australia 8.0 Austria 0.6 Belgium 0.3 Denmark 2.9 Finland 4.3 Netherlands 10.1 Norway 9.1 13.9 Portugal 12.7 Spain 1.4 Sweden 6.3 Emerging market countries Czech Republic 25.7 23.2 India (1990-97) 0.1 0.3 0.7 Korea, Rep. of 18.8 18.5 19.7 16.5 South Africa 6.0 4.9 8.5 10.4 Thailand 6.6 7.7 18.3 20.8 Sources: National statistical references.

- 31 -
Table 9. Loan Share of Total Financing, 1970–99
1970–79 1980–89 1990–99 1995–99
Median G-7 countries 53.0 62.1 36.8 34.5 Small industrial countries 54.3 Emerging market countries 51.8 43.9 37.8 35.9 G-7 countries Canada 37.3 33.9 24.3 21.2 France (1995-97) 53.0 41.3 17.9 10.5 Germany (1995-98) 87.1 80.9 75.4 75.7 Italy 76.7 73.3 56.8 52.7 Japan 86.0 74.3 62.0 54.2 United Kingdom 47.5 58.4 30.9 21.9 United States 35.3 62.1 36.8 34.5 Small and medium-sized industrial countries Australia 25.2 Austria 55.1 Belgium 35.0 Denmark 100.6 Finland 33.0 Netherlands 58.0 Norway 42.7 37.1 Portugal 53.5 Spain 57.7 Sweden 57.1 Emerging market countries Czech Republic 37.8 38.5 India (1990-97) 56.7 58.5 51.2 Korea, Rep. of 46.9 43.8 32.5 31.6 South Africa 58.5 40.4 33.2 33.4 Thailand 44.2 44.0 56.0 58.7 Sources: National statistical references.
- 32 -
Table 10. Bond Share of Total Financing, 1970–99
1970–79 1980–89 1990–99 1995–99
Median G-7 countries 4.4 7.1 19.3 24.0Small industrial countries 10.1Emerging market countries 15.0 20.7 18.4 14.9 G-7 countries Canada 27.5 32.9 24.3 24.0France (1995-97) 2.7 5.9 7.0 6.2Germany (1995-98) 2.1 6.3 3.7 3.5Italy 5.4 3.7 -0.8 -1.4Japan 4.4 14.2 19.3 24.4United Kingdom 1.1 7.1 23.6 26.3United States 27.9 60.3 75.3 76.1 Small and medium-sized industrial countries Australia 18.1Austria 12.8Belgium 12.8Denmark -46.7Finland -0.4Netherlands 3.5Norway 8.4 10.1Portugal 10.2Spain -0.8Sweden 13.7 Emerging market countries Czech Republic 5.0 5.3India (1990-97) 15.6 17.2 18.4 Korea, Rep. of 14.4 24.1 31.8 32.0South Africa 10.6 8.5 5.3 4.9Thailand 26.4 30.1 26.8 24.6Sources: National statistical references.
- 33 -
Table 11. Equity Share of Total Financing, 1970–99
1970-79 1980-89 1990-99 1995-99
Median G-7 countries 8.8 14.1 38.7 41.2 Small industrial countries 35.8 Emerging market countries 21.6 23.1 28.0 26.9 G-7 countries Canada 14.0 24.3 38.7 41.2 France (1995-97) 8.8 23.0 52.2 59.4 Germany (1995-98) 10.7 9.9 17.7 17.8 Italy 17.9 23.0 44.0 48.7 Japan 7.0 9.0 10.5 14.3 United Kingdom 7.8 14.1 41.6 48.2 United States 6.3 -43.3 -41.5 -39.9 Small and medium-sized industrial countries Australia 41.5 Austria 28.6 Belgium 47.2 Denmark 42.2 Finland 84.5 Netherlands 24.5 Norway 41.7 46.8 Portugal 30.1 Spain 25.4 Sweden 2.9 Emerging market countries Czech Republic 24.6 24.9 India (1990-97) 13.2 20.7 29.1 Korea, Rep. of 17.0 21.8 28.0 28.8 South Africa 30.0 55.5 59.6 58.5 Thailand 26.2 24.5 16.2 15.5 Sources: National statistical references.
- 34 -
Table 12. Accumulation of Liquid Assets, 1970–99
1970-79 1980-89 1990-99 1995-99
Median G-7 countries 1.9 1.7 1.0 0.6 Small industrial countries 1.2 Emerging market countries 1.6 3.0 3.6 2.8 G-7 countries Canada 2.1 1.0 1.4 1.9 France (1995-97) 1.7 1.4 1.3 0.6 Germany (1995-98) 1.9 1.8 2.0 1.5 Italy 3.8 2.8 0.3 0.2 Japan 4.6 3.7 0.2 0.6 United Kingdom 1.8 1.7 1.0 1.2 United States 0.7 0.6 0.5 0.6 Small and medium-sized industrial countries Australia 1.8 Austria 0.1 Belgium 0.1 Denmark 0.6 Finland 0.4 Netherlands 2.6 Norway 1.4 2.3 Portugal 3.5 Spain 0.3 Sweden 2.0 Emerging market countries Czech Republic 3.2 1.7 India (1990-97) Korea, Rep. of 6.2 6.2 7.8 5.1 South Africa 1.6 3.0 4.1 3.8 Thailand 1.0 0.9 2.8 1.7 Sources: National statistical references.
- 35 -
Table 13. Crisis Episodes
Banking Currency
G-7 countries United States 1984 1985 United Kingdom 1976, 1982, 1992 Canada 1981, 1986 France 1994 1992 Italy 1990 1976, 1992, 1995 Japan 1992 1979 Germany 1977 Subtotal: 5 11 Small and medium-sized industrial countries Australia 1989 1976, 1983, 1985 Austria Belgium 1982 Denmark 1987 1976, 1992, 1993 Finland 1991 1986, 1991, 1993 Netherlands Norway 1987 1986 Portugal 1976, 1978, 1983 Spain 1977 1976, 1982, 1992, 1995 Sweden 1991 1992 Subtotal: 6 20 Emerging market countries Croatia Czech India 1994 1991 Israel 1977 1977 Korea, Rep. of 1998 1980, 1998 South Africa 1977, 1985 1975, 1981, 1988, 1992, 1995 Thailand 1983, 1998 1998 Subtotal: 7 10 Total 18 41
Source: Eichengreen and Bordo (2002).
- 36 -
Table 14. Cumulative Change in Expenditure Components Relative to Trend in Banking and Currency Crisis Years t and t +1
(Measured in contribution to change in GDP) 1/
Percent GDP
Total Domestic Demand
Total Public
Domestic Demand
TotalPrivate
Domestic Demand
Private Consump-
tion
Private Invest-
ment
Change in Inven-tories
Foreign Balance
Total average -1.5 -2.6 0.1 -2.9 -0.7 -1.7 -0.4 1.1 median -1.0 -1.1 -0.1 -1.8 -0.7 -1.1 0.0 0.5
EME average -3.2 -6.4 -0.4 -5.6 -1.3 -3.2 -1.1 2.7 median -3.3 -4.3 -0.3 -4.1 -2.0 -1.9 -0.1 1.6
OECD average -0.9 -1.5 0.2 -2.0 -0.5 -1.3 -0.1 0.6 median -0.2 -0.7 -0.1 -0.9 -0.5 -0.4 0.1 0.4
Currency average -1.1 -1.9 -0.1 -2.0 -0.5 -1.2 -0.3 1.0 median -0.2 -0.7 -0.1 -0.9 -0.5 -0.4 0.0 0.5
Banking average -3.1 -5.1 0.2 -5.0 -1.4 -3.1 -0.4 1.9
median -2.8 -4.1 0.3 -4.0 -0.8 -3.1 -0.1 1.6
Notes: Average data do not always sum precisely to the change in GDP owing to gaps in data coverage. Median data do not sum since they are a combination of different crisis events. 1/ Reflecting lack of disaggregated investment data for emerging market countries, “private domestic demand” for emerging market countries includes total investment, while “private investment” is replaced by total investment. See Appendix I for details of individual crisis episodes
Table 15. Change in Flow of Funds/GDP in Year of Crisis
All Crises (27)
External Finance Bank Loans Bond Issues Equity Issues Trade Credit Liquidity
Average -0.6 -0.5 0.1 -0.1 -0.1 -0.7OECD -0.1 0.0 0.1 -0.2 0.5 -0.1EME -1.4 -1.4 0.0 -0.1 -1.0 -1.6
Banking Crises (9)
External Finance Bank Loans Bond Issues Equity Issues Trade Credit Liquidity
Average -2.0 -2.2 0.3 0.2 0.1 -1.7OECD -0.5 -0.6 0.3 -0.3 1.7 -0.1EME -3.4 -4.3 0.3 0.6 -1.5 -3.6
Currency Crises (19)
External Finance Bank Loans Bond Issues Equity Issues Trade Credit Liquidity
Average -0.7 -0.4 -0.1 -0.2 -0.4 -0.8OECD 0.1 0.3 0.0 -0.1 0.1 0.0EME -1.8 -1.4 -0.1 -0.3 -1.2 -1.9
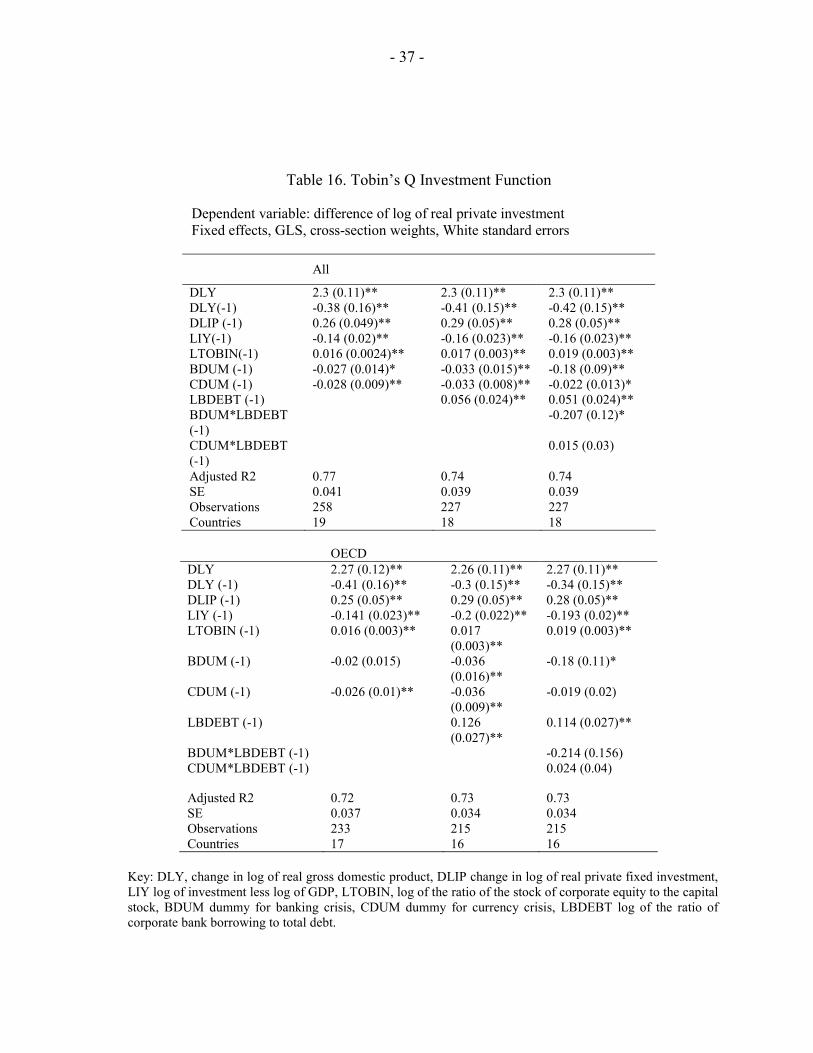
- 37 -
Table 16. Tobin’s Q Investment Function
Dependent variable: difference of log of real private investment Fixed effects, GLS, cross-section weights, White standard errors
All
DLY 2.3 (0.11)** 2.3 (0.11)** 2.3 (0.11)** DLY(-1) -0.38 (0.16)** -0.41 (0.15)** -0.42 (0.15)** DLIP (-1) 0.26 (0.049)** 0.29 (0.05)** 0.28 (0.05)** LIY(-1) -0.14 (0.02)** -0.16 (0.023)** -0.16 (0.023)** LTOBIN(-1) 0.016 (0.0024)** 0.017 (0.003)** 0.019 (0.003)** BDUM (-1) -0.027 (0.014)* -0.033 (0.015)** -0.18 (0.09)** CDUM (-1) -0.028 (0.009)** -0.033 (0.008)** -0.022 (0.013)* LBDEBT (-1) 0.056 (0.024)** 0.051 (0.024)** BDUM*LBDEBT (-1)
-0.207 (0.12)*
CDUM*LBDEBT (-1)
0.015 (0.03)
Adjusted R2 0.77 0.74 0.74 SE 0.041 0.039 0.039 Observations 258 227 227 Countries 19 18 18
OECD DLY 2.27 (0.12)** 2.26 (0.11)** 2.27 (0.11)** DLY (-1) -0.41 (0.16)** -0.3 (0.15)** -0.34 (0.15)** DLIP (-1) 0.25 (0.05)** 0.29 (0.05)** 0.28 (0.05)** LIY (-1) -0.141 (0.023)** -0.2 (0.022)** -0.193 (0.02)** LTOBIN (-1) 0.016 (0.003)** 0.017
(0.003)** 0.019 (0.003)**
BDUM (-1) -0.02 (0.015) -0.036 (0.016)**
-0.18 (0.11)*
CDUM (-1) -0.026 (0.01)** -0.036 (0.009)**
-0.019 (0.02)
LBDEBT (-1) 0.126 (0.027)**
0.114 (0.027)**
BDUM*LBDEBT (-1) -0.214 (0.156) CDUM*LBDEBT (-1) 0.024 (0.04)
Adjusted R2 0.72 0.73 0.73 SE 0.037 0.034 0.034 Observations 233 215 215 Countries 17 16 16
Key: DLY, change in log of real gross domestic product, DLIP change in log of real private fixed investment, LIY log of investment less log of GDP, LTOBIN, log of the ratio of the stock of corporate equity to the capital stock, BDUM dummy for banking crisis, CDUM dummy for currency crisis, LBDEBT log of the ratio of corporate bank borrowing to total debt.
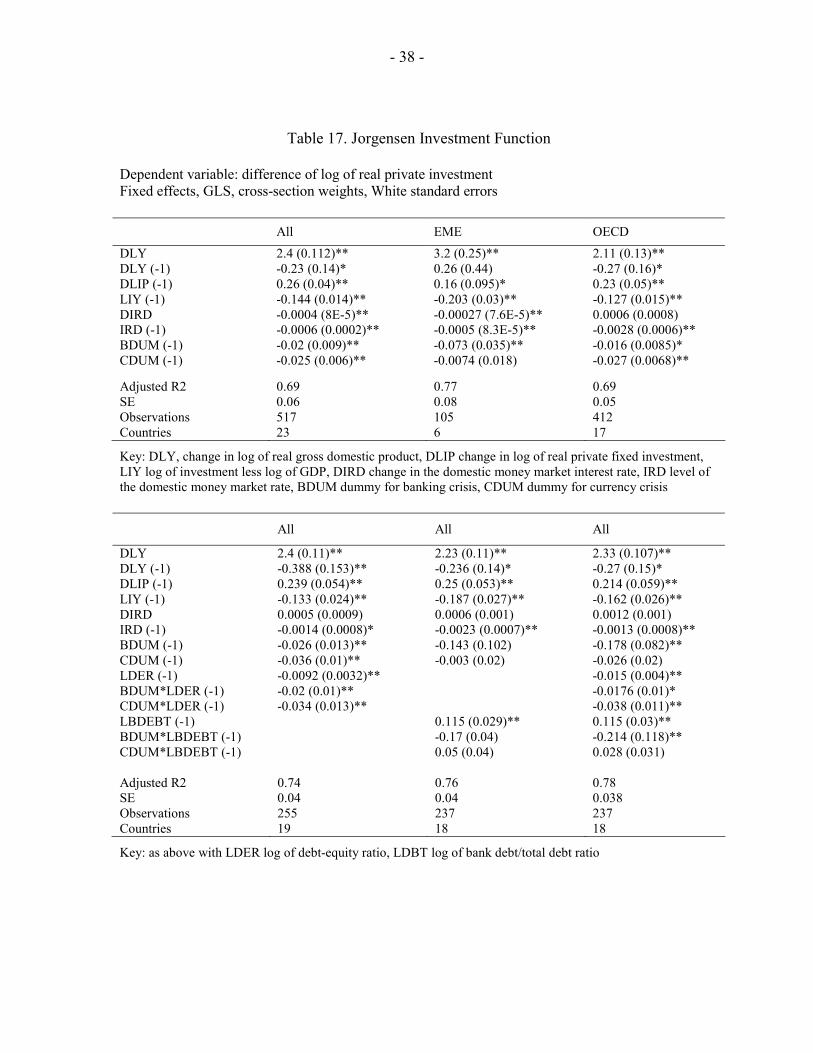
- 38 -
Table 17. Jorgensen Investment Function
Dependent variable: difference of log of real private investment Fixed effects, GLS, cross-section weights, White standard errors All EME OECD DLY 2.4 (0.112)** 3.2 (0.25)** 2.11 (0.13)** DLY (-1) -0.23 (0.14)* 0.26 (0.44) -0.27 (0.16)* DLIP (-1) 0.26 (0.04)** 0.16 (0.095)* 0.23 (0.05)** LIY (-1) -0.144 (0.014)** -0.203 (0.03)** -0.127 (0.015)** DIRD -0.0004 (8E-5)** -0.00027 (7.6E-5)** 0.0006 (0.0008) IRD (-1) -0.0006 (0.0002)** -0.0005 (8.3E-5)** -0.0028 (0.0006)** BDUM (-1) -0.02 (0.009)** -0.073 (0.035)** -0.016 (0.0085)* CDUM (-1) -0.025 (0.006)** -0.0074 (0.018) -0.027 (0.0068)**
Adjusted R2 0.69 0.77 0.69 SE 0.06 0.08 0.05 Observations 517 105 412 Countries 23 6 17
Key: DLY, change in log of real gross domestic product, DLIP change in log of real private fixed investment, LIY log of investment less log of GDP, DIRD change in the domestic money market interest rate, IRD level of the domestic money market rate, BDUM dummy for banking crisis, CDUM dummy for currency crisis All All All
DLY 2.4 (0.11)** 2.23 (0.11)** 2.33 (0.107)** DLY (-1) -0.388 (0.153)** -0.236 (0.14)* -0.27 (0.15)* DLIP (-1) 0.239 (0.054)** 0.25 (0.053)** 0.214 (0.059)** LIY (-1) -0.133 (0.024)** -0.187 (0.027)** -0.162 (0.026)** DIRD 0.0005 (0.0009) 0.0006 (0.001) 0.0012 (0.001) IRD (-1) -0.0014 (0.0008)* -0.0023 (0.0007)** -0.0013 (0.0008)** BDUM (-1) -0.026 (0.013)** -0.143 (0.102) -0.178 (0.082)** CDUM (-1) -0.036 (0.01)** -0.003 (0.02) -0.026 (0.02) LDER (-1) -0.0092 (0.0032)** -0.015 (0.004)** BDUM*LDER (-1) -0.02 (0.01)** -0.0176 (0.01)* CDUM*LDER (-1) -0.034 (0.013)** -0.038 (0.011)** LBDEBT (-1) 0.115 (0.029)** 0.115 (0.03)** BDUM*LBDEBT (-1) -0.17 (0.04) -0.214 (0.118)** CDUM*LBDEBT (-1) 0.05 (0.04) 0.028 (0.031)
Adjusted R2 0.74 0.76 0.78 SE 0.04 0.04 0.038 Observations 255 237 237 Countries 19 18 18
Key: as above with LDER log of debt-equity ratio, LDBT log of bank debt/total debt ratio
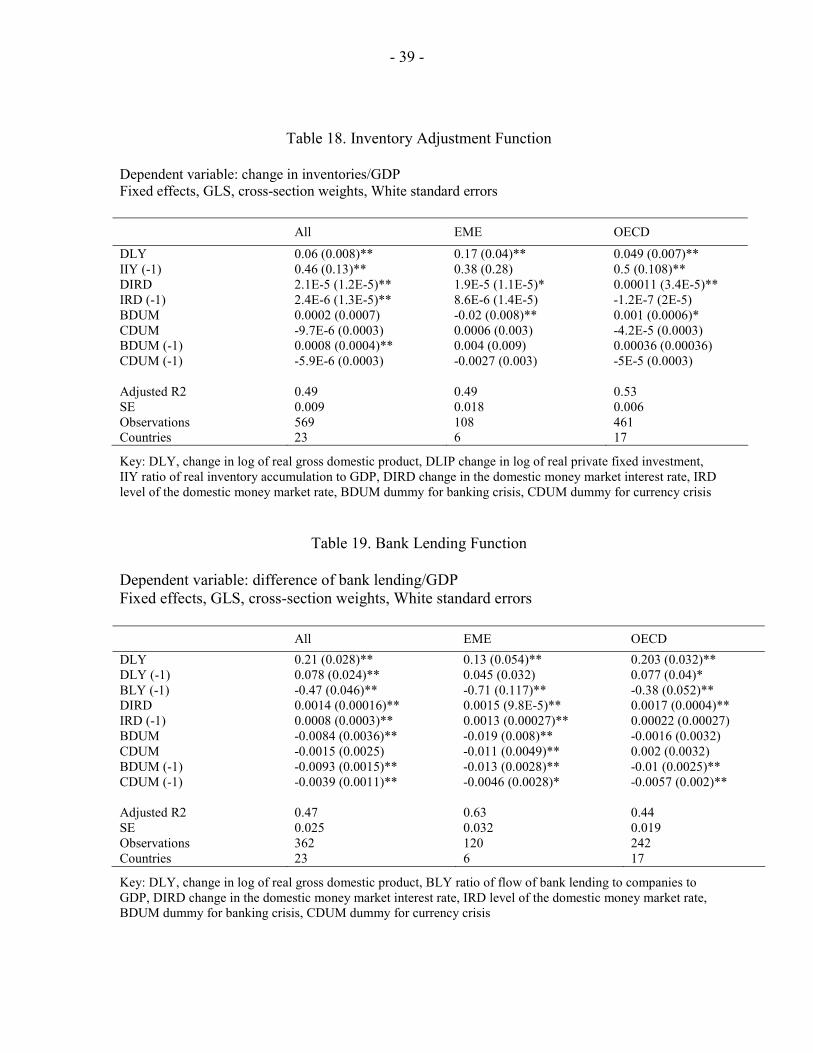
- 39 -
Table 18. Inventory Adjustment Function
Dependent variable: change in inventories/GDP Fixed effects, GLS, cross-section weights, White standard errors All EME OECD
DLY 0.06 (0.008)** 0.17 (0.04)** 0.049 (0.007)** IIY (-1) 0.46 (0.13)** 0.38 (0.28) 0.5 (0.108)** DIRD 2.1E-5 (1.2E-5)** 1.9E-5 (1.1E-5)* 0.00011 (3.4E-5)** IRD (-1) 2.4E-6 (1.3E-5)** 8.6E-6 (1.4E-5) -1.2E-7 (2E-5) BDUM 0.0002 (0.0007) -0.02 (0.008)** 0.001 (0.0006)* CDUM -9.7E-6 (0.0003) 0.0006 (0.003) -4.2E-5 (0.0003) BDUM (-1) 0.0008 (0.0004)** 0.004 (0.009) 0.00036 (0.00036) CDUM (-1) -5.9E-6 (0.0003) -0.0027 (0.003) -5E-5 (0.0003)
Adjusted R2 0.49 0.49 0.53 SE 0.009 0.018 0.006 Observations 569 108 461 Countries 23 6 17
Key: DLY, change in log of real gross domestic product, DLIP change in log of real private fixed investment, IIY ratio of real inventory accumulation to GDP, DIRD change in the domestic money market interest rate, IRD level of the domestic money market rate, BDUM dummy for banking crisis, CDUM dummy for currency crisis
Table 19. Bank Lending Function Dependent variable: difference of bank lending/GDP Fixed effects, GLS, cross-section weights, White standard errors All EME OECD DLY 0.21 (0.028)** 0.13 (0.054)** 0.203 (0.032)** DLY (-1) 0.078 (0.024)** 0.045 (0.032) 0.077 (0.04)* BLY (-1) -0.47 (0.046)** -0.71 (0.117)** -0.38 (0.052)** DIRD 0.0014 (0.00016)** 0.0015 (9.8E-5)** 0.0017 (0.0004)** IRD (-1) 0.0008 (0.0003)** 0.0013 (0.00027)** 0.00022 (0.00027) BDUM -0.0084 (0.0036)** -0.019 (0.008)** -0.0016 (0.0032) CDUM -0.0015 (0.0025) -0.011 (0.0049)** 0.002 (0.0032) BDUM (-1) -0.0093 (0.0015)** -0.013 (0.0028)** -0.01 (0.0025)** CDUM (-1) -0.0039 (0.0011)** -0.0046 (0.0028)* -0.0057 (0.002)**
Adjusted R2 0.47 0.63 0.44 SE 0.025 0.032 0.019 Observations 362 120 242 Countries 23 6 17
Key: DLY, change in log of real gross domestic product, BLY ratio of flow of bank lending to companies to GDP, DIRD change in the domestic money market interest rate, IRD level of the domestic money market rate, BDUM dummy for banking crisis, CDUM dummy for currency crisis
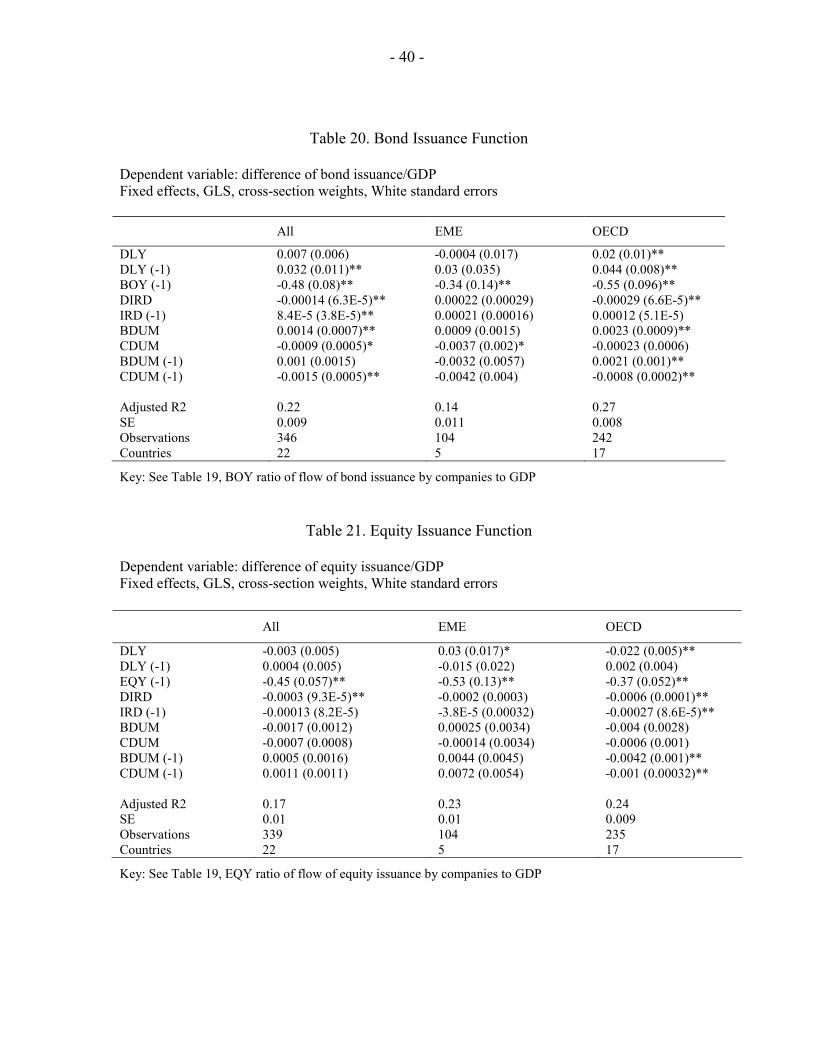
- 40 -
Table 20. Bond Issuance Function
Dependent variable: difference of bond issuance/GDP Fixed effects, GLS, cross-section weights, White standard errors All EME OECD
DLY 0.007 (0.006) -0.0004 (0.017) 0.02 (0.01)** DLY (-1) 0.032 (0.011)** 0.03 (0.035) 0.044 (0.008)** BOY (-1) -0.48 (0.08)** -0.34 (0.14)** -0.55 (0.096)** DIRD -0.00014 (6.3E-5)** 0.00022 (0.00029) -0.00029 (6.6E-5)** IRD (-1) 8.4E-5 (3.8E-5)** 0.00021 (0.00016) 0.00012 (5.1E-5) BDUM 0.0014 (0.0007)** 0.0009 (0.0015) 0.0023 (0.0009)** CDUM -0.0009 (0.0005)* -0.0037 (0.002)* -0.00023 (0.0006) BDUM (-1) 0.001 (0.0015) -0.0032 (0.0057) 0.0021 (0.001)** CDUM (-1) -0.0015 (0.0005)** -0.0042 (0.004) -0.0008 (0.0002)**
Adjusted R2 0.22 0.14 0.27 SE 0.009 0.011 0.008 Observations 346 104 242 Countries 22 5 17
Key: See Table 19, BOY ratio of flow of bond issuance by companies to GDP
Table 21. Equity Issuance Function
Dependent variable: difference of equity issuance/GDP Fixed effects, GLS, cross-section weights, White standard errors All EME OECD
DLY -0.003 (0.005) 0.03 (0.017)* -0.022 (0.005)** DLY (-1) 0.0004 (0.005) -0.015 (0.022) 0.002 (0.004) EQY (-1) -0.45 (0.057)** -0.53 (0.13)** -0.37 (0.052)** DIRD -0.0003 (9.3E-5)** -0.0002 (0.0003) -0.0006 (0.0001)** IRD (-1) -0.00013 (8.2E-5) -3.8E-5 (0.00032) -0.00027 (8.6E-5)** BDUM -0.0017 (0.0012) 0.00025 (0.0034) -0.004 (0.0028) CDUM -0.0007 (0.0008) -0.00014 (0.0034) -0.0006 (0.001) BDUM (-1) 0.0005 (0.0016) 0.0044 (0.0045) -0.0042 (0.001)** CDUM (-1) 0.0011 (0.0011) 0.0072 (0.0054) -0.001 (0.00032)**
Adjusted R2 0.17 0.23 0.24 SE 0.01 0.01 0.009 Observations 339 104 235 Countries 22 5 17
Key: See Table 19, EQY ratio of flow of equity issuance by companies to GDP
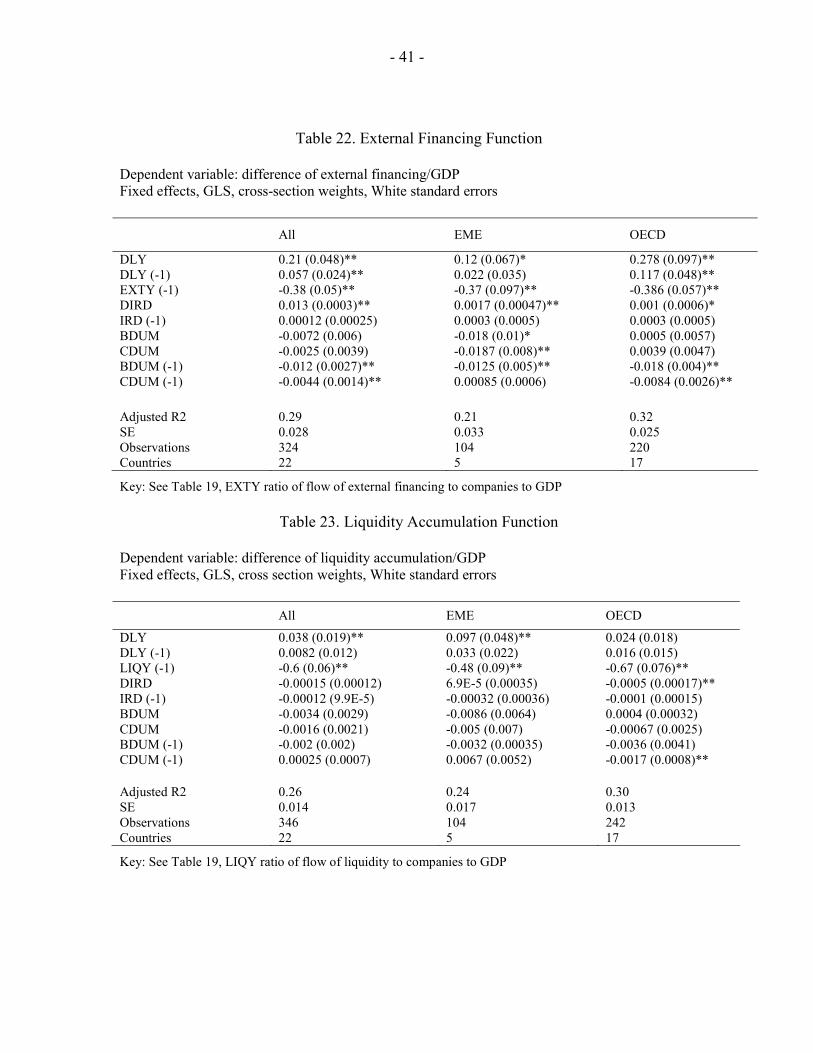
- 41 -
Table 22. External Financing Function
Dependent variable: difference of external financing/GDP Fixed effects, GLS, cross-section weights, White standard errors All EME OECD
DLY 0.21 (0.048)** 0.12 (0.067)* 0.278 (0.097)** DLY (-1) 0.057 (0.024)** 0.022 (0.035) 0.117 (0.048)** EXTY (-1) -0.38 (0.05)** -0.37 (0.097)** -0.386 (0.057)** DIRD 0.013 (0.0003)** 0.0017 (0.00047)** 0.001 (0.0006)* IRD (-1) 0.00012 (0.00025) 0.0003 (0.0005) 0.0003 (0.0005) BDUM -0.0072 (0.006) -0.018 (0.01)* 0.0005 (0.0057) CDUM -0.0025 (0.0039) -0.0187 (0.008)** 0.0039 (0.0047) BDUM (-1) -0.012 (0.0027)** -0.0125 (0.005)** -0.018 (0.004)** CDUM (-1) -0.0044 (0.0014)** 0.00085 (0.0006) -0.0084 (0.0026)**
Adjusted R2 0.29 0.21 0.32 SE 0.028 0.033 0.025 Observations 324 104 220 Countries 22 5 17
Key: See Table 19, EXTY ratio of flow of external financing to companies to GDP
Table 23. Liquidity Accumulation Function Dependent variable: difference of liquidity accumulation/GDP Fixed effects, GLS, cross section weights, White standard errors All EME OECD
DLY 0.038 (0.019)** 0.097 (0.048)** 0.024 (0.018) DLY (-1) 0.0082 (0.012) 0.033 (0.022) 0.016 (0.015) LIQY (-1) -0.6 (0.06)** -0.48 (0.09)** -0.67 (0.076)** DIRD -0.00015 (0.00012) 6.9E-5 (0.00035) -0.0005 (0.00017)** IRD (-1) -0.00012 (9.9E-5) -0.00032 (0.00036) -0.0001 (0.00015) BDUM -0.0034 (0.0029) -0.0086 (0.0064) 0.0004 (0.00032) CDUM -0.0016 (0.0021) -0.005 (0.007) -0.00067 (0.0025) BDUM (-1) -0.002 (0.002) -0.0032 (0.00035) -0.0036 (0.0041) CDUM (-1) 0.00025 (0.0007) 0.0067 (0.0052) -0.0017 (0.0008)**
Adjusted R2 0.26 0.24 0.30 SE 0.014 0.017 0.013 Observations 346 104 242 Countries 22 5 17
Key: See Table 19, LIQY ratio of flow of liquidity to companies to GDP
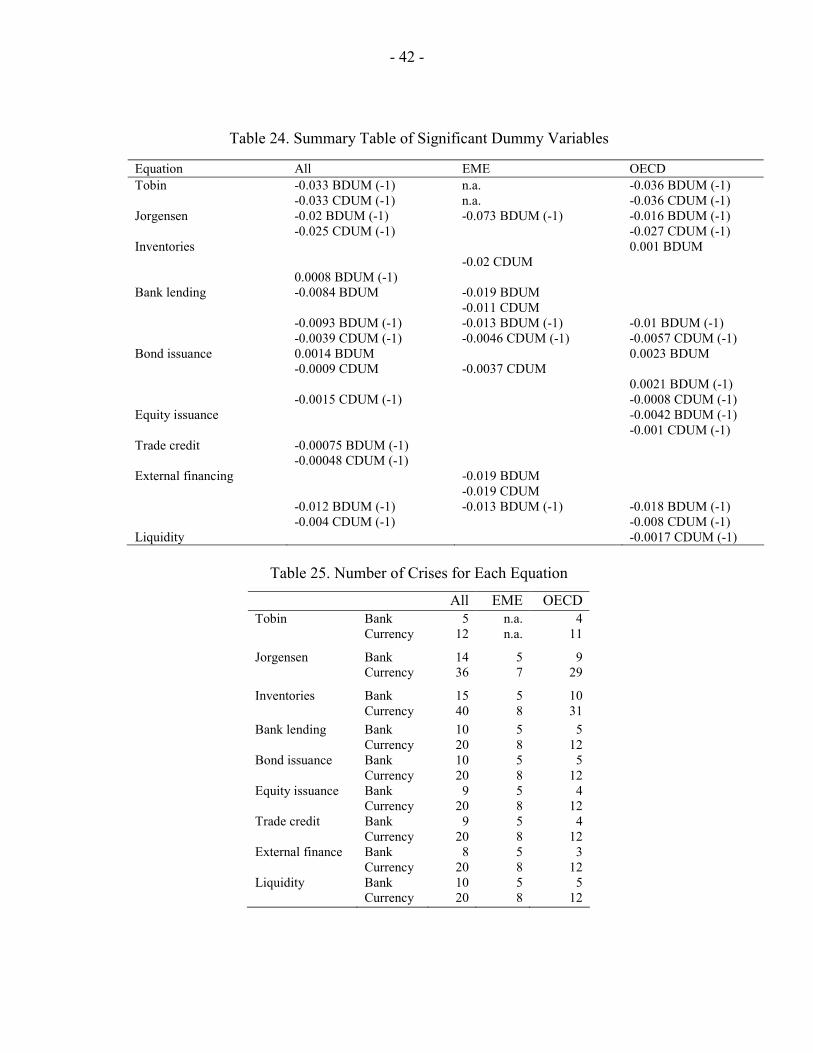
- 42 -
Table 24. Summary Table of Significant Dummy Variables
Equation All EME OECD Tobin -0.033 BDUM (-1) n.a. -0.036 BDUM (-1) -0.033 CDUM (-1) n.a. -0.036 CDUM (-1) Jorgensen -0.02 BDUM (-1) -0.073 BDUM (-1) -0.016 BDUM (-1) -0.025 CDUM (-1) -0.027 CDUM (-1) Inventories 0.001 BDUM -0.02 CDUM 0.0008 BDUM (-1) Bank lending -0.0084 BDUM -0.019 BDUM -0.011 CDUM -0.0093 BDUM (-1) -0.013 BDUM (-1) -0.01 BDUM (-1) -0.0039 CDUM (-1) -0.0046 CDUM (-1) -0.0057 CDUM (-1) Bond issuance 0.0014 BDUM 0.0023 BDUM -0.0009 CDUM -0.0037 CDUM 0.0021 BDUM (-1) -0.0015 CDUM (-1) -0.0008 CDUM (-1) Equity issuance -0.0042 BDUM (-1) -0.001 CDUM (-1) Trade credit -0.00075 BDUM (-1) -0.00048 CDUM (-1) External financing -0.019 BDUM -0.019 CDUM -0.012 BDUM (-1) -0.013 BDUM (-1) -0.018 BDUM (-1) -0.004 CDUM (-1) -0.008 CDUM (-1) Liquidity -0.0017 CDUM (-1)
Table 25. Number of Crises for Each Equation
All EME OECD Tobin Bank 5 n.a. 4 Currency 12 n.a. 11
Jorgensen Bank 14 5 9 Currency 36 7 29
Inventories Bank 15 5 10 Currency 40 8 31 Bank lending Bank 10 5 5 Currency 20 8 12 Bond issuance Bank 10 5 5 Currency 20 8 12 Equity issuance Bank 9 5 4 Currency 20 8 12 Trade credit Bank 9 5 4 Currency 20 8 12 External finance Bank 8 5 3 Currency 20 8 12 Liquidity Bank 10 5 5 Currency 20 8 12
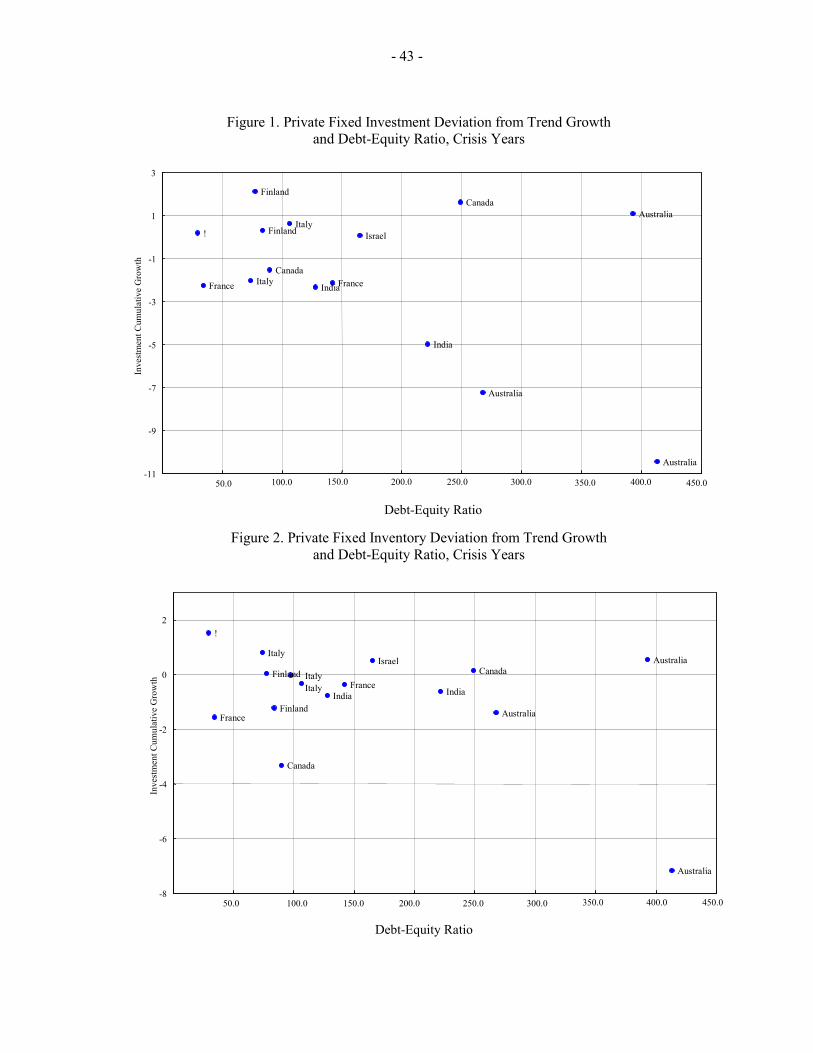
- 43 -
Figure 1. Private Fixed Investment Deviation from Trend Growth and Debt-Equity Ratio, Crisis Years
Figure 2. Private Fixed Inventory Deviation from Trend Growth
and Debt-Equity Ratio, Crisis Years
Australia
Australia
AustraliaCanada
Canada
Finland
Finland France
France India India
IsraelItaly
!
Italy Italy
-8
-6
-4
-2
0
2
50.0 100.0 150.0 200.0 250.0 300.0 350.0 400.0 450.0
Debt-Equity Ratio
Inve
stm
ent C
umul
ativ
e G
row
th
Australia
Australia
AustraliaCanada
Canada
Finland
Finland
FranceFrance India
India
Israel
Italy
! Italy
-11
-9
-7
-5
-3
-1
1
3
50.0 100.0 150.0 200.0 250.0 300.0 350.0 400.0
Debt-Equity Ratio
Inve
stm
ent C
umul
ativ
e G
row
th
450.0
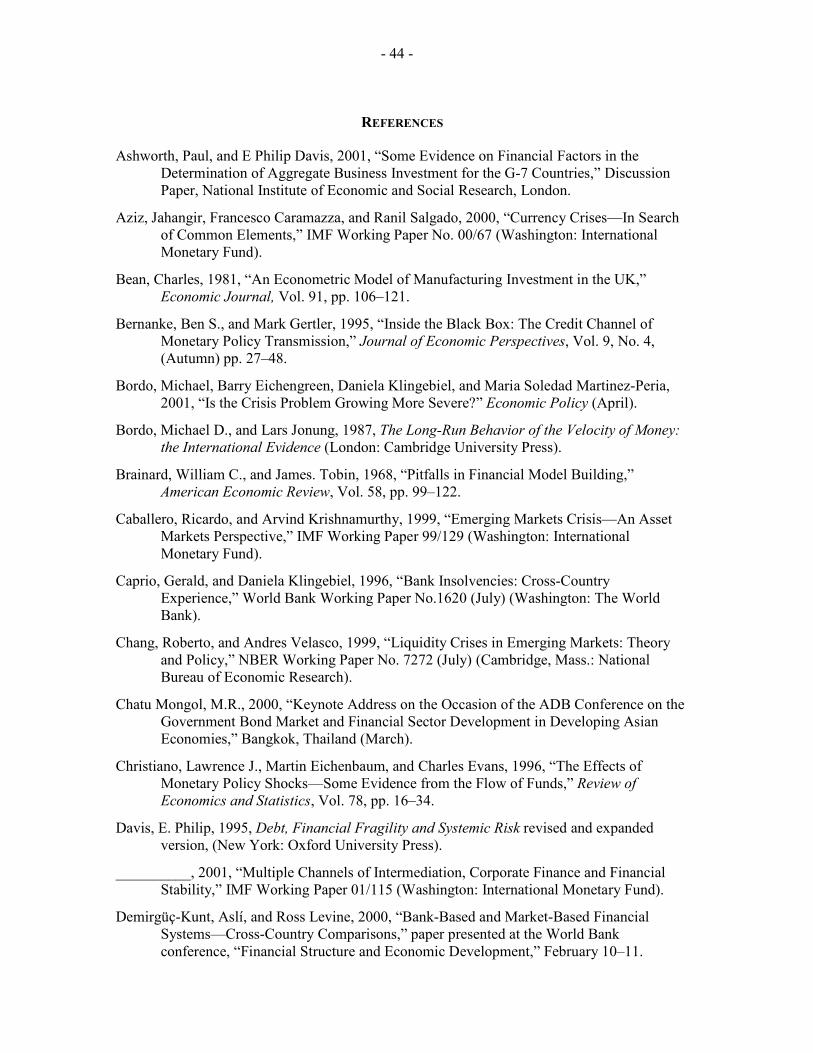
- 44 -
REFERENCES Ashworth, Paul, and E Philip Davis, 2001, “Some Evidence on Financial Factors in the
Determination of Aggregate Business Investment for the G-7 Countries,” Discussion Paper, National Institute of Economic and Social Research, London.
Aziz, Jahangir, Francesco Caramazza, and Ranil Salgado, 2000, “Currency Crises—In Search of Common Elements,” IMF Working Paper No. 00/67 (Washington: International Monetary Fund).
Bean, Charles, 1981, “An Econometric Model of Manufacturing Investment in the UK,” Economic Journal, Vol. 91, pp. 106–121.
Bernanke, Ben S., and Mark Gertler, 1995, “Inside the Black Box: The Credit Channel of Monetary Policy Transmission,” Journal of Economic Perspectives, Vol. 9, No. 4, (Autumn) pp. 27–48.
Bordo, Michael, Barry Eichengreen, Daniela Klingebiel, and Maria Soledad Martinez-Peria, 2001, “Is the Crisis Problem Growing More Severe?” Economic Policy (April).
Bordo, Michael D., and Lars Jonung, 1987, The Long-Run Behavior of the Velocity of Money: the International Evidence (London: Cambridge University Press).
Brainard, William C., and James. Tobin, 1968, “Pitfalls in Financial Model Building,” American Economic Review, Vol. 58, pp. 99–122.
Caballero, Ricardo, and Arvind Krishnamurthy, 1999, “Emerging Markets Crisis—An Asset Markets Perspective,” IMF Working Paper 99/129 (Washington: International Monetary Fund).
Caprio, Gerald, and Daniela Klingebiel, 1996, “Bank Insolvencies: Cross-Country Experience,” World Bank Working Paper No.1620 (July) (Washington: The World Bank).
Chang, Roberto, and Andres Velasco, 1999, “Liquidity Crises in Emerging Markets: Theory and Policy,” NBER Working Paper No. 7272 (July) (Cambridge, Mass.: National Bureau of Economic Research).
Chatu Mongol, M.R., 2000, “Keynote Address on the Occasion of the ADB Conference on the Government Bond Market and Financial Sector Development in Developing Asian Economies,” Bangkok, Thailand (March).
Christiano, Lawrence J., Martin Eichenbaum, and Charles Evans, 1996, “The Effects of Monetary Policy Shocks—Some Evidence from the Flow of Funds,” Review of Economics and Statistics, Vol. 78, pp. 16–34.
Davis, E. Philip, 1995, Debt, Financial Fragility and Systemic Risk revised and expanded version, (New York: Oxford University Press).
__________, 2001, “Multiple Channels of Intermediation, Corporate Finance and Financial Stability,” IMF Working Paper 01/115 (Washington: International Monetary Fund).
Demirgüç-Kunt, Aslí, and Ross Levine, 2000, “Bank-Based and Market-Based Financial Systems—Cross-Country Comparisons,” paper presented at the World Bank conference, “Financial Structure and Economic Development,” February 10–11.
- 45 -
Eichengreen, Barry, and Michael D. Bordo, 2002, “Crises Now and Then: What Lessons from the Last Era of Financial Globalization,” NBER Working Paper No. 8716 (January) (Cambridge, Mass.: National Bureau of Economic Research).
Fazzari, Steven, Glenn Hubbard, and Bruce Petersen, 1988, “Financing Constraints and Corporate Investment,” Brookings Papers on Economic Activity, Vol.1, pp.141–95.
Gertler, Mark, and Simon Gilchrist, 1992, “The Cyclical Behavior of Short-Term Business Lending—Implications for Financial Propagation Mechanisms” (unpublished).
———, 1994, “Monetary Policy, Business Cycles, and the Behavior of Small Manufacturing Firms,” Quarterly Journal of Economics, Vol. 59, pp. 309–40.
———, and Fabio Massimo Natalucci, 2000, “External Constraints on Monetary Policy and the Financial Accelerator,” NBER Working Paper No. 10128 (Cambridge, Massachusetts: National Bureau of Economic Research).
Gertler, Mark, and Glenn Hubbard, 1989, “Taxation, Corporate Capital Structure and Financial Distress,” NBER Working Paper No. 3202 (Cambridge, Massachusetts: National Bureau of Economic Research).
Goldfajn, Ilan, and Rodrigo O. Valdes, 1995, “Currency Crises and Collapses,” Brookings Papers on Economic Activity, June, No. 2, pp. 219–70.
Greenspan, Alan, 1999, “Do Efficient Financial Markets Mitigate Financial Crises?” A presentation to the 1999 Financial Markets Conference of the Federal Reserve Bank of Atlanta, October.
Hoggarth, Glenn, Roberto Reis, and Victoria Sapporta, 2001, “Costs of Banking System Instability, Some Empirical Evidence,” Journal of Banking & Finance, May, No. 5, pp. 825-860.
Honkapohja, Seppo, and Erkki Koskela, 1999, “The Economic Crisis of the 1990s in Finland,” Economic Policy, Vol.14, Issue 29, pp. 399–436.
Jorgensen, Dale, 1963, “Capital Theory and Investment Behavior,” American Economic Review, Vol. 53, pp.247–57.
Kaminsky, Graciela L., and Carmen M. Reinhart, 1999, “The Twin Crises: The Causes of Banking and Balance-of-Payments Problems,” American Economic Review, Vol. 89, No. 3, pp. 473–500.
Kim, Se-Jik, and Mark R. Stone, 1999, “Corporate Leverage and Output Adjustment in Post-Crisis East Asia,” IMF Working Paper No. 99/143 (Washington: International Monetary Fund).
King, Robert G., and Ross Levine, 1993, “Finance and Growth, Schumpeter Might be Right,” Quarterly Journal of Economics, Vol. 108, pp.713–37.
Kiyotaki, Nobuhiro, and John Moore, 1997, “Credit Cycles,” Journal of Political Economy (April).
Krugman, Paul, 1979, “A Model of Balance-of-Payments Crises,” Journal of Money, Credit and Banking (August) Vol. 11, No. 3, pp. 311–25.
- 46 -
Levine, Ross, 2000, “Bank-Based or Market-Based Financial Systems—Which Is Better?” paper presented at the World Bank conference, “Financial Structure and Economic Development,” Vols.10–11 (February).
———, and Sara Zervos, 1998, “Stock Markets, Growth and Economic Development, American Economic Review,” Vol. 88, pp.537–58.
Mishkin, Frederic S., 1997, “The Causes and Propagation of Financial Instability: Lessons for Policymakers,” in Maintaining Financial Stability in a Global Economy: A Symposium (Kansas City, Mo.: U.S. Federal Reserve Bank of Kansas City) August.
Modigliani, F. and M. Miller, 1958, “The Cost of Capital, Corporation Finance and the Theory of Investment,” American Economic Review, Vol. 48, pp. 261–97.
Mulder, Christian, Roberto Perrelli, and Manuel Rocha, 2001, “The Role of Corporate, Legal, and Macro Balance Sheet Indicators in Crisis Detection and Prevention” (unpublished; Washington: International Monetary Fund).
Obstfeld, Maurice, 1994, “Logic of currency crises,” NBER Working Paper No. 4640, (Cambridge, Massachusetts: National Bureau of Economic Research).
Rajan, Ragu, and Luigi Zingales, 1998, “Financial Dependence and Growth,” American Economic Review, Vol. 88, pp. 559–86.
Stone, Mark, 2000, “The Corporate Sector Dynamics of Systemic Financial Crises,” IMF Working Paper No. 00/114 (Washington: International Monetary Fund).
———, 2001, “Corporate Sector Policies to Enhance Financial Stability,” Banco de Guatemala’s “Tenth Cycle of Economic Lectures,” June.
———, and Melvyn Weeks, 2001, “The Role of Private Sector Balance Sheets in the Financial Crises of the 1990s,” (unpublished; Washington: International Monetary Fund).
Teplin, Albert M., 2001, “The U.S. Flow of Funds Accounts and Their Uses,” Federal Reserve Bulletin, July.
Tobin, James, 1969, “A General Equilibrium Approach to Monetary Theory,” Journal of Money, Credit and Banking, Vol. 1, pp.15–29.
Velasco, Andrés, 1987, “Financial Crises and Balance of Payments Crises: A Simple Model of the Southern Cone Experience,” Journal of Development Economics, October, Vol. 27 Nos. 1–2, pp. 263–83.
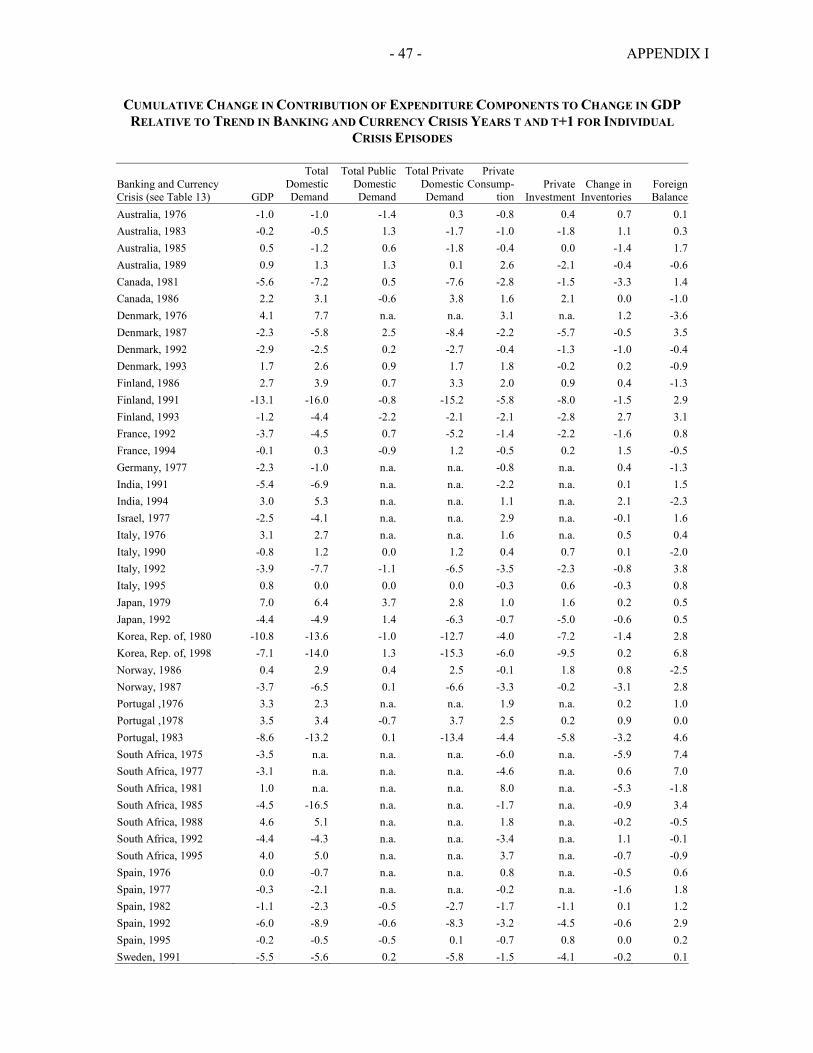
- 47 - APPENDIX I
CUMULATIVE CHANGE IN CONTRIBUTION OF EXPENDITURE COMPONENTS TO CHANGE IN GDP RELATIVE TO TREND IN BANKING AND CURRENCY CRISIS YEARS T AND T+1 FOR INDIVIDUAL
CRISIS EPISODES
Banking and Currency Crisis (see Table 13) GDP
Total Domestic Demand
Total Public Domestic Demand
Total Private Domestic Demand
PrivateConsump-
tionPrivate
Investment Change in
Inventories Foreign Balance
Australia, 1976 -1.0 -1.0 -1.4 0.3 -0.8 0.4 0.7 0.1Australia, 1983 -0.2 -0.5 1.3 -1.7 -1.0 -1.8 1.1 0.3Australia, 1985 0.5 -1.2 0.6 -1.8 -0.4 0.0 -1.4 1.7Australia, 1989 0.9 1.3 1.3 0.1 2.6 -2.1 -0.4 -0.6Canada, 1981 -5.6 -7.2 0.5 -7.6 -2.8 -1.5 -3.3 1.4Canada, 1986 2.2 3.1 -0.6 3.8 1.6 2.1 0.0 -1.0Denmark, 1976 4.1 7.7 n.a. n.a. 3.1 n.a. 1.2 -3.6Denmark, 1987 -2.3 -5.8 2.5 -8.4 -2.2 -5.7 -0.5 3.5Denmark, 1992 -2.9 -2.5 0.2 -2.7 -0.4 -1.3 -1.0 -0.4Denmark, 1993 1.7 2.6 0.9 1.7 1.8 -0.2 0.2 -0.9Finland, 1986 2.7 3.9 0.7 3.3 2.0 0.9 0.4 -1.3Finland, 1991 -13.1 -16.0 -0.8 -15.2 -5.8 -8.0 -1.5 2.9Finland, 1993 -1.2 -4.4 -2.2 -2.1 -2.1 -2.8 2.7 3.1France, 1992 -3.7 -4.5 0.7 -5.2 -1.4 -2.2 -1.6 0.8France, 1994 -0.1 0.3 -0.9 1.2 -0.5 0.2 1.5 -0.5Germany, 1977 -2.3 -1.0 n.a. n.a. -0.8 n.a. 0.4 -1.3India, 1991 -5.4 -6.9 n.a. n.a. -2.2 n.a. 0.1 1.5India, 1994 3.0 5.3 n.a. n.a. 1.1 n.a. 2.1 -2.3Israel, 1977 -2.5 -4.1 n.a. n.a. 2.9 n.a. -0.1 1.6Italy, 1976 3.1 2.7 n.a. n.a. 1.6 n.a. 0.5 0.4Italy, 1990 -0.8 1.2 0.0 1.2 0.4 0.7 0.1 -2.0Italy, 1992 -3.9 -7.7 -1.1 -6.5 -3.5 -2.3 -0.8 3.8Italy, 1995 0.8 0.0 0.0 0.0 -0.3 0.6 -0.3 0.8Japan, 1979 7.0 6.4 3.7 2.8 1.0 1.6 0.2 0.5Japan, 1992 -4.4 -4.9 1.4 -6.3 -0.7 -5.0 -0.6 0.5Korea, Rep. of, 1980 -10.8 -13.6 -1.0 -12.7 -4.0 -7.2 -1.4 2.8Korea, Rep. of, 1998 -7.1 -14.0 1.3 -15.3 -6.0 -9.5 0.2 6.8Norway, 1986 0.4 2.9 0.4 2.5 -0.1 1.8 0.8 -2.5Norway, 1987 -3.7 -6.5 0.1 -6.6 -3.3 -0.2 -3.1 2.8Portugal ,1976 3.3 2.3 n.a. n.a. 1.9 n.a. 0.2 1.0Portugal ,1978 3.5 3.4 -0.7 3.7 2.5 0.2 0.9 0.0Portugal, 1983 -8.6 -13.2 0.1 -13.4 -4.4 -5.8 -3.2 4.6South Africa, 1975 -3.5 n.a. n.a. n.a. -6.0 n.a. -5.9 7.4South Africa, 1977 -3.1 n.a. n.a. n.a. -4.6 n.a. 0.6 7.0South Africa, 1981 1.0 n.a. n.a. n.a. 8.0 n.a. -5.3 -1.8South Africa, 1985 -4.5 -16.5 n.a. n.a. -1.7 n.a. -0.9 3.4South Africa, 1988 4.6 5.1 n.a. n.a. 1.8 n.a. -0.2 -0.5South Africa, 1992 -4.4 -4.3 n.a. n.a. -3.4 n.a. 1.1 -0.1South Africa, 1995 4.0 5.0 n.a. n.a. 3.7 n.a. -0.7 -0.9Spain, 1976 0.0 -0.7 n.a. n.a. 0.8 n.a. -0.5 0.6Spain, 1977 -0.3 -2.1 n.a. n.a. -0.2 n.a. -1.6 1.8Spain, 1982 -1.1 -2.3 -0.5 -2.7 -1.7 -1.1 0.1 1.2Spain, 1992 -6.0 -8.9 -0.6 -8.3 -3.2 -4.5 -0.6 2.9Spain, 1995 -0.2 -0.5 -0.5 0.1 -0.7 0.8 0.0 0.2Sweden, 1991 -5.5 -5.6 0.2 -5.8 -1.5 -4.1 -0.2 0.1
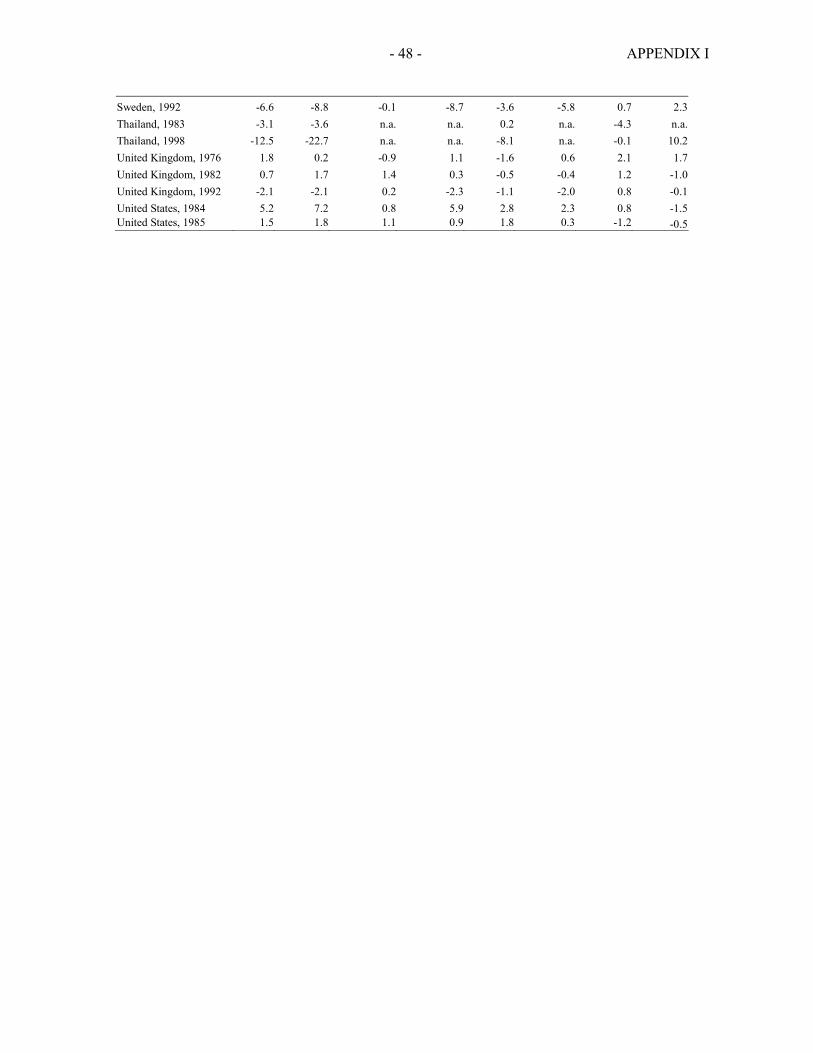
- 48 - APPENDIX I
Sweden, 1992 -6.6 -8.8 -0.1 -8.7 -3.6 -5.8 0.7 2.3Thailand, 1983 -3.1 -3.6 n.a. n.a. 0.2 n.a. -4.3 n.a.Thailand, 1998 -12.5 -22.7 n.a. n.a. -8.1 n.a. -0.1 10.2United Kingdom, 1976 1.8 0.2 -0.9 1.1 -1.6 0.6 2.1 1.7United Kingdom, 1982 0.7 1.7 1.4 0.3 -0.5 -0.4 1.2 -1.0United Kingdom, 1992 -2.1 -2.1 0.2 -2.3 -1.1 -2.0 0.8 -0.1United States, 1984 5.2 7.2 0.8 5.9 2.8 2.3 0.8 -1.5United States, 1985 1.5 1.8 1.1 0.9 1.8 0.3 -1.2 -0.5
Related Documents