Corporate Financial Planning Directed by John R. Graham D. Richard Mead Jr. Family Professor of Finance Fuqua School of Business, Duke University Data from around the world are used in this report. Results are presented from a North American (US + Canada) perspective. To save space in the report, at times “US” is used as shorthand for “North America” because more than 90% of North American responses are from the US. A joint survey project between Duke University, CFO Magazine, and NYSE

Welcome message from author
This document is posted to help you gain knowledge. Please leave a comment to let me know what you think about it! Share it to your friends and learn new things together.
Transcript

Corporate Financial Planning
Directed by John R. GrahamD. Richard Mead Jr. Family Professor of Finance
Fuqua School of Business, Duke University
Data from around the world are used in this report. Results are presented from a North American (US + Canada) perspective. To save space in the report, at times “US” is used as shorthand for “North America” because more than 90% of North American responses are from the US.
A joint survey project between
Duke University, CFOMagazine, and NYSE

2
CFO Optimism Q1 20191
High vs. Low Revenue Projections2
Capital Structure3
Liquidity4
Page 3
Page 4
Page 6
Page 12
Corporate Financial Planning5
Investment, Hurdle Rates, Cost of Capital6
Key results CFO Survey7
Demographics, Survey Details8
Page 13
Page 17
Page 21
Page 22

-13%
2008 2009 2010 2011 2012 2013 2014 2015 2016 2017 2018 2019
24%
More optimistic about
economic outlook, with 37%
more pessimistic
48%
More optimistic about
company’s financial
outlook, with 22% more
pessimistic
3
US CFO’s “growing more optimistic” minus “growing more pessimistic” (QoQ)
Percentage of optimists –- percentage of pessimists w.r.t. economy
CFO optimism Q1 2019
Economic optimism among CFOs
The charts below and to the right indicate that a higher proportion of US CFOs are growing pessimistic
about the US economy (37%), relative to those growing more optimistic (24%).
In a separate question not reflected in these charts, CFOs around the world rate their optimism about
the economic outlook for their own countries on a scale from 0 to 100. In Q1 2019, US CFOs rated their
optimism at 64, which is higher than the long-run average CFO Optimism Index of 60. While high by
historic standards, optimism has declined from 71 one year ago. The Optimism Index is slightly higher
in Latin America (65 out of 100) and in Asia (65). Optimism is lower in Europe (60) and in Africa (55).

4
Very bad scenario: There is a 1-in-10 chance that in 2019 revenue growth will be less than:
Best Guess: CFOs expect 2019 revenue growth will be:
Very good scenario: There is a 1-in-10 chance that in 2019 revenue growth will be greater than:
Percentage of CFOs expecting revenues to increase during 2019
Percentage of CFOs expecting revenues to decrease during 2019
2,4%
13,9%
21,6%
North America 85.5% 8.6%
2,4%
13,1%
23,4%
Europe 79.8% 12.8%
8,1%
35,8% 37,1%
Africa 90.9% 9.1%
5,9%
20,0%
32,2%
Asia 91% 6.6%
8,1%
24,1%
39,5%
Latin America 89.3% 5.1%
CFOs’ revenue growth outlook for 2019
85.5% of US financial executives expect company revenues to increase during 2019.
Approximately 9 out of 10 CFOs anticipate an increase in revenues in Africa, Asia, and
Latin America. Only 8 out of 10 of European CFOs expect revenue to increase.
In their ‘base case’, US CFOs expect revenue to increase by 13.9% in 2019. In their ‘very
bad’ planning scenarios, CFOs expect revenue growth of just 2.4%. In their ‘very good’
scenarios, revenue will grow by 21.6%.

Revenue Growth Estimates by Region; by Industry
-10
0
10
20
30
40
50
US Europe Asia Latam Africa Retail Finance Service Tech Manu Healthcare
REV
ENU
E G
RO
WTH
Good Scenario (top) Bad Scenario (bottom) Best Guess
The top of each line shows the “very good” revenue projection.
The bottom of each line shows the “very bad” revenue projection.
The dot on the line shows the “best guess” revenue estimate.
North AmericanIndustries
5
Euro
pe. 7
4%
Euro
pe. 4
4%
Euro
pe. 1
3%
Euro
pe. 1
2%
Euro
pe. 1
2%
Euro
pe. 1
1%
Euro
pe. 8
%
Euro
pe. 6
%
Euro
pe. 1
%
Nort
h Am
eric
a. 3
3%
Nort
h Am
eric
a. 3
9%
Nort
h Am
eric
a. 12
%
Nort
h Am
eric
a. 8
%
Nort
h Am
eric
a. 10
%
Nort
h Am
eric
a. 10
%
Nort
h Am
eric
a. 2
%
Nort
h Am
eric
a. 6
%
Nort
h Am
eric
a. 6
%
Latin
Am
eric
a, 6
5%
Latin
Am
eric
a, 4
4%
Latin
Am
eric
a, 18
%
Latin
Am
eric
a, 10
%
Latin
Am
eric
a, 18
%
Latin
Am
eric
a, 19
%
Latin
Am
eric
a, 5
%
Latin
Am
eric
a, 10
%
Latin
Am
eric
a, 5
%
Asia
. 71%
Asia
. 37%
Asia
. 26%
Asia
. 21%
Asia
. 11%
Asia
. 13%
Asia
. 14%
Asia
. 13%
Asia
. 10%
Afri
ca. 5
4%
Afri
ca. 3
9%
Afri
ca. 2
3%
Afri
ca. 1
9%
Afri
ca. 2
3%
Afri
ca. 1
2%
Afri
ca. 1
5%
Afri
ca. 8
%
Afri
ca. 1
9%
BANK LOAN DRAW ON LINE OF CREDIT BOND COMMON STOCK OTHER NON-BANK LOAN CONVERTIBLE DEBT COMMERCIAL PAPER PREFERRED STOCK
6
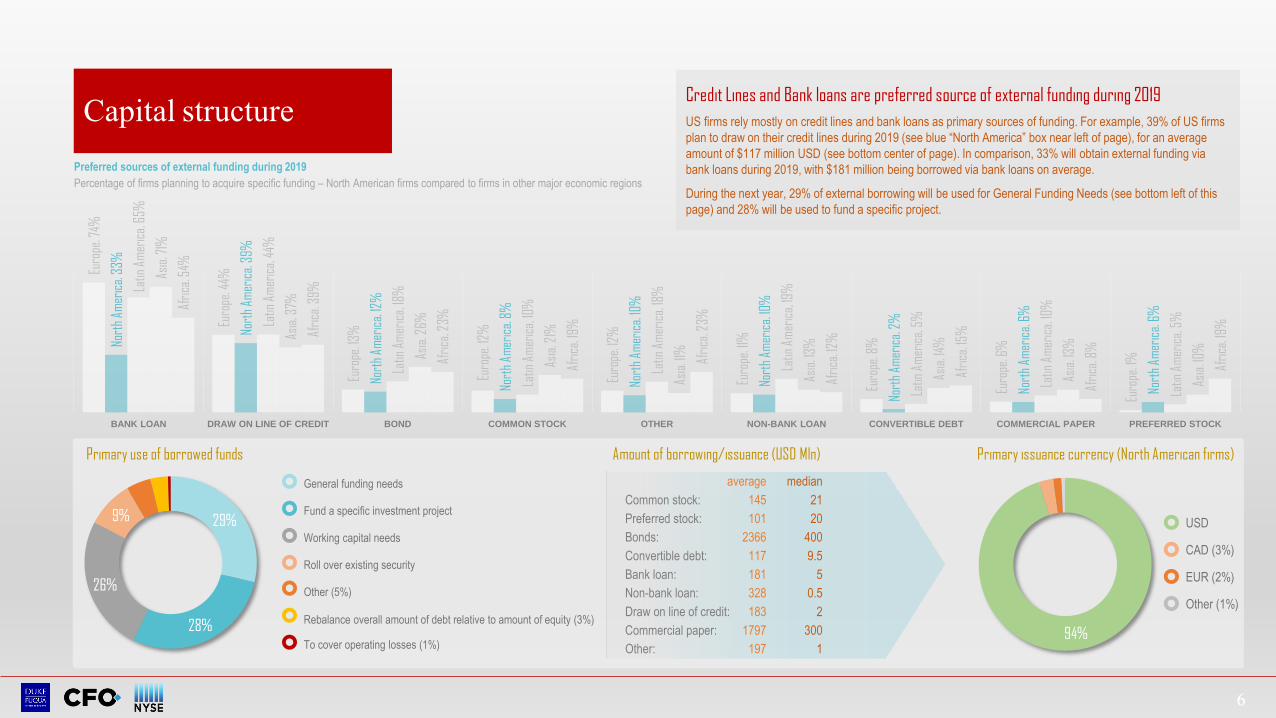
Preferred sources of external funding during 2019
Percentage of firms planning to acquire specific funding – North American firms compared to firms in other major economic regions
29%
28%
26%
9% Fund a specific investment project
General funding needs
Working capital needs
Roll over existing security
Other (5%)
Rebalance overall amount of debt relative to amount of equity (3%)
To cover operating losses (1%)
Primary use of borrowed funds
average median
Common stock: 145 21
Preferred stock: 101 20
Bonds: 2366 400
Convertible debt: 117 9.5
Bank loan: 181 5
Non-bank loan: 328 0.5
Draw on line of credit: 183 2
Commercial paper: 1797 300
Other: 197 1
Amount of borrowing/issuance (USD Mln)
CAD (3%)
USD
EUR (2%)
Other (1%)
94%
Primary issuance currency (North American firms)
Credit Lines and Bank loans are preferred source of external funding during 2019
US firms rely mostly on credit lines and bank loans as primary sources of funding. For example, 39% of US firms
plan to draw on their credit lines during 2019 (see blue “North America” box near left of page), for an average
amount of $117 million USD (see bottom center of page). In comparison, 33% will obtain external funding via
bank loans during 2019, with $181 million being borrowed via bank loans on average.
During the next year, 29% of external borrowing will be used for General Funding Needs (see bottom left of this
page) and 28% will be used to fund a specific project.
Capital structure

How Do US Firms Measure Leverage (their “Debt Ratio”)? Nearly 45% of US firms say that Debt/EBITDA is their primary measure of leverage, and approximately two-thirds say Debt/EBITDA is one of their top 3 measures of leverage (see bottom row).
0% 10% 20% 30% 40% 50% 60% 70%
Debt/EBITDA
Credit Rating
Interest Coverage
Debt/Asset
Debt/Value
Liability/Asset
Debt/Equity
Top 1
Top 2
Top 3
7

Do US Companies Have a “Target” Debt Ratio?
Strict Target/Range16%
Somewhat Tight Target/Range
30%
Flexible Target/Range27%
No Target/Range28%
8

Upper/Lower Limit Acceptable Debt Ratios (Debt/EBITDA)
The typical US firm currently has Debt/EBITDA = 3.4. CFOs say their firms would take action if the ratio increased to 4.1 or higher, and move Debt/EBITDA back into an acceptable range within 1.6 years.
We set a upper limit
Yes No
We set a lower limit
Yes No
We set a timetable to bring down debt ratio
Yes No
Average Upper Limit:
4.1
Average years to reduce debt ratio to accept. range
1.6 years
Average Lower Limit:
1.9
We set a timetable to bring up debt ratio
Yes No
Average years to increase debt
ratio
0.9 years
Current Debt/EBITDA
3.4
9

We set a upper limit
Yes No
We set a lower limit
Yes No
We set a timetable to bring down debt ratio
Yes No
Average Upper Limit:
40.3%
Average years to reduce debt ratio to accept. range
1.5 years
Average Lower Limit:
18.1%
We set a timetable to bring up debt ratio
Yes No
Average years to increase debt
ratio
1.2 years
Current Debt/Asset
26%
Upper/Lower Limit Acceptable Debt Ratios (Debt/Assets)The typical US firm currently has Debt/Assets = 26%.
CFOs say their firms would take action if Debt/Assets rose to 40.3%.
10

Which Factors Affect How Much Debt Firms Use?
11
85% of CFOs say that preserving financial flexibility is an important or very important consideration as they decide how much debt to use. Flexibility is the most popular answer, as reflected in the dark and medium dark blue bars in the bottom row. Credit ratings are the second most popular debt factor.
0% 20% 40% 60% 80% 100%
Maintaining financial flexibility
Our credit rating (as assigned by rating agencies)
The level of interest rates
The volatility of our earnings and cash flows
Insufficient internal funds
The debt levels of other firms in our industry
The transaction costs and fees for issuing debt
Equity undervaluation/overvaluation
The amount collateral against which we can borrow
The tax advantage of interest deductibility
5=Very Important 4=Important 3=Moderate Importance

Asia average median
Current: Cash-to-Total Assets ratio: 20.55% 15%
Current: Long-term borrowing interest rate: 6.03% 6%
Year-end forecast: Long term borrowing interest rate: 6.35% 6%
12
Latin America average median
Current: Cash-to-Total Assets ratio: 18.38% 10%
Current: Long-term borrowing interest rate: 7.99% 7.45%
Year-end forecast: Long term borrowing interest rate: 7.58% 7%
Europe average median
Current: Cash-to-Total Assets ratio: 13.69% 10%
Current: Long-term borrowing interest rate: 2.83% 2%
Year-end forecast: Long term borrowing interest rate: 2.63% 2%
North America average median
Current: Cash-to-Total Assets ratio: 17.04% 10%
Current: Long-term borrowing interest rate: 4.84% 4.45%
Year-end forecast: Long term borrowing interest rate: 5.19% 5%
Africa average median
Current: Cash-to-Total Assets ratio: 32.88% 20.50%
Current: Long-term borrowing interest rate: 12.02% 10.25%
Year-end forecast: Long term borrowing interest rate: 12.30% 10.88%
Some (7%)
A little (10%)
Moderate (33%)
Sufficient (26%)
A lot (22%)
48%
of CFOs say firm has
(sufficient to a lot) financial
flexibility
11%
22%
30%
37%
42%
58%
62%
Preserve unused line of credit capacity
Ability to avoid financial distress during economic downturns
Ability to quickly pursue attractive investment opportunities
Access to long-term debt markets
Access to short-term funding (e.g. commercial paper, short-term debt)
Maintain large cash balance
Access to equity marketEur
opea
n C
FO
s st
ate
mos
t im
port
ant
aspe
cts
of m
aint
aini
ng fi
nanc
ial f
lexi
bilit
yFinancial flexibility and the cost of debt
As indicated on the previous slide, preserving financial flexibility is a key
objective of US companies. In explaining the primary goals of preserving
financial flexibility, the chart on the far right indicates that 62% of firms
say that they want to avoid distress should a downturn occur, and 58%
indicate they want to be able to quickly pursue investments. As to their
current situation, 48% of companies say they currently have ‘sufficient’ or
‘a lot’ of financial flexibility.
In the charts below, North American firms believe their cost of long-term
debt will increase from an average rate of 4.84% currently to 5.19% at
year-end 2019.

Corporate financial planning
13
% of firms that perform
scenario analysis
% of firms that do not
perform scenario analysis
23%
77%
Do you perform scenario analysis when making plans for the
overall company (e,g, your 5-year plan). How many scenarios?
Economic indicators that CFOs consider to be most important in affecting the
performance of their own firms (% that rank factor in the Top 3)
4%
12%
13%
18%
19%
20%
20%
29%
31%
38%
47%GDP growth (country level)
Consumer spending
Commodity prices
Interest rates
GDP growth (global)
Other (e.g. spending on defense,
natural disasters, price wars, etc.)
International trade (tariffs)
Infrastructure spending
Currency exchange rates
Defense spending
Inflation
Scenario analysis and corporate
performanceThe circle chart to the left shows that 77% of companies
conduct scenario analysis. Among these firms, the mean
number of scenarios considered is 3 when planning for
their overall company.
The green shape in the pentagon at the bottom of the
page shows that companies tilt towards considering
downside scenarios more so than upside scenarios. In
particular, 66% of companies consider downside
scenarios and 20% consider extreme downside. In
comparison, only 59% consider upside and 4% consider
extreme upside scenarios.
The chart at the far left summarizes the importance of
various economic variables in determining whether a firm
experiences downside or upside outcomes in their actual
performance. 47% of companies indicate that country
GDP growth is one of the “Top 3” economic indicators to
determine their company’s actual performance, and 38%
indicate consumer spending is similarly important.
3
the average number of
scenarios being considered in
the company planning cycle
Downside
Base caseUpside
Extreme upside
Extreme downside
20%66%
88%59%
4%
Scenarios receiving most of the company’s attention in
scenario planning

Downside, Base Case, and Upside Scenario Planning
14
-10
-5
0
5
10
15
20
25
30
Extreme Downside Downside Base Upside Extreme Upside
Revenue Growth Profit Margin Capex Growth Cash
For each of 5 scenarios, what will revenue growth, profits, capital spending, and cash holdings be during 2019?

15
Company growth
In the chart to the right, North American companies say that on average, 17%
of current revenues are generated by new products (i.e., products that did not
exist 4 years ago). This percentage is lower than the impact of new products
on revenues in the rest of the world.
In an indication that business executives are very optimistic about their own
firms’ prospects relative to peer firms, 50% of North American companies say
their own firm will outperform their peers, and only 6% say they will
underperform their peers. Similarly, more than half of CFOs in other parts of
the world expect to outperform their peers.
6%
43%50%
NORTH AMERICA
4%
40%
55%
EUROPE
6% 27%
67%
LATIN AMERICA
5%16%
79%
AFRICA
6%
43%51%
ASIA
Compared to other firms in the industry, company growth over the next three years will be slower
Compared to other firms in the industry, company growth over the next three years will be the same
Compared to other firms in the industry, company growth over the next three years will be faster
New product development% of current sales revenue coming from new products (that did not exist 4 years ago)
Europe North America Latin America Africa Asia
23% 17% 22% 24% 30%

16
58%
of US CFOs expect the firm
to increase hiring of full
time employees, while 11%expect to downsize the labor
force
92%
of US CFOs expect the firm
to increase wages and
salaries during 2019, while
3% expects to reduce pay
levels
Hiring, wages, and corporate investment
In the chart immediately to the left, employment growth at North American
firms is expected to stay moderately strong over the next 12 months (2%),
down somewhat from expectations 6 or 12 months ago. Other parts of the
world expect 1% to 2% employment growth. The chart on the far upper
left indicates that 58% of North American firms expect to increase their
number of fulltime employees (versus 11% that expect to reduce
workforce).
The chart in the middle indicates that North American firms expect wages
to grow by 3% over the next 12 months, lower than the 4% to 6% growth
expected in Africa, Asia, and Latin America. Wage growth will be smallest
in Europe.
The chart at the bottom shows a rebound in capital spending growth, with
US companies expecting capital expenditures (CAPEX) to increase by 5%
over the next 12 months.
62%
of US CFOs plan to
increase capital spending
during 2019, while 16%expects to reduce CAPEX
5,00%
-5%
0%
5%
10%
15%
Mar 2018 Jun 2018 Sept 2018 Dec 2018 Mar 2019
United States
Europe
Asia
Latin America
Africa
2,00%
0%
2%
4%
6%
Mar 2018 Jun 2018 Sept 2018 Dec 2018 Mar 2019
3,00%
0%
2%
4%
6%
8%
10%
Mar 2018 Jun 2018 Sept 2018 Dec 2018 Mar 2019
Full-time employment growth rate
Growth in wages/salaries
Capital Spending growth rate

Hurdle Rate Versus the Cost of CapitalUS companies on average require a hurdle rate of 14%, meaning that an investment must earn at least 14% to be pursued. By comparison, the weighted average cost of capital (WACC) averages 9.6% in the US. The right part of the chart lists the reasons that firms provide to explain why they require a hurdle rate 4% to 5% higher than their WACC.
0% 10% 20% 30% 40% 50%
So that we choose only the best available projects
So that we choose projects that are profitable
To account for riskiness of the projects being evaluated
So that we choose projects that pay back the initial investmentquickly
To provide a margin of error in calculations and assumptions
To provide a buffer in case the project underperforms
To limit the number of projects that are approved – because we facefunding constraints
To limit the number of projects that are approved – because ofscarcity of managerial time / expertiseAverage WACC
9.6
Average Hurdle
Rate
14.0
Percentage of CFOs who list a given explanation among their “Top 4” explanations
17

9,6
12,410,92
12,25
14,4514 13,7512,69
15,79
21,56
0
5
10
15
20
25
US Europe Asia Latin America Africa
WACC Hurdle Rate
Hurdle Rate Versus the Cost of Capital, by Region
18

How Frequently Do You Change Hurdle Rates?
Over the past 10 years, 45% of US companies did not change their hurdle rate (by at least 1 percentage point), and 60% changed their hurdle rate zero or one times.
0%
10%
20%
30%
40%
50%
60%
70%
80%
90%
100%
US Europe Asia Latam Africa
0 1 2 3 4 5 6+ times
19

How Flexible are Investment Plans?The two shaded regions at the top of the leftmost bar indicate that 35% of US firms say that the start date of their largest capital spending project (CapX) is flexible or very flexible. European investment start dates and speed of completion are less flexible than in the US.
0%
10%
20%
30%
40%
50%
60%
70%
80%
90%
100%
US Europe Asia LatinAmerica
Africa US Europe Asia LatinAmerica
Africa
Very flexible
Flexible
Somewhat flexible
Somewhat inflexible
Inflexible
Very inflexible
How flexible is the start date of your largest CapX project?
How flexible is the speed at which you complete this largest CapX project?
20

21
Key Results CFO SurveyUS, Europe, Latin America, Africa and Asia
EUROPE UNITED STATES LATIN AMERICA AFRICA ASIA
Economic sentiment
CFOs More optimistic 26.2% 24.1% 65.8% 50.0% 47.4%
CFOs Less optimistic 38.3% 36.8% 13.1% 35.7% 29.6%
No change 35.5% 39.1% 21.0% 14.3% 23.0%
Own country optimism level 59.5 64.6 65.4 54.8 64.9
Employment – full-time 1.8% 4.6% 5.4% 4.9% 3.0%
Inflation (own-firm products) n/a n/a n/a n/a n/a
Financial outlook own company
CFOs More optimistic 42.4% 48.3% 68.4% 66.7% 60.7%
CFOs Less optimistic 25.1% 36.8% 23.9% 31.0% 19.3%
No change 32.5% 39.1% 17.8% 2.4% 20.0%
Own company optimism level 67.5 70.4 70.8 63.8 69.6
Revenue growth 3.5% 6.3% 12.5% 9.8% 10.4%
Earnings growth n/a n/a n/a n/a n/a
Business spending
Capital spending 8.5% 8.2% 10.0% 16.4% 11.0%
Technology spending n/a n/a n/a n/a n/a
R&D spending n/a n/a n/a n/a n/a
Advertising and marketing spending n/a n/a n/a n/a n/a
Wages and Salaries 2.9% 5.1% 5.5% 5.7% 6.1%
Health Care Costs n/a n/a n/a n/a n/a
NOTE: this special edition survey did not cover all of the standard survey questions we usually ask each quarter (see www.cfosurvey.org for past results). Key results indicated by n/a were omitted from the special edition survey.

CFO Survey – Industry Breakdown, North America
Manufacturing21%
Banking/Finance/Insurance/Real Estate
18%
Services, Consulting13%
Technology[Software/Hardware/Biotech]
12%
Retail/Wholesale9%
Healthcare/Pharmaceutical9%
Energy7%
Communication/Media4%
Mining/Construction3%
Transportation & Public Utilities
2%
Agriculture, Forestry, & Fishing
1%Public Administration
1%
22

CFO Survey North America
The Global Business Outlook is conducted every quarter jointly by Duke University and CFO Magazine. The
NYSE also patterned on the 2019 Q1 special project. The logos of many global partners appear below.
This Special Survey Edition – Corporate Financial Planning
The Special Survey Edition of CFO Survey aims to document best practices in corporate financial planning and
capital allocation around the globe. The goal is to understand how companies make financial planning decisions
dynamically; that is, how companies adapt and adjust to economic conditions that are constantly changing.
Therefore, another Special Edition will conducted one year from now (Q1 2020).
Note on methodology
The figures quoted in this report are taken from the Global Business Outlook CFO survey for the first quarter of 2019.
The survey concluded March 7, 2019 in most regions. Every quarter, CFOs in Europe, the US, Latin America, Asia, and
Africa are polled about their economic expectations. Current quarterly records go back more than 21 years. The latest
survey generated responses from nearly 1,500 CFOs, including 469 from North America, 145 from Asia, 261 from
Europe, 590 from Latin America and 42 from Africa.
The Global Business Outlook covers a wide range of companies (public and private, small and large, many industries,
etc.). The responses are representative of the population of CFOs that are surveyed. Among the industries represented
in the survey are retail/wholesale, mining/construction, manufacturing, transportation/energy, communications/media,
technology, service/consulting and banking/finance/insurance.
The average growth rates reported are weighted by revenues or number of employees. For example, one $5 billion
company affects on average as much as 10 $500-million firms would. Revenue-weighted mean growth rates are
provided for earnings, revenues, capital spending, technology spending and prices of products. Employee-weighted
mean growth rates are used for health care costs, productivity, number of employees and outsourced employment.
Unless noted, the numbers are for all companies, including private companies.
23
About the Global Business OutlookThe Special Corporate Financial Planning Survey
Related Documents