Corporate Entrepreneurship Behaviour in a South African financial Services Organisation. Student Name: Mogomotsi Mogopodi Student number: 515618 Supervisor Name: Lawrence Beder A research report submitted to the Faculty of Commerce, Law and Management, University of the Witwatersrand, in partial fulfilment of the requirements for the degree of Master of Management specialising in Entrepreneurship and New Venture Creation March, 2015 brought to you by CORE View metadata, citation and similar papers at core.ac.uk provided by Wits Institutional Repository on DSPACE

Welcome message from author
This document is posted to help you gain knowledge. Please leave a comment to let me know what you think about it! Share it to your friends and learn new things together.
Transcript
Corporate Entrepreneurship Behaviour in a South African financial
Services Organisation.
Student Name: Mogomotsi Mogopodi
Student number: 515618
Supervisor Name: Lawrence Beder
A research report submitted to the Faculty of Commerce, Law and
Management, University of the Witwatersrand, in partial fulfilment of the
requirements for the degree of Master of Management specialising in
Entrepreneurship and New Venture Creation
March, 2015
brought to you by COREView metadata, citation and similar papers at core.ac.uk
provided by Wits Institutional Repository on DSPACE

ii
ABSTRACT
Purpose
The purpose of this study is to assess corporate entrepreneurship behaviour
and identify elements that influence and promote corporate entrepreneurship in
a South African financial services organisation. The study also defines
corporate entrepreneurship and assists in gaining an understanding of
corporate entrepreneurship behaviour in a context of a financial services
organisation in the South African financial services sector.
Data collection
Online questionnaires were used to collect data. The online questionnaire was
sent out to via email to employees at different hierarchal levels of a financial
services organisation. The email contained a link which directed the participants
to the online survey. Completed responses were sent back to a centralised
system for collation with only one response per computer possible.
Key findings
The key findings of the study elucidate corporate entrepreneurship in a financial
services organisation as not perceived as demonstrated and or used. There is a
neutral sentiment towards CE which is widespread across the organisation
regardless of hierarchal levels. Management support for corporate
entrepreneurial activities was significantly low which goes to show that there by-
in-large a low acceptance for CE.
Key contribution
This research contributes to the further improves the understanding of corporate
entrepreneurship in financial services organisations in South Africa, and
benefits. The study will additionally provide an improved understanding of the
financial services industry. The outcome of this study will challenge executives in
the insurance sector to consider the benefits of executing on corporate
entrepreneurship intentions. To this end, the study adds value to the financial

iii
services sector and may potentially change how the players in this sector
operate.
iv
DECLARATION
I, Mogomotsi Mogopodi, declare that this research report is my own work except
as indicated in the references and acknowledgements. It is submitted in partial
fulfilment of the requirements for the degree of Master of Management in the
University of the Witwatersrand, Johannesburg. It has not been submitted
before for any degree or examination in this or any other university.
Mogomotsi Mogopodi
-------------------------------------------------------------
Signed at ……………………………………………………
On the …………………………….. day of ………………………… 2015

v
ACKNOWLEDGEMENTS
An acknowledgement to the following people for their support and contribution:
My wife and daughter, for their sacrifice, support and understanding
throughout this process.
To my supervisor, Laurence Beder, for his input.
To Hennie Gerber for providing invaluable guidance into the data
analysis process.
To Jenni Croll for the candid feedback in ensuring that this report makes
sense.
To Amanda Sebolai for her encouragement and unwavering support.
To my friends and fellow students for their support understanding.
vi
TABLE OF CONTENTS
ABSTRACT ..................................................................................... II
DECLARATION ............................................................................. IV
ACKNOWLEDGEMENTS ............................................................... V
CHAPTER 1: INTRODUCTION ................................................... 14
1.1 PURPOSE OF THE STUDY .......................................................................... 14
1.2 CONTEXT OF THE STUDY ........................................................................... 14
1.3 PROBLEM STATEMENT .............................................................................. 16
1.3.1. MAIN PROBLEM .................................................................................................... 17
1.3.2. SUB-PROBLEMS ................................................................................................... 17
1.4. SIGNIFICANCE OF THE STUDY .................................................................... 17
1.5. DELIMITATIONS OF THE STUDY................................................................... 18
1.6. DEFINITION OF TERMS .............................................................................. 18
1.7. ASSUMPTIONS ......................................................................................... 18
CHAPTER 2: LITERATURE REVIEW ...................................... 20
2.1. INTRODUCTION ........................................................................................ 20
2.2. FIRST SUB-PROBLEM ................................................................................ 20
2.2.1. CORPORATE ENTREPRENEURSHIP IN FINANCIAL SERVICES ......................... 20
2.2.2. CULTURE ................................................................................................ 21
2.2.3. A MODEL OF CORPORATE ENTREPRENEURSHIP ......................................... 22
2.2.4. CONCEPTUALISING CORPORATE ENTREPRENEURSHIP ................................ 23
2.2.5. FORMS OF CORPORATE ENTREPRENEURSHIP ............................................ 31
2.2.5.1. STRATEGIC ENTREPRENEURSHIP .......................................................................... 31
2.2.5.2. STRATEGIC RENEWAL .......................................................................................... 31
2.2.5.3. SUSTAINED REGENERATION .................................................................................. 32
2.2.5.4. DOMAIN REDEFINITION .......................................................................................... 32
2.2.6. CORPORATE VENTURING ...................................................................................... 33
2.3. CREATING ENTREPRENEURIAL ORGANISATIONS .......................................... 34
vii
2.4. WHERE IS ENTREPRENEURSHIP FOUND WITHIN ESTABLISHED ORGANISATIONS35
2.4.1. BARRIERS TO CORPORATE ENTREPRENEURSHIP ........................................ 38
2.5. SECOND SUB – PROBLEM: ........................................................................ 42
2.5.1. FACTORS THAT INFLUENCE CORPORATE ENTREPRENEURSHIP BEHAVIOUR AND
ACTIVITY .................................................................................................. 42
2.2.5. BIG FIVE ENTREPRENEURIAL BEHAVIOURS ................................................. 45
2.2.5.1. SELF-EFFICACY (SE) ........................................................................................... 46
2.2.5.2. NEED FOR ACHIEVEMENT (NA) ............................................................................. 46
2.2.5.3. RISK TAKING (RT) ................................................................................................ 46
2.2.5.4. TOLERANCE OF AMBIGUITY (TA) ............................................................................ 46
2.2.5.5. LOCUS OF CONTROL (LC) ..................................................................................... 47
CHAPTER 3: RESEARCH METHODOLOGY ............................. 49
3.1 RESEARCH METHODOLOGY ....................................................................... 49
3.2 RESEARCH DESIGN .................................................................................. 49
3.3 POPULATION AND SAMPLE......................................................................... 50
3.3.1 POPULATION ........................................................................................................ 50
3.3.2 SAMPLE AND SAMPLING METHOD ........................................................................... 50
3.4 THE RESEARCH INSTRUMENT .................................................................... 51
3.5 PROCEDURE FOR DATA COLLECTION .......................................................... 52
3.6 DATA ANALYSIS AND INTERPRETATION ....................................................... 52
3.6.1. DATA PRESENTATION ........................................................................................... 52
3.6.2. DESCRIPTIVE STATISTICS ..................................................................................... 52
3.6.1. INFERENTIAL STATISTICS ...................................................................................... 53
3.6.2. INTERPRETATION .................................................................................................. 53
3.7 LIMITATIONS OF THE STUDY ....................................................................... 53
3.8 VALIDITY AND RELIABILITY OF RESEARCH ................................................... 54
3.8.1 EXTERNAL VALIDITY .............................................................................................. 54
3.8.2 INTERNAL VALIDITY ............................................................................................... 54
3.8.3 RELIABILITY ......................................................................................................... 55
CHAPTER 4: PRESENTATION OF RESULTS ........................... 56
4.1. INTRODUCTION ..................................................................................................... 56
viii
4.2. DEMOGRAPHIC PROFILE OF RESPONDENTS ............................................... 56
4.2. DESCRIPTIVES ......................................................................................... 63
CHAPTER 5: DISCUSSION OF THE RESULTS ......................... 83
5.1. INTRODUCTION ........................................................................................ 83
5.2. RESPONDENTS PROFILES ......................................................................... 83
5.3. RESULTS PERTAINING TO SUB-PROBLEM 1:................................................. 84
5.4. RESULTS PERTAINING TO SUB-PROBLEM 2:................................................. 89
5.5.1. MANAGEMENT SUPPORT .......................................................................... 89
5.6. CONCLUSION ........................................................................................... 92
CHAPTER 6: CONCLUSIONS, IMPLICATIONS AND RECOMMENDATIONS.................................................................. 94
6.1 INTRODUCTION ........................................................................................ 94
6.2 CONCLUSIONS OF THE STUDY ................................................................... 94
6.3 IMPLICATIONS AND RECOMMENDATIONS ..................................................... 94
6.4 RECOMMENDATIONS FOR ADDITIONAL RESEARCH ....................................... 95
REFERENCES .............................................................................. 96
APPENDIX A ............................................................................... 101
APPENDIX B ............................................................................... 102

ix
List of Tables
Table 1: Means of manifesting entrepreneurship within organisations .... 36
Table 2: Organisational Constraints of Corporate Entrepreneurship ....... 38
Table 3: Profile of respondents ..................................................................... 51
Table 4: Reliability Estimates for the Study’s Variables ............................. 55
Table 5: Gender frequencies ......................................................................... 57
Table 6: Age frequencies ............................................................................... 58
Table 7: Level in the organisation frequencies ........................................... 59
Table 8: Level of education of respondents ................................................ 60
Table 9: Tenure in the organisation frequencies ......................................... 61
Table 10: Length of employment frequencies ............................................. 62
Table 11: Management Support .................................................................... 63
Table 12: Work Discretion ............................................................................. 64
Table 13: Rewards/ Reinforcement ............................................................... 65
Table 14: Time availability ............................................................................. 66
Table 15: Organisational Boundaries ........................................................... 67
Table 16: Construct average scores ............................................................. 68
Table 17: Management Support .................................................................... 73
Table 18: Work Discretion ............................................................................. 75
Table 19: Rewards/Reinforcement ................................................................ 77
Table 20: Time availability ............................................................................. 79

x
Table 21: Organisational boundaries ........................................................... 81
LIST OF FIGURES
Figure 1: Process of Entrepreneurship ........................................................ 23
Figure 2: A conceptual Model of Entrepreneurship as Firm Behaviour .... 25
Figure 3: Entrepreneurial Grid ...................................................................... 27
Figure 4: A Model of corporate entrepreneurship and wealth creation .... 28
Figure 5: An Integrative Model of Corporate Entrepreneurship ................. 30
Figure 6: Opportunity Recognition Process ................................................ 31
Figure 7: Using Key Elements of the HRM System to Create an
Entrepreneurial Environment ........................................................................ 35
Figure 8: Re-Internalisation – entrepreneur and company ......................... 40
Figure 9: Middle manager’s perception of the internal environment for
corporate entrepreneurship .......................................................................... 43
Figure 10: Gender of respondents (n=104) .................................................. 57
Figure 11: Age of respondents (n=104) ........................................................ 58
Figure 12: Level in the organisation ............................................................. 59
Figure 13: Highest Level of education of respondents (n=100) ................. 60
Figure 14: Tenure in the organisation (n=104) ............................................ 61
Figure 15: Overall length of employment of respondents (n= 104) ......... 62
Figure 16: Histogram of Management Support construct .......................... 69
Figure 17: Histogram of Work Discretion construct ................................... 70

xi
Figure 18: Histogram of Rewards/Reinforcement construct ...................... 70
Figure 19: Histogram of Time Availability Score ......................................... 71
Figure 20: Histogram of Organisational boundaries construct ................. 72
Figure 21: Overall histogram on all the constructs ..................................... 72
Figure 22: Box Plot for management support construct ............................ 74
Figure 23: Box Plot for work discretion construct ...................................... 76
Figure 24: Box Plot for rewards/reinforcement construct .......................... 78
Figure 25: Box Plot for time availability construct ...................................... 80
Figure 26: Box Plot for organisational boundaries construct .................... 82
14
CHAPTER 1: INTRODUCTION
The focus point relates to the Financial Services in South Africa. The field of
entrepreneurship has developed with specific reference to the field of corporate
entrepreneurship. Decades ago corporate entrepreneurship was broad and had
no clear passage for researchers and scholars alike to pin point what it was and
could not be clearly explicated. It is now a new phenomenon of the 21st century
and has developed exponentially.
1.1 Purpose of the study
The purpose of this study is to measure and determine the apparent corporate
entrepreneurship behaviour levels and identify factors that influence and
promote corporate entrepreneurship in a South African financial services
organisation. The study also defines corporate entrepreneurship and assists in
gaining an understanding of corporate entrepreneurship behaviour within the
context of a financial services organisation in the South African financial
services sector.
1.2 Context of the study
The financial sector is essential to the economy and contributes a significant
percentage to the overall Gross Domestic Product (GDP) of South Africa. According
to the national treasury policy document, A SAFER FINANCIAL SECTOR TO
SERVE SOUTH AFRICA BETTER 2011), “the financial sector has consistently
added to the country’s total real annual growth, even in years when the total has
declined. In 2007 and 2008 the sector added 1.5 percentage points to South
Africa’s growth and in 2009, when overall growth was negative (-1.5), the
financial sector still added 0.2 percentage points”. On annual bases, its total
contribution is in the region of about 10.5% of GDP of which is comprised of
over R6 trillion in assets. This is by-in-large the equivalent of 252% the overall
annual GDP. Hawkins 1 (2004) also stated that the financial services sector
contributes approximately 20% towards the South African economy with
insurance industry contributing about 16%.
15
The financial services sector in South Africa comprises all authorised financial
service providers (banking and non-banking), namely, banks, long term
insurance organisations, short term insurance organisations and reassures. The
financial services sector is highly regulated and is overseen by the Financial
Services Board (FSB). The inherent regulatory requirements prescribed by
the Financial Services Board (FSB) continue to be a driver of constant change.
Regulation such as “as and when” commission earnings, RDR, TCF, SAM,
POPI have been introduced over time which as a result, the industry has
incrementally seen regulation dictate the governance and structures of
operations. In addition to regulatory requirements, the increase in competitors
has exacerbated this challenge and consequently products have become
commodities. Conducting business has become significantly challenging over
time and to address these challenges, businesses continue to search for ways
to be innovative and differentiate beyond product or price. The ability to capture
market share and create new markets has become a competitive advantage as
a result. Organisations have recognized that they have to constantly adapt their
operations, processes, products and services to conform to new and
increasingly complex legislative inevitabilities and yet remain efficient and agile
enough to do business.
According to the Association for savings and investment South Africa (ASISA)
(2013), the insurance gap in South Africa in 2013 was 24 trillion, which grew
from 18.4 24 trillion in 2010. With just over five million insured lives out of a total
of about fifty-two million lives in South Africa, the sector has huge potential for
growth however there has been minimal growth year on year. The minimal
growth is as a result of fewer and fewer customers to compete for and an
ongoing increase in the competitor landscape. What this means for
organisations in this sector is that there is a necessity to inculcate different
approaches and techniques to capture increased value from existing customers,
and design and deploy innovative strategies to attract new customers in order to
achieve a competitive advantage over competitors. As a result, silo minded
organisations have learned that being competitive at a local (South Africa) and
global level requires that they are equipped and capable to act and respond to

16
“as and when” the market changes and they need to be fast paced in their
approach to new ideas and innovation through entrepreneurial activities by
employees.
1.3 Problem statement
Thurik and Wennekers (1999) noted that corporate entrepreneurship can be
advantageous for businesses and organisations, in addition to the benefit for
national economies. Ultimately, corporate entrepreneurship will improve
international competitiveness of countries and better yet organisations within them,
and given that in South Africa there is a low entrepreneurial employee activity
(EEA) rate reported in the 2011 and 2012 GEM reports (Bosma, Wennekers, &
Amorós, 2011), (Xavier, Kelley, Kew, Herrington, & Vorderwülbecke, 2012) there is
a great need for organisations to promote entrepreneurial behaviour and corporate
entrepreneurship with the intention of not only being competitive, but ultimately
growing the economy.
The Global Entrepreneurship Monitor (GEM) survey is an annual assessment
that reports on the economic growth and on the role of entrepreneurship in
national the nature of entrepreneurial activity in participating countries. One of
the objectives of the report is to link job creation to economic growth. The 2011
South African Global Entrepreneurial Monitor (GEM) report illustrates that
Entrepreneurial Employee Activity (EEA) rates in South Africa are amongst the
lowest in efficiency-driven economies that took part in the 2011 survey.
Consequently, this is a material concern because corporate entrepreneurship
will provide a level of competitiveness in organisations, Thurik and Wennekers
(1999). According to Bosma et al. (2013) (Bosma et al., 2011). Entrepreneurial
Employee Activity (EEA) can also be called by a variety of terms, such as,
corporate entrepreneurship, intrapreneurship, strategic renewal and corporate
venturing. Furthermore, given that corporate entrepreneurship can have an effect
on an economy by means of increased levels of productivity; this will lead to the
creation of new industries and improvement of best practice methods.
Organisations have had to consider alternative approaches to the norm and
that organisational successes are no longer entirely dependent on research and

17
development (R&D) departments to yield innovative ideas - they now rely on all
individuals within their organisations to contribute towards innovation to enable
a competitive advantage in their respective markets.
1.3.1. Main problem
To measure and determine the apparent corporate entrepreneurship behaviour
levels and identify factors that influence and promote corporate
entrepreneurship in a South African financial services organisation
1.3.2. Sub-problems
The first sub-problem is to measure and determine the apparent levels of
dimensions of corporate entrepreneurship.
The second sub-problem is to measure the differences between the dimensions
of corporate entrepreneurship in the organisation between the hierarchal levels
of the employment.
1.4. Significance of the study
Corporate entrepreneurship is viewed as a practice by which competitiveness may
be realized as well as an avenue to an organisation’s success through internal
excellence. The findings of the research further improves the understanding of
corporate entrepreneurship in financial services organisations in South Africa,
and benefits organisations that have not embarked on corporate
entrepreneurship intentions. The study also assists in identifying the value of
assessing both entrepreneurial behaviour and corporate entrepreneurship
levels. To this end, the study adds value to the financial services sector and
may potentially change how the players in this sector operate. The outcome of
this study will further challenge executives in the insurance sector and other
industries to consider the benefits of executing on corporate entrepreneurship
intentions.
18
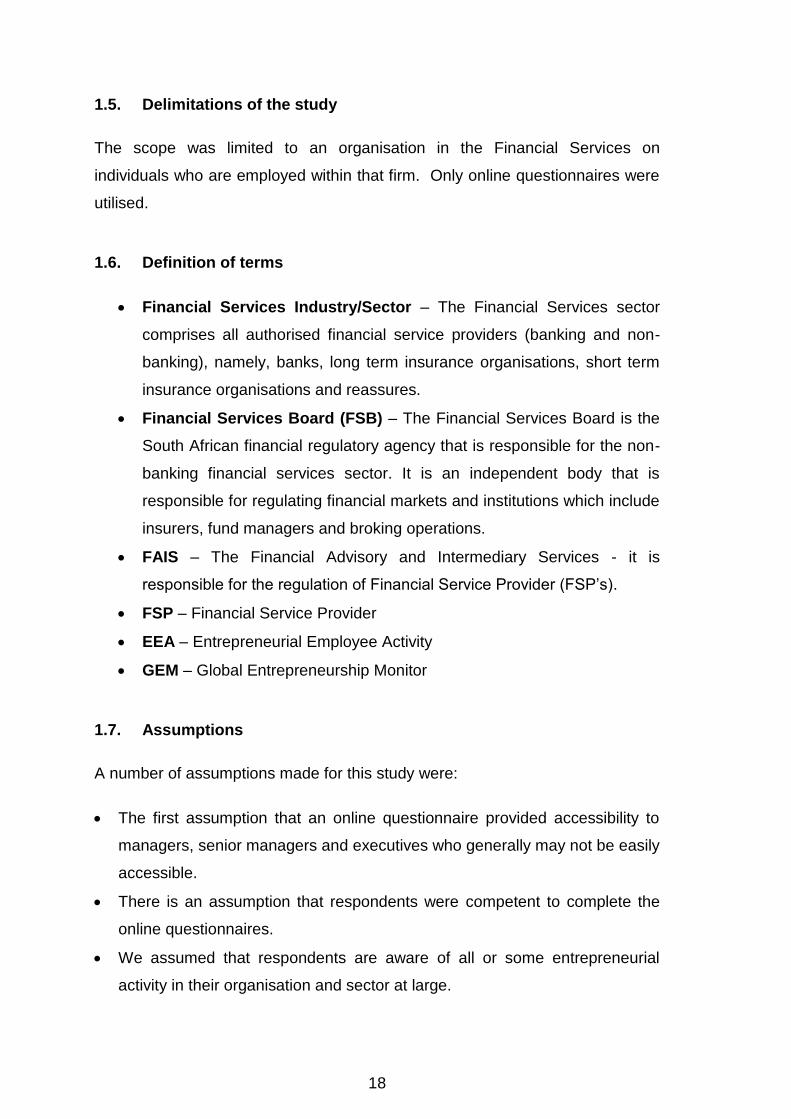
1.5. Delimitations of the study
The scope was limited to an organisation in the Financial Services on
individuals who are employed within that firm. Only online questionnaires were
utilised.
1.6. Definition of terms
Financial Services Industry/Sector – The Financial Services sector
comprises all authorised financial service providers (banking and non-
banking), namely, banks, long term insurance organisations, short term
insurance organisations and reassures.
Financial Services Board (FSB) – The Financial Services Board is the
South African financial regulatory agency that is responsible for the non-
banking financial services sector. It is an independent body that is
responsible for regulating financial markets and institutions which include
insurers, fund managers and broking operations.
FAIS – The Financial Advisory and Intermediary Services - it is
responsible for the regulation of Financial Service Provider (FSP’s).
FSP – Financial Service Provider
EEA – Entrepreneurial Employee Activity
GEM – Global Entrepreneurship Monitor
1.7. Assumptions
A number of assumptions made for this study were:
The first assumption that an online questionnaire provided accessibility to
managers, senior managers and executives who generally may not be easily
accessible.
There is an assumption that respondents were competent to complete the
online questionnaires.
We assumed that respondents are aware of all or some entrepreneurial
activity in their organisation and sector at large.
19
We assumed that respondents would have reasonable knowledge of the
topic of corporate Entrepreneurship or Intrapreneurship.
The final assumption is that some respondents may not be able to complete
questionnaires due to their organisational non-disclosure clause
requirements.
20
CHAPTER 2: LITERATURE REVIEW
2.1. Introduction
The literature review outlines and delineates previous research on corporate
entrepreneurship with the context of the financial services sector in South
Africa and provides an overview of the emerging markets and the inhibitors and
causes thereof.
2.2. First sub-problem
The first sub-problem is to measure and determine the apparent levels of
dimensions of corporate entrepreneurship.
2.2.1. Corporate Entrepreneurship in Financial Services
CE in the South African financial services is highly influenced by the economic
and political climate of the country, Luiz and Charalambous (2009). “Emerging
economies are characterized by an increasing market orientation and an
expanding economic foundation. The success of many of these economies is
such that they are rapidly becoming major economic forces in the world.
Entrepreneurship plays a key role in this economic development” Bruton,
Ahlstrom, and Obloj (2008). In emerging markets corporate entrepreneurship is
defined as surrounding processes. Guth and Ginsberg (1990); Zahra and Covin
(1995) identified these processes as innovation, venturing, and strategic
renewal. Jeffrey G Covin and Dennis P Slevin (1991) found that in several
studies they conducted there was a relationship between organisational
performance and entrepreneurial posture which were moderated by environmental
conditions. According to Antoncic and Hisrich (2003) environmental conditions are
dynamism, technological opportunities, industry growth, and demand for new
products. Therefore, environmental conditions have to be considered when
looking into corporate entrepreneurship in emerging markets. Jeffrey G Covin
and Dennis P Slevin (1991) in fact relate environments to performance by
stating that; “In highly competitive, unforgiving, hostile environments, for example,
21
entrepreneurial postures appear to promote high levels of firm performance”. In
addition, they (Jeffrey G Covin & Dennis P Slevin, 1991) realised that in emerging
industries specifically, new ventures benefited from the espousal of entrepreneurial
postures compared to new ventures in non-emerging markets.
In emerging countries, like South Africa, corporate entrepreneurship is a
significant driver and vehicle to entrepreneurial behaviour and the
encouragement thereof. Corporate entrepreneurship may also impact company
performance and largely the growth of the economy Thurik and Wennekers
(1999). Hornsby, Kuratko, and Zahra (2002) also states that he has observed
corporate entrepreneurship being both formal and informal activities that are
intended to create new business in established corporations. He continues to
state that corporate entrepreneurship will be developed through the innovation
of product market developments. Morris, Kuratko, and Covin (2008) point out
that corporate entrepreneurship exists in both small and large organisations.
Entrepreneurship is the locomotive that will drive emerging economies onward
and while emerging countries should have high levels of entrepreneurship and a
decent level of corporate entrepreneurship, and “given the importance and
steady growth of emerging economies worldwide, it is somewhat surprising that
over the last 17 years only 43 articles have been published on entrepreneurship
in that domain” Bruton et al. (2008). The continuation to work within designated
systems and act as institutionalised entrepreneurs to support entrepreneurial
behaviour and encourage labour markets, legal structures and financial systems
remains a challenge for entrepreneurs in emerging markets Bruton et al. (2008).
2.2.2. Culture
The culture in financial services industry is bureaucratic in nature, risk averse
and a low tolerance to change.
An organisational culture should be associated with continuous innovation and
must provide for structured roles and responsibilities, centralised procedures
and task efficiency. This ensures that new ideas, while continually encouraged,
do not disrupt existing (profitable) work flow and production methods.
22
Innovation can then be channelled through well-defined internal routes and
easily incorporated into current operations. Venter, Urban, and Rwigema
(2008) define culture as a system that links individuals in organisations
through commonality in beliefs, values, assumptions and norms.
“Culture and motivations in some emerging economies include an emphasis on
the welfare of others, maintaining the status quo, maintaining networks and
relationships which may change the implications of assumptions of an individual
on profit maximization and self-interest maximization” Yiu and Lau (2008).
Culture is a definite challenge that will impact the financial services sector due
to the bureaucracy. According to Bruton et al. (2008), a further need exists to
identify influencers of culture on entrepreneurship such as religion, values,
educational systems, organisational behaviours and individual behaviour in
entrepreneurship. Bruton et al. (2008) discuss cultural impacts on a number of
activities such as resources and costs.
2.2.3. A Model of Corporate Entrepreneurship
According to Morris et al. (2008) to create an entrepreneurial organisation;
corporate strategy, organisational culture, organisational structure and human
resources are integral elements in realising the entrepreneurial organisation
intent. The process below elucidates that there are building blocks required to
encourage, facilitate and finally the sustaining of corporate entrepreneurship in
organisations.

23
Figure 1: Process of Entrepreneurship
Source: Morris et al. (2008)
2.2.4. Conceptualising Corporate Entrepreneurship
Morris et al. (2008), state that corporate entrepreneurship is a systematic
process. The fact that corporate entrepreneurship is a process makes it vital
for organizations to assess their corporate entrepreneurial activity on a
regular and systematic basis. Corporate entrepreneurship is described as
the merging of entrepreneurship in organisations through entrepreneurs
based in the organisation who create new ventures Venter et al. (2008).
Zahra and Covin (1995) define corporate entrepreneurship as "a process of
organizational renewal that has two distinct but related dimensions:
innovation and venturing; and strategic renewal”. Corporate
entrepreneurship is defined by Chua, Chrisman, and Sharma (1999) as “the
process whereby an individual or a group of individuals, in association with
an existing organisation, create a new organisation or instigate renewal or
innovation within that organisation”. Chung and Gibbons (1997) support this
notion and have defined corporate entrepreneurship as the practice for the
transformation of individual ideas and a collection of actions in
organisations. Hornsby et al. (2002) also states that they have observed
corporate entrepreneurship being both formal and informal activities that are
24
intended to create new business in established corporations. They continue
to state that corporate entrepreneurship will be developed through the
innovation of product market developments. C.J. Goosen, Coning, and Smit
(2002) describe corporate entrepreneurship or intrapreneurship being
means for invigorating corporate organisations. Antoncic and Hisrich (2003),
state that intrapreneurship resides within organisations. They describe
intrapreneurship as entrepreneurship in existing organisations and that
organisational entrepreneurial levels differ from one organisation to the next.
Intrapreneurs are also known as corporate entrepreneurs Venter et al.
(2008). Intrapreneurship described by Stevenson and Jarillo (1990) as “a
process by which individuals inside organisations pursue opportunities
independent of resources they control”.
The two main aims of corporate entrepreneurship are: the creation and pursuit
of new venture opportunities and strategic renewal, Urban (2010). Other
scholarly researchers such as Guth and Ginsberg (1990) refer corporate
entrepreneurship to a method of organisational renewal. “Miller (1983) and
several others (Morris & Paul, 1987; Covin & Slevin (1990); Dean, Meyer, &
DeCastro (1993) have shared this perspective by specifying three
components of CE: pro-activeness, innovation, and risk taking.” Corporate
entrepreneurship was also researched by Dess and Lumpkin (2005) who
established that to have corporate entrepreneurship and prove it successful
in organisations, there was a need to have entrepreneurial orientation (EO).
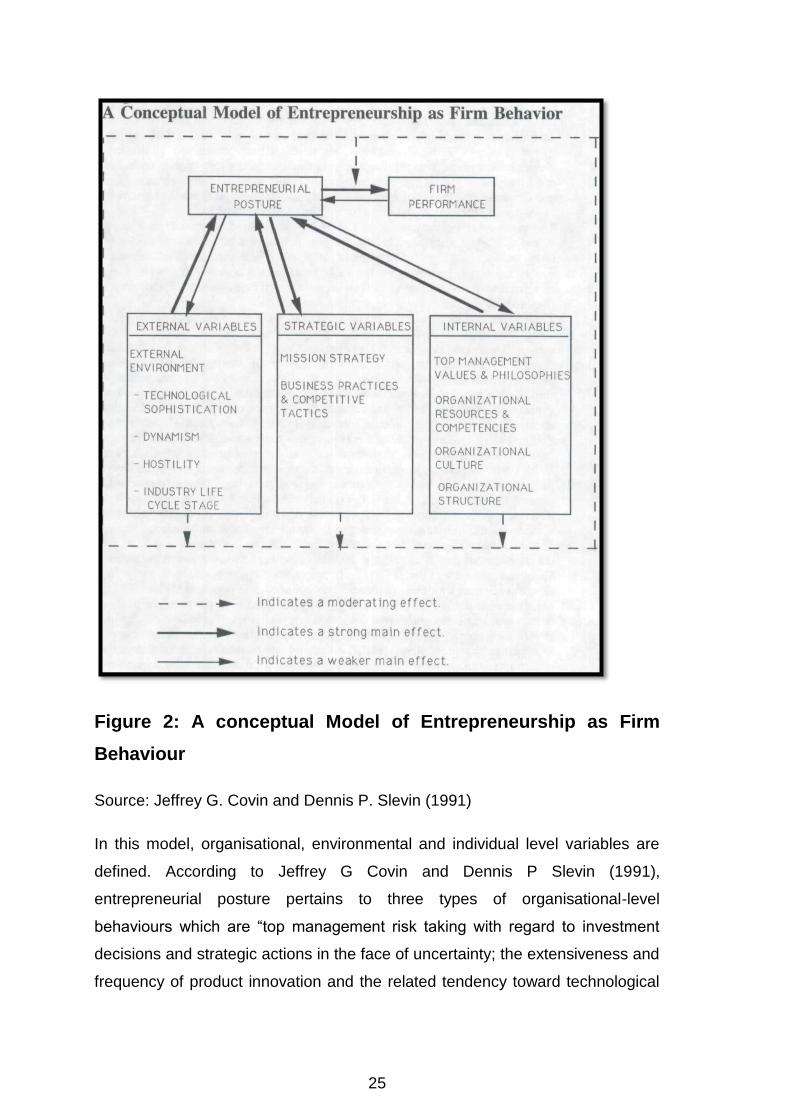
Figure 2 below depicts a proposed model of entrepreneurship as firm
behaviour by Jeffrey G. Covin and Dennis P. Slevin (1991). The model has nine
variables which indicate relationships relating to entrepreneurial posture and
firm performance as well as the outcomes of having an entrepreneurial posture.
25
Figure 2: A conceptual Model of Entrepreneurship as Firm
Behaviour
Source: Jeffrey G. Covin and Dennis P. Slevin (1991)
In this model, organisational, environmental and individual level variables are
defined. According to Jeffrey G Covin and Dennis P Slevin (1991),
entrepreneurial posture pertains to three types of organisational-level
behaviours which are “top management risk taking with regard to investment
decisions and strategic actions in the face of uncertainty; the extensiveness and
frequency of product innovation and the related tendency toward technological
26
leadership; and the pioneering nature of the firm as evident in the firm's
propensity to aggressively and proactively compete with industry rivals”.
The external variables pertain to all external environments that are a broad-
spectrum of economic trends which impact firm behaviour and actions.
Strategic variables are a combination of organisational mission strategies;
which are influenced by organisational intentions from a growth point of view,
business practices and its tactics to be competitive. An entrepreneurial posture
is achievable when the mission strategy is build-oriented which results in firms
meeting their goals.
Lastly, the internal variables deal with; top management’s values and
philosophies towards the strategies of the organisation, organisational
resources and competencies which relate to the ability a firm has to engage
entrepreneurially. According to Jeffrey G Covin and Dennis P Slevin (1991),
“organisational culture can be defined as the shared set of values, beliefs,
attitudes, expectations, and assumptions, passed from one generation of
employees to the next, that determine the norms for appropriate behaviour
within the organization”.
Jeffrey G Covin and Dennis P Slevin (1991) discuss an entrepreneurial
continuum which plots and differentiates organisations from less entrepreneurial
(conservative) to more entrepreneurial. As a result the entrepreneurial grid
essentially enables organisation’s management teams to actively define the role
of entrepreneurship within their organisations. Subsequent to these,
organisations’ strategies are defined based on where they fall on the grid. The
degree of entrepreneurship can be measured from conservative (reactive, risk
averse and non-innovative) to entrepreneurial (innovative, risk taking and
proactive) and that the degree is linked to rates of technological changes in
industries and product heterogeneity.
On the y-axes, the frequency of entrepreneurship can be measured by the
number of events created, and unequivocally linked to the concentration of
current market heterogeneity and competition, Morris et al. (2008).

27
Figure 3 illustrates the entrepreneurial grid which measures both levels of
entrepreneurial activities (incremental to revolutionary) and levels of frequency
of entrepreneurial events (periodic to continuous).
Source: Morris et al. (2008)
There are several dependencies such as internal and external factors which will
influence where an organisation lands on the entrepreneurial grid, as stated by
Morris, et al (2008).
The internal factors are flatter structures, control systems which measure levels
of slack, appraisal systems which include innovation and risk-taking criteria,
jobs which are broad scope and reward systems which encourage a balance of
individualism and group orientation.
The external factors are comfortable margins, demand that is captive, highly
concentrated industries which have little direct competition and lastly,
technologies that seldom change Morris et al. (2008).
Figure 3: Entrepreneurial Grid

28
Antoncic and Hisrich (2004) developed a model to test the relationship
corporate entrepreneurship has with organisational performance, growth and
wealth creation. The model considers that all things being equal (ceteris paribus), a
combination of favourable environmental conditions, organisational factors and
corporate entrepreneurship will result in an increase performance levels. Figure 4
below illustrates this model.
Figure 4: A Model of corporate entrepreneurship and wealth
creation
Source: Antoncic and Hisrich (2004)
29
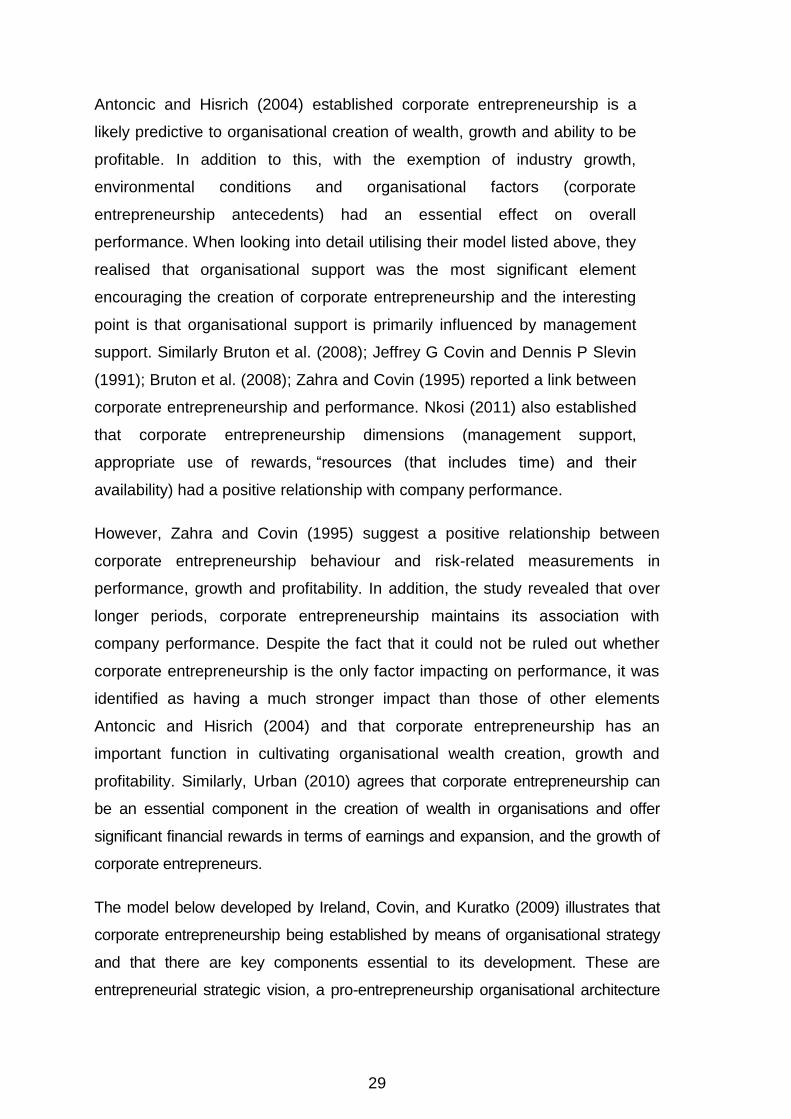
Antoncic and Hisrich (2004) established corporate entrepreneurship is a
likely predictive to organisational creation of wealth, growth and ability to be
profitable. In addition to this, with the exemption of industry growth,
environmental conditions and organisational factors (corporate
entrepreneurship antecedents) had an essential effect on overall
performance. When looking into detail utilising their model listed above, they
realised that organisational support was the most significant element
encouraging the creation of corporate entrepreneurship and the interesting
point is that organisational support is primarily influenced by management
support. Similarly Bruton et al. (2008); Jeffrey G Covin and Dennis P Slevin
(1991); Bruton et al. (2008); Zahra and Covin (1995) reported a link between
corporate entrepreneurship and performance. Nkosi (2011) also established
that corporate entrepreneurship dimensions (management support,
appropriate use of rewards, “resources (that includes time) and their
availability) had a positive relationship with company performance.
However, Zahra and Covin (1995) suggest a positive relationship between
corporate entrepreneurship behaviour and risk-related measurements in
performance, growth and profitability. In addition, the study revealed that over
longer periods, corporate entrepreneurship maintains its association with
company performance. Despite the fact that it could not be ruled out whether
corporate entrepreneurship is the only factor impacting on performance, it was
identified as having a much stronger impact than those of other elements
Antoncic and Hisrich (2004) and that corporate entrepreneurship has an
important function in cultivating organisational wealth creation, growth and
profitability. Similarly, Urban (2010) agrees that corporate entrepreneurship can
be an essential component in the creation of wealth in organisations and offer
significant financial rewards in terms of earnings and expansion, and the growth of
corporate entrepreneurs.
The model below developed by Ireland, Covin, and Kuratko (2009) illustrates that
corporate entrepreneurship being established by means of organisational strategy
and that there are key components essential to its development. These are
entrepreneurial strategic vision, a pro-entrepreneurship organisational architecture
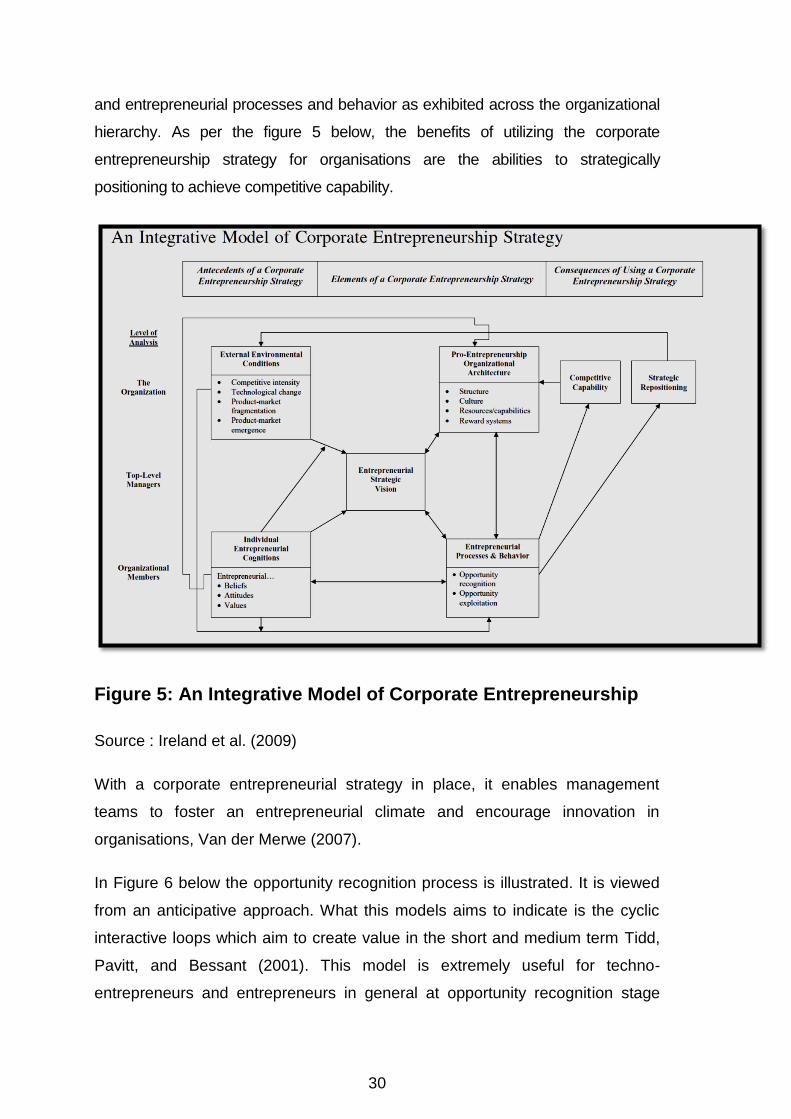
30
and entrepreneurial processes and behavior as exhibited across the organizational
hierarchy. As per the figure 5 below, the benefits of utilizing the corporate
entrepreneurship strategy for organisations are the abilities to strategically
positioning to achieve competitive capability.
Figure 5: An Integrative Model of Corporate Entrepreneurship
Source : Ireland et al. (2009)
With a corporate entrepreneurial strategy in place, it enables management
teams to foster an entrepreneurial climate and encourage innovation in
organisations, Van der Merwe (2007).
In Figure 6 below the opportunity recognition process is illustrated. It is viewed
from an anticipative approach. What this models aims to indicate is the cyclic
interactive loops which aim to create value in the short and medium term Tidd,
Pavitt, and Bessant (2001). This model is extremely useful for techno-
entrepreneurs and entrepreneurs in general at opportunity recognition stage

31
who may be employed in organisations to identify technological innovations.
Additionally Antoncic and Hisrich (2003), explicate that entrepreneurship
essentially a substance of the degree and should not be viewed in absolute
terms.
Figure 6: Opportunity Recognition Process
Source: Thérin (2007), Handbook of Research on Techno-Entrepreneurship
2.2.5. Forms of Corporate Entrepreneurship
2.2.5.1. Strategic Entrepreneurship
2.2.5.2. Strategic Renewal
Strategic renewal refers to organisations focusing on redefining exiting
strategies and adopting new strategies. It is important to note that not all
organisations embark on new strategies to achieve strategic renewal. Strategic
renewal is initiated when organisations intend to gain favourable positioning in
an existing market through new strategies Morris et al. (2008).
32
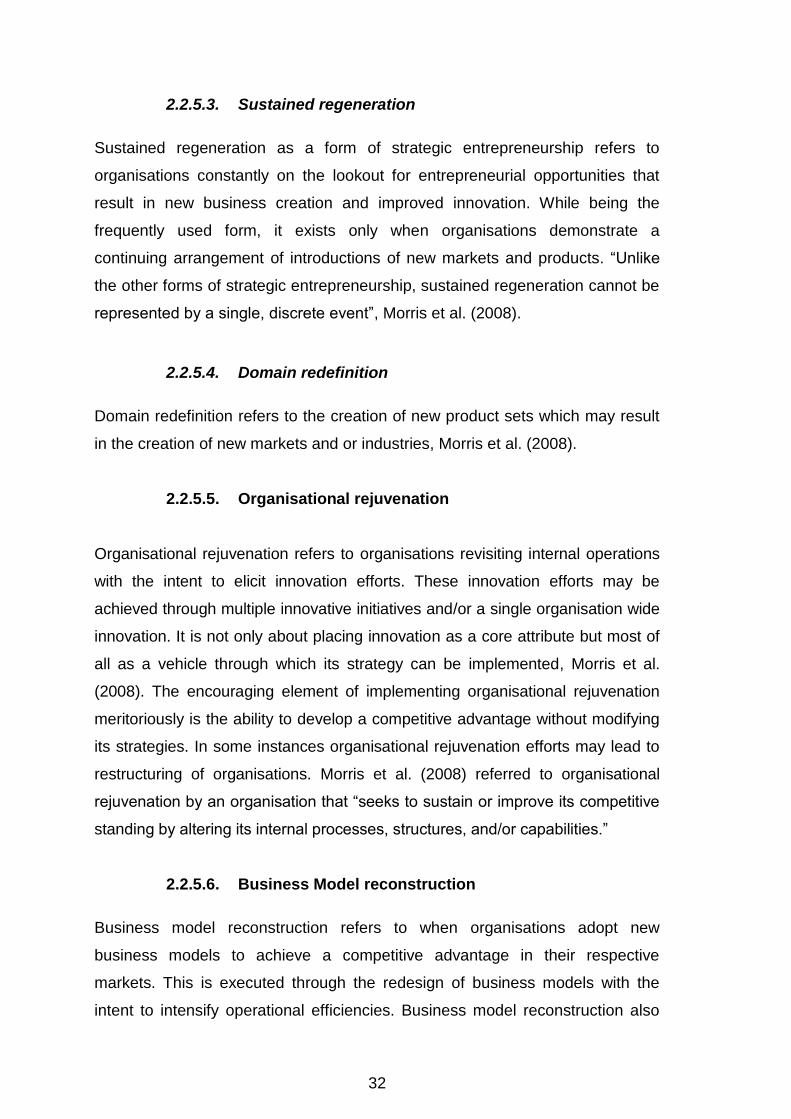
2.2.5.3. Sustained regeneration
Sustained regeneration as a form of strategic entrepreneurship refers to
organisations constantly on the lookout for entrepreneurial opportunities that
result in new business creation and improved innovation. While being the
frequently used form, it exists only when organisations demonstrate a
continuing arrangement of introductions of new markets and products. “Unlike
the other forms of strategic entrepreneurship, sustained regeneration cannot be
represented by a single, discrete event”, Morris et al. (2008).
2.2.5.4. Domain redefinition
Domain redefinition refers to the creation of new product sets which may result
in the creation of new markets and or industries, Morris et al. (2008).
2.2.5.5. Organisational rejuvenation
Organisational rejuvenation refers to organisations revisiting internal operations
with the intent to elicit innovation efforts. These innovation efforts may be
achieved through multiple innovative initiatives and/or a single organisation wide
innovation. It is not only about placing innovation as a core attribute but most of
all as a vehicle through which its strategy can be implemented, Morris et al.
(2008). The encouraging element of implementing organisational rejuvenation
meritoriously is the ability to develop a competitive advantage without modifying
its strategies. In some instances organisational rejuvenation efforts may lead to
restructuring of organisations. Morris et al. (2008) referred to organisational
rejuvenation by an organisation that “seeks to sustain or improve its competitive
standing by altering its internal processes, structures, and/or capabilities.”
2.2.5.6. Business Model reconstruction
Business model reconstruction refers to when organisations adopt new
business models to achieve a competitive advantage in their respective
markets. This is executed through the redesign of business models with the
intent to intensify operational efficiencies. Business model reconstruction also

33
includes outsourcing of non-core functions in organisations to ensure that there
is increased focus on core functions Morris et al. (2008).
2.2.6. Corporate Venturing
2.2.6.1. Internal Corporate Venturing
Morris et al. (2008) refer to internal corporate venturing as the formation of new
business entities that are owned and formed by the organisation. These
businesses would more than likely be found in the physical location of the
organisation and operate in parallel to the core business.
2.2.6.2. Cooperative Corporate venturing
According to Morris et al. (2008), cooperative corporate venturing is “also
known as joint corporate venturing and collaborative corporate venturing”.
Cooperative corporate venturing refers to joint ventures where new businesses
are formed and jointly owned by the organisation and external partners. These
joint ventures are located outside the organisation facilitating opportunities of
scalability of resources entrenched in partner organisations.
2.2.6.3. External Corporate Venturing
This form of corporate venturing discusses entrepreneurial undertakings that
occur outside organisations by external events and/or individuals whereby new
businesses are created. Ultimately the end result is the entrepreneurial activities
reinvested into the organisation. The reinvestment may occur via acquisitions
Morris et al. (2008).
34
2.3. Creating entrepreneurial organisations
As entrepreneurial organisations aggressively pursue futures and competitive
advantage, its managers must continually assess the levels of entrepreneurial
activity occurring within the organisation Morris et al. (2008). Entrepreneurship
involves uncertainty and risk and therefore corporate entrepreneurship should
not be approached as an “experimental program” but as a process that
infiltrates and permeates the entire organisation with the objective of achieving
dramatic results over time, Morris et al. (2008). Corporate entrepreneurship is
not only expected in large organisations, but also in all business types and
sizes, Urban (2010).
An entrepreneurial organization is characterized by an entrepreneurial dominant
logic, meaning an organisational mind-set in which an organization continuously
searches and filters newly found process novelties and product, impacting
organisational successes and wealth creation (Urban, B. (ed.) 2009). Innovation
is core in entrepreneurial organisations and it is around this core that other
important elements of the organization, such as strategy, structure and
management style are built (Urban, B. (ed.) 2009). The complexity of corporate
entrepreneurship and the fact that corporate entrepreneurship is a process,
make it vital for organizations to assess their corporate entrepreneurial activity
on a regular and systematic basis,(Morris et al., 2008).
In order to create entrepreneurial organisations, a systematic approach as per
the following figure could be to be adopted and implemented.

35
Figure 7: Using Key Elements of the HRM System to Create an
Entrepreneurial Environment
Source: Morris et al. (2008)
2.4. Where is entrepreneurship found within established
organisations
Morris et al. (2008) found that there are seven means by which
entrepreneurship is manifested in established companies. These are traditional
R&D, Ad Hoc Venture teams, new venture teams, champions and the
mainstream, acquisitions, outsourcing, and hybrids. The table below details the
means of manifesting entrepreneurship within organisations.

36
Table 1: Means of manifesting entrepreneurship within
organisations
1. Traditional R&D
“leave it to the technical guys”
Focusing mainly on technical requirements.
Their work is research driven. Departments
staffed by technical staff resolving and
improving existing products, and developing
new products.
2. Ad Hoc Venture Teams
“here’s the concept, the budget, and the
deadline – go to it”
Driven at a senior management level. A
team of employees retained together from
diverse parts of the organisation. Deployed
to come up with innovation. The team is set
up separately from the company in an
arrangement that is highly autonomous,
independent and high flexibility. There are
demanding timelines with abundant financial
resources.
3. New Venture Teams
“We want a factory for breakthrough
concepts”
This is an incubation environment where
bold new ventures are formulated and
brought to life. A full time team/unit which
has to come up with breakthrough
innovation and create entirely new markets.
4. Champions and the Mainstream
“It’s up to everyone, including you”
Employees are provided the opportunity to
develop and/or recognize new innovative
concepts. Their concept is presented and
sold to senior management for approval.
Champions are required to utilize their
informal networks and resources to build
their concept. The concept may be rejected

37
a number of times by the by management.
Employees will persevere to get their
concept approved.
5. Acquisitions
“We can buy growth and obtain the
products, markets, and technologies of
others”
Acquiring other companies that have related
competencies which are core to business
and supplement their strategic direction.
Obtaining skills or technologies that. The
challenge is being able to inculcate its
values in companies they acquire.
6. Outsourcing
“Let’s have someone else develop it for us,
and the we’ll make the money”
“Outsourcing innovation”. Purchasing
intellectual capital from individuals and
companies. Preferred because it is quick to
buy and cheaper than having in-house
capabilities, and people cost.
7. Hybrid Forms
“Mix and match the other approaches to fit
our context”
Fitting all approaches instead of just one at
a time. This way the hybrid approach allows
for all six approaches to simultaneously
exist with different roles, expectations and
outcomes.
Source: (Morris et al., 2008)
38
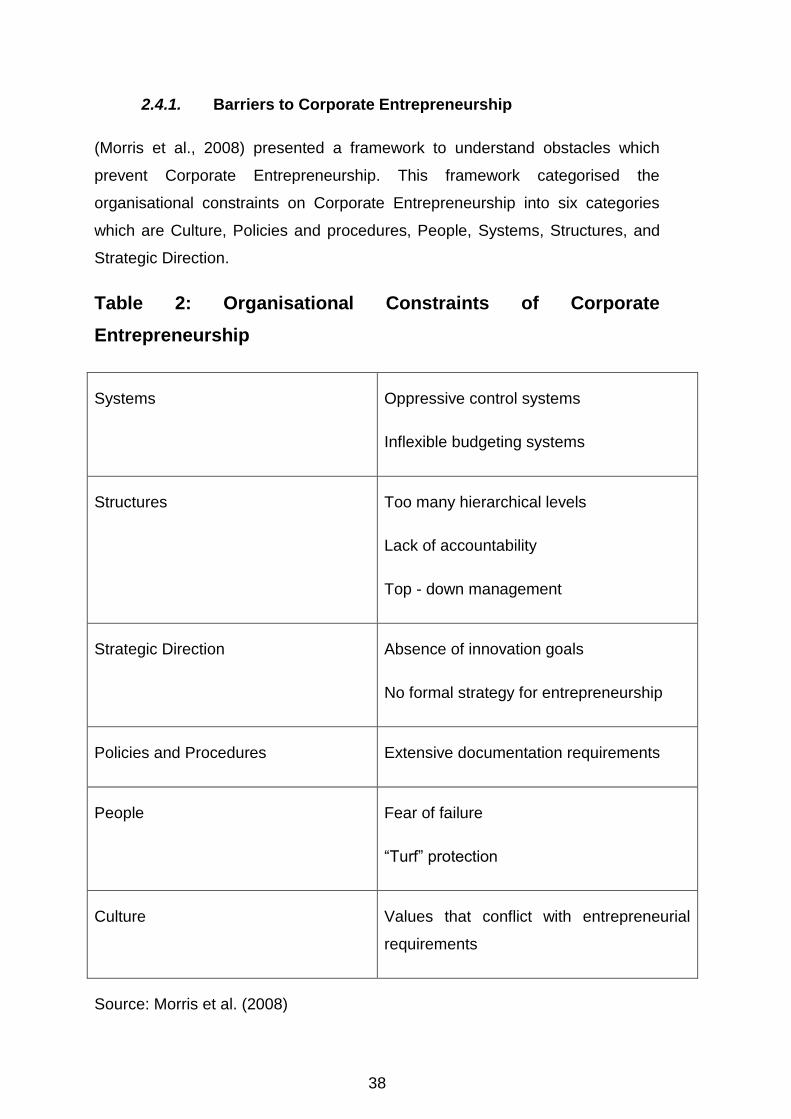
2.4.1. Barriers to Corporate Entrepreneurship
(Morris et al., 2008) presented a framework to understand obstacles which
prevent Corporate Entrepreneurship. This framework categorised the
organisational constraints on Corporate Entrepreneurship into six categories
which are Culture, Policies and procedures, People, Systems, Structures, and
Strategic Direction.
Table 2: Organisational Constraints of Corporate
Entrepreneurship
Systems Oppressive control systems
Inflexible budgeting systems
Structures Too many hierarchical levels
Lack of accountability
Top - down management
Strategic Direction Absence of innovation goals
No formal strategy for entrepreneurship
Policies and Procedures Extensive documentation requirements
People Fear of failure
“Turf” protection
Culture Values that conflict with entrepreneurial
requirements
Source: Morris et al. (2008)
39
2.4.2. Internalisation and Corporate Entrepreneurship
Internalisation is the process of trading internationally to an exchange of
services, goods and capital. Internalisation accounts for a large portion of gross
domestic product (GDP) of many countries. Internalisation offers countries and
organisations within them such as in financial services, the opportunity to trade
and be part of a global network. As mentioned in chapter 1, success for
organisations in the financial services sector may require looking beyond South
African boarders to be successful. McDougall and Oviatt (2000) defined
international entrepreneurship as “a combination of innovative, proactive, and
risk-seeking behaviour that crosses national borders and is intended to create
value organisations”.
According to Venter et al. (2008), the following were critical for organisations
intending to go global.
1. Stable Interest rates
2. Local laws and customs that support international business
3. Favourable exchange rates
4. Fair and acceptable tariff levels
5. Stable political environment
6. A strong consumer base – purchasing power
7. Infrastructural support
8. Suitably qualified labour supply
Literature further talks about re-entering markets as a process of “Re-
Internalisation” whereby organisations take a cooling off period from business
and involvement. This is from the premise that some organisations may already
have operations beyond the borders . the Welch and Welch (2009) refer to Re-
Internalisation as “a withdrawal from inward and outward international
operations by a company before subsequent international re-entry.
Entrepreneurship researchers specifically within the globalisation and

40
internalisation have found that there is always a link between the
entrepreneurial intention and the entrepreneur.
Figure 8: Re-Internalisation – entrepreneur and company
Source: Welch and Welch (2009)
The model above suggests that this can exist in the sense that organisations
may cease operations but the owner/manager will start a new company to
reattempt the process once over. This notion is not of an empirical nature,
however it provides support by indicating that the internationalization process
can only proceed on the bases that the owner-manager has an ‘international
orientation”. The Uppsala model below was also seen as an appropriate
approach to internationalisation.
41
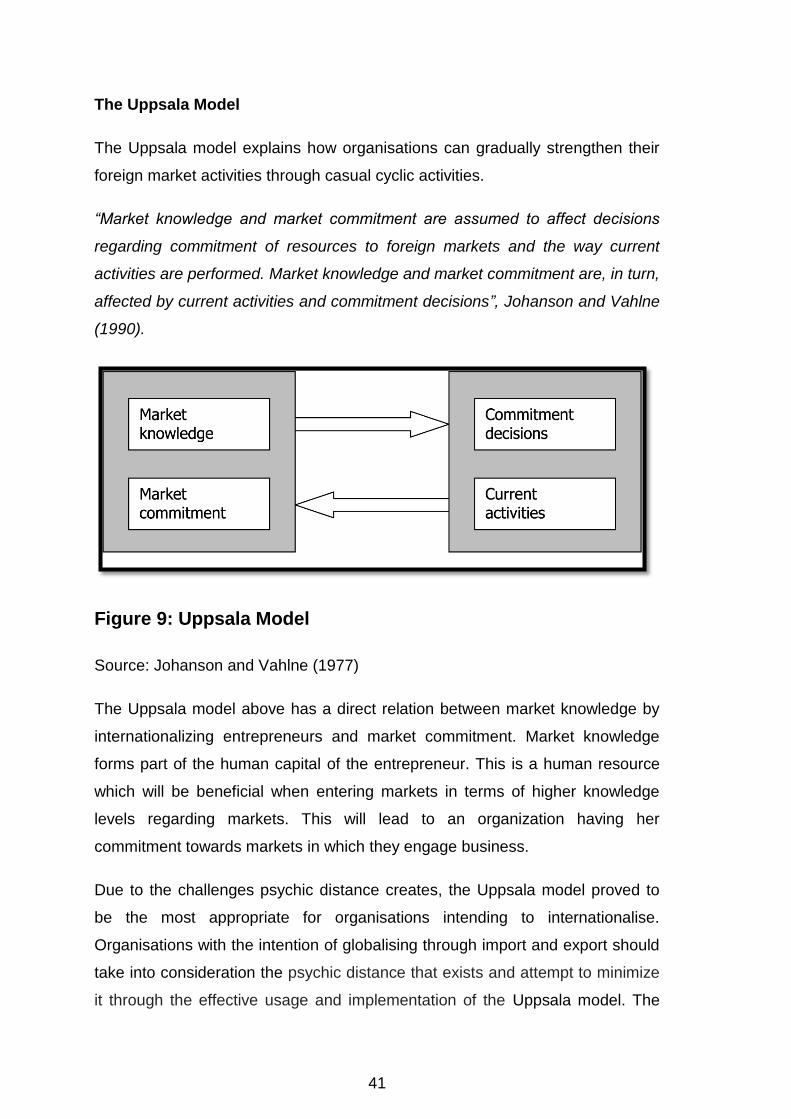
The Uppsala Model
The Uppsala model explains how organisations can gradually strengthen their
foreign market activities through casual cyclic activities.
“Market knowledge and market commitment are assumed to affect decisions
regarding commitment of resources to foreign markets and the way current
activities are performed. Market knowledge and market commitment are, in turn,
affected by current activities and commitment decisions”, Johanson and Vahlne
(1990).
Figure 9: Uppsala Model
Source: Johanson and Vahlne (1977)
The Uppsala model above has a direct relation between market knowledge by
internationalizing entrepreneurs and market commitment. Market knowledge
forms part of the human capital of the entrepreneur. This is a human resource
which will be beneficial when entering markets in terms of higher knowledge
levels regarding markets. This will lead to an organization having her
commitment towards markets in which they engage business.
Due to the challenges psychic distance creates, the Uppsala model proved to
be the most appropriate for organisations intending to internationalise.
Organisations with the intention of globalising through import and export should
take into consideration the psychic distance that exists and attempt to minimize
it through the effective usage and implementation of the Uppsala model. The

42
model provides a certain amount of support for organisations providing
invaluable information.
Once an organization has entered foreign markets there are higher chances of
success based on the Born Global model and the re-internalization model. The
re-internalization model provides confidence for organisations intending to re-
enter markets. While the models may assist in operationalizing their move it is
imperative that intangibles are taken into consideration. Organisations that want
to make a presence will have to commit to their cause similarly to the “high
committer” in the Born Global model.
2.5. Second Sub – problem:
To measure the differences between the dimensions of corporate
entrepreneurship in the organisation between the hierarchal levels of the
employment
2.5.1. Factors that influence corporate entrepreneurship
behaviour and activity
There are five key factors that influence an environment conducive to
corporate entrepreneurship behaviour which were identified by Hornsby et
al. (2002) as management support, appropriate use of rewards, “resources
(that includes time) and their availability for entrepreneurial activity”, a
supportive organisational structure and risk taking. These were further
modified by Kuratko, Hornsby, and Covin (2014) to: top management
support, work discretion/autonomy, rewards/reinforcement, time availability,
and organizational boundaries. Nkosi (2011) established that corporate
entrepreneurship dimensions (management support, appropriate use of
rewards, “resources (that includes time) and their availability) had a positive
relationship with company performance.

43
2.5.1.1. Top Management Support
According to Hornsby et al. (2002), top management support is the disposition
and intention of managers to encourage entrepreneurial activity in
organisations. It refers to their commitment towards entrepreneurial activity and
their ability to institutionalize entrepreneurial activity in the organisations’ system
and processes. Their support can be demonstrated in a number of ways such
as, and not limited to; their support towards entrepreneurial activity, allocating
resources and/or SME’s, including advocating innovative ideas, providing
necessary resources or expertise. Dess and Lumpkin (2005) also states that
organisations with an overall entrepreneurial mission use a top down approach
to stimulate entrepreneurial activity, meaning that top leaders of organisations
support programmes and incentives that foster a climate of entrepreneurship.
On the other hand, many of the best ideas of new corporate ventures or
innovation come from bottom-up.
Middle managers’ perceptions of internal factors as per figure below determine
their relative emphasis on the various activities they undertake to encourage or
facilitate corporate entrepreneurship (Kuratko, Montagno, & Hornsby, 1990)
Figure 10: Middle manager’s perception of the internal
environment for corporate entrepreneurship
Source: Hornsby et al. (2002)

44
2.5.1.2. Work discretion/autonomy
This is the willingness to take risks and the organisational open-mindedness to
failure from attempting entrepreneurial activities Hornsby et al. (2002). Further
to this, it relates to the autonomy allowable to perform work duties and take part
in more untried activities Kuratko et al. (2014).
2.5.1.3. Time availability
The extent to which free time is provided to cultivate innovative entrepreneurial
behaviour thorough trial and error, and risk-taking behaviours Hornsby et al.
(2002); Kuratko et al. (2014).
2.5.1.4. Reward/reinforcement
Rewards and reinforcement refers to systems to recognize and drive
entrepreneurial activity Kuratko et al. (2014). Additionally, it alludes to
underpinning activities that must be considered to ensure effective usage of
rewards to stimulate entrepreneurial activity through the provision of incentives
which are results based, goals, feedback and overall individual responsibility
Hornsby et al. (2002) and will lead to an augmentation of middle managers’
disposition towards risks related with entrepreneurial activity. Kuratko et al.
(2014) stated that rewards are a key contributing factor of entrepreneurial
behaviour by managers as is the availability of reward and resources.
2.5.1.5. Organisational boundaries
Organisational boundaries are the tools available to govern the idea generation
value-chain that drives entrepreneurial behaviour Hornsby et al. (2002); Kuratko
et al. (2014) and refer to the perceptions as to the flexibility of organisational
boundaries that are essential in manifesting entrepreneurial activity.
45
2.5.2. Entrepreneurial Orientation
“Entrepreneurial orientation (EO) refers to the strategy-making practices that
businesses use to identify and launch corporate ventures”. This suggested
that ideas are captured through entrepreneurial orientation (EO) and that
this is a mind-set, and the entrepreneurial perception displayed in
organisations. The factors of entrepreneurial orientation (EO) work
collectively to improve organisational performance. The factors of
entrepreneurial orientation (EO) are risk-taking, competitive aggressiveness
and autonomy. These infuse the practices and decision making styles in
organisations. Wiklund and Shepherd (2005) suggested EO as a moderator
and found that the relationship between knowledge based resources and
performance was stronger among firms with higher levels of EO. According
to Dess and Lumpkin (2005), entrepreneurial orientation (EO) contributes to
overall corporate entrepreneurial intensity in organisations. Entrepreneurial
Intensity is characterised by the following dimensions: innovativeness, risk
taking, pro-activeness, autonomy and competitive aggressiveness. These
dimensions are also referred to in the literature as Entrepreneurial
Orientation (EO) , Morris et al. (2008). It is important to note that while it may
come across that corporate entrepreneurship is only for larger organisations,
it exists at all levels and sizes of organisations, (IRELAND, Kuratko, & Covin,
2003).
2.2.5. Big Five Entrepreneurial Behaviours
Research on entrepreneurial behaviour and motivators has over time found five
salient motivational elements for entrepreneurship and management. These are
according to Venter et al. (2008), self-efficacy, need of achievement, risk taking,
tolerance of ambiguity and locus of control.

46
2.2.5.1. Self-Efficacy (SE)
The first behaviour is self-efficacy, which influences the individual choices and
how and what challenges individuals undertake. Self-efficacy can be developed
over time unlike personality and has been identified as the most critical
entrepreneurial and management paradigm as it influences individual’s
emotional reactions, persistency, choices, effort, goals and ability to cope
Venter et al. (2008). Urban (2008) implemented the first entrepreneurial self-
efficacy (ESE) measurement in South Africa. He found that entrepreneurial self-
efficacy (ESE) can be measured with the following five dimensions: opportunity
recognition, innovation, management, risk taking and financial control.
2.2.5.2. Need for Achievement (NA)
The second behaviour is need for achievement which has three sources: Need
for achievement, need for affiliation, and need for power Venter et al. (2008).
Research indicates that individuals with the “need for achievement” would have
a preference of working alone than in teams. They would normally want to
accomplish goals that are challenging compared to the norms. Individuals with
need for achievement are not motivated by money and perform at higher levels
when they have freedom and autonomy.
2.2.5.3. Risk Taking (RT)
The third behaviour is risk taking which is linked to both levels of locus of control
and tolerance of ambiguity. It relates specifically to the ability to take risks.
According to Dess and Lumpkin (2005), risk taking refers to a firm’s willingness
to seize a venture opportunity even though it does not know whether the
venture will be successful, and to act boldly without knowing the consequences.
2.2.5.4. Tolerance of ambiguity (TA)
The fourth behaviour is tolerance of ambiguity which relates to the ability to be
flexible to changes and circumstances and acting accordingly. Venter et al.
(2008) state that at times entrepreneurs may precede with plans without
47
answering all applicable questions which talks specifically to their ability to be
tolerant to uncertainty.
2.2.5.5. Locus of control (LC)
The firth behaviour is internal locus of control which essentially is the
individual’s perception in terms of their believing that they are in control of their
destiny. Individuals with high internal locus are doers and take responsibility for
their actions. Entrepreneurs tend to have higher levels of internal locus of
control. Conclusion of Literature Review
In an emerging country, such as South Africa, corporate entrepreneurship plays
a pivotal role in the encouragement of entrepreneurial behaviour. Corporate
entrepreneurship in emerging markets is seen as; innovation, venturing, and
strategic renewal (Guth & Ginsberg, 1990; Zahra & Covin, 1995).
We can conclude that corporate entrepreneurship exists in both small and large
organisations, Morris et al. (2008); Antoncic and Hisrich (2004) and that
entrepreneurship may also influence company performance and ultimately
Thurik and Wennekers (1999).
The findings in the literature elucidates that corporate entrepreneurship makes
a significant difference in organisational performance and wealth creation
Antoncic and Hisrich (2004). For organisations to foster corporate
entrepreneurship, organisational support was the most significant element
leading to the creation of corporate entrepreneurship and the interesting point is
that organisational support is primarily influenced by management support
Antoncic and Hisrich (2004) and that top management’s values and
philosophies towards the strategies of the organisation, organisational
resources and competencies relate to the ability a firm has to engage
entrepreneurially, Jeffrey G Covin and Dennis P Slevin (1991). Additionally
organisational entrepreneurial process and behaviour can be encouraged
through an entrepreneurial strategic vision, Ireland et al. (2009).
48
According to Hornsby et al. (2002) top management support is the disposition
and intent of managers encouraging entrepreneurial activity in organisations. It
refers to their commitment towards entrepreneurial activity and their ability to
institutionalize entrepreneurial activity in the organisations’ system and
processes. Their support can be demonstrated in a number of ways such as,
and not limited to; their support towards entrepreneurial activity, allocating
resources and or SME’s including advocating innovative ideas, providing
necessary resources or expertise. Dess and Lumpkin (2005) also states that
organisations with an overall entrepreneurial mission use a top down approach
to stimulate entrepreneurial activity meaning that top leaders of organisations
support programmes and incentives that foster a climate of entrepreneurship.
On the other hand, many of the best ideas of new corporate ventures or
innovation come from bottom-up. Kuratko et al. (2014), state that a key
contributing factor to entrepreneurial behaviour by managers in organisations is
an availability of rewards and resources.

49
CHAPTER 3: RESEARCH METHODOLOGY
To fulfil the research requirements, the methodology took into account both
primary and secondary data. Primary data were the main source of data. The
research methodology consisted of the framework and the design of the
research. It also included the path that was followed to research the variables
and their relationships.
3.1 Research methodology
The research used a quantitative approach. Quantitative approach in research
is used mostly in social sciences to describe variables and determine cause and
effect links between variables. Quantitative research utilises numerical data to
obtain information about the topic with a formal, systematic and objective
process.
The research was basic because this is preferred for academic research. A
quantitative approach allows for statistical analysis through variables. The type
of research is a correlational design because we would like to identify factors
that influence and promote corporate entrepreneurship.
3.2 Research Design
The research design was qualitative in a cross sectional study that took an
exploratory approach with a correlational design type and focused on the
relationships between the measurements by identifying factors that influence
and promote corporate entrepreneurship.
The questionnaire was broken down into three sections. Section one was an
introduction to the study, section two addressed biographical information, and
section three addressed management support, work discretion,
rewards/reinforcements, time availability and organisational boundaries for
corporate entrepreneurship.
50
A total of one hundred and forty-seven (147) electronic questionnaires were
sent out to individuals employed in a financial services organisation. The
organisation is based in Gauteng, South Africa. The advantages of using
questionnaires are that they made it possible to have access to a large
audience. In addition to that, online questionnaires were excellent because they
allow individuals the opportunity to complete them at any given place where
they have access to the internet.
The disadvantages are that there might be low response rates due to busy
schedules of managers in organisations. Another challenge is that for security
purposes certain organisations may not allow their staff to access external
internet links on their network.
3.3 Population and sample
3.3.1 Population
The target population for this research is employed staff in a South African
financial services organisation. These individuals are at different levels in terms
of employment designation to ensure proper representation. This population is
considered relevant because it is most likely to have information and a level of
understanding in terms of corporate entrepreneurship behaviours in a financial
services organisation.
3.3.2 Sample and sampling method
The method used was a probability sampling method which is also known as
simple random sampling. For this research, the intention was to obtain ninety
completed online questionnaires via a self-administered online questionnaire.
Random sampling is the most appropriate as it does not focus on any specific
group and all participants taking part have an equal chance of being selected.

51
Table 3: Profile of respondents
Respondents Number to be sampled
Executives, Senior Managers, Middle managers, entry
level managers, specialists and general staff.
147
3.4 The research instrument
A self-administered online questionnaire was used for gathering data. The
research instrument allowed for the identification of factors that promote and or
prevent corporate entrepreneurship in organisations, to implement a corporate
entrepreneurship strategy. A modification of the Corporate Entrepreneurship
Assessment Instrument (CEAI) which was created by Kuratko et al. (2014) was
developed to measure corporate entrepreneurship in a financial services
organisation.
The questionnaire was broken down into two sections including an introduction
of the study, biographical information and Corporate Entrepreneurship
questions.
This was to help maintain the respondent’s attention during completion of the
questionnaire. The questionnaire was on a five (5) point Likert scale with
closed-ended questions. The questions measured from strongly disagree,
disagree, not sure, agree and strongly agree.
Section one of the questionnaire addressed biographical information of the
respondents.
Section two of the questionnaire addressed corporate entrepreneurship
dimensions which are management support, work discretion,
rewards/reinforcements, time availability and organisational boundaries.

52
3.5 Procedure for data collection
The procedure which was followed to collect data was by the use of online
questionnaires. The data was sent out to participants via email with a link which
directed them to the online survey. Only one response per computer was
allowed. Once participants were logged on to the online survey and had
completed the questionnaires, the completed responses were sent back to a
centralised system for collation. Incomplete questionnaires were not saved or
stored, however they were tracked.
The data collection process involved a combination of primary and secondary
data. Primary data consisted of online electronic self-administered
questionnaires and secondary data consisted of material and information that
comes from other researchers’ reports and were used to add onto existing
primary data.
3.6 Data analysis and interpretation
The following three stages were followed to complete the analysis of the data:
Data Presentation
Descriptive Statistics
Inferential Statistics
3.6.1. Data Presentation
The data presentation phase involved a process of cleaning and organising the
data in the most systematic manner to analyse.
3.6.2. Descriptive Statistics
Descriptive statistics is about summarizing large volumes of data and providing
summaries about samples and measures. In this phase, we described the data
through descriptive analysis. The reason for this is because the research is of a
quantitative nature making this method the most appropriate. In addition to this,
53
when using descriptive analysis, it is recommended that descriptive statistics
are utilised. Descriptive statistics are always calculated first in qualitative
research. Further to this we will dissect the data, hone into specific variables,
profile the population, describe the data and determine associations between
constructs.
3.6.1. Inferential Statistics
In this step we essentially answered the research questions that had been put
forward. At this point, we were able to infer the statistical data findings to the
literature.
3.6.2. Interpretation
We used a statistical analysis package called SAS JMP version 11. The system
enabled the production of bar charts, pie charts and frequency tables to
analyse, and represent the data. To interpret the demographics of the data, bar
graphs and pie charts were utilised. This is the best way to have a clear view of
the data. The remainder of the data, being the corporate entrepreneurship
levels, were represented using a combination of bar charts, frequency tables
and pie charts.
3.7 Limitations of the study
Dess and Beard (1984) state that environmental conditions vary from
one industry to another. Due to the conservative nature of the financial
sector, a potential limitation was the uptake and response percentage.
Potential limitations were that there may be slow response times of the
questionnaires by the respondents.
Total number of completed questionnaires may have been low due to
lack of motivation to complete by respondents.
54
3.8 Validity and Reliability of research
Jeffrey S. Hornsby (2013) conducted a comprehensive assessment of the
Corporate Entrepreneurship Assessment Instrument (CEAI) questionnaire
where it was found to be quite stable. Kuratko et al. (2014) additionally utilised
the Corporate Entrepreneurship Assessment Instrument (CEAI) questionnaire
whereby it was also found to be stable.
According to Cooper and Schindler (2011), validity is described as construct
validity. Validity is also seen as a determinant whether research actually
measures that which it was intended to measure. Additionally, validity measures
the authenticity of the research results. Cooper and Schindler (2011) describe
reliability as a measurement that indicates accuracy. Therefore if research data
is considered unreliable, it also cannot be valid.
3.8.1 External validity
Validity sure that the results obtained from research can be generalised to other
domains, or not, is called external validity. According to Berander (2007),
external validity is also known as generalizability. External validity is used to
determine the applicability of the research results to other domains. External
validity can be threatened by several error-types including a desire by the
respondent to impress the researcher or to emphasize a preference by scoring
survey items at either extreme of the scale. To maximise external validity levels,
this survey was anonymous to mitigate the probability of bias activity and
validity.
3.8.2 Internal validity
Cooper and Schindler (2011) refer to internal validity as the ability of a research
instrument to measure what it is intended to measure. To maximise the validity
of the research, an existing and tested measurement instrument, which is the
corporate entrepreneurship assessment instrument (CEAI) was be utilised to
achieve this.

55
3.8.3 Reliability
Reliability is the degree with which repeated measurements, or measurements
taken under identical circumstances, will yield the same results. Reliability is
defined by Cooper and Schindler (2011) as the degree to which results are
consistent over a period of time. A research instrument is considered reliable if
a study can be reproduced and achieve similar results. Reliability and internal
consistency was tested with the cronbach alpha coefficient. This refers to the
items of each construct.
Table 4: Reliability Estimates for the Study’s Variables
Variables Items Items
left out
Cronbach
Alpha
Reliability
\ Management
Support
1,2,3,4,5,6,7,8,
9,10,11
None 0.89 Good
Work Discretion 12,13,14,15,16,
17
None 0.86 Good
Rewards/Reinforce
ments
18,19,20,21 None 0.77 acceptable
Time Availability 22,23,24 None 0.64 acceptable
Organisational
Boundaries
25,26,27,28 None 0.63 acceptable
In table 4 above are estimates of internal consistency as measured by
Cronbach’s alpha coefficient. They all exceeded 0.60 on the Cronbach’s alpha
measurement. This means that the constructs were reliable and that all the
constructs were acceptable.
56
CHAPTER 4: PRESENTATION OF RESULTS
4.1. Introduction
The results are presented in both bar and pie charts. Pie charts were used to
specifically represent biographical information while bar charts were used to
represent the corporate entrepreneurship constructs.
4.2. Demographic Profile of Respondents
Demographic variables that were studied and analysed were gender, age, level
in their organisation, employment period at the current organisation, total years
of employment (full career) and highest qualification attained.

57
4.1.1. Gender
Figure 11: Gender of respondents (n=104)
Table 5: Gender frequencies
Frequencies
Level Count %
Female 54 52%
Male 50 48%
Total 104 100%
The results presented in figure 10 indicated that there was a fair representation
from both males and females. There gender split of respondents was 53%
female and 48% male.
52.0%
48.0%
What is your gender?
Female
Male
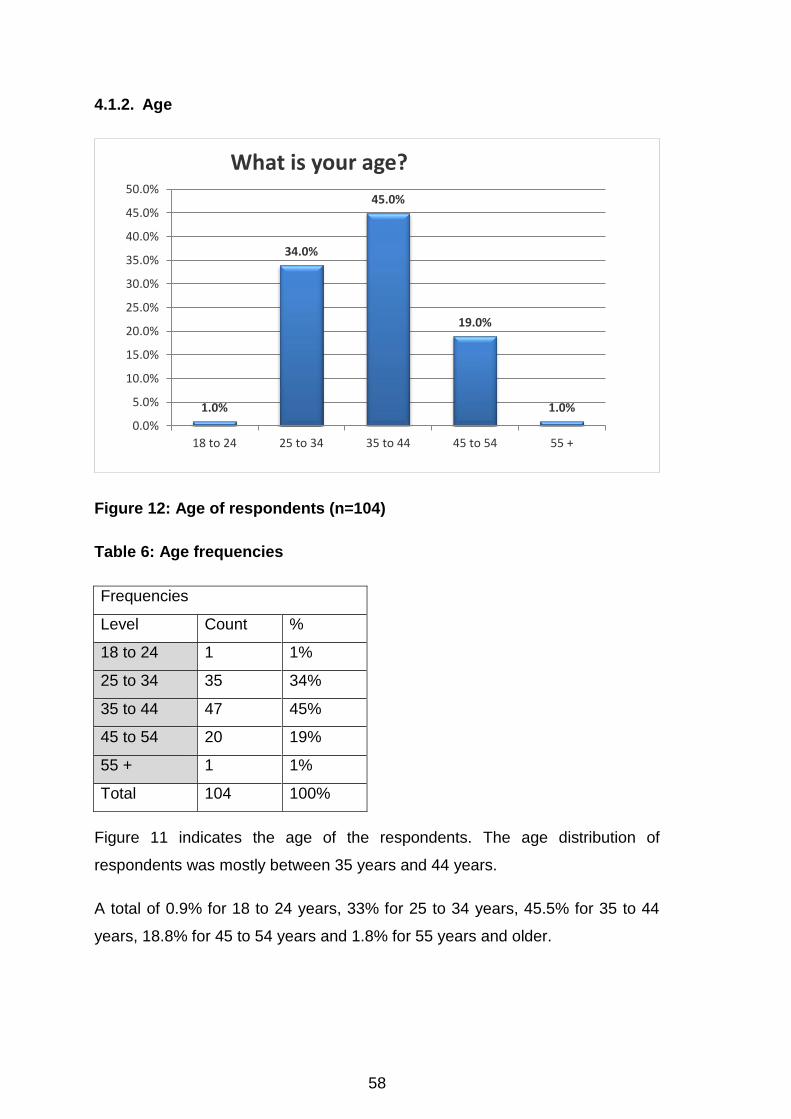
58
4.1.2. Age
Figure 12: Age of respondents (n=104)
Table 6: Age frequencies
Frequencies
Level Count %
18 to 24 1 1%
25 to 34 35 34%
35 to 44 47 45%
45 to 54 20 19%
55 + 1 1%
Total 104 100%
Figure 11 indicates the age of the respondents. The age distribution of
respondents was mostly between 35 years and 44 years.
A total of 0.9% for 18 to 24 years, 33% for 25 to 34 years, 45.5% for 35 to 44
years, 18.8% for 45 to 54 years and 1.8% for 55 years and older.
1.0%
34.0%
45.0%
19.0%
1.0%
18 to 24 25 to 34 35 to 44 45 to 54 55 +
0.0%
5.0%
10.0%
15.0%
20.0%
25.0%
30.0%
35.0%
40.0%
45.0%
50.0%
What is your age?
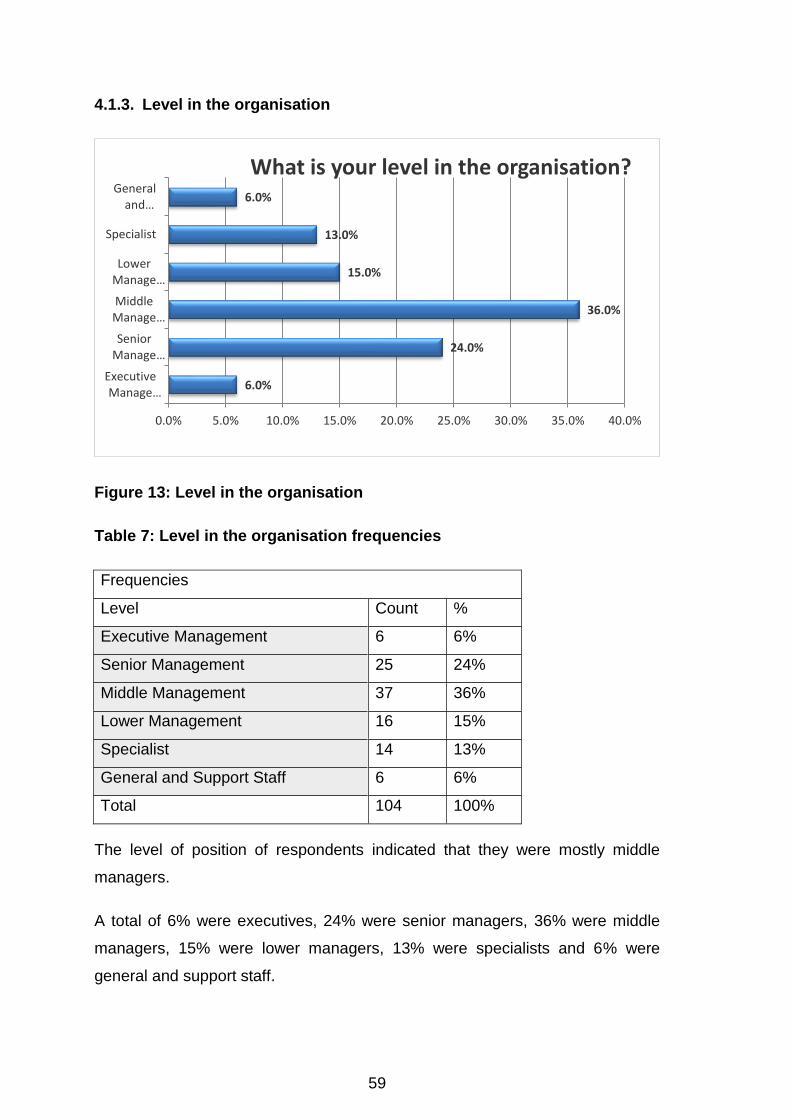
59
4.1.3. Level in the organisation
Figure 13: Level in the organisation
Table 7: Level in the organisation frequencies
Frequencies
Level Count %
Executive Management 6 6%
Senior Management 25 24%
Middle Management 37 36%
Lower Management 16 15%
Specialist 14 13%
General and Support Staff 6 6%
Total 104 100%
The level of position of respondents indicated that they were mostly middle
managers.
A total of 6% were executives, 24% were senior managers, 36% were middle
managers, 15% were lower managers, 13% were specialists and 6% were
general and support staff.
6.0%
24.0%
36.0%
15.0%
13.0%
6.0%
ExecutiveManage…
SeniorManage…
MiddleManage…
LowerManage…
Specialist
Generaland…
0.0% 5.0% 10.0% 15.0% 20.0% 25.0% 30.0% 35.0% 40.0%
What is your level in the organisation?
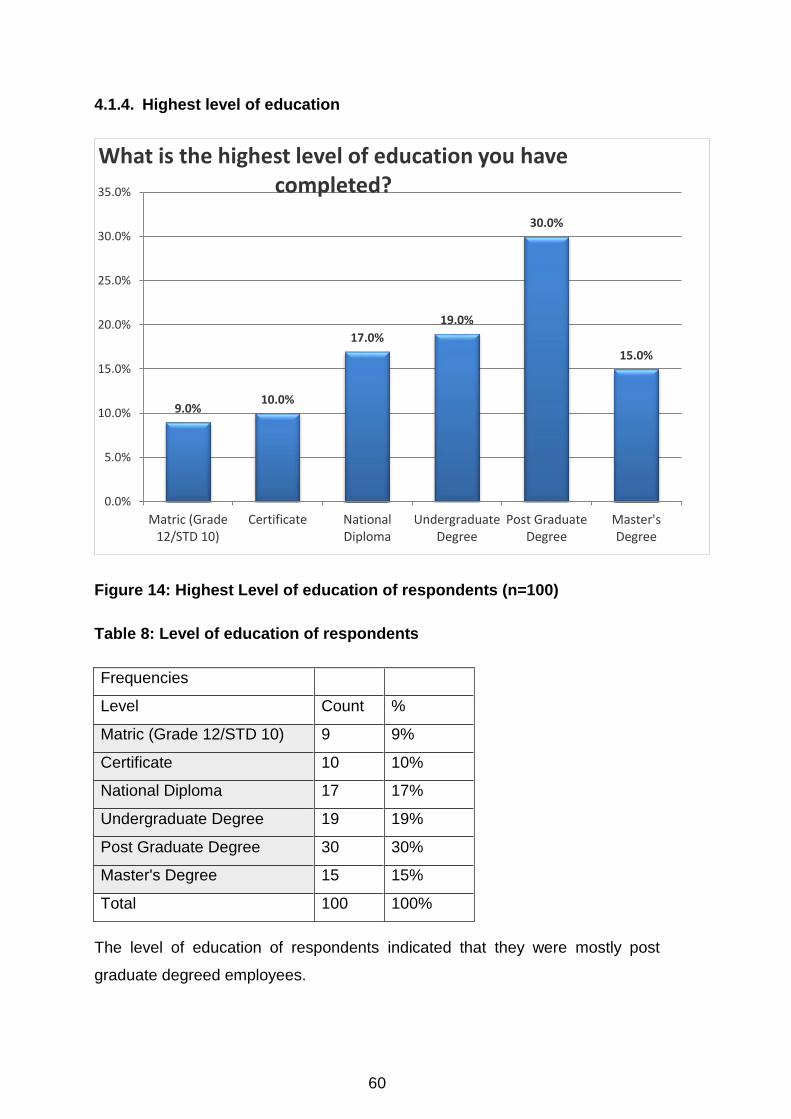
60
4.1.4. Highest level of education
Figure 14: Highest Level of education of respondents (n=100)
Table 8: Level of education of respondents
Frequencies
Level Count %
Matric (Grade 12/STD 10) 9 9%
Certificate 10 10%
National Diploma 17 17%
Undergraduate Degree 19 19%
Post Graduate Degree 30 30%
Master's Degree 15 15%
Total 100 100%
The level of education of respondents indicated that they were mostly post
graduate degreed employees.
9.0% 10.0%
17.0%
19.0%
30.0%
15.0%
Matric (Grade12/STD 10)
Certificate NationalDiploma
UndergraduateDegree
Post GraduateDegree
Master'sDegree
0.0%
5.0%
10.0%
15.0%
20.0%
25.0%
30.0%
35.0%
What is the highest level of education you have completed?
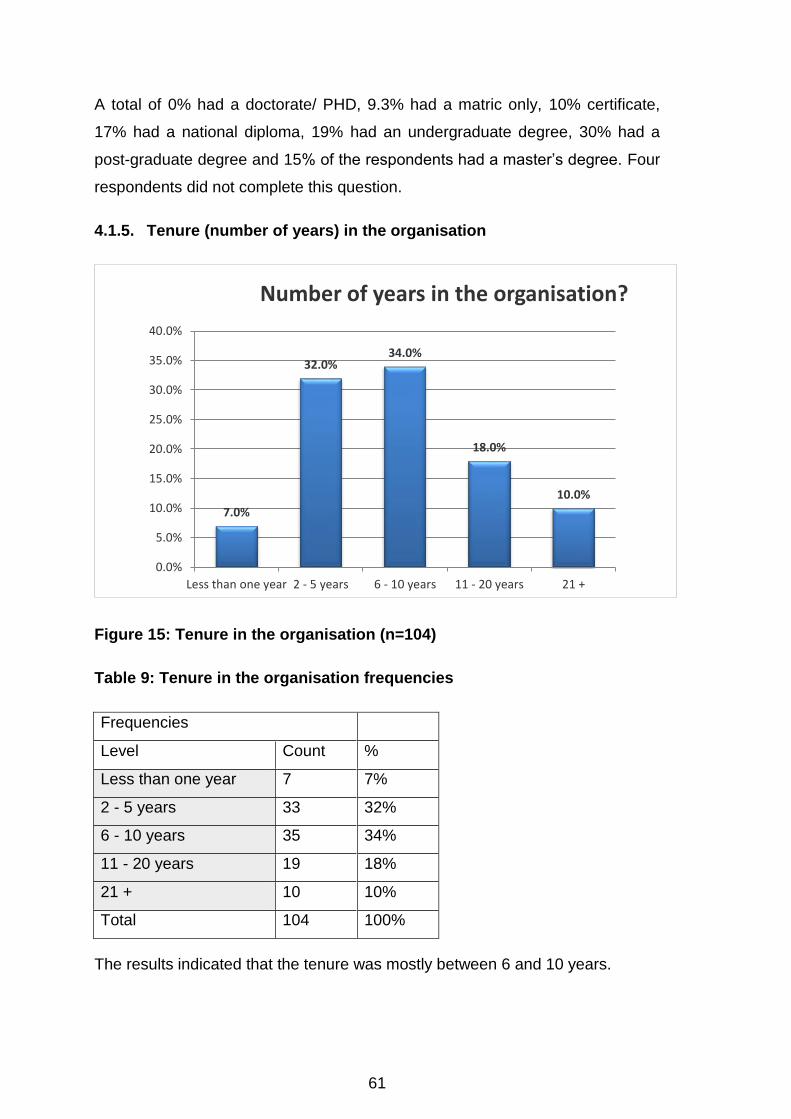
61
A total of 0% had a doctorate/ PHD, 9.3% had a matric only, 10% certificate,
17% had a national diploma, 19% had an undergraduate degree, 30% had a
post-graduate degree and 15% of the respondents had a master’s degree. Four
respondents did not complete this question.
4.1.5. Tenure (number of years) in the organisation
Figure 15: Tenure in the organisation (n=104)
Table 9: Tenure in the organisation frequencies
Frequencies
Level Count %
Less than one year 7 7%
2 - 5 years 33 32%
6 - 10 years 35 34%
11 - 20 years 19 18%
21 + 10 10%
Total 104 100%
The results indicated that the tenure was mostly between 6 and 10 years.
7.0%
32.0% 34.0%
18.0%
10.0%
Less than one year 2 - 5 years 6 - 10 years 11 - 20 years 21 +
0.0%
5.0%
10.0%
15.0%
20.0%
25.0%
30.0%
35.0%
40.0%
Number of years in the organisation?
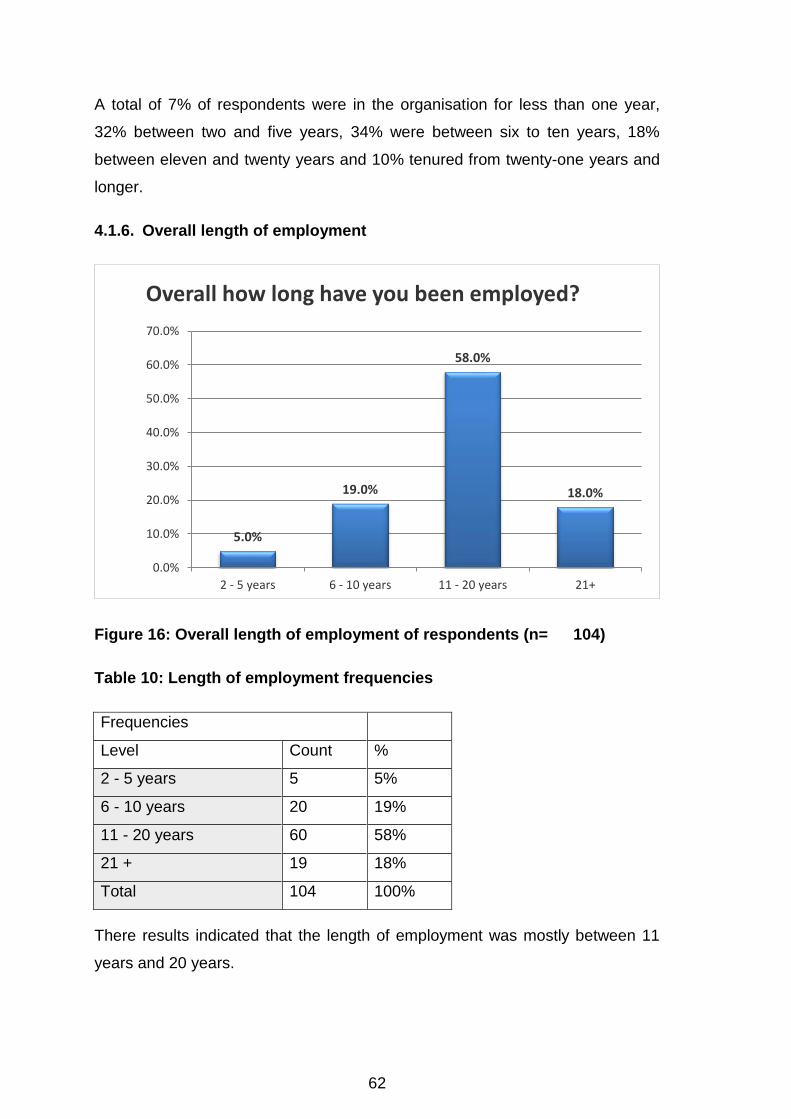
62
A total of 7% of respondents were in the organisation for less than one year,
32% between two and five years, 34% were between six to ten years, 18%
between eleven and twenty years and 10% tenured from twenty-one years and
longer.
4.1.6. Overall length of employment
Figure 16: Overall length of employment of respondents (n= 104)
Table 10: Length of employment frequencies
Frequencies
Level Count %
2 - 5 years 5 5%
6 - 10 years 20 19%
11 - 20 years 60 58%
21 + 19 18%
Total 104 100%
There results indicated that the length of employment was mostly between 11
years and 20 years.
5.0%
19.0%
58.0%
18.0%
2 - 5 years 6 - 10 years 11 - 20 years 21+
0.0%
10.0%
20.0%
30.0%
40.0%
50.0%
60.0%
70.0%
Overall how long have you been employed?
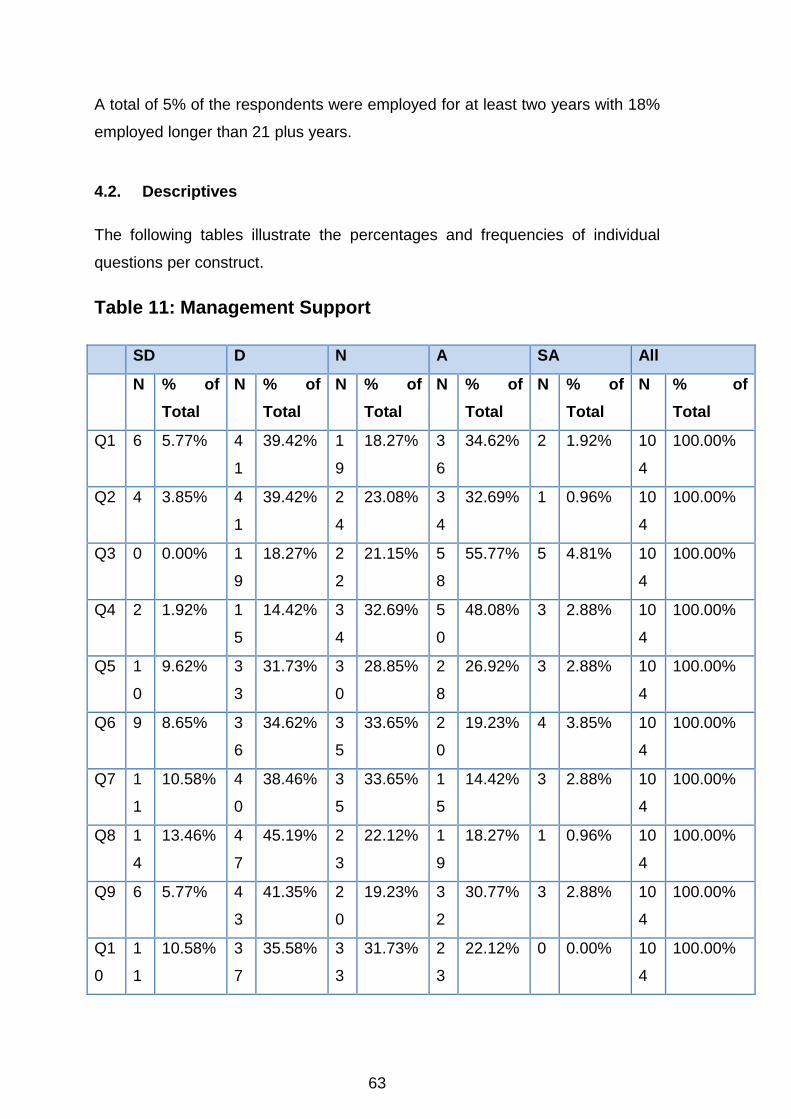
63
A total of 5% of the respondents were employed for at least two years with 18%
employed longer than 21 plus years.
4.2. Descriptives
The following tables illustrate the percentages and frequencies of individual
questions per construct.
Table 11: Management Support
SD D N A SA All
N % of
Total
N % of
Total
N % of
Total
N % of
Total
N % of
Total
N % of
Total
Q1 6 5.77% 4
1
39.42% 1
9
18.27% 3
6
34.62% 2 1.92% 10
4
100.00%
Q2 4 3.85% 4
1
39.42% 2
4
23.08% 3
4
32.69% 1 0.96% 10
4
100.00%
Q3 0 0.00% 1
9
18.27% 2
2
21.15% 5
8
55.77% 5 4.81% 10
4
100.00%
Q4 2 1.92% 1
5
14.42% 3
4
32.69% 5
0
48.08% 3 2.88% 10
4
100.00%
Q5 1
0
9.62% 3
3
31.73% 3
0
28.85% 2
8
26.92% 3 2.88% 10
4
100.00%
Q6 9 8.65% 3
6
34.62% 3
5
33.65% 2
0
19.23% 4 3.85% 10
4
100.00%
Q7 1
1
10.58% 4
0
38.46% 3
5
33.65% 1
5
14.42% 3 2.88% 10
4
100.00%
Q8 1
4
13.46% 4
7
45.19% 2
3
22.12% 1
9
18.27% 1 0.96% 10
4
100.00%
Q9 6 5.77% 4
3
41.35% 2
0
19.23% 3
2
30.77% 3 2.88% 10
4
100.00%
Q1
0
1
1
10.58% 3
7
35.58% 3
3
31.73% 2
3
22.12% 0 0.00% 10
4
100.00%
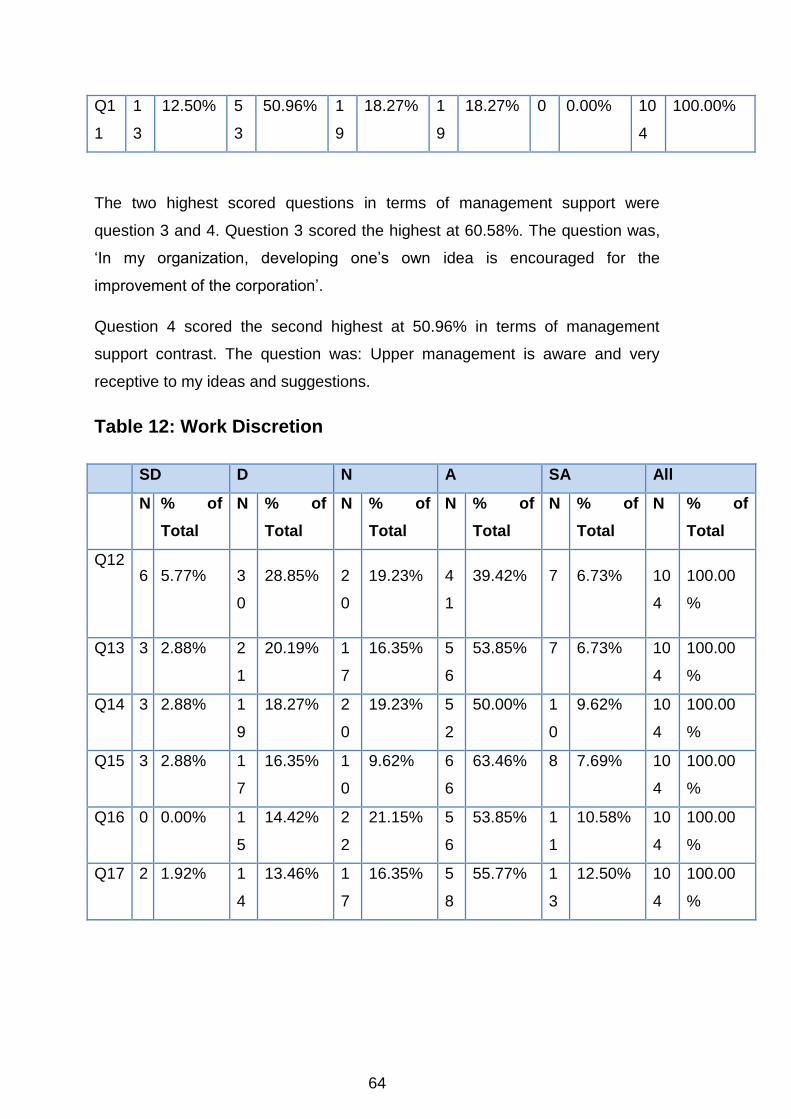
64
Q1
1
1
3
12.50% 5
3
50.96% 1
9
18.27% 1
9
18.27% 0 0.00% 10
4
100.00%
The two highest scored questions in terms of management support were
question 3 and 4. Question 3 scored the highest at 60.58%. The question was,
‘In my organization, developing one’s own idea is encouraged for the
improvement of the corporation’.
Question 4 scored the second highest at 50.96% in terms of management
support contrast. The question was: Upper management is aware and very
receptive to my ideas and suggestions.
Table 12: Work Discretion
SD D N A SA All
N % of
Total
N % of
Total
N % of
Total
N % of
Total
N % of
Total
N % of
Total
Q12 6 5.77% 3
0
28.85% 2
0
19.23% 4
1
39.42% 7 6.73% 10
4
100.00
%
Q13 3 2.88% 2
1
20.19% 1
7
16.35% 5
6
53.85% 7 6.73% 10
4
100.00
%
Q14 3 2.88% 1
9
18.27% 2
0
19.23% 5
2
50.00% 1
0
9.62% 10
4
100.00
%
Q15 3 2.88% 1
7
16.35% 1
0
9.62% 6
6
63.46% 8 7.69% 10
4
100.00
%
Q16 0 0.00% 1
5
14.42% 2
2
21.15% 5
6
53.85% 1
1
10.58% 10
4
100.00
%
Q17 2 1.92% 1
4
13.46% 1
7
16.35% 5
8
55.77% 1
3
12.50% 10
4
100.00
%

65
Question 15 scored the highest in terms of work discretion construct at
71.15%.The question was: it is basically my own responsibility to decide how
my job gets done.
Table 13: Rewards/ Reinforcement
SD D N A SA All
N % of
Total
N % of
Total
N % of
Total
N % of
Total
N % of
Total
N % of
Total
Q18 7 6.73
%
4
1
39.42% 2
7
25.96% 2
4
23.08% 5 4.81% 10
4
100.00
%
Q19 2 1.92
%
2
0
19.23% 2
8
26.92% 3
9
37.50% 1
5
14.42
%
10
4
100.00
%
Q20 1 0.96
%
1
4
13.46% 2
2
21.15% 5
1
49.04% 1
6
15.38
%
10
4
100.00
%
Q21 2 1.92
%
1
5
14.42% 2
6
25.00% 4
1
39.42% 2
0
19.23
%
10
4
100.00
%
In terms of rewards/reinforcement, question 20 scored the highest in terms the
construct at 64.2%.The question was: My manager would tell his/her boss if my
work was outstanding. This suggests that the respondents are convinced that
there is a level of exposure in the organisation.
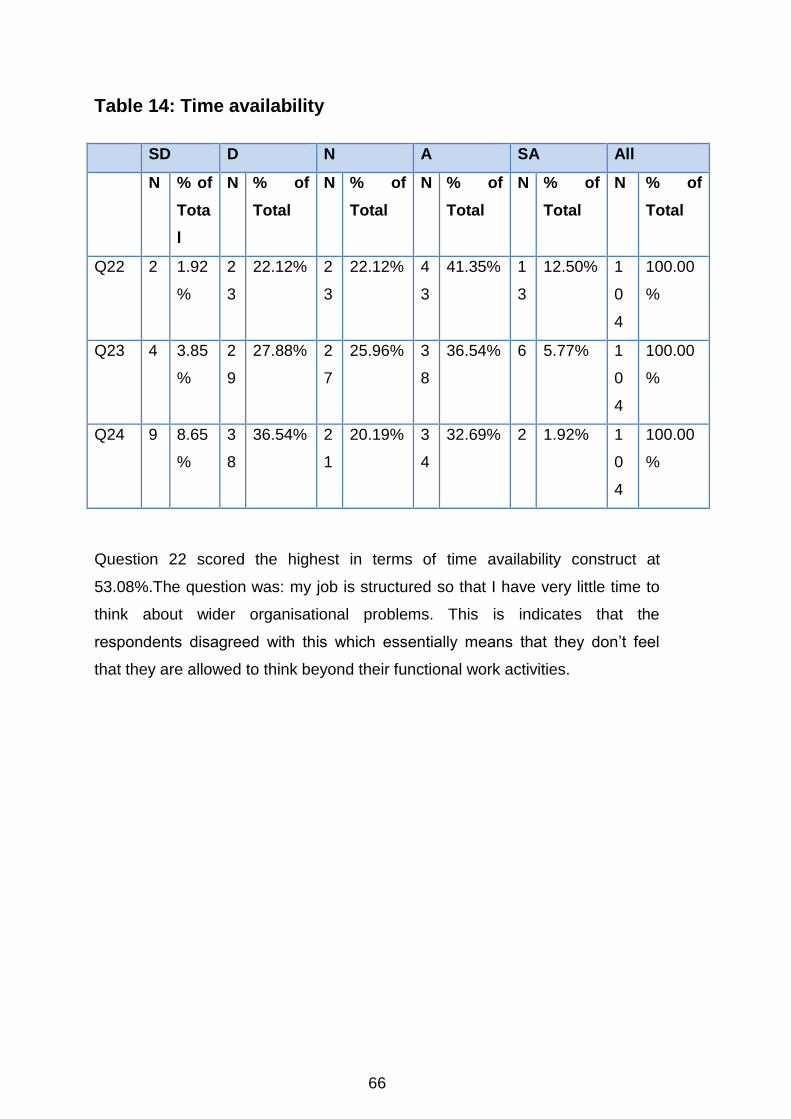
66
Table 14: Time availability
SD D N A SA All
N % of
Tota
l
N % of
Total
N % of
Total
N % of
Total
N % of
Total
N % of
Total
Q22 2 1.92
%
2
3
22.12% 2
3
22.12% 4
3
41.35% 1
3
12.50% 1
0
4
100.00
%
Q23 4 3.85
%
2
9
27.88% 2
7
25.96% 3
8
36.54% 6 5.77% 1
0
4
100.00
%
Q24 9 8.65
%
3
8
36.54% 2
1
20.19% 3
4
32.69% 2 1.92% 1
0
4
100.00
%
Question 22 scored the highest in terms of time availability construct at
53.08%.The question was: my job is structured so that I have very little time to
think about wider organisational problems. This is indicates that the
respondents disagreed with this which essentially means that they don’t feel
that they are allowed to think beyond their functional work activities.
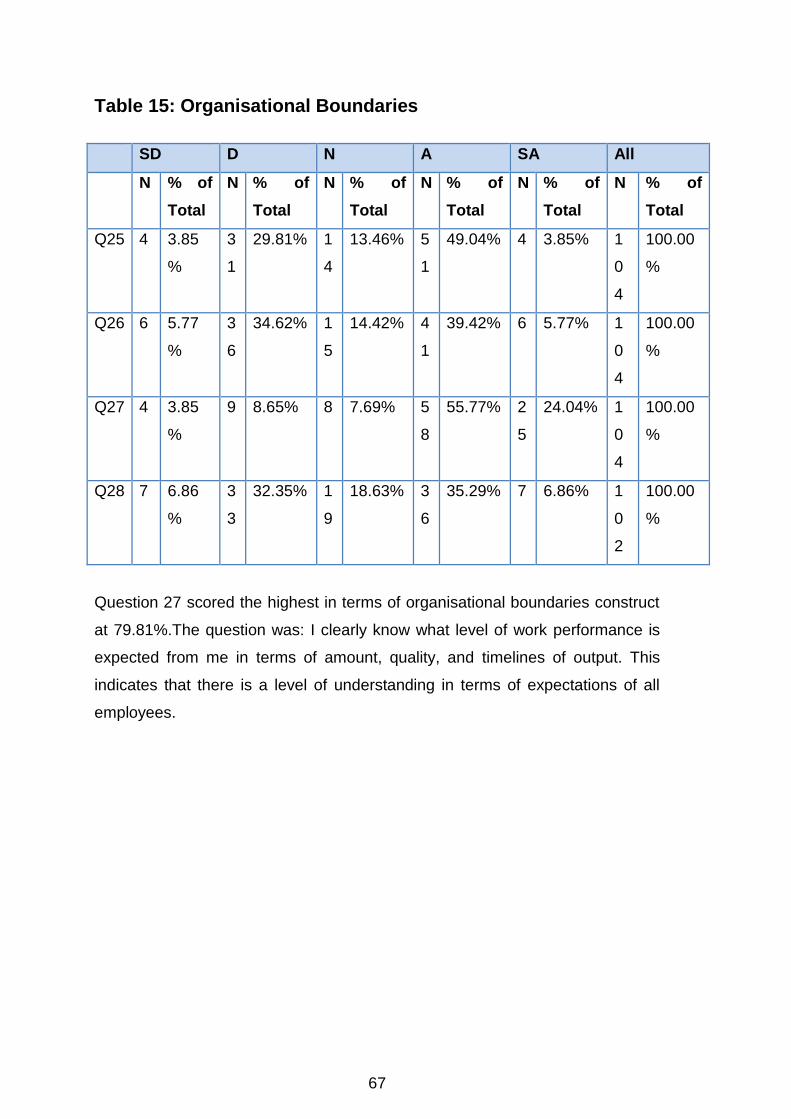
67
Table 15: Organisational Boundaries
SD D N A SA All
N % of
Total
N % of
Total
N % of
Total
N % of
Total
N % of
Total
N % of
Total
Q25 4 3.85
%
3
1
29.81% 1
4
13.46% 5
1
49.04% 4 3.85% 1
0
4
100.00
%
Q26 6 5.77
%
3
6
34.62% 1
5
14.42% 4
1
39.42% 6 5.77% 1
0
4
100.00
%
Q27 4 3.85
%
9 8.65% 8 7.69% 5
8
55.77% 2
5
24.04% 1
0
4
100.00
%
Q28 7 6.86
%
3
3
32.35% 1
9
18.63% 3
6
35.29% 7 6.86% 1
0
2
100.00
%
Question 27 scored the highest in terms of organisational boundaries construct
at 79.81%.The question was: I clearly know what level of work performance is
expected from me in terms of amount, quality, and timelines of output. This
indicates that there is a level of understanding in terms of expectations of all
employees.
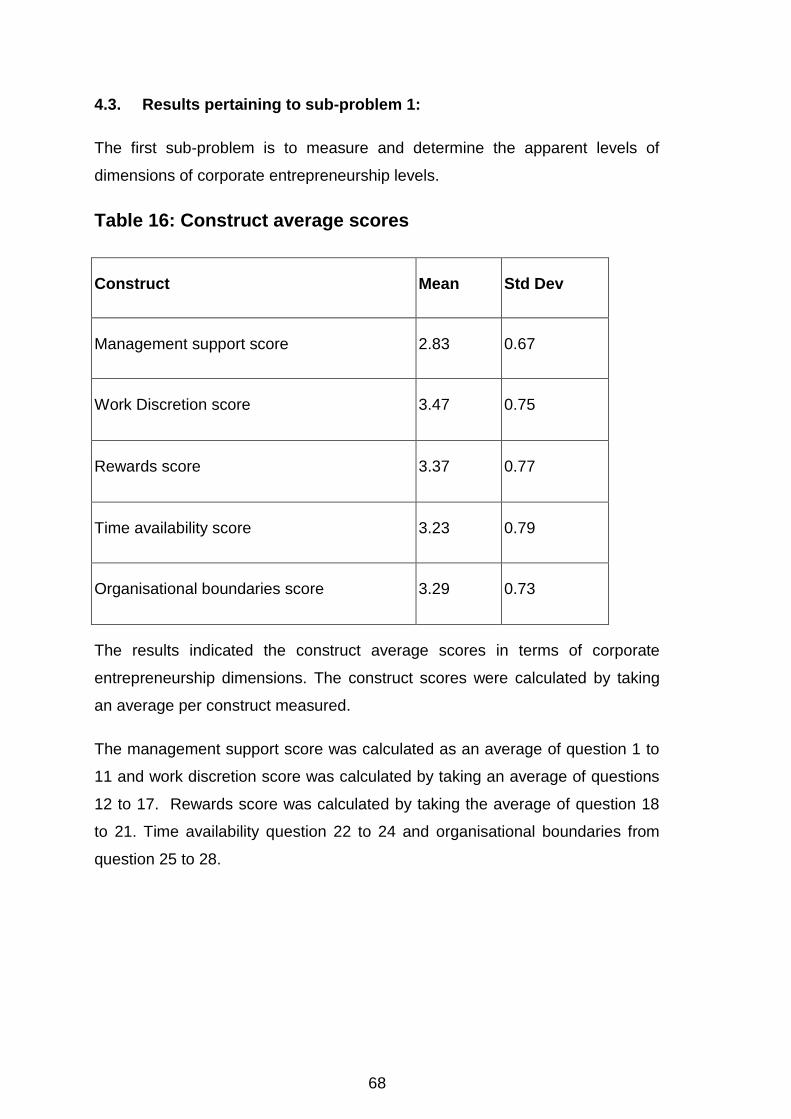
68
4.3. Results pertaining to sub-problem 1:
The first sub-problem is to measure and determine the apparent levels of
dimensions of corporate entrepreneurship levels.
Table 16: Construct average scores
Construct Mean Std Dev
Management support score 2.83 0.67
Work Discretion score 3.47 0.75
Rewards score 3.37 0.77
Time availability score 3.23 0.79
Organisational boundaries score 3.29 0.73
The results indicated the construct average scores in terms of corporate
entrepreneurship dimensions. The construct scores were calculated by taking
an average per construct measured.
The management support score was calculated as an average of question 1 to
11 and work discretion score was calculated by taking an average of questions
12 to 17. Rewards score was calculated by taking the average of question 18
to 21. Time availability question 22 to 24 and organisational boundaries from
question 25 to 28.
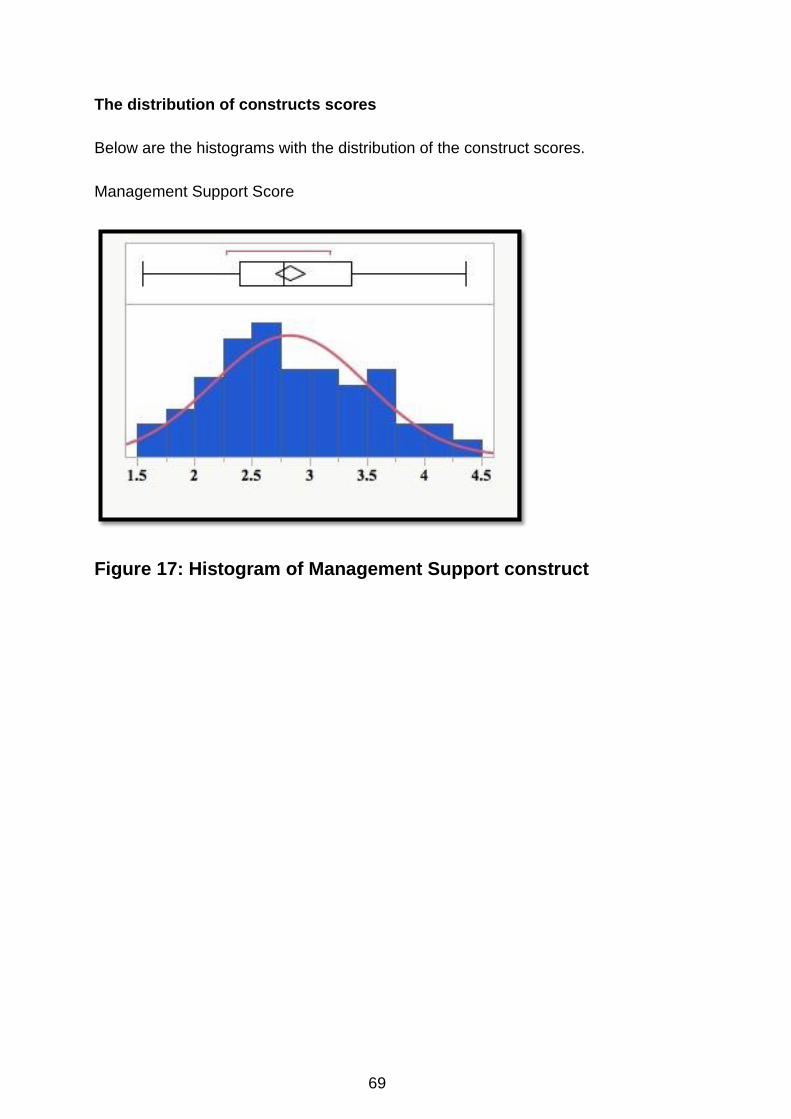
69
The distribution of constructs scores
Below are the histograms with the distribution of the construct scores.
Management Support Score
Figure 17: Histogram of Management Support construct
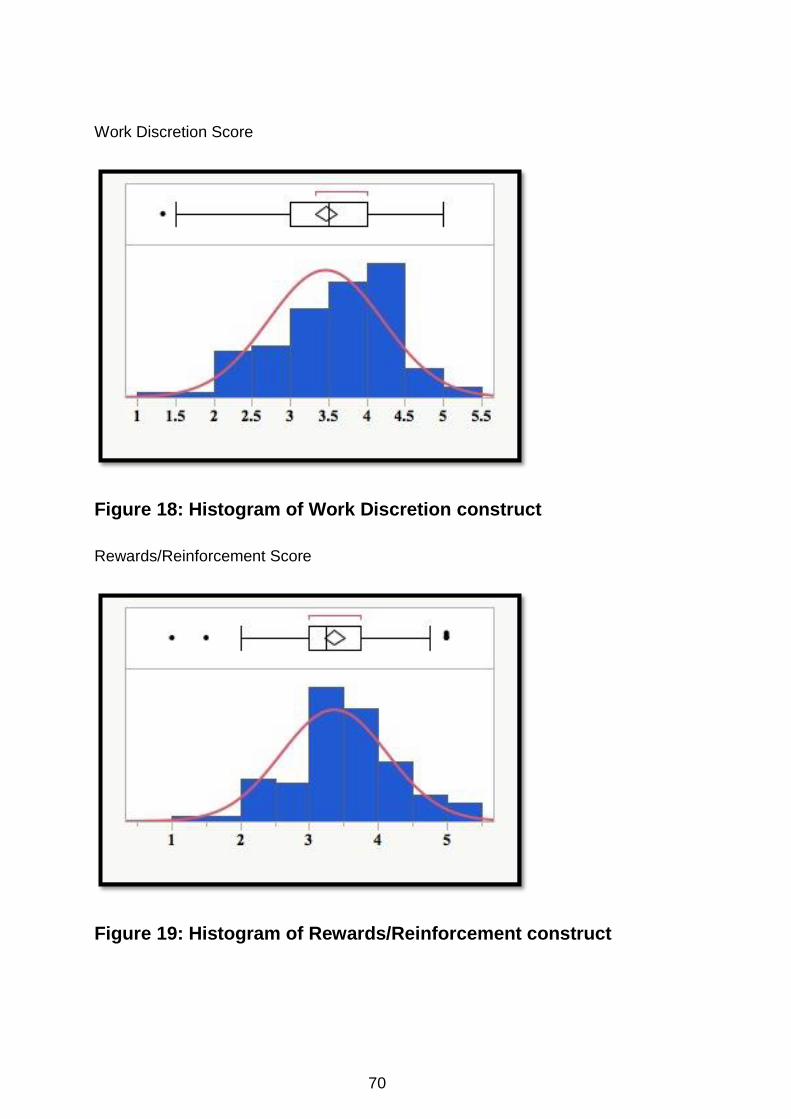
70
Work Discretion Score
Figure 18: Histogram of Work Discretion construct
Rewards/Reinforcement Score
Figure 19: Histogram of Rewards/Reinforcement construct

71
Time Availability Score
Figure 20: Histogram of Time Availability Score
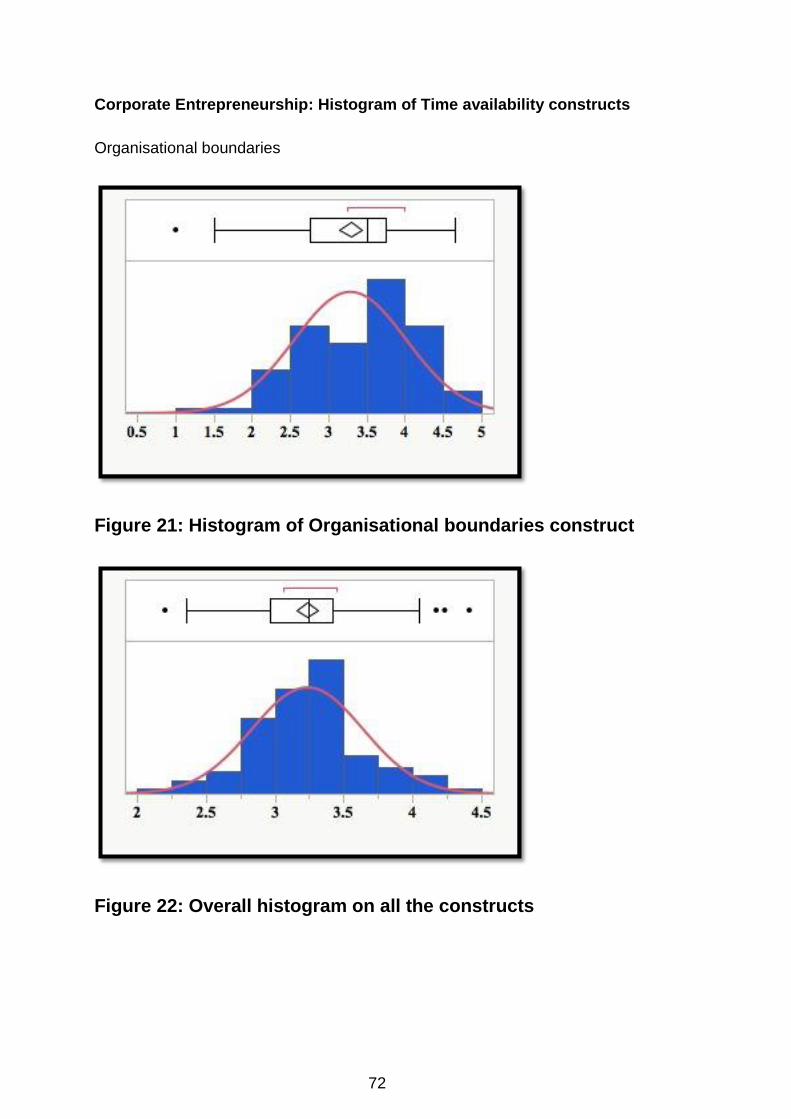
72
Corporate Entrepreneurship: Histogram of Time availability constructs
Organisational boundaries
Figure 21: Histogram of Organisational boundaries construct
Figure 22: Overall histogram on all the constructs
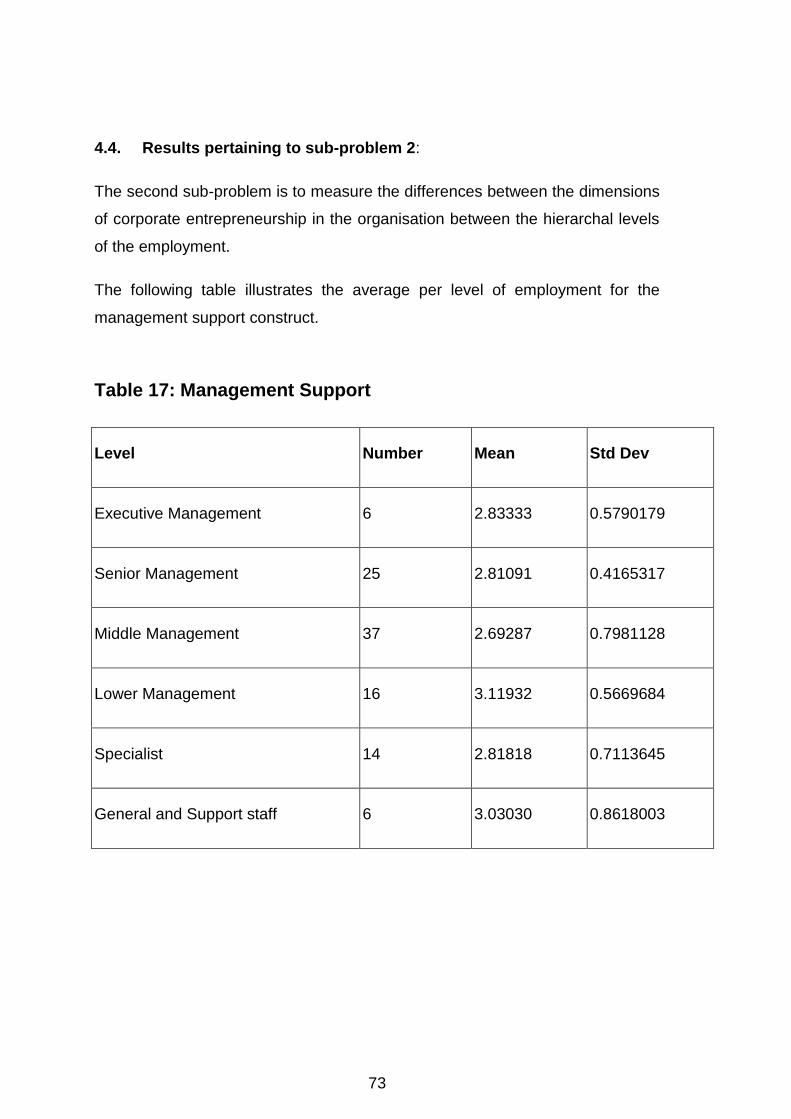
73
4.4. Results pertaining to sub-problem 2:
The second sub-problem is to measure the differences between the dimensions
of corporate entrepreneurship in the organisation between the hierarchal levels
of the employment.
The following table illustrates the average per level of employment for the
management support construct.
Table 17: Management Support
Level Number Mean Std Dev
Executive Management 6 2.83333 0.5790179
Senior Management 25 2.81091 0.4165317
Middle Management 37 2.69287 0.7981128
Lower Management 16 3.11932 0.5669684
Specialist 14 2.81818 0.7113645
General and Support staff 6 3.03030 0.8618003
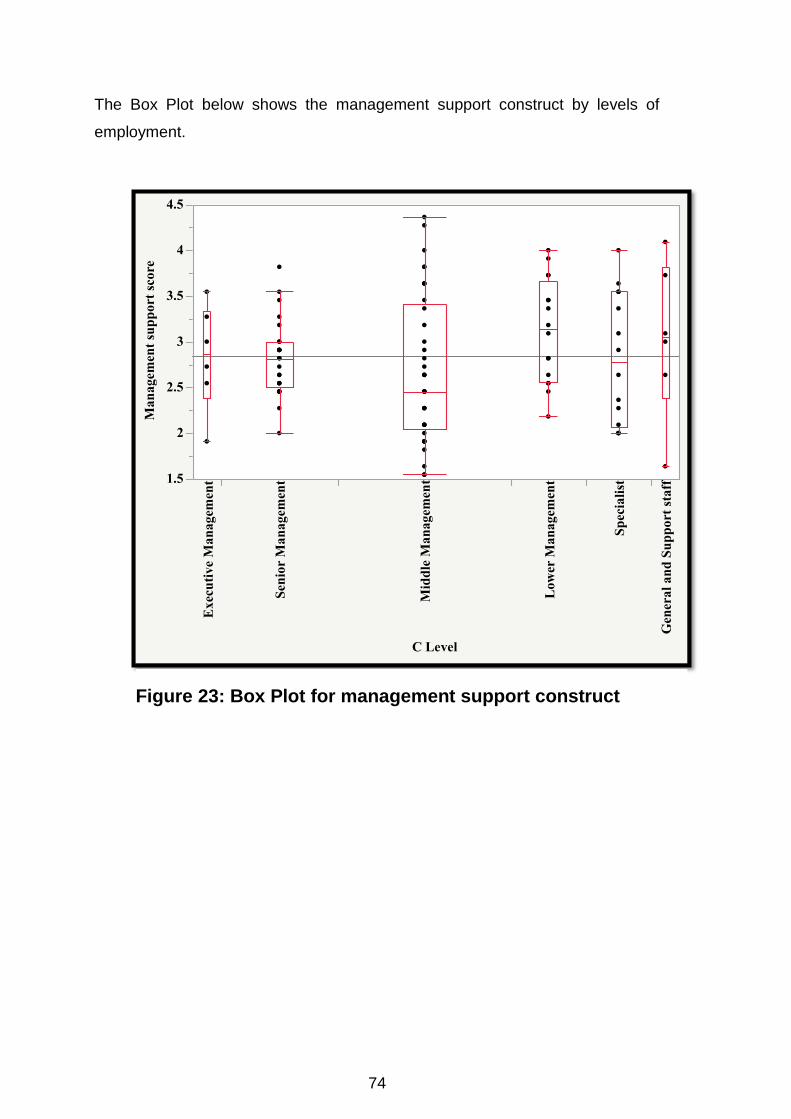
74
The Box Plot below shows the management support construct by levels of
employment.
1.5
2
2.5
3
3.5
4
4.5
Ma
na
gem
ent
sup
po
rt s
core
Ex
ecu
tiv
e M
an
ag
emen
t
Sen
ior
Ma
na
gem
ent
Mid
dle
Ma
na
gem
ent
Lo
wer
Ma
na
gem
ent
Sp
ecia
list
Gen
era
l a
nd
Su
pp
ort
sta
ff
C Level
Figure 23: Box Plot for management support construct
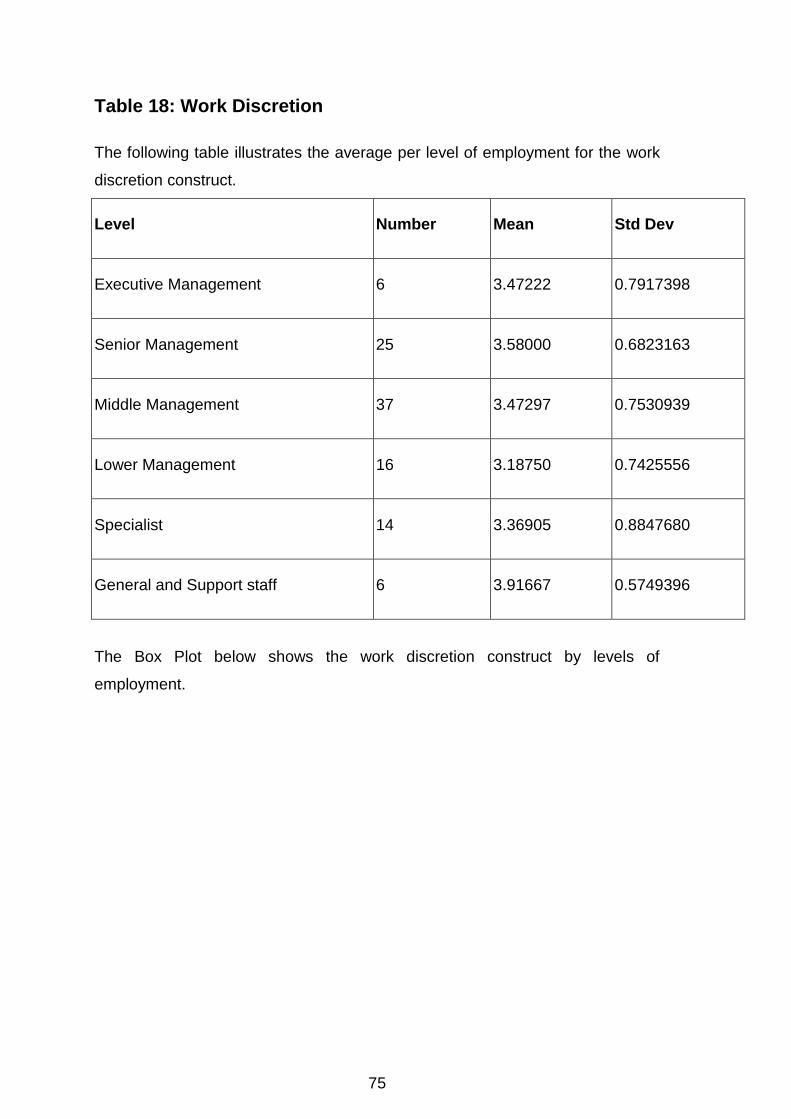
75
Table 18: Work Discretion
The following table illustrates the average per level of employment for the work
discretion construct.
Level Number Mean Std Dev
Executive Management 6 3.47222 0.7917398
Senior Management 25 3.58000 0.6823163
Middle Management 37 3.47297 0.7530939
Lower Management 16 3.18750 0.7425556
Specialist 14 3.36905 0.8847680
General and Support staff 6 3.91667 0.5749396
The Box Plot below shows the work discretion construct by levels of
employment.

76
Figure 24: Box Plot for work discretion construct
1
1.5
2
2.5
3
3.5
4
4.5
5
5.5W
ork
Dis
cret
ion
sco
re
Ex
ecu
tive
Ma
na
gem
ent
Sen
ior
Ma
na
gem
ent
Mid
dle
Ma
na
gem
ent
Low
er M
an
ag
emen
t
Sp
ecia
list
Gen
eral
an
d S
up
po
rt s
taff
C Level
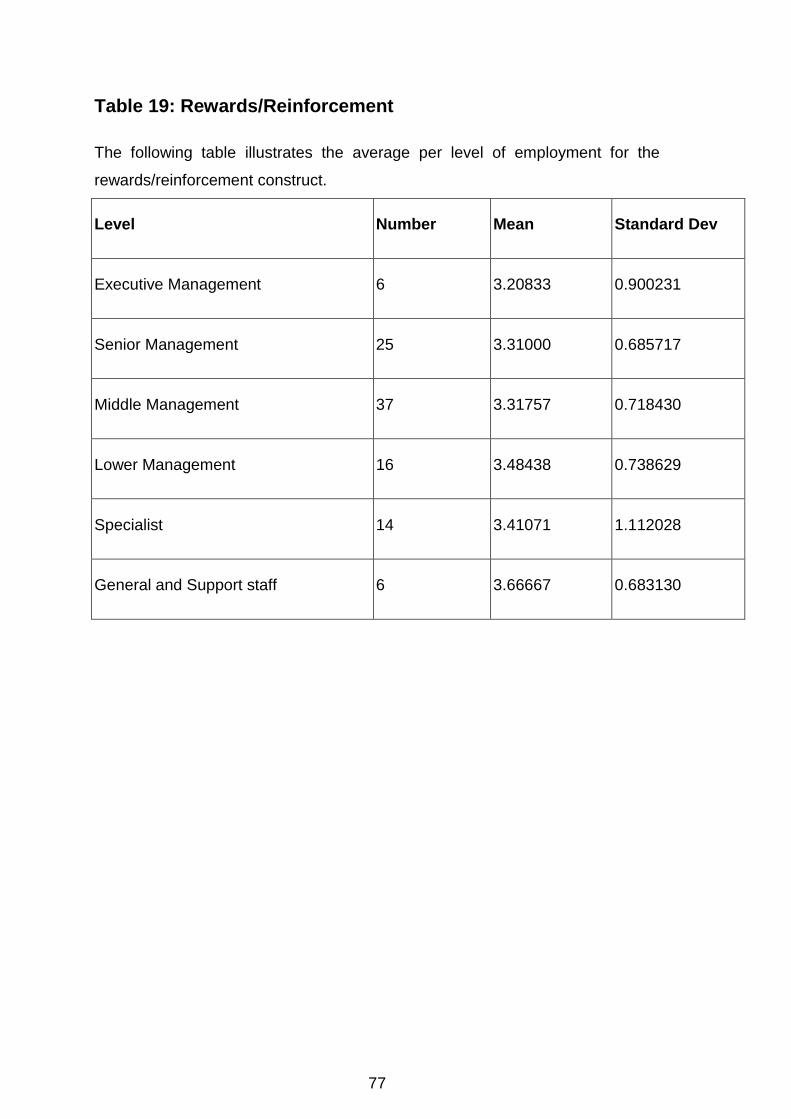
77
Table 19: Rewards/Reinforcement
The following table illustrates the average per level of employment for the
rewards/reinforcement construct.
Level Number Mean Standard Dev
Executive Management 6 3.20833 0.900231
Senior Management 25 3.31000 0.685717
Middle Management 37 3.31757 0.718430
Lower Management 16 3.48438 0.738629
Specialist 14 3.41071 1.112028
General and Support staff 6 3.66667 0.683130
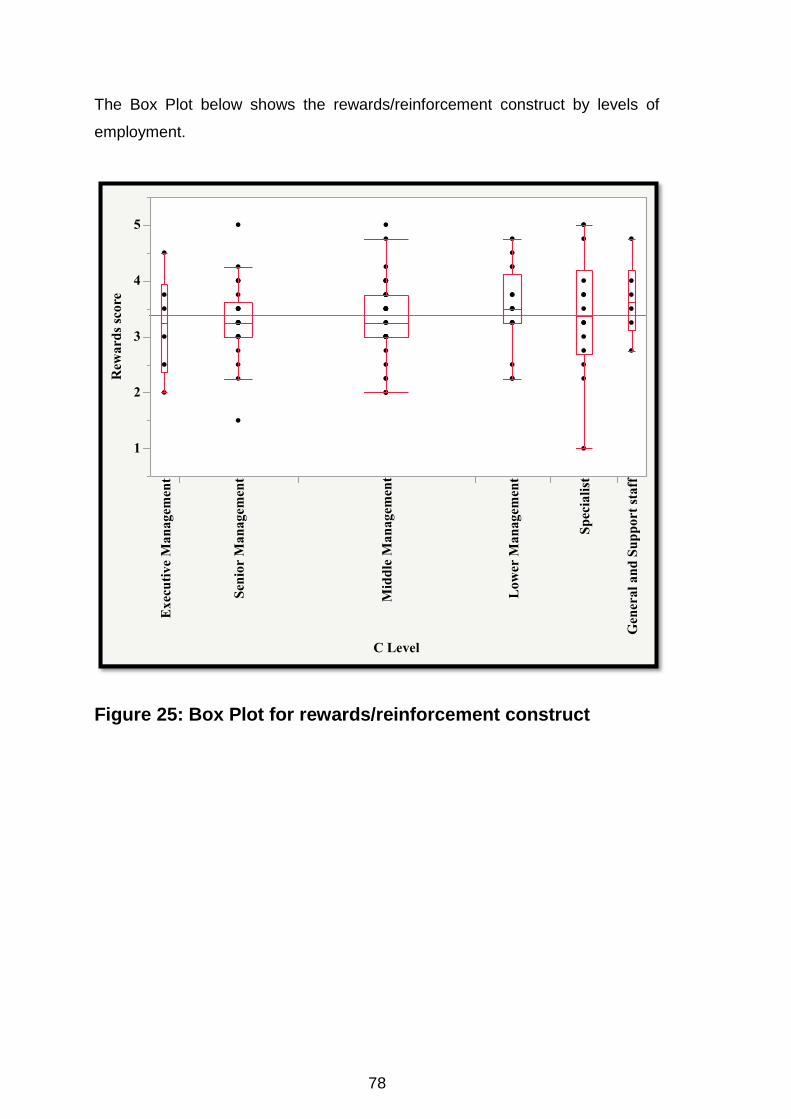
78
The Box Plot below shows the rewards/reinforcement construct by levels of
employment.
Figure 25: Box Plot for rewards/reinforcement construct
1
2
3
4
5
Rew
ard
s sc
ore
Ex
ecu
tiv
e M
an
ag
emen
t
Sen
ior
Ma
na
gem
ent
Mid
dle
Ma
na
gem
ent
Low
er M
an
ag
emen
t
Sp
ecia
list
Gen
eral
an
d S
up
po
rt s
taff
C Level

79
Table 20: Time availability
The following table illustrates the averages per level of employment for the time
availability construct.
Level Number Mean Std Dev
Executive Management 6 3.55556 0.9108401
Senior Management 25 3.44000 0.6577177
Middle Management 37 3.10811 0.7497080
Lower Management 16 3.06250 0.8539126
Specialist 14 3.50000 0.7595545
General and Support staff 6 2.66667 0.9888265
The Box Plot below shows the time availability construct by levels of
employment.
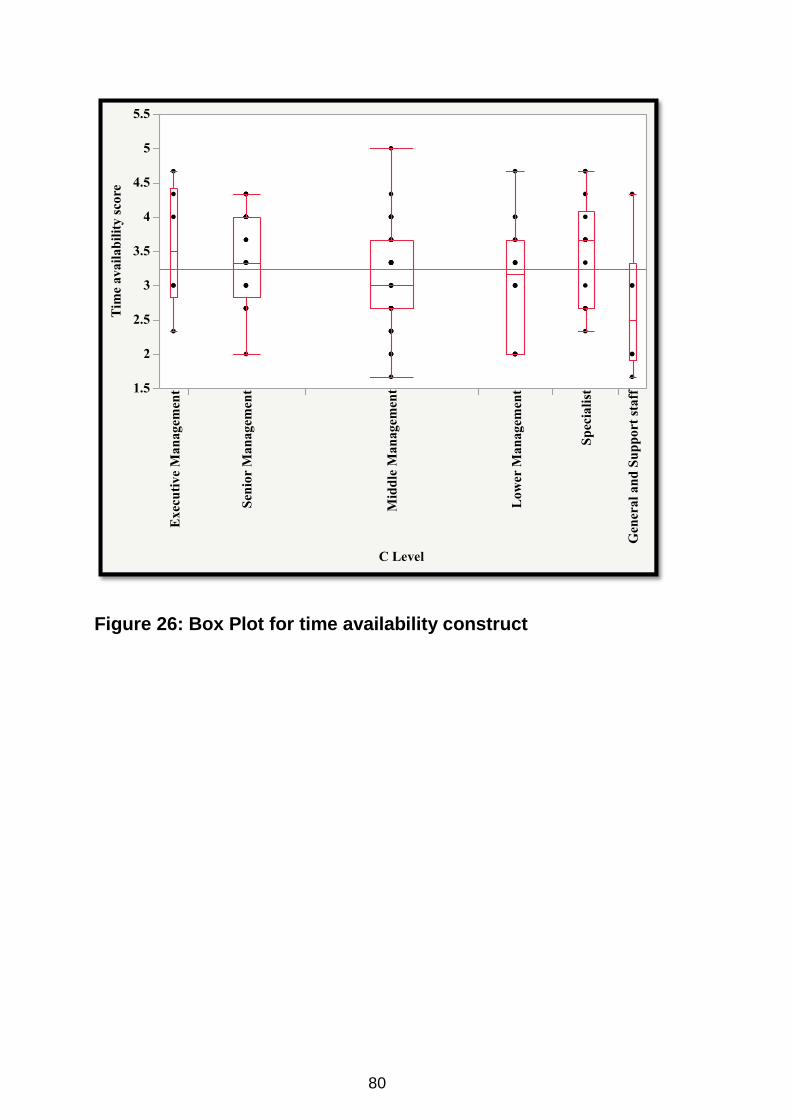
80
Figure 26: Box Plot for time availability construct
1.5
2
2.5
3
3.5
4
4.5
5
5.5T
ime
ava
ila
bil
ity
sco
re
Ex
ecu
tive
Ma
na
gem
ent
Sen
ior
Ma
na
gem
ent
Mid
dle
Ma
na
gem
ent
Low
er M
an
ag
emen
t
Sp
ecia
list
Gen
eral
an
d S
up
po
rt s
taff
C Level
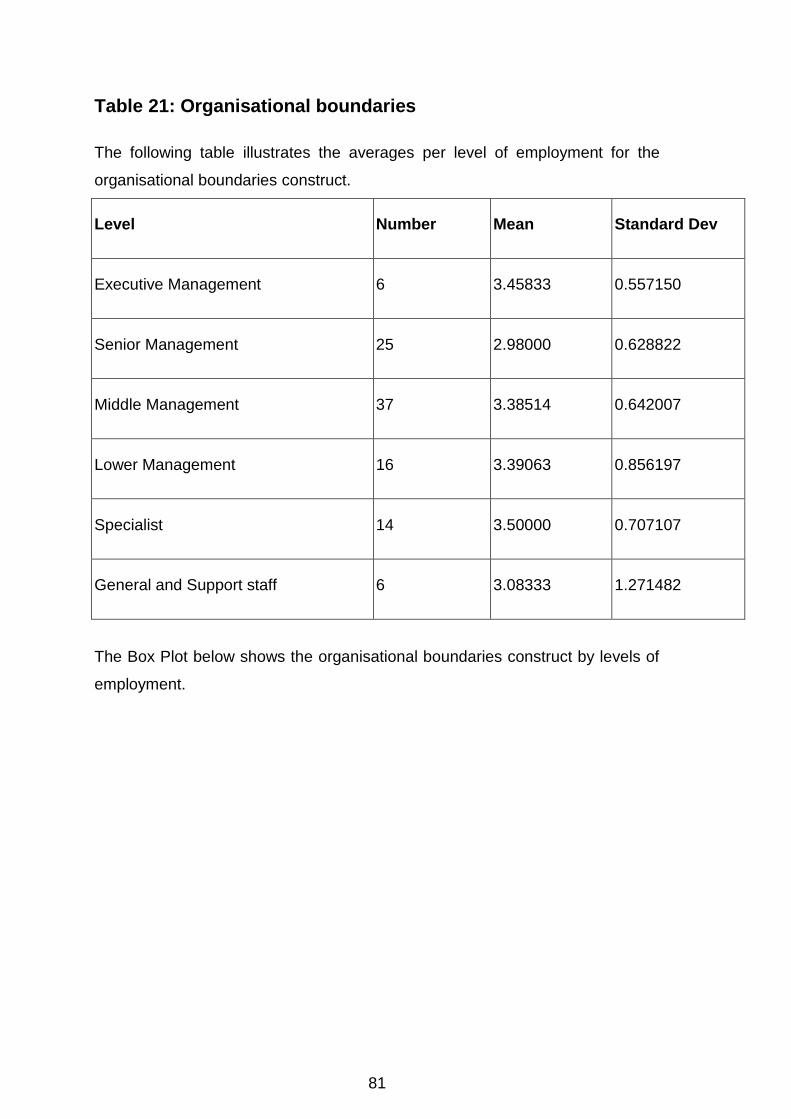
81
Table 21: Organisational boundaries
The following table illustrates the averages per level of employment for the
organisational boundaries construct.
Level Number Mean Standard Dev
Executive Management 6 3.45833 0.557150
Senior Management 25 2.98000 0.628822
Middle Management 37 3.38514 0.642007
Lower Management 16 3.39063 0.856197
Specialist 14 3.50000 0.707107
General and Support staff 6 3.08333 1.271482
The Box Plot below shows the organisational boundaries construct by levels of
employment.

82
Figure 27: Box Plot for organisational boundaries construct
0.5
1
1.5
2
2.5
3
3.5
4
4.5
5O
rga
nis
ati
on
al
bo
un
da
ries
sco
re
Ex
ecu
tive
Ma
na
gem
ent
Sen
ior
Ma
na
gem
ent
Mid
dle
Ma
na
gem
ent
Low
er M
an
ag
emen
t
Sp
ecia
list
Gen
eral
an
d S
up
po
rt s
taff
C Level
83
CHAPTER 5: DISCUSSION OF THE RESULTS
5.1. Introduction
104 participants responded and completed to the survey invitation.
Demographic profiles of respondents have been presented in chapter four;
namely, gender, age, level in their organisation, employment period at the
current organisation, total years of employment and highest qualification
attained. In this chapter, the focus will be on explaining results presented in the
preceding chapter.
5.2. Respondents profiles
Gender
Females comprised of 52% and males at 48% of the respondents. While it is
not significant, the higher female responses match the organisational gender
composition that has been shared by the human resources department of 60%
female split to 40% males.
Age
The age of respondents was majority the 35 years to 44 years category which
had the highest response percentage at 45% of the participants. The
respondents in this organisation are somewhat young, with 79% of the
respondents not older than 44 years old.
Figure 8 indicates the age of the respondents with the distribution of majority of
being between 25 years to 34 years at 33% and 45.5% for 35 years to 44 years.
Middle managers were of the highest respondents at 36% and senior managers
at 24%.
Figure 9 illustrated that in access of 90% of respondents had a post matric
qualification with a post graduate degree being the highest achieved
qualification at 30%. A total of 15% of the respondents had a master’s degree.
This is a good composition for an organisation.
84
The number of years of employed in that particular organisation by respondents
was mainly between 6 years to 10 years which was 34% and just shy of that at
32% of the respondents between 2 years and 5 years. The staff tenure is fairly
high, with 93% of the staff having been with the organisation in excess of 2
years. Figure 11 indicated that the respondents are highly experienced with
76% employed in excess of 6 years and the majority employed between 11
years to 20 years totalling 58% for the group.
5.3. Results pertaining to sub-problem 1:
The first sub-problem is to measure and determine the apparent levels of
dimensions of corporate entrepreneurship.
The corporate entrepreneurship dimensions were measured utilising the
corporate entrepreneurship assessment indicator (CEAI) which has been
considered stable and accurate by (Jeffrey S. Hornsby, 2013; Kuratko et al.,
2014). The results presented in table 16, were averages of the reliable items of
the construct as per cronbach alpha in chapter 3.
5.3.1. Descriptives
The descriptives presents the percentages and frequencies of individual
questions per construct.
5.3.1.1. Management Support
Management support construct scored a 2.83 mean score and 0.67 standard
deviation. This means that the respondents felt that they was little management
support. The respondents felt most strongly about questions 3 and 4 and mostly
didn’t agree with question 7 and 11 as per annexure B.
Most agreed with questions were:
Question 3 - In my organization, developing one’s own ideas is encouraged for
the improvement of the corporation.
- Question 4 - Upper management is aware and very receptive to my ideas and
suggestions.

85
These suggest that respondents felt that development of ideas and awareness
from senior management were prevalent in the organisation.
Most disagreed questions were:
Question 7; senior managers encourage innovators to bend rules and rigid
procedures in order to keep promising ideas on track.
Question 11; an employee with a good idea is often given free time to develop
that idea.
5.3.1.2. Work Discretion
Work discretion construct scored a 3.47 mean score and 0.75 standard
deviation. The score is just above neutral which suggests that the respondents
felt that there is a level of work discretion. The respondents felt mostly strongly
about questions 15 and mostly didn’t agree with question 12.
5.3.1.3. Rewards/reinforcements
Rewards/reinforcement construct scored a 3.37 mean score and 0.77 standard
deviation. The respondents felt mostly strongly about questions 20 and mostly
didn’t agree with questions 18.
5.3.1.4. Time availability
Time availability construct scored a 3.23 mean score and 0.79 standard
deviation. The respondents felt mostly strongly about question 22 and mostly
didn’t agree with question 24.
86
5.3.1.5. Organisational Boundaries
Organisational boundaries construct scored a 3.29 mean score and 0.73
standard deviation. The respondents felt most strongly with question 27 and
mostly didn’t agree with question 26.
5.3.2. Reliabilities
5.3.2.1. Management support
Management support had twenty-one items and scored a cronbach alpha of
0.89. This is seen as good reliability.
5.3.2.2. Work Discretion
Work discretion had six items that scored a cronbach alpha of 0.86. According
to the cronbach coefficient this result is also considered good reliability.
5.3.2.3. Rewards/reinforcement
Rewards/reinforcement had four items that scored a cronbach alpha of 0.77.
According to the cronbach coefficient this was considered acceptable reliability.
5.3.2.4. Time availability
Time availability had three items that scored a cronbach alpha of 0.64.
According to the cronbach coefficient this was considered acceptable reliability.
5.3.2.5. Organisational Boundaries
Organisational Boundaries had four items that scored a cronbach alpha of 0.63.
According to the cronbach coefficient this was considered acceptable reliability.
Overall the CE constructs items as per table four in chapter three, estimates of
internal consistency as measured by Cronbach’s alpha all exceeded 0.60 on the
Cronbach’s alpha measurement. This indicated that all the measured items
were at least at an acceptable reliability.

87
5.3.3. Distributions of construct scores
5.3.3.1. Management Support
The histogram displays the distribution of the responses with most of the
responses located at 2.83 which is just below 3. Based on the spread and
location of the data, most of the respondents were neutral towards management
support.
5.3.3.2. Work Discretion
The work discretion histogram results displayed that majority of the respondents
were in located around 3.47. It can be deduced that the respondents somewhat
felt strongly about work discretion. This is not significant though as it is below 4.
5.3.3.3. Rewards/Reinforcement
The histogram displays the spread and location of the respondents. Most of the
data is in located around 3.37. This is just above three however is neutral.
5.3.3.4. Time availability
The histogram illustrated that majority of the data from the respondents were
located around 3.23 which is just above three and is neutral.
5.3.3.5. Organisational Boundaries
The results from the histogram displayed the distribution of the data at 3.29
which is which is neutral.

88
The results indicated the construct average scores in terms of corporate
entrepreneurship dimensions.
The distributions and the descriptive illustrated that the average score was
Management support was the lowest mean score across the corporate
entrepreneurship constructs measured.
Work discretion was the highest across the corporate entrepreneurship
constructs measured. Work discretion had the higher average mean score
across the CE constructs and trailed by rewards/reinforcements. It is important
to note that while work discretion and rewards/reinforcements were had higher
scores, both work discretion and rewards/reinforcements were not significantly
higher than the other constructs.
Management support’ mean score of 2.83 was the lowest of all the constructs
which is alarming because (Hornsby et al., 2002; Kuratko et al., 2014) state that
top management support essentially is the commitment of managers to
encourage entrepreneurial activity and their ability to institutionalize
entrepreneurial activity in organisations. The low management mean scores
aligns to the subsequent outcome of the data where, in general, corporate
entrepreneurship levels in this organisation, based on the overall construct
averages, are low at a mean score of 3.238.
89
5.4. Results pertaining to sub-problem 2:
The second sub-problem is to measure the differences between the dimensions
of corporate entrepreneurship in the organisation between the hierarchal levels
of the employment.
Ideally we require a fairly equal number of respondents per level. In this case
the assumption of equal variances was not violated, and to ensure significant
differences exist with a bit of skewedness and non-parametric tests were also
conducted. A one-way ANOVA was conducted to examine whether there were
statistically significant differences among different hierarchal levels of
respondents in relation to their mean constructs scores.
5.5.1. Management Support
A one-way ANOVA was conducted to examine whether there were statistically
significant differences among different levels of management in relation to their
mean Management support scores. Although there were some differences, the
results revealed that the differences was not statistically significant at a 95%
level of confidence between the different levels of employment and because the
p value was above 0.05, (F5, 103) = 1.02, p=0.4094. Middle managers were the
most represented group however; they scored the lowest with regards to
management support construct. Kuratko et al. (1990) state that middle
managers’ perceptions of internal organisational factors determine their relative
emphasis on the various activities they undertake to encourage or facilitate
corporate entrepreneurship.
5.5.2. Work Discretion
A one-way ANOVA was conducted to examine whether there were statistically
significant differences among different levels of management in relation to their
mean work discretion scores. The results revealed that the differences was not
statistically significant at a 95% level of confidence between the different levels
of management and because the p value was above 0.05, (F5, 103) = 1.0432,
p=0.3968. Low management respondents scored the lowest in terms of work

90
discretion. Work discretion refers to their willingness to take risks and the
organisational open-mindedness Hornsby et al. (2002) and taking part in untried
activities, Kuratko et al. (2014).
5.5.3. Rewards/Reinforcement
A one-way ANOVA was conducted to examine whether there were statistically
significant differences among different levels of hierarchy in relation to their
mean rewards/reinforcement scores. The results revealed that the differences
was not statistically significant at a 95% level of confidence between the
different levels of management and because the p value was above 0.05, (F5,
103) = 0.3591, p=0.8753. General and support staff scored the highest in this
constructs while on the other hand executive management scored the lowest in
this construct. Rewards and reinforcement refers to systems to recognize and
drive entrepreneurial activities through the provision of incentives which are
results based, goals, feedback and overall individual responsibility Kuratko et al.
(2014).
5.5.4. Time availability
A one-way ANOVA was conducted to examine whether there were statistically
significant differences among different levels of hierarchy in relation to their
mean time availability scores. The results revealed that the differences was not
statistically significant at a 95% level of confidence between the different levels
of hierarchy and because the p value was above 0.05, (F5, 103) = 1.9097,
p=0.0995. General and support staff scored lower than the rest of the
population groups however it wasn’t significant. Time availability refers to free
time made available to develop innovative entrepreneurial behaviour thorough
trial and error, and risk-taking behaviours, Hornsby et al. (2002); Kuratko et al.
(2014).
91
5.5.5. Organisational Boundaries
A one-way ANOVA was conducted to examine whether there were statistically
significant differences among different levels of management
in relation to their mean organisational boundaries scores. The results revealed
that the differences was not statistically significant at a 95% level of confidence
between the different levels of management and because the p value was
above 0.05, (F5, 103) = 1.5018, p=0.1962.
Organisational boundaries are the tools available to govern the idea generation
value-chain that drives entrepreneurial behaviour Hornsby et al. (2002); Kuratko
et al. (2014). Senior managers had the lowest scores in terms of organisation
boundaries.
92
5.6. Conclusion
The results were analysed through descriptive analysis to describe data in detail
and indicated acceptable construct reliability. The results indicated that there
was no gender bias in the respondents.
A one-way ANOVA was conducted to examine whether there were statistically
significant differences among participants and investigate the differences in
relation to the constructs. There were no significant differences between the
means of the constructs. As a result a Tukey-Kramer’s test was not used to test
differences in the constructs due to the non-significance in the results.
The results indicated that in terms of the first sub-problem that there is support
for corporate entrepreneurship, the results with specific to the means of the
constructs indicated a higher average mean score for work discretion, which in
literature refers to the autonomy at which work duties can be done and the
ability to attempt untried activities, Kuratko et al. (2014).
Management support scored the lowest of the constructs. In general,
management support is low at a 2.83 mean score. While there are different
scores for each construct, there were no significant differences in the results.
The results further showed that in terms of the first sub-problem, overall there
are no corporate entrepreneurship efforts in the organisation. This corresponds
with low management support score which is consistent with literature from
(Hornsby et al., 2002; Jeffrey S. Hornsby, 2013; Kuratko et al., 2014; Kuratko et
al., 1990; Scheepers, Hough, & Bloom, 2008) that affirms that management
support and perceptions of corporate entrepreneurship underpin their intent to
support or drive entrepreneurial activities.
The results indicated in terms of the second sub-problem that there were no
significant differences in terms of hierarchal levels of employment. Middle
managers were the most represented group however; they scored the lowest
with regards to management support construct. They scored a mean of 2.89
which is significant. This is a concern when considering that perceptions of
middle managers of according Kuratko et al. (1990) essentially are the

93
determinant for corporate entrepreneurship. Further to this, no particular
hierarchal level scored positively across the measured constructs.
94
CHAPTER 6: CONCLUSIONS, IMPLICATIONS AND RECOMMENDATIONS
6.1 Introduction
In this chapter the conclusions, implications and recommendations will be
discussed in line with the presented findings and related to the problem
statements.
6.2 Conclusions of the study
The respondents perceptions of this organisation based on the results is that
there is no corporate entrepreneurship in the organisation. This based on the
mean average scores of the constructs which vied with the neutral space. This
is a key alarming issue as the respondents were well educated with hire tenure
in both the current organisation and the overall experience. The other issue is
driven by the fact the majority of the respondents were middle managers which
is significant when comparing to literature.
6.3 Implications and Recommendations
The study was initiated on the premise that the insurance industry was highly
regulated resulting in minimal entrepreneurial intentions and operated in
diminishing markets. That being the case, organisations within this sector had to
consider corporate entrepreneurship intentions to remain competitive.
The recommendation is that the organisation embarks on programs that will
encourage corporate entrepreneurship due to the low corporate
entrepreneurship results.
95
6.4 Recommendations for additional research
The first recommendation is for an in-depth research be considered to gain a
better understanding on two specific corporate entrepreneurship dimensions
being management support and time availability. While these were not
significant, they scored the highest and lowest respectively of the constructs.
Qualitative research could be initiated specifically to further unpack these
constructs.
Secondly, further research should be conducted into the variation of scoring by
middle managers.
Lastly, a larger sample of general staff should be considered to research the
differences between middle and general staff.

96
REFERENCES
(ASISA), A. f. S. a. I. S. A. (2013). The South African insurance gap in 2013.
Bureau of Market Research (UNISA)
Antoncic, B., & Hisrich, R. D. (2003). Clarifying the intrapreneurship concept.
Journal of small business and enterprise development, 10(1), 7-24.
Antoncic, B., & Hisrich, R. D. (2004). Corporate entrepreneurship contingencies
and organizational wealth creation. Journal of Management
Development, 23(6), 518-550.
Bosma, N., Wennekers, S., & Amorós, J. E. (2011). Global Entrepreneurship
Monitor, 2011 Extended Report: Entrepreneurs and Entrepreneurial
Employees Across the Globe. London: Global Entrepreneurship
Research Association (GERA).
Bosma, N., Wennekers, S., Guerrero, M., Amorós, J. E., Martiarena, A., &
Singer, S. (2013). Gem Special report. Special Report on Entrepreneurial
Employee Activity. Gem Special report.
Bruton, G. D., Ahlstrom, D., & Obloj, K. (2008). Entrepreneurship in emerging
economies: Where are we today and where should the research go in
the future. Entrepreneurship theory and practice, 32(1), 1-14.
C.J. Goosen, Coning, T. J. d., & Smit, E. v. d. M. (2002). Corporate
entrepreneurship and financial performance: The role of
management. S.Afr.J.Bus.Manage.2002,33(4).
Chua, J. H., Chrisman, J. J., & Sharma, P. (1999). Defining the family business
by behavior. Entrepreneurship theory and practice, 23, 19-40.
Chung, L. H., & Gibbons, P. T. (1997). Corporate Entrepreneurship The Roles
of Ideology and Social Capital. Group & Organization Management,
22(1), 10-30.
97
Cooper, D. R., & Schindler, P. S. (2011). Business Research Methods (Mcgraw-
Hill International ed.).
Covin, J. G., & Slevin, D. P. (1991). A conceptual model of entrepreneurship as
firm behavior. Entrepreneurship theory and practice, 16(1), 7-25.
Covin, J. G., & Slevin, D. P. (1991). A Conceptual Model of
Entrepreneurship as
Firm Behavior.
Dess, G. G., & Lumpkin, G. T. (2005). The role of entrepreneurial orientation in
stimulating effective corporate entrepreneurship. The Academy of
Management Executive, 19(1), 147-156.
Guth, W., & Ginsberg, A. (1990). Guest editor's introduction. Strategic
Management Journal, 11, 5-15.
Hawkins 1, P. (2004). South Africa's financial sector ten years on: performance
since democracy. Development Southern Africa, 21(1), 179-204.
Hornsby, J. S., Kuratko, D. F., & Zahra, S. A. (2002). Middle managers'
perception of the internal environment for corporate entrepreneurship:
assessing a measurement scale. Journal of business Venturing, 17(3),
253-273.
Ireland, R. D., Covin, J. G., & Kuratko, D. F. (2009). Conceptualizing corporate
entrepreneurship strategy. Entrepreneurship theory and practice, 33(1),
19-46.
IRELAND, R. D., Kuratko, D. F., & Covin, J. G. (2003). ANTECEDENTS,
ELEMENTS, AND CONSEQUENCES OF CORPORATE
ENTREPRENEURSHIP STRATEGY. Paper presented at the Academy
of Management Proceedings.
Jeffrey S. Hornsby, D. F. K., Daniel T. Holt, and William J. Wales. (2013).
Assessing a Measurement of Organizational Preparedness for
98
Corporate Entrepreneurship*. Product Development & Management
Association, 937–955.
Johanson, J., & Vahlne, J.-E. (1977). The internationalization process of the
firm-a model of knowledge development and increasing foreign market
commitments. Journal of International Business Studies, 23-32.
Johanson, J., & Vahlne, J.-E. (1990). The mechanism of internationalisation.
International marketing review, 7(4).
Kuratko, D. F., Hornsby, J. S., & Covin, J. G. (2014). Diagnosing a firm's
internal environment for corporate entrepreneurship. Business Horizons,
57(1), 37-47.
Kuratko, D. F., Montagno, R. V., & Hornsby, J. S. (1990). Developing an
intrapreneurial assessment instrument for an effective corporate
entrepreneurial environment. Strategic Management Journal, 11, 49-58.
Luiz, J. M., & Charalambous, H. (2009). Factors influencing foreign direct
investment of South African financial services firms in Sub-Saharan
Africa. International Business Review, 18(3), 305-317.
McDougall, P. P., & Oviatt, B. M. (2000). International entrepreneurship: the
intersection of two research paths. Academy of management Journal,
43(5), 902-906.
Morris, M. H., Kuratko, D. F., & Covin, J. G. (2008). Corporate Entrepreneurship
& Innovation.
Nkosi, T. (2011). Corporate Entrepreneurship and Organisational Performance
in the Information and Communications Technology Industry. (Master of
Management in Entrepreneurship and New Venture Creation), University
of the Witwatersrand, Johannesburg.
. A SAFER FINANCIAL SECTOR TO SERVE SOUTH AFRICA BETTER.
(2011). REPUBLIC OF SOUTH AFRICA.

99
Scheepers, M., Hough, J., & Bloom, J. (2008). Nurturing the corporate
entrepreneurship capability. Southern African Business Review, 12(3),
50-75.
Stevenson, H. H., & Jarillo, J. C. (1990). A paradigm of entrepreneurship:
Entrepreneurial management. Strategic Management Journal, 11(5), 17-
27.
Thérin, F. (2007). Handbook of Research on Techno-Entrepreneurship UK:
Edward Elgar Publishing Limited.
Thurik, R., & Wennekers, S. (1999). Linking Entrepreneurship and Economic
Growth. Journal of small business economics, 13(1), 27-56.
Tidd, J., Pavitt, K., & Bessant, J. (2001). Managing innovation (Vol. 3): Wiley
Chichester.
Urban, B. (2008). The prevalence of entrepreneurial orientation in a developing
country: juxtapositions with firm success and South Africa's innovation
index. Journal of Developmental Entrepreneurship, 13(04), 425-443.
Urban, B. (2010). Frontiers in Entrepreneurship (B. Urban Ed.). Johannesburg,
South Africa: Springer.
Van der Merwe, B. A. (2007). The corporate entrepreneurial climate within the
South
African banking sector. (MPhil), University of Pretoria.
Venter, Urban, & Rwigema. (2008). Entrepreneurship Theory and Practice (2nd
ed.): Oxford University Press , South Africa.
Welch, C. L., & Welch, L. S. (2009). Re-internationalisation: Exploration and
conceptualisation. International Business Review, 18(6), 567-577.
Wiklund, J., & Shepherd, D. (2005). Entrepreneurial orientation and small
business performance: a configurational approach. Journal of business
Venturing, 20(1), 71-91.
100
Xavier, S. R., Kelley, D., Kew, J., Herrington, M., & Vorderwülbecke, A. (2012).
Global Entrepreneurship Monitor GLOBAL ENTREPRENEURSHIP
MONITOR.
Yiu, D. W., & Lau, C. (2008). Corporate Entrepreneurship as Resource Capital
Configuration in Emerging Market Firms. Entrepreneurship theory and
practice.
Zahra, S. A., & Covin, J. G. (1995). Contextual influences on the corporate
entrepreneurship-performance relationship: A longitudinal analysis.
Journal of business Venturing, 10(1), 43-58.
101
APPENDIX A
COVERING LETTER
Good day,
I am inviting you to be part of a survey I am conducting in order to gather
information related to corporate entrepreneurship in organisations.
I am conducting this study as a professional student undertaking my Master’s
Degree in Entrepreneurship and New Venture Creation at Wits Business
School. Corporate entrepreneurship has been viewed as a means of asserting a
competitive advantage as well as an avenue to an organisation’s success
through internal excellence.
The emphasis of the research is on Corporate Entrepreneurship behaviour in
organisations in the Financial Services Sector.
Please be assured that your responses will be held in the utmost of confidence
and if the results of this study were to be written for publication, no identifying
information will be used.
The potential benefits of this study are to improve the understanding of
corporate entrepreneurship in financial services organisations in South Africa.
I look forward to your participation in this research, and sincerely thank you for
your time. Should you have any questions about this study, or wish to ascertain
the results of the findings, please contact me on below details.
Mogomotsi Mogopodi
0824872799
Graduate School of Business Administration
Wits Business School
St David’s Place
Parktown
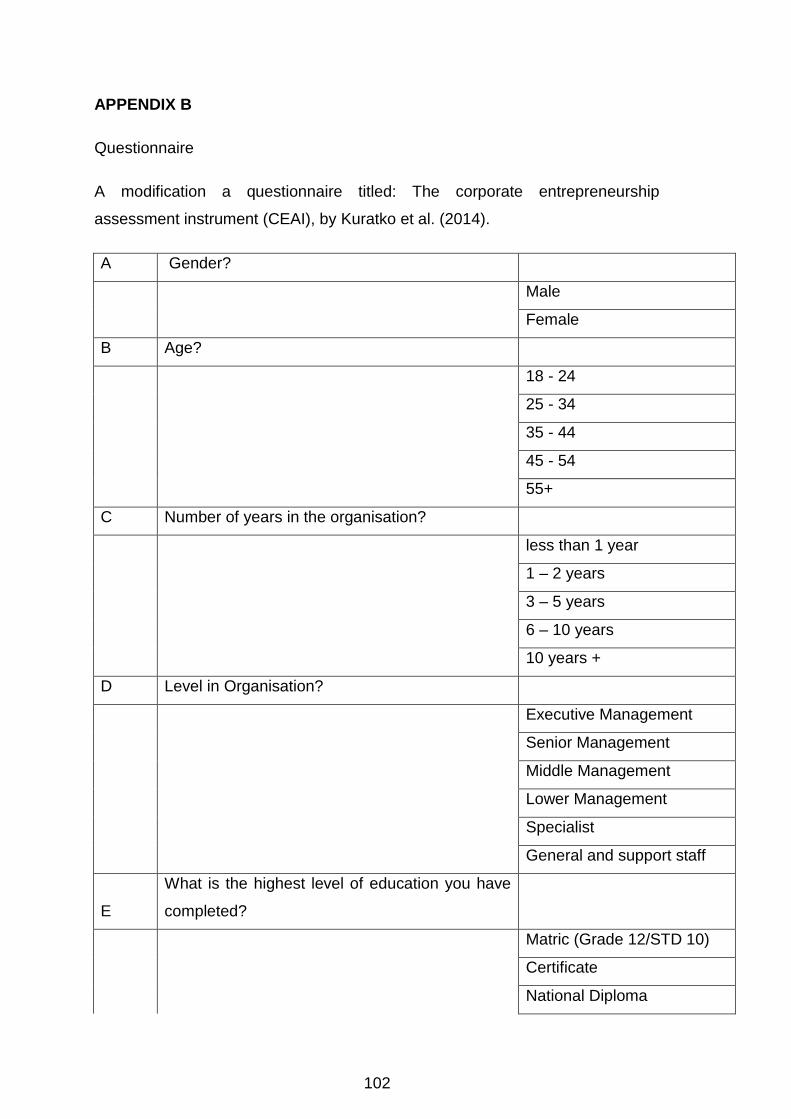
102
APPENDIX B
Questionnaire
A modification a questionnaire titled: The corporate entrepreneurship
assessment instrument (CEAI), by Kuratko et al. (2014).
A Gender?
Male
Female
B Age?
18 - 24
25 - 34
35 - 44
45 - 54
55+
C Number of years in the organisation?
less than 1 year
1 – 2 years
3 – 5 years
6 – 10 years
10 years +
D Level in Organisation?
Executive Management
Senior Management
Middle Management
Lower Management
Specialist
General and support staff
E
What is the highest level of education you have
completed?
Matric (Grade 12/STD 10)
Certificate
National Diploma
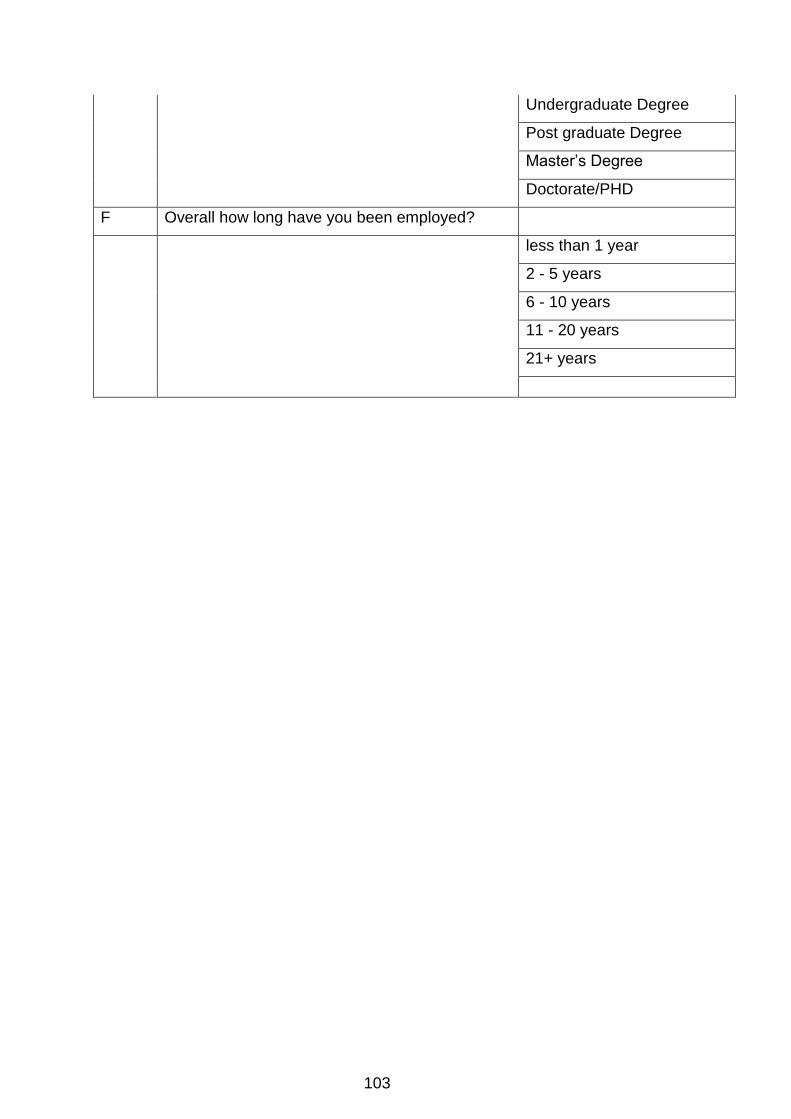
103
Undergraduate Degree
Post graduate Degree
Master’s Degree
Doctorate/PHD
F Overall how long have you been employed?
less than 1 year
2 - 5 years
6 - 10 years
11 - 20 years
21+ years
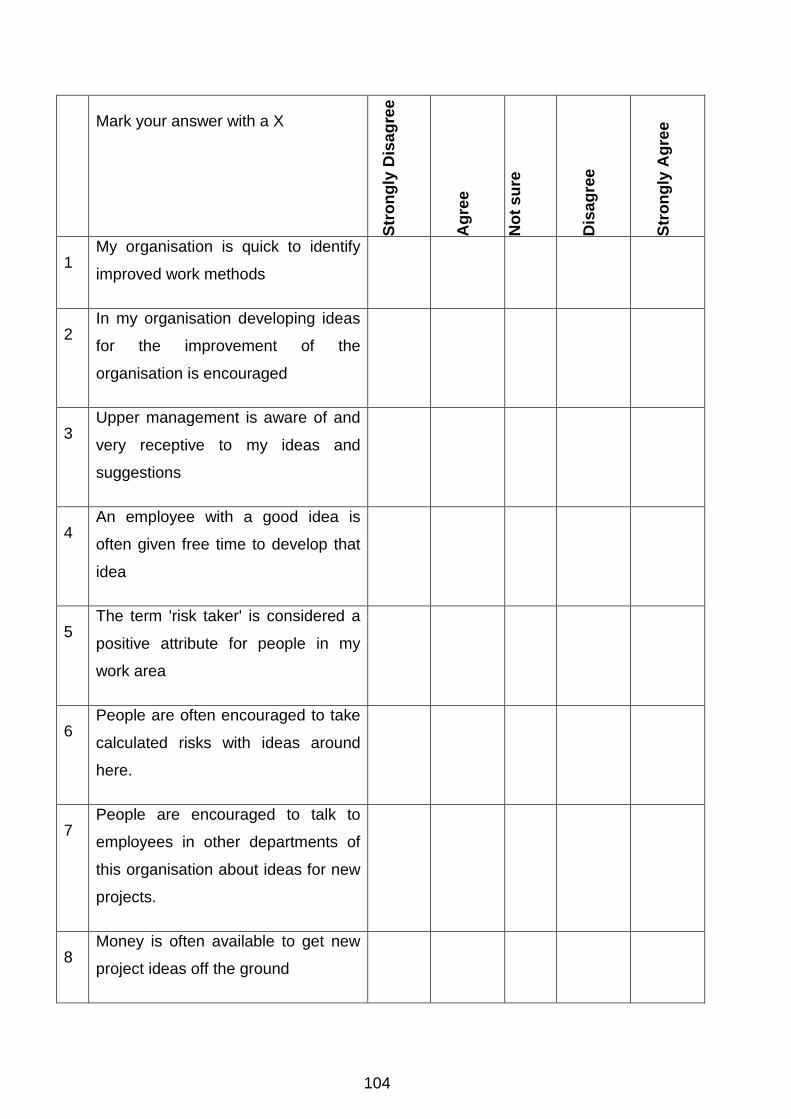
104
Mark your answer with a X
Str
on
gly
Dis
ag
ree
Ag
ree
No
t s
ure
Dis
ag
ree
Str
on
gly
Ag
ree
1 My organisation is quick to identify
improved work methods
2 In my organisation developing ideas
for the improvement of the
organisation is encouraged
3 Upper management is aware of and
very receptive to my ideas and
suggestions
4 An employee with a good idea is
often given free time to develop that
idea
5 The term 'risk taker' is considered a
positive attribute for people in my
work area
6 People are often encouraged to take
calculated risks with ideas around
here.
7 People are encouraged to talk to
employees in other departments of
this organisation about ideas for new
projects.
8 Money is often available to get new
project ideas off the ground

105
9 Senior managers encourage
innovators to bend rules and rigid
procedures in order to keep
promising ideas on track.
10 Money is often available to get new
project ideas off the ground.
11 People are often encouraged to take
calculated risks with ideas around
here.
12 The term ‘‘risk taker’’ is considered a
positive attribute for people in my
work area.
13 An employee with a good idea is
often given free time to develop that
idea
14 I have the freedom to decide what I
do on my job
15 I feel that I am my own boss and do
not have to double check all of my
decisions with someone else
16 This organization provides the
chance to be creative and try my own
methods of doing the job
17 I have much autonomy on my job
and am left on my own to do my own
work.
18 The rewards I receive are dependent
upon my innovation on the job.

106
19 My manager will give me special
recognition if my work performance is
especially good
20 My manager would tell his/her boss if
my work was outstanding
21 During the past three months, my
workload kept me from spending
time on developing new ideas.
22 My job is structured so that I have
very little time to think about wider
organisational problems
23 I always seem to have plenty of time
to get everything done.
24 My co-workers and I always find time
for long-term problem solving.
25 In the past three months, I have
always followed standard operating
procedures or practices to do my
major tasks.
26 There are many written rules and
procedures that exist for doing my
major tasks
27 I clearly know what level of work
performance is expected from me in
terms of amount, quality, and
timelines of output.
28 There is little uncertainty in my job

107

108
Related Documents


