Corporate Briefing 13 th October 2021

Welcome message from author
This document is posted to help you gain knowledge. Please leave a comment to let me know what you think about it! Share it to your friends and learn new things together.
Transcript

Corporate Briefing13th October 2021
2
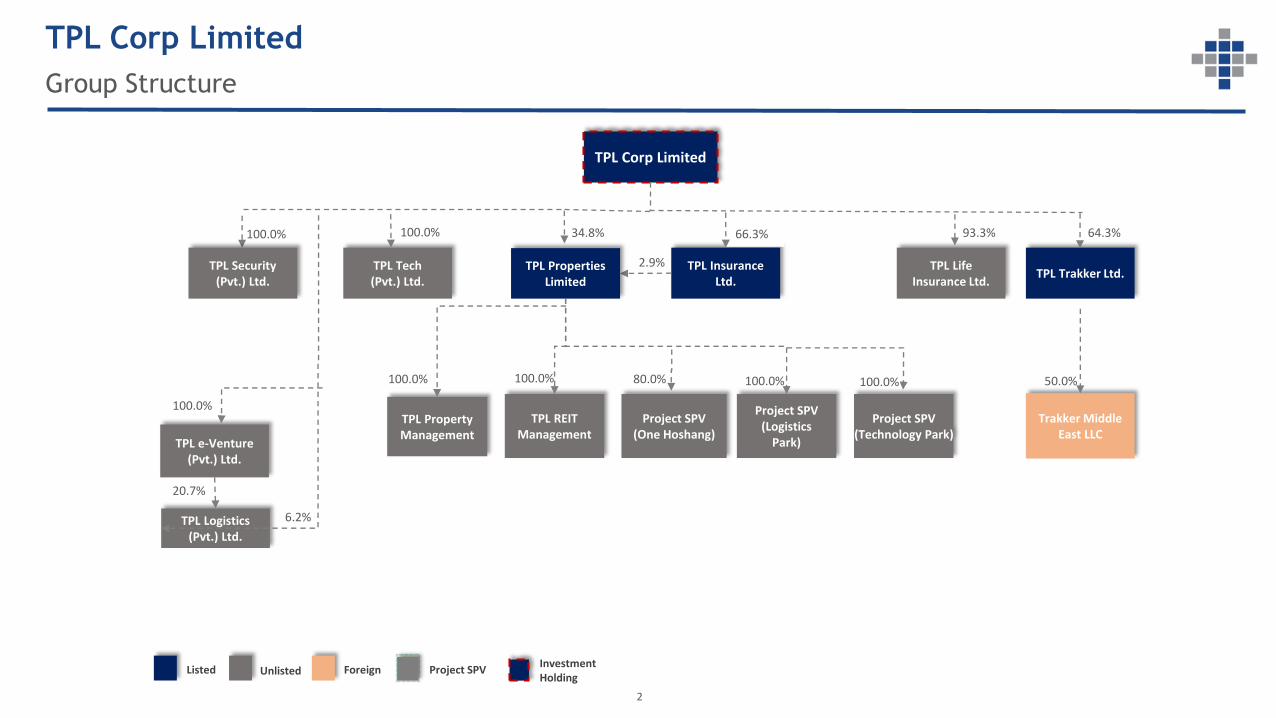
TPL Corp Limited
Group Structure
93.3%
ForeignInvestment Holding
Project SPV
50.0%
TPL e-Venture (Pvt.) Ltd.
TPL Corp Limited
TPL Life Insurance Ltd.
TPL Trakker Ltd. TPL Insurance
Ltd.
Trakker Middle East LLC
TPL Property Management
TPL REIT Management
Project SPV(One Hoshang)
34.8% 66.3% 64.3%
2.9%
100.0%
100.0%
TPL Properties Limited
80.0%
100.0%
TPL Security (Pvt.) Ltd.
TPL Tech (Pvt.) Ltd.
100.0%
Project SPV(Logistics
Park)
100.0% 100.0%
TPL Logistics (Pvt.) Ltd.
20.7%
6.2%
Project SPV(Technology Park)
100.0%
UnlistedListed
3
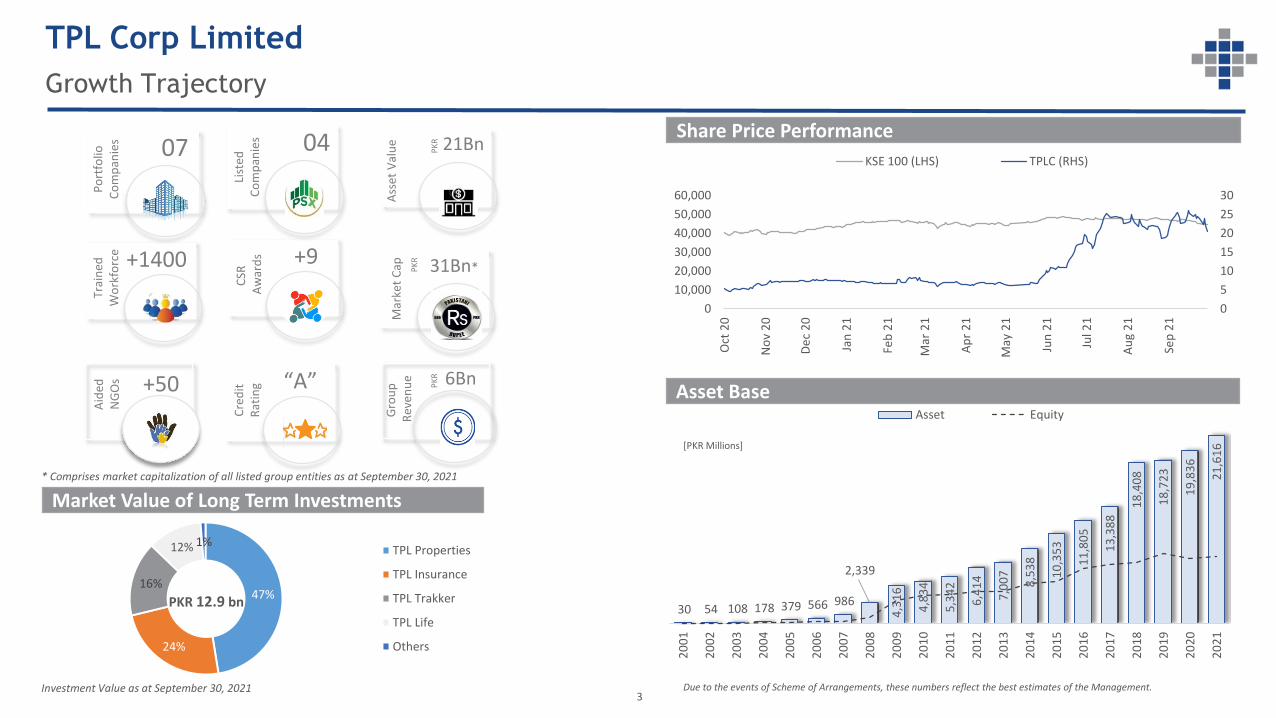
TPL Corp Limited
Growth Trajectory
+9C
SRA
war
ds+1400
Trai
ned
W
ork
forc
e
31Bn*
Mar
ket
Cap PK
R
Cre
dit
R
atin
g “A”+50
Aid
ed
NG
Os 6Bn
Gro
up
Rev
enu
e
PK
R
Ass
et V
alu
e07
Po
rtfo
lio
Co
mp
anie
s 04
List
ed
Co
mp
anie
s
PK
R 21Bn
Due to the events of Scheme of Arrangements, these numbers reflect the best estimates of the Management.
30 54 108 178 379 566 986
2,339
4,3
16
4,8
34
5,3
42
6,4
14
7,0
07
8,5
38
10
,35
3
11
,80
5
13
,38
8
18
,40
8
18
,72
3
19
,83
6
21
,61
6
20
01
20
02
20
03
20
04
20
05
20
06
20
07
20
08
20
09
20
10
20
11
20
12
20
13
20
14
20
15
20
16
20
17
20
18
20
19
20
20
20
21
Asset Equity
[PKR Millions]
0
5
10
15
20
25
30
0
10,000
20,000
30,000
40,000
50,000
60,000
Oct
20
No
v 2
0
De
c 2
0
Jan
21
Feb
21
Mar
21
Ap
r 2
1
May
21
Jun
21
Jul 2
1
Au
g 2
1
Sep
21
KSE 100 (LHS) TPLC (RHS)
[PKR/Shr]Share Price Performance
Asset Base
Market Value of Long Term Investments
47%
24%
16%
12% 1%TPL Properties
TPL Insurance
TPL Trakker
TPL Life
Others
PKR 12.9 bn
Investment Value as at September 30, 2021
* Comprises market capitalization of all listed group entities as at September 30, 2021
TPL Trakker Limited
`
5
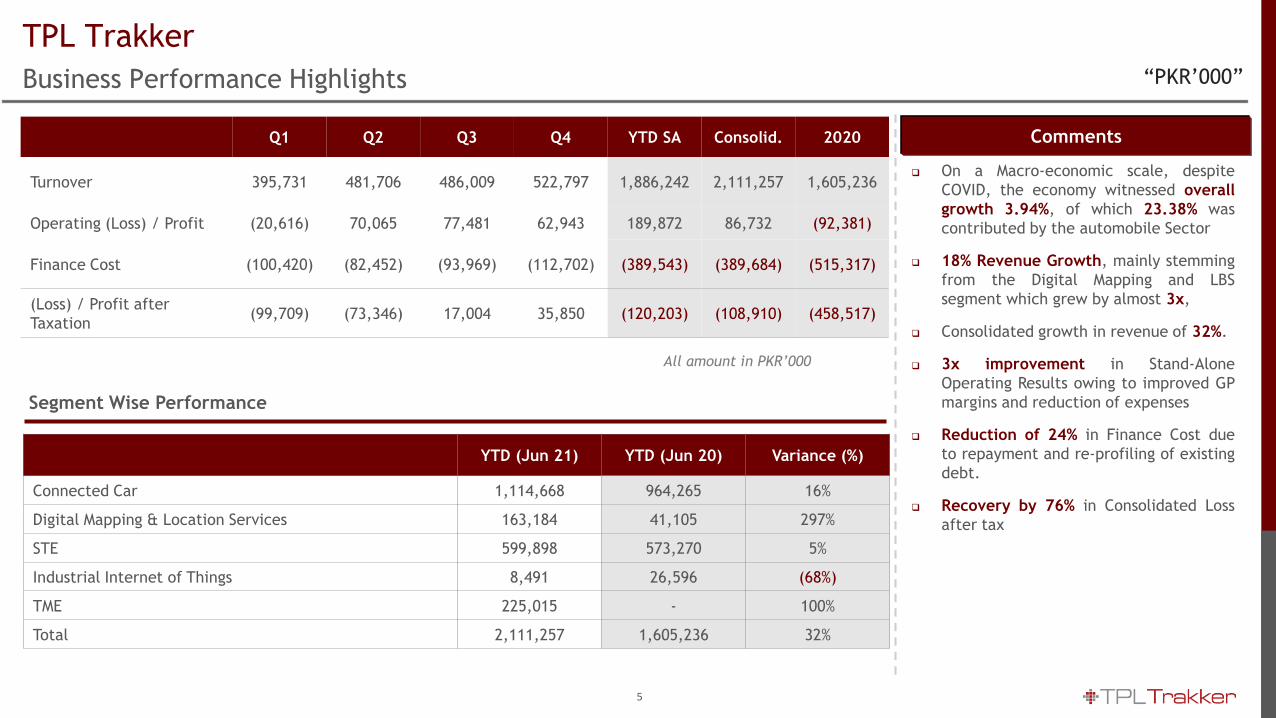
TPL Trakker
Business Performance Highlights
Comments
Segment Wise Performance
Q1 Q2 Q3 Q4 YTD SA Consolid. 2020
Turnover 395,731 481,706 486,009 522,797 1,886,242 2,111,257 1,605,236
Operating (Loss) / Profit (20,616) 70,065 77,481 62,943 189,872 86,732 (92,381)
Finance Cost (100,420) (82,452) (93,969) (112,702) (389,543) (389,684) (515,317)
(Loss) / Profit after
Taxation(99,709) (73,346) 17,004 35,850 (120,203) (108,910) (458,517)
On a Macro-economic scale, despite
COVID, the economy witnessed overall
growth 3.94%, of which 23.38% was
contributed by the automobile Sector
18% Revenue Growth, mainly stemming
from the Digital Mapping and LBS
segment which grew by almost 3x,
Consolidated growth in revenue of 32%.
3x improvement in Stand-Alone
Operating Results owing to improved GP
margins and reduction of expenses
Reduction of 24% in Finance Cost due
to repayment and re-profiling of existing
debt.
Recovery by 76% in Consolidated Loss
after tax
YTD (Jun 21) YTD (Jun 20) Variance (%)
Connected Car 1,114,668 964,265 16%
Digital Mapping & Location Services 163,184 41,105 297%
STE 599,898 573,270 5%
Industrial Internet of Things 8,491 26,596 (68%)
TME 225,015 - 100%
Total 2,111,257 1,605,236 32%
All amount in PKR’000
Segment Wise Performance
“PKR’000”
`
6
TPL Trakker
Standalone Profit and Loss Statement
YTD Jun’21 YTD Jun’20 Variance
Actual Actual [%]
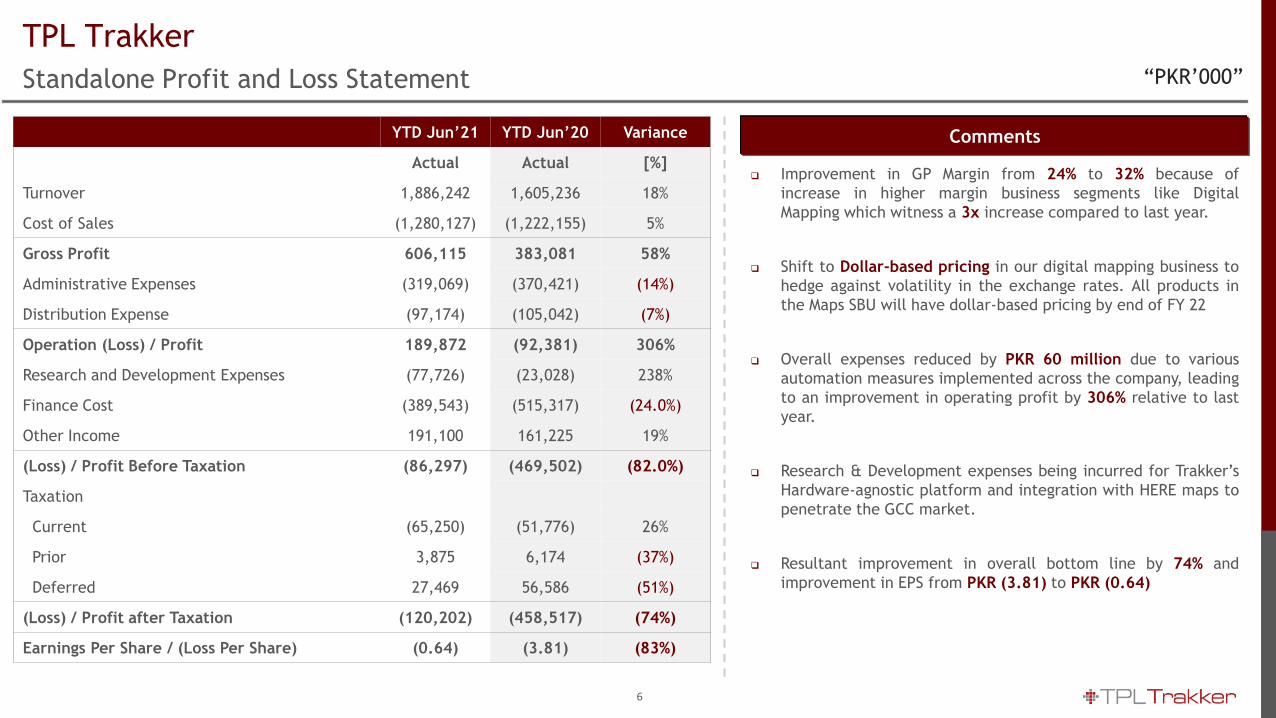
Turnover 1,886,242 1,605,236 18%
Cost of Sales (1,280,127) (1,222,155) 5%
Gross Profit 606,115 383,081 58%
Administrative Expenses (319,069) (370,421) (14%)
Distribution Expense (97,174) (105,042) (7%)
Operation (Loss) / Profit 189,872 (92,381) 306%
Research and Development Expenses (77,726) (23,028) 238%
Finance Cost (389,543) (515,317) (24.0%)
Other Income 191,100 161,225 19%
(Loss) / Profit Before Taxation (86,297) (469,502) (82.0%)
Taxation
Current (65,250) (51,776) 26%
Prior 3,875 6,174 (37%)
Deferred 27,469 56,586 (51%)
(Loss) / Profit after Taxation (120,202) (458,517) (74%)
Earnings Per Share / (Loss Per Share) (0.64) (3.81) (83%)
Comments
Improvement in GP Margin from 24% to 32% because of
increase in higher margin business segments like Digital
Mapping which witness a 3x increase compared to last year.
Shift to Dollar-based pricing in our digital mapping business to
hedge against volatility in the exchange rates. All products in
the Maps SBU will have dollar-based pricing by end of FY 22
Overall expenses reduced by PKR 60 million due to various
automation measures implemented across the company, leading
to an improvement in operating profit by 306% relative to last
year.
Research & Development expenses being incurred for Trakker’s
Hardware-agnostic platform and integration with HERE maps to
penetrate the GCC market.
Resultant improvement in overall bottom line by 74% and
improvement in EPS from PKR (3.81) to PKR (0.64)
“PKR’000”
`
7
TPL Trakker
Consolidated Profit and Loss Statement
CommentsYTD Jun’21 YTD Jun’20 Variance
Actual Actual [%]
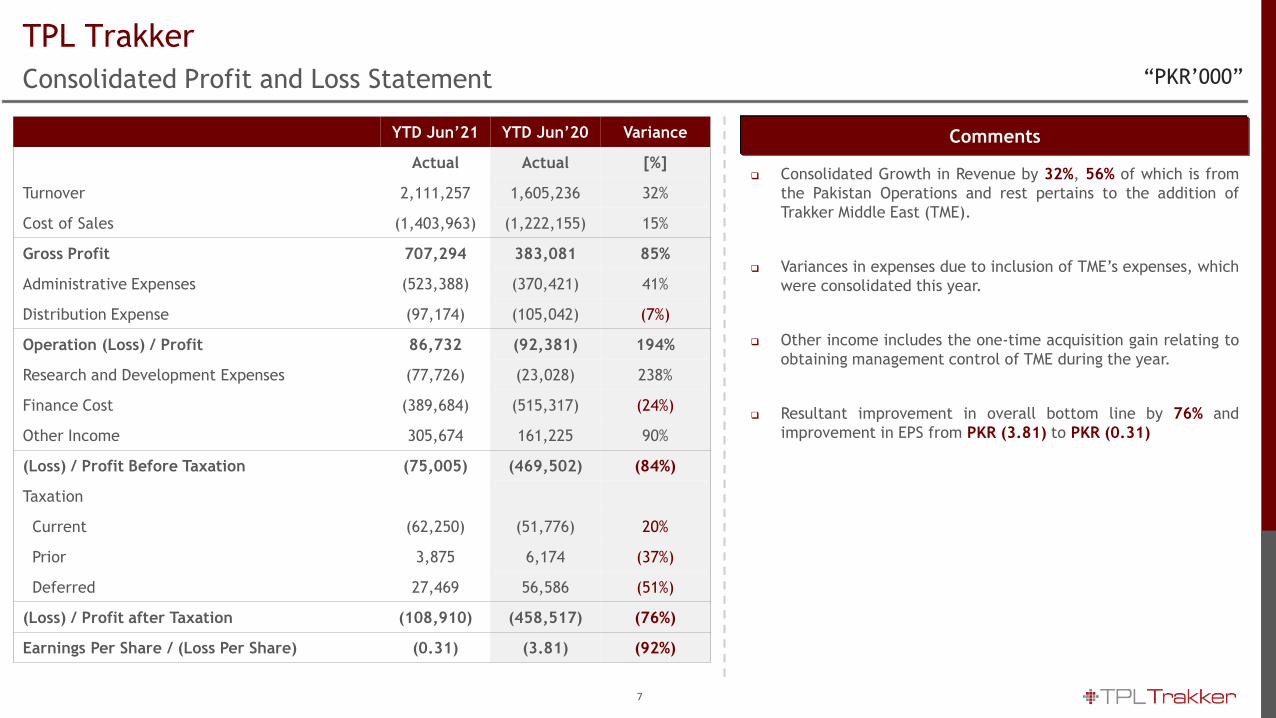
Turnover 2,111,257 1,605,236 32%
Cost of Sales (1,403,963) (1,222,155) 15%
Gross Profit 707,294 383,081 85%
Administrative Expenses (523,388) (370,421) 41%
Distribution Expense (97,174) (105,042) (7%)
Operation (Loss) / Profit 86,732 (92,381) 194%
Research and Development Expenses (77,726) (23,028) 238%
Finance Cost (389,684) (515,317) (24%)
Other Income 305,674 161,225 90%
(Loss) / Profit Before Taxation (75,005) (469,502) (84%)
Taxation
Current (62,250) (51,776) 20%
Prior 3,875 6,174 (37%)
Deferred 27,469 56,586 (51%)
(Loss) / Profit after Taxation (108,910) (458,517) (76%)
Earnings Per Share / (Loss Per Share) (0.31) (3.81) (92%)
Consolidated Growth in Revenue by 32%, 56% of which is from
the Pakistan Operations and rest pertains to the addition of
Trakker Middle East (TME).
Variances in expenses due to inclusion of TME’s expenses, which
were consolidated this year.
Other income includes the one-time acquisition gain relating to
obtaining management control of TME during the year.
Resultant improvement in overall bottom line by 76% and
improvement in EPS from PKR (3.81) to PKR (0.31)
“PKR’000”
`
8
TPL Trakker
Business Achievement | Tracking, Auto Business & IIoT
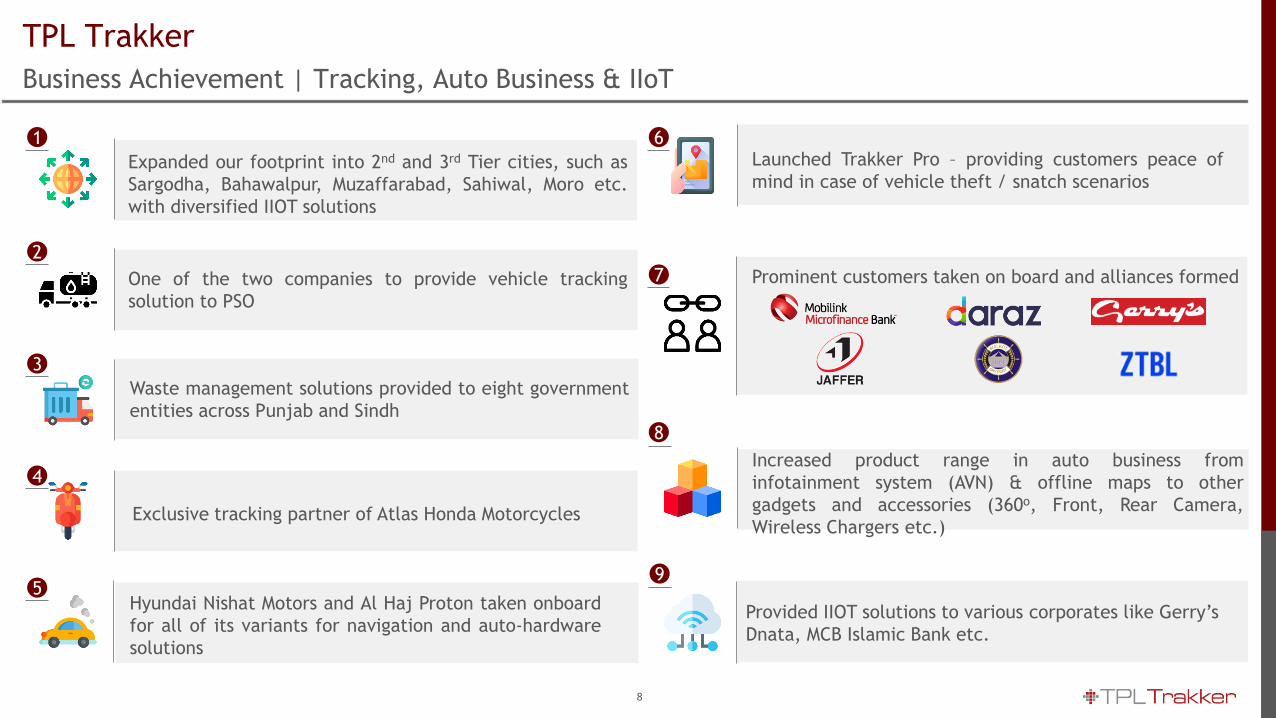
Expanded our footprint into 2nd and 3rd Tier cities, such as
Sargodha, Bahawalpur, Muzaffarabad, Sahiwal, Moro etc.
with diversified IIOT solutions
One of the two companies to provide vehicle tracking
solution to PSO
Waste management solutions provided to eight government
entities across Punjab and Sindh
Exclusive tracking partner of Atlas Honda Motorcycles
Hyundai Nishat Motors and Al Haj Proton taken onboard
for all of its variants for navigation and auto-hardware
solutions
1
2
3
4
5
Prominent customers taken on board and alliances formed7
Launched Trakker Pro – providing customers peace of
mind in case of vehicle theft / snatch scenarios
6
Increased product range in auto business from
infotainment system (AVN) & offline maps to other
gadgets and accessories (360o, Front, Rear Camera,
Wireless Chargers etc.)
8
9
Provided IIOT solutions to various corporates like Gerry’s
Dnata, MCB Islamic Bank etc.
`
9
TPL Trakker
Business Achievement | Digital Mapping
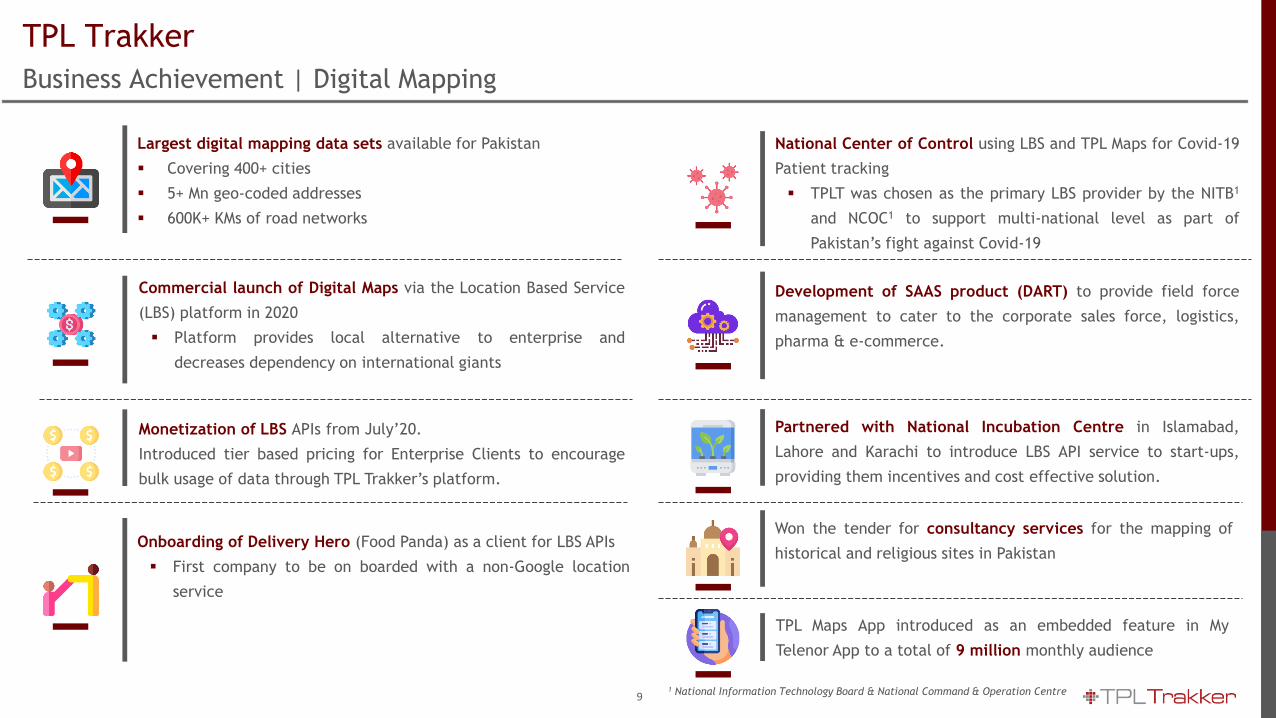
Largest digital mapping data sets available for Pakistan
Covering 400+ cities
5+ Mn geo-coded addresses
600K+ KMs of road networks
Commercial launch of Digital Maps via the Location Based Service
(LBS) platform in 2020
Platform provides local alternative to enterprise and
decreases dependency on international giants
Monetization of LBS APIs from July’20.
Introduced tier based pricing for Enterprise Clients to encourage
bulk usage of data through TPL Trakker’s platform.
Onboarding of Delivery Hero (Food Panda) as a client for LBS APIs
First company to be on boarded with a non-Google location
service
National Center of Control using LBS and TPL Maps for Covid-19
Patient tracking
TPLT was chosen as the primary LBS provider by the NITB1
and NCOC1 to support multi-national level as part of
Pakistan’s fight against Covid-19
Development of SAAS product (DART) to provide field force
management to cater to the corporate sales force, logistics,
pharma & e-commerce.
Partnered with National Incubation Centre in Islamabad,
Lahore and Karachi to introduce LBS API service to start-ups,
providing them incentives and cost effective solution.
Won the tender for consultancy services for the mapping of
historical and religious sites in Pakistan
TPL Maps App introduced as an embedded feature in My
Telenor App to a total of 9 million monthly audience
1 National Information Technology Board & National Command & Operation Centre
`
10
Trakker Middle East (TME)
Business Achievement | Trakker Middle East
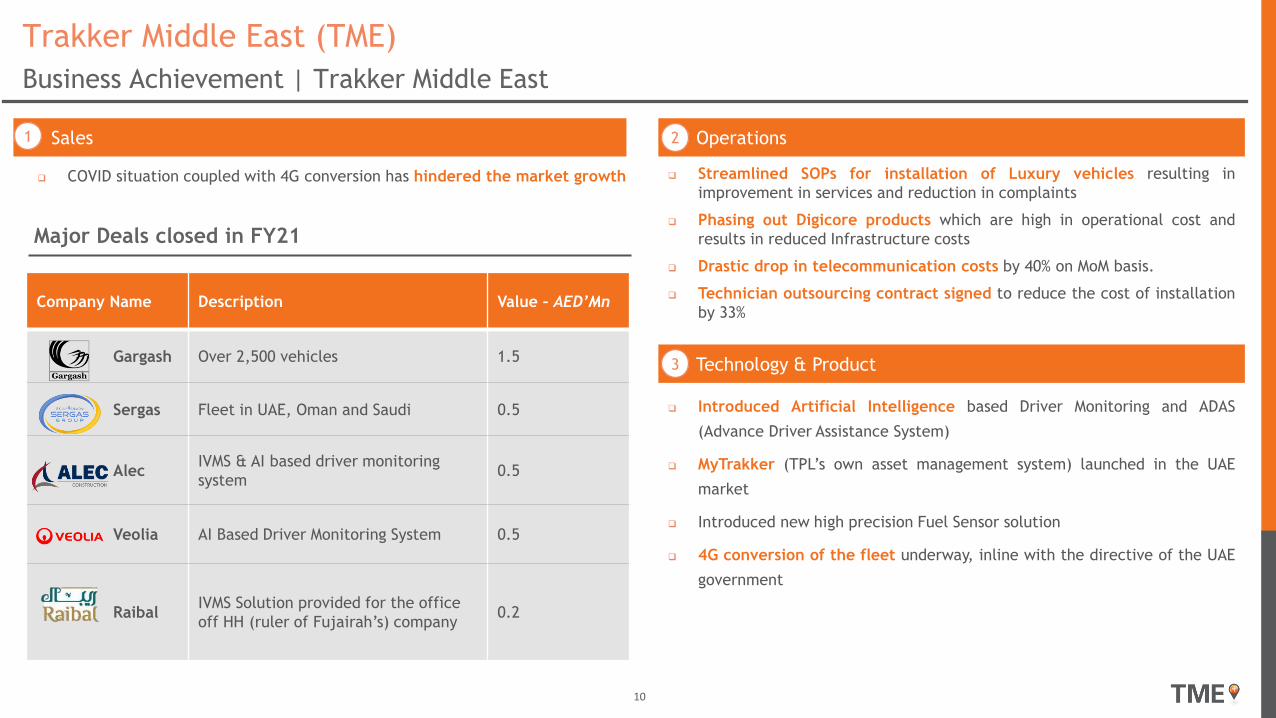
Sales
COVID situation coupled with 4G conversion has hindered the market growth
Company Name Description Value – AED’Mn
Gargash Over 2,500 vehicles 1.5
Sergas Fleet in UAE, Oman and Saudi 0.5
AlecIVMS & AI based driver monitoring
system 0.5
Veolia AI Based Driver Monitoring System 0.5
RaibalIVMS Solution provided for the office
off HH (ruler of Fujairah’s) company 0.2
Major Deals closed in FY21
Operations
Technology & Product
Streamlined SOPs for installation of Luxury vehicles resulting in
improvement in services and reduction in complaints
Phasing out Digicore products which are high in operational cost and
results in reduced Infrastructure costs
Drastic drop in telecommunication costs by 40% on MoM basis.
Technician outsourcing contract signed to reduce the cost of installation
by 33%
Introduced Artificial Intelligence based Driver Monitoring and ADAS
(Advance Driver Assistance System)
MyTrakker (TPL’s own asset management system) launched in the UAE
market
Introduced new high precision Fuel Sensor solution
4G conversion of the fleet underway, inline with the directive of the UAE
government
1 2
3
`
11
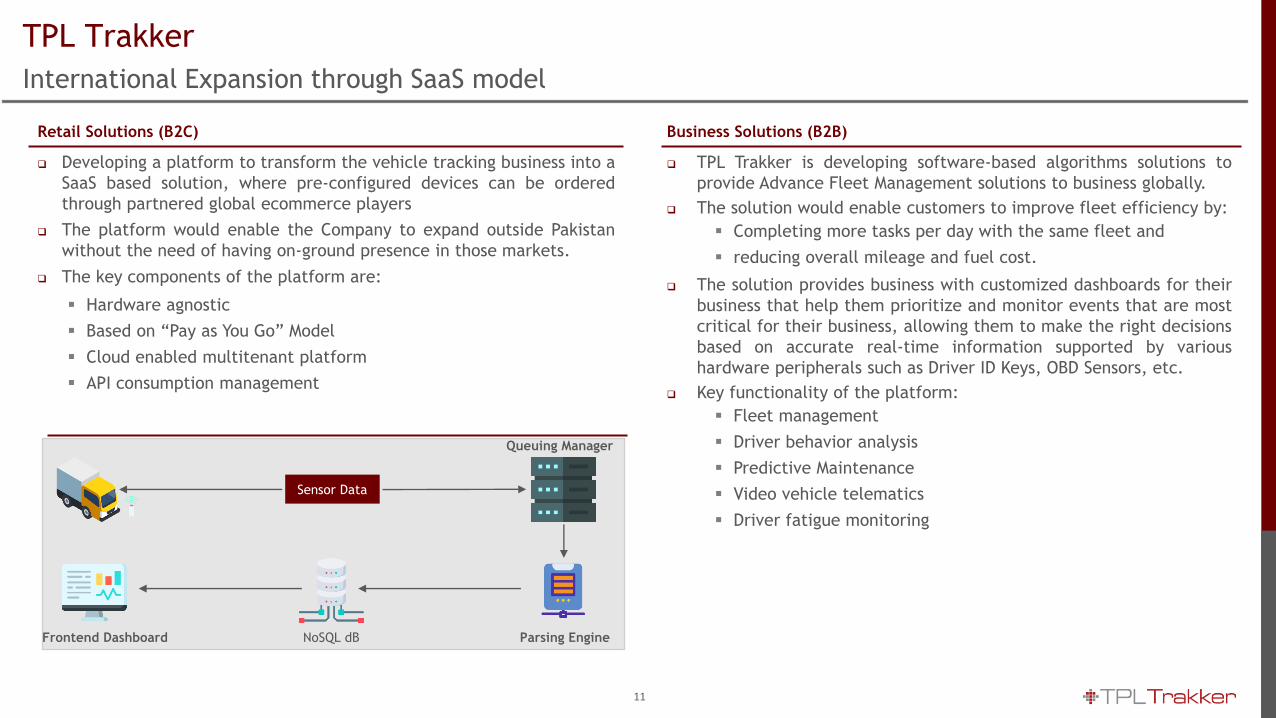
Retail Solutions (B2C)
TPL Trakker
International Expansion through SaaS model
Developing a platform to transform the vehicle tracking business into a
SaaS based solution, where pre-configured devices can be ordered
through partnered global ecommerce players
The platform would enable the Company to expand outside Pakistan
without the need of having on-ground presence in those markets.
The key components of the platform are:
Sensor Data
Queuing Manager
Parsing EngineNoSQL dBFrontend Dashboard
Hardware agnostic
Based on “Pay as You Go” Model
Cloud enabled multitenant platform
API consumption management
TPL Trakker is developing software-based algorithms solutions to
provide Advance Fleet Management solutions to business globally.
The solution would enable customers to improve fleet efficiency by:
Completing more tasks per day with the same fleet and
reducing overall mileage and fuel cost.
The solution provides business with customized dashboards for their
business that help them prioritize and monitor events that are most
critical for their business, allowing them to make the right decisions
based on accurate real-time information supported by various
hardware peripherals such as Driver ID Keys, OBD Sensors, etc.
Key functionality of the platform:
Fleet management
Driver behavior analysis
Predictive Maintenance
Video vehicle telematics
Driver fatigue monitoring
Business Solutions (B2B)

TPL Insurance Limited
`
13
The COVID-19 crisis continues to impact the business with intermittent lockdowns as a result of recent 4th wave.
Discount rate remained stable at 7% during the period.
Motor vehicle sales reported robust increase of 57% YoY during Jul to Jun 2021 (151,182 units in FY2021 Vs 96,455 units in FY2020).
PKR appreciated 6% during the FY2021 at Rs. 157.54 per USD (30 Jun 2020: Rs. 168.1 per USD), although given recent current account deficit,
PKR has devalued post year end.
PSX index reported robust increase during the year by 38% (FY2021: 47,356 Vs FY2020: 34,421).
TPLI’s share price increased from Rs. 22.00 per share in June 2020 to Rs. 39.14 as at 30 June 2021.
TPL InsuranceFY 2021
`
14
TPL Insurance – Key Highlights
Company’s IFS Rating issued by PACRA upgraded to AA-.
Company has received capital injection of Rs. 466.5 million from DEG.
Process of Financial Due Diligence for potential equity investments from FinnFund, a Finnish Sovereign Fund has been completed and we are
expecting Term Sheet.
During the year, the Company’s reinsurance treaty limits for property business increased from Rs. 750 million to Rs. 1.05 billion.
GWP registered 17.5% growth YoY at Rs. 2.91 billion.
NEP increased by 0.4% at Rs.2.19 billion YoY despite higher reinsurance placements to mitigate underwriting risk.
Claim ratio increase by 6% YoY. The ratio was lower last year due to COVID-19 related lockdown.
Commission ratio improved by 2% YoY.
Expense ratio has increased to 52% (2020: 51%), attributed to increased ESOP cost as compared to last year.
Investment / Other income increased by Rs. 16m at Rs. 214 million YoY, mainly due to increase in valuation of mutual fund and equities.
`
15
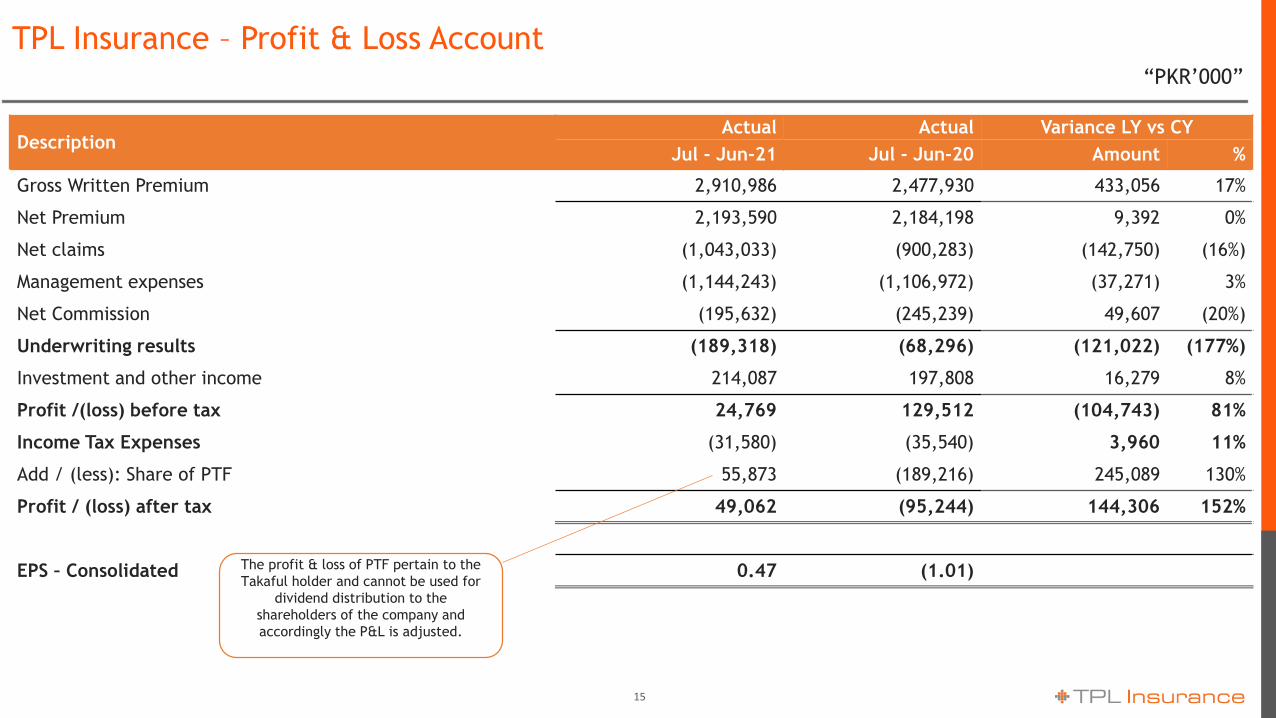
DescriptionActual Actual Variance LY vs CY
Jul - Jun-21 Jul - Jun-20 Amount %
Gross Written Premium 2,910,986 2,477,930 433,056 17%
Net Premium 2,193,590 2,184,198 9,392 0%
Net claims (1,043,033) (900,283) (142,750) (16%)
Management expenses (1,144,243) (1,106,972) (37,271) 3%
Net Commission (195,632) (245,239) 49,607 (20%)
Underwriting results (189,318) (68,296) (121,022) (177%)
Investment and other income 214,087 197,808 16,279 8%
Profit /(loss) before tax 24,769 129,512 (104,743) 81%
Income Tax Expenses (31,580) (35,540) 3,960 11%
Add / (less): Share of PTF 55,873 (189,216) 245,089 130%
Profit / (loss) after tax 49,062 (95,244) 144,306 152%
EPS – Consolidated 0.47 (1.01)
TPL Insurance – Profit & Loss Account“PKR’000”
The profit & loss of PTF pertain to the
Takaful holder and cannot be used for
dividend distribution to the
shareholders of the company and
accordingly the P&L is adjusted.
`
16
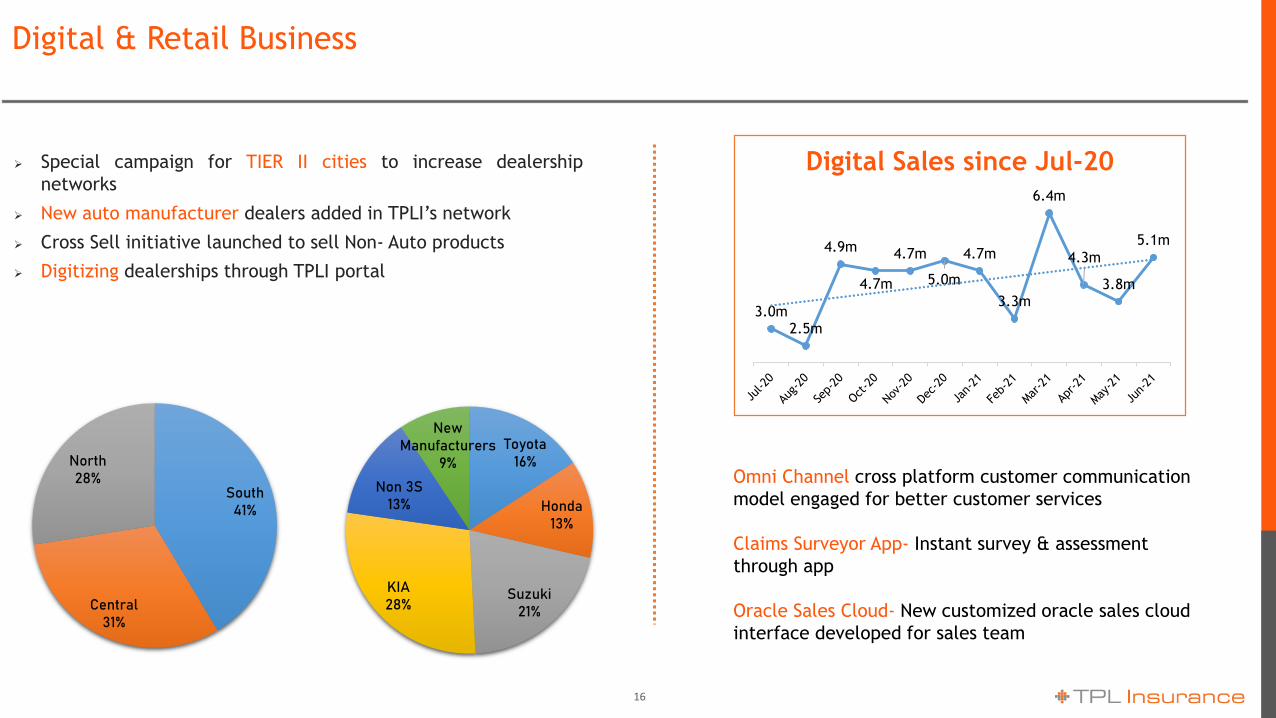
Special campaign for TIER II cities to increase dealership
networks
New auto manufacturer dealers added in TPLI’s network
Cross Sell initiative launched to sell Non- Auto products
Digitizing dealerships through TPLI portal
3.0m2.5m
4.9m
4.7m
4.7m
5.0m
4.7m
3.3m
6.4m
4.3m
3.8m
5.1m
Digital Sales since Jul-20
Toyota16%
Honda13%
Suzuki21%
KIA28%
Non 3S13%
New Manufacturers
9%
South41%
Central31%
North28% Omni Channel cross platform customer communication
model engaged for better customer services
Claims Surveyor App- Instant survey & assessment
through app
Oracle Sales Cloud- New customized oracle sales cloud
interface developed for sales team
Digital & Retail Business
`
17
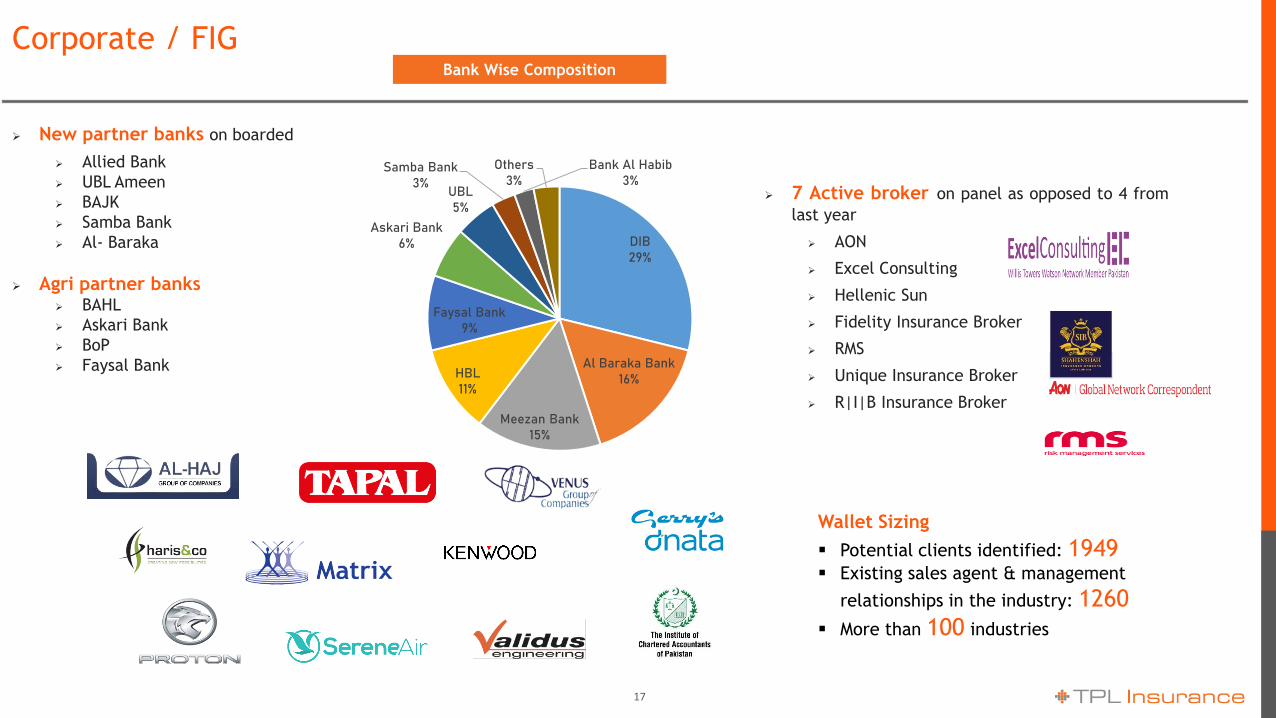
New partner banks on boarded
Allied Bank
UBL Ameen
BAJK
Samba Bank
Al- Baraka
Agri partner banks BAHL
Askari Bank
BoP
Faysal Bank
7 Active broker on panel as opposed to 4 from
last year
AON
Excel Consulting
Hellenic Sun
Fidelity Insurance Broker
RMS
Unique Insurance Broker
R|I|B Insurance Broker
Wallet Sizing
Potential clients identified: 1949 Existing sales agent & management
relationships in the industry: 1260
More than 100 industries
DIB29%
Al Baraka Bank16%
Meezan Bank15%
HBL11%
Faysal Bank9%
Askari Bank6%
UBL5%
Samba Bank3%
Bank Al Habib3%
Others3%
Bank Wise Composition
Corporate / FIG
`
18
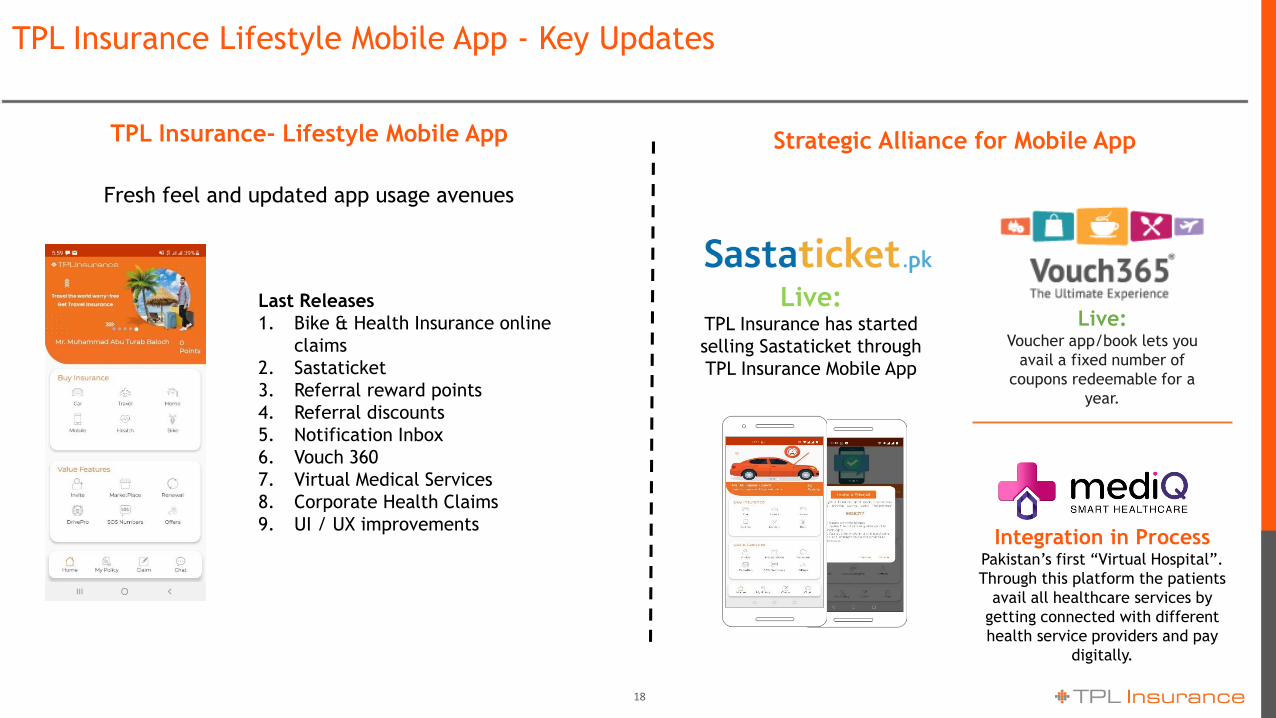
TPL Insurance- Lifestyle Mobile App
Fresh feel and updated app usage avenues
Strategic Alliance for Mobile App
Live: TPL Insurance has started
selling Sastaticket through
TPL Insurance Mobile App
Live:Voucher app/book lets you
avail a fixed number of
coupons redeemable for a
year.
Integration in ProcessPakistan’s first “Virtual Hospital”.
Through this platform the patients
avail all healthcare services by
getting connected with different
health service providers and pay
digitally.
Last Releases
1. Bike & Health Insurance online
claims
2. Sastaticket
3. Referral reward points
4. Referral discounts
5. Notification Inbox
6. Vouch 360
7. Virtual Medical Services
8. Corporate Health Claims
9. UI / UX improvements
TPL Insurance Lifestyle Mobile App - Key Updates
`
19
TPL Insurance – Future Outlook
State Bank has kept the interest rates low for over a year creating demand in the the consumer financing sector especially in auto financing
despite a slight increase in interest rate in the previous monetary policy. However, SBP has made some changes in regulations to discourage auto
financing for imported vehicles and maximum tenure of auto financing has been reduced from seven to five years. Further, minimum down
payment for car financing is raised from 15pc to 30pc.
Although these steps may affect growth but we anticipate that the interest rates would stay at lower levels and would keep supporting the
industry growth and would create new opportunities for insurance penetration predominantly in the manufacturing and house building projects.
Also, we do not anticipate that these measures would affect our revenue streams for the current calendar year due to existing sales funnels.
During 2021, our strategy has been to continually innovate to utilize digital paradigm to redefine insurance. During the course of past few years,
we capitalized on our digital assets and utilize rich data to ensure most hassle free policy issuance, claims and renewal process. The Company
plans to continue its growth path in non-motor segment to diversify its portfolio and increase its market share. The Company is developing
market for innovative products such as yield based crop insurance, livestock, bike, extended warranty insurance etc.
We are confident that these measures will enable the Company to achieve sustainable profitable growth in the years to come.
TPL Properties
Limited
21
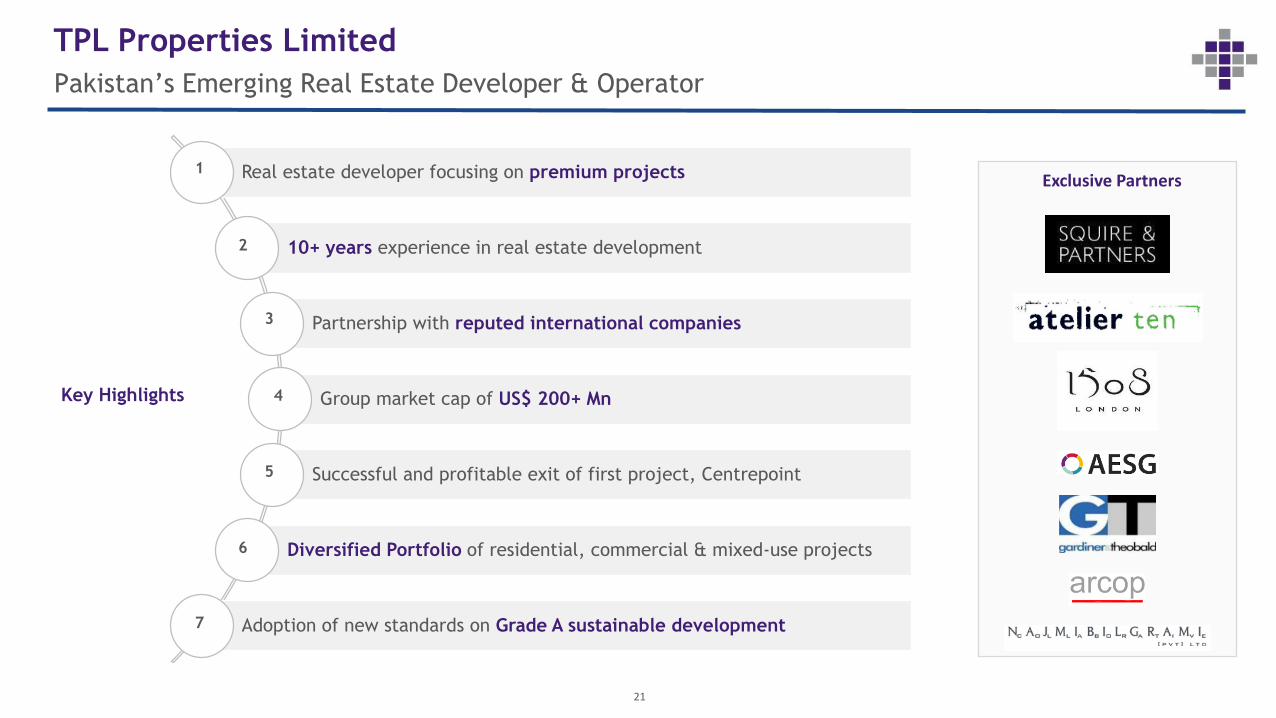
Pakistan’s Emerging Real Estate Developer & Operator
TPL Properties Limited
Real estate developer focusing on premium projects
10+ years experience in real estate development
Partnership with reputed international companies
Group market cap of US$ 200+ Mn
Successful and profitable exit of first project, Centrepoint
Diversified Portfolio of residential, commercial & mixed-use projects
Adoption of new standards on Grade A sustainable development
Key Highlights
1
2
3
4
5
6
Exclusive Partners
7
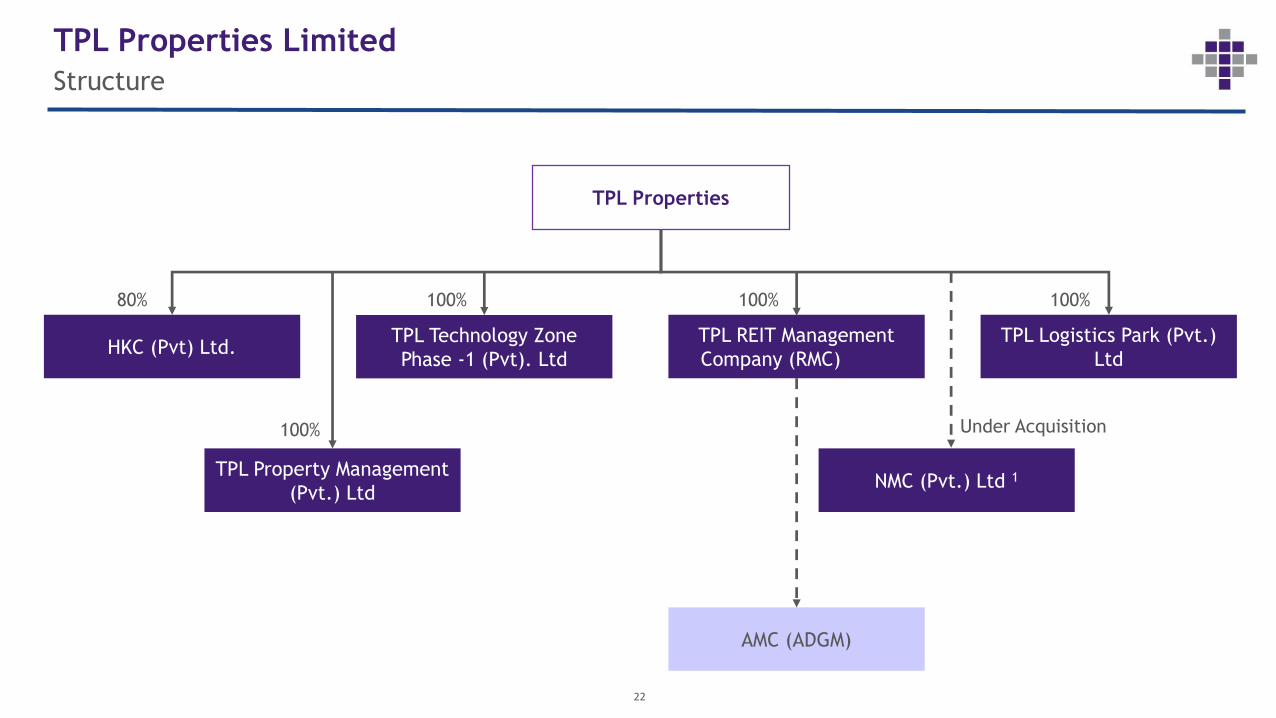
22
Structure
TPL Properties Limited
TPL Properties
HKC (Pvt) Ltd.TPL Technology Zone
Phase -1 (Pvt). Ltd
TPL REIT Management
Company (RMC)
TPL Logistics Park (Pvt.)
Ltd
TPL Property Management
(Pvt.) LtdNMC (Pvt.) Ltd 1
80% 100% 100% 100%
100% Under Acquisition
AMC (ADGM)
23
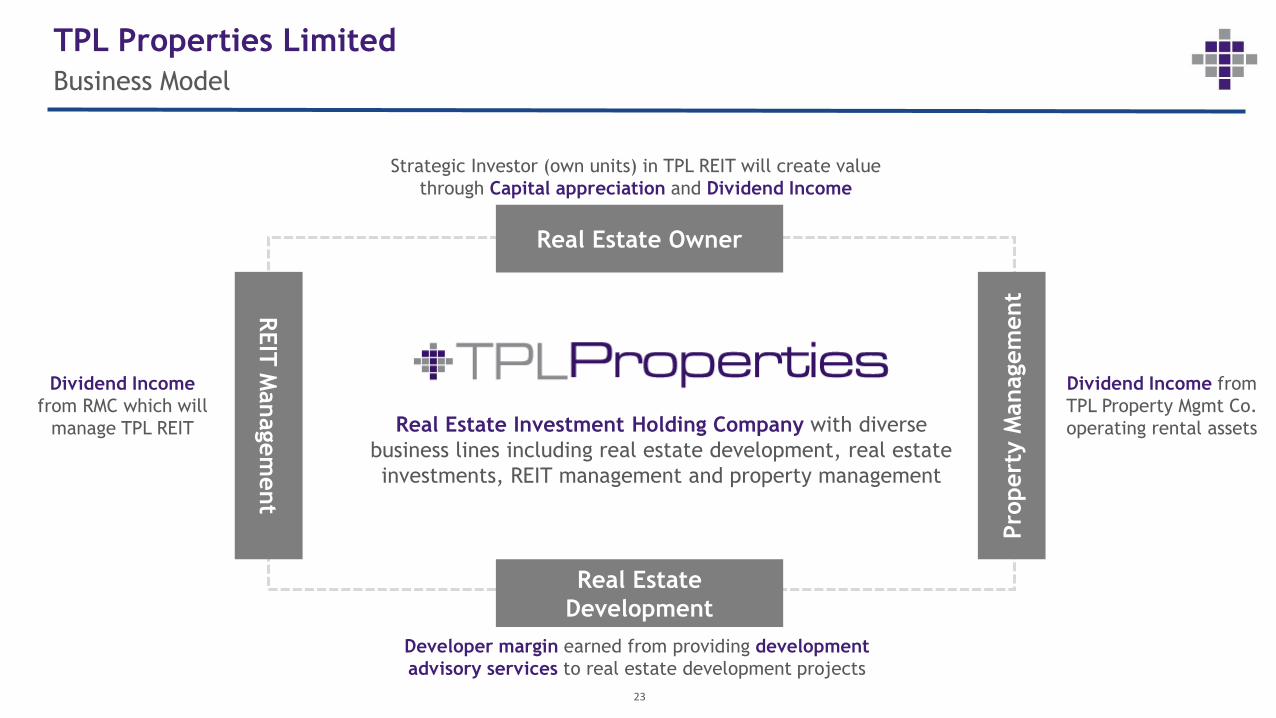
Business Model
TPL Properties Limited
Real Estate Investment Holding Company with diverse
business lines including real estate development, real estate
investments, REIT management and property management
Real Estate
Development
Developer margin earned from providing development
advisory services to real estate development projects
Strategic Investor (own units) in TPL REIT will create value
through Capital appreciation and Dividend Income
Dividend Income
from RMC which will
manage TPL REIT
Dividend Income from
TPL Property Mgmt Co.
operating rental assets
Real Estate Owner
REIT
Managem
ent
Pro
pert
y M
anagem
ent
Projects Update
• One Hoshang (HKC Pvt Ltd)
• Technology Park (TPL Technology Zone Phase One)
• Mangrove (NMC)
25
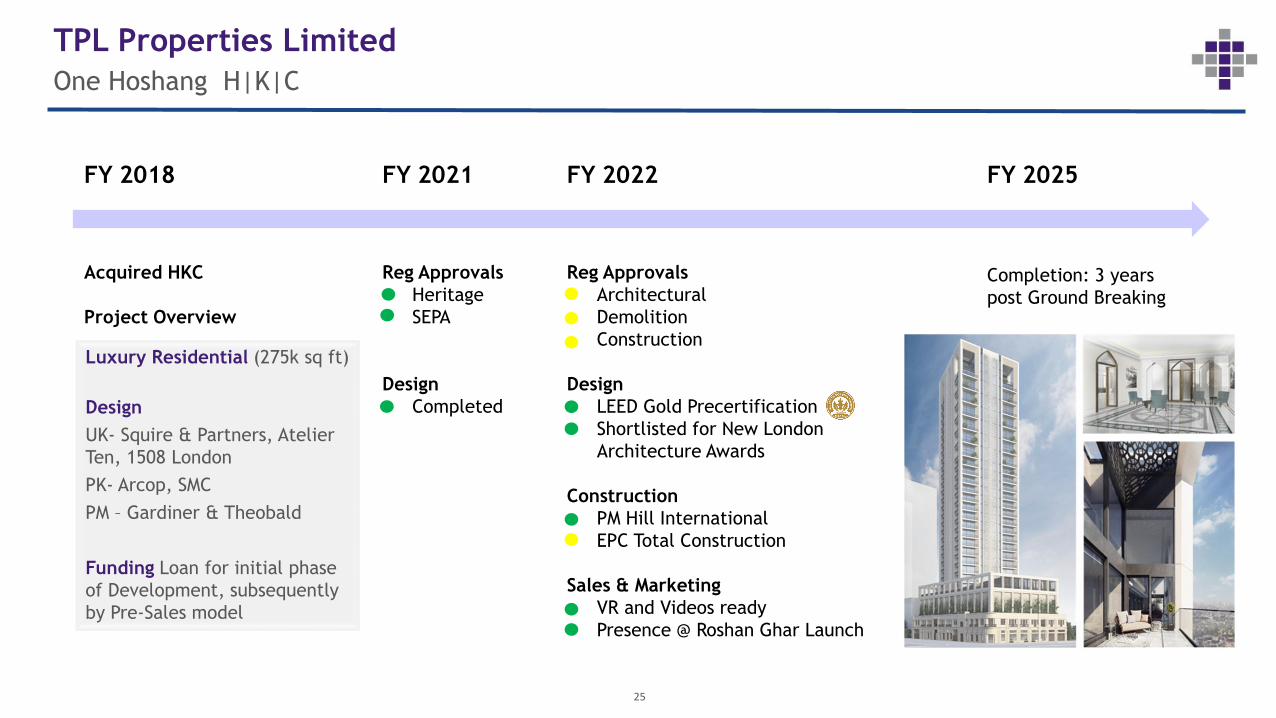
One Hoshang H|K|C
TPL Properties Limited
FY 2018 FY 2021 FY 2025FY 2022
Acquired HKC
Project Overview
Reg Approvals
• Heritage
• SEPA
Design
• Completed
Reg Approvals
• Architectural
• Demolition
• Construction
Design
• LEED Gold Precertification
• Shortlisted for New London
Architecture Awards
Construction
• PM Hill International
• EPC Total Construction
Sales & Marketing
• VR and Videos ready
• Presence @ Roshan Ghar Launch
Completion: 3 years
post Ground Breaking
Luxury Residential (275k sq ft)
Design
UK- Squire & Partners, Atelier
Ten, 1508 London
PK- Arcop, SMC
PM – Gardiner & Theobald
Funding Loan for initial phase
of Development, subsequently
by Pre-Sales model
26
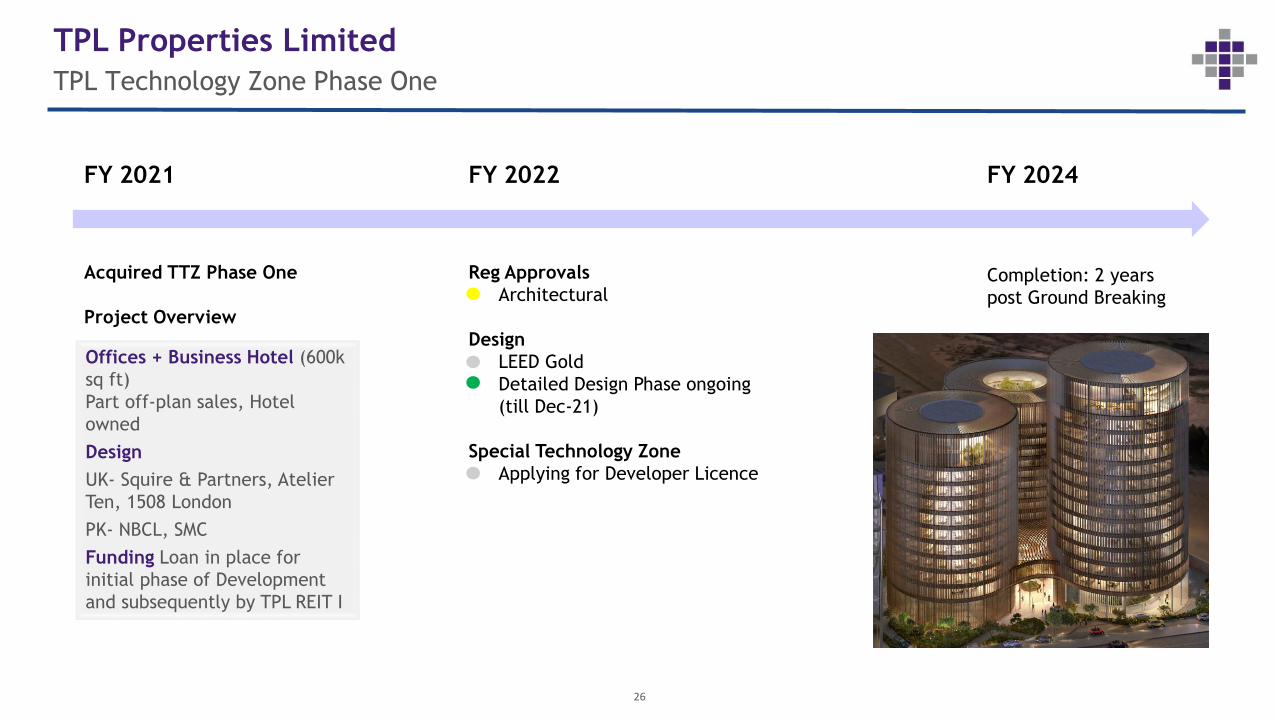
TPL Technology Zone Phase One
TPL Properties Limited
FY 2021 FY 2024FY 2022
Acquired TTZ Phase One
Project Overview
Reg Approvals
• Architectural
Design
• LEED Gold
• Detailed Design Phase ongoing
(till Dec-21)
Special Technology Zone
• Applying for Developer Licence
Completion: 2 years
post Ground Breaking
Offices + Business Hotel (600k
sq ft)
Part off-plan sales, Hotel
owned
Design
UK- Squire & Partners, Atelier
Ten, 1508 London
PK- NBCL, SMC
Funding Loan in place for
initial phase of Development
and subsequently by TPL REIT I
27
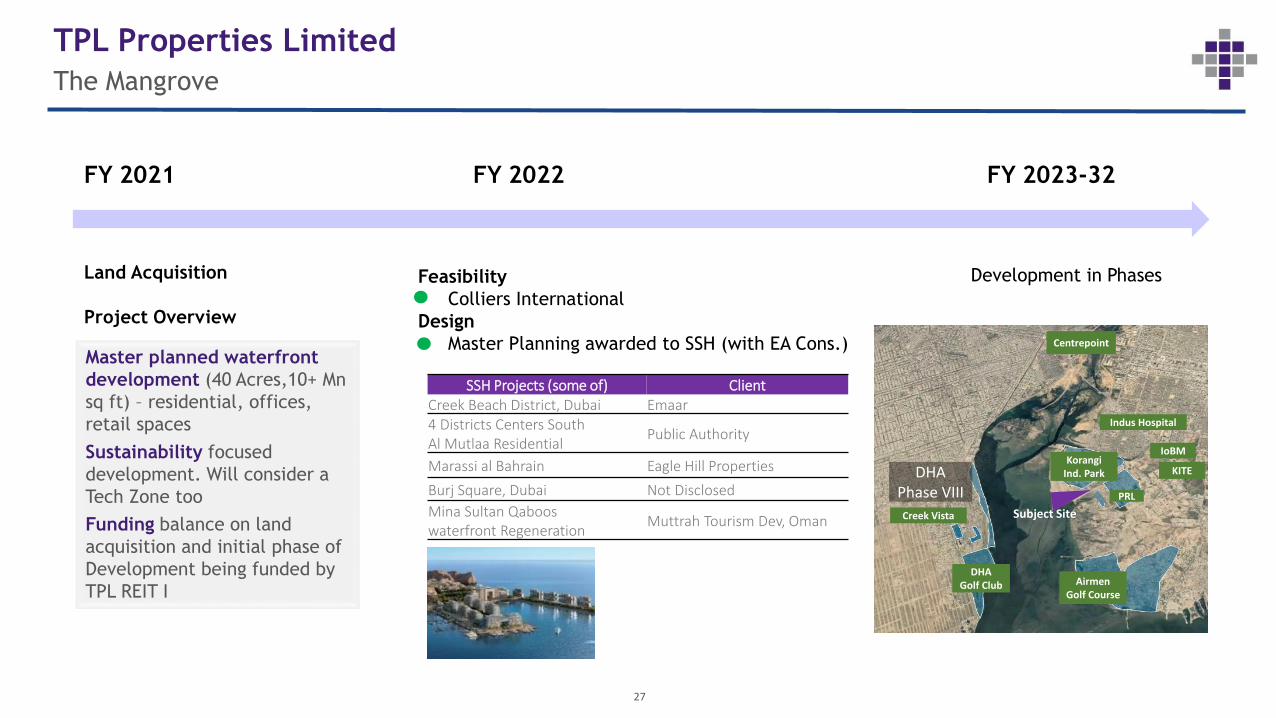
The Mangrove
TPL Properties Limited
FY 2021 FY 2023-32FY 2022
Land Acquisition
Project Overview
Feasibility
• Colliers International
Design
• Master Planning awarded to SSH (with EA Cons.)
Development in Phases
Master planned waterfront
development (40 Acres,10+ Mn
sq ft) – residential, offices,
retail spaces
Sustainability focused
development. Will consider a
Tech Zone too
Funding balance on land
acquisition and initial phase of
Development being funded by
TPL REIT I
Subject Site
PRL
DHA Golf Club
Creek Vista
KorangiInd. Park
Indus Hospital
IoBM
KITEDHA Phase VIII
Airmen Golf Course
Centrepoint
SSH Projects (some of) ClientCreek Beach District, Dubai Emaar4 Districts Centers South Al Mutlaa Residential
Public Authority
Marassi al Bahrain Eagle Hill Properties
Burj Square, Dubai Not Disclosed
Mina Sultan Qaboos waterfront Regeneration
Muttrah Tourism Dev, Oman
REIT Update
• RMC
• AMC (Abu Dhabi)
29
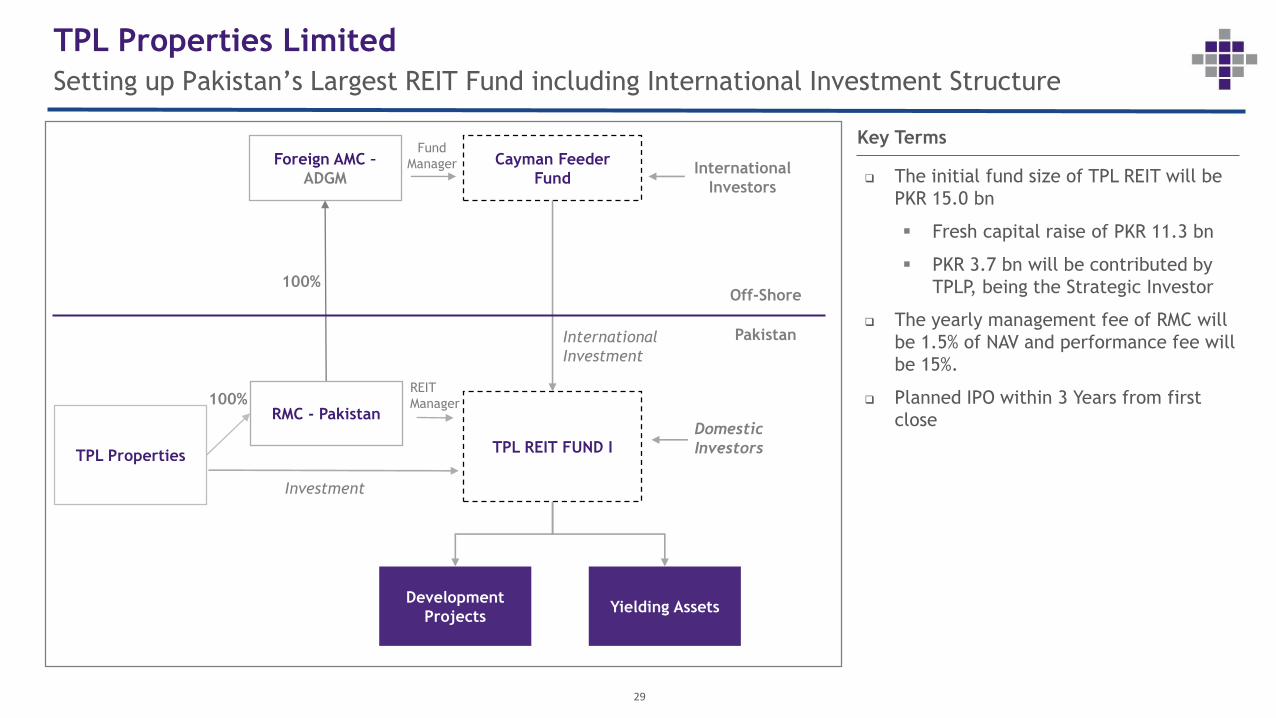
Setting up Pakistan’s Largest REIT Fund including International Investment Structure
TPL Properties Limited
Foreign AMC –
ADGM
Cayman Feeder
FundInternational
Investors
TPL PropertiesTPL REIT FUND I
RMC - PakistanDomestic
Investors
Development
ProjectsYielding Assets
Pakistan
Off-Shore
Investment
REIT
Manager100%
100%
International
Investment
Fund
Manager
Key Terms
The initial fund size of TPL REIT will be
PKR 15.0 bn
Fresh capital raise of PKR 11.3 bn
PKR 3.7 bn will be contributed by
TPLP, being the Strategic Investor
The yearly management fee of RMC will
be 1.5% of NAV and performance fee will
be 15%.
Planned IPO within 3 Years from first
close
30
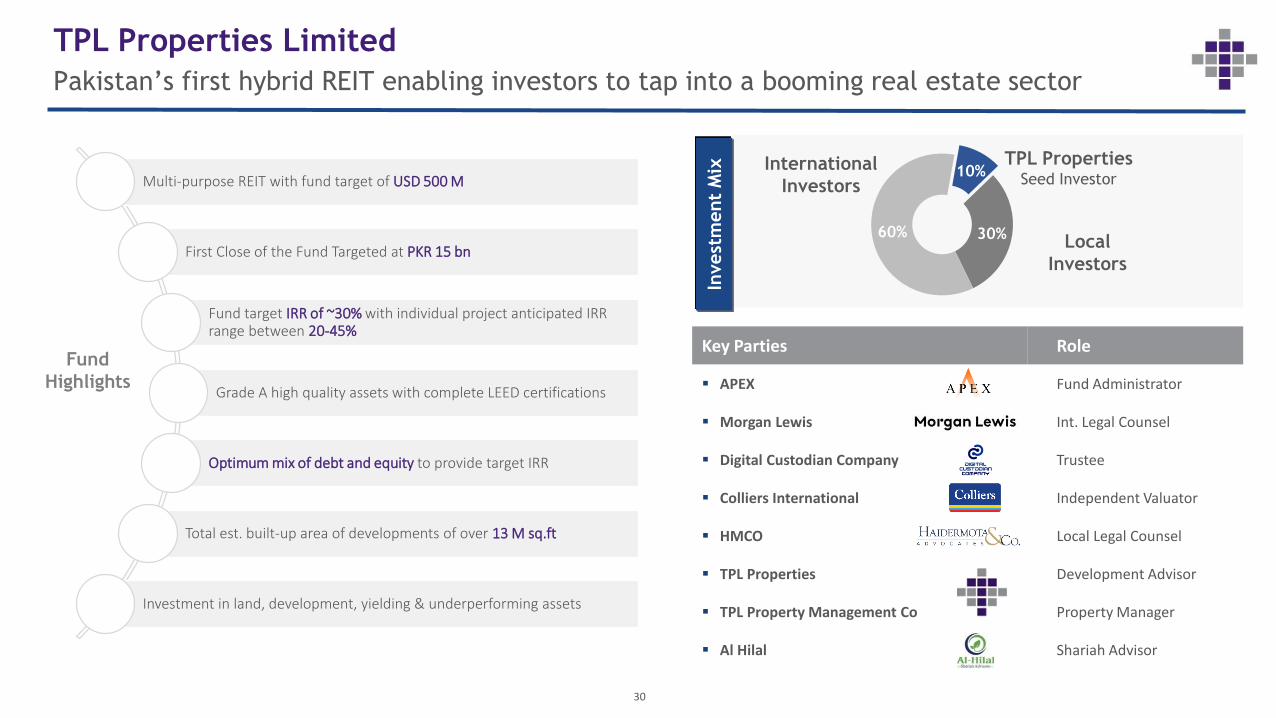
Pakistan’s first hybrid REIT enabling investors to tap into a booming real estate sector
TPL Properties Limited
Multi-purpose REIT with fund target of USD 500 M
First Close of the Fund Targeted at PKR 15 bn
Fund target IRR of ~30% with individual project anticipated IRR range between 20-45%
Grade A high quality assets with complete LEED certifications
Optimum mix of debt and equity to provide target IRR
Total est. built-up area of developments of over 13 M sq.ft
Investment in land, development, yielding & underperforming assets
Fund
Highlights
10%
30%60%Local
Investors
International
Investors
Key Parties Role
APEX Fund Administrator
Morgan Lewis Int. Legal Counsel
Digital Custodian Company Trustee
Colliers International Independent Valuator
HMCO Local Legal Counsel
TPL Properties Development Advisor
TPL Property Management Co Property Manager
Al Hilal Shariah Advisor
Invest
ment
Mix
TPL PropertiesSeed Investor
31
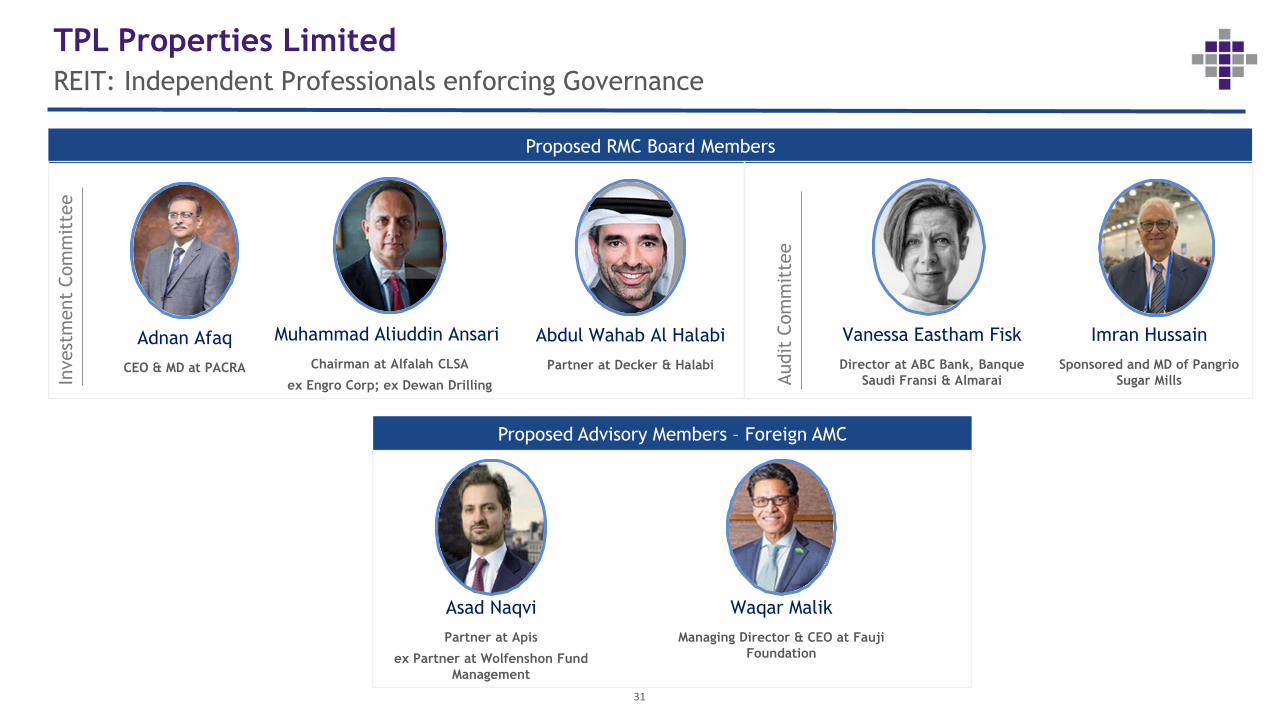
REIT: Independent Professionals enforcing Governance
TPL Properties Limited
Proposed RMC Board Members
Proposed Advisory Members – Foreign AMC
Asad Naqvi
Partner at Apis
ex Partner at Wolfenshon Fund
Management
Waqar Malik
Managing Director & CEO at Fauji
Foundation
Invest
ment
Com
mit
tee
Adnan Afaq
CEO & MD at PACRA
Muhammad Aliuddin Ansari
Chairman at Alfalah CLSA
ex Engro Corp; ex Dewan Drilling
Abdul Wahab Al Halabi
Partner at Decker & Halabi
Audit
Com
mit
tee
Vanessa Eastham Fisk
Director at ABC Bank, Banque
Saudi Fransi & Almarai
Imran Hussain
Sponsored and MD of Pangrio
Sugar Mills
32
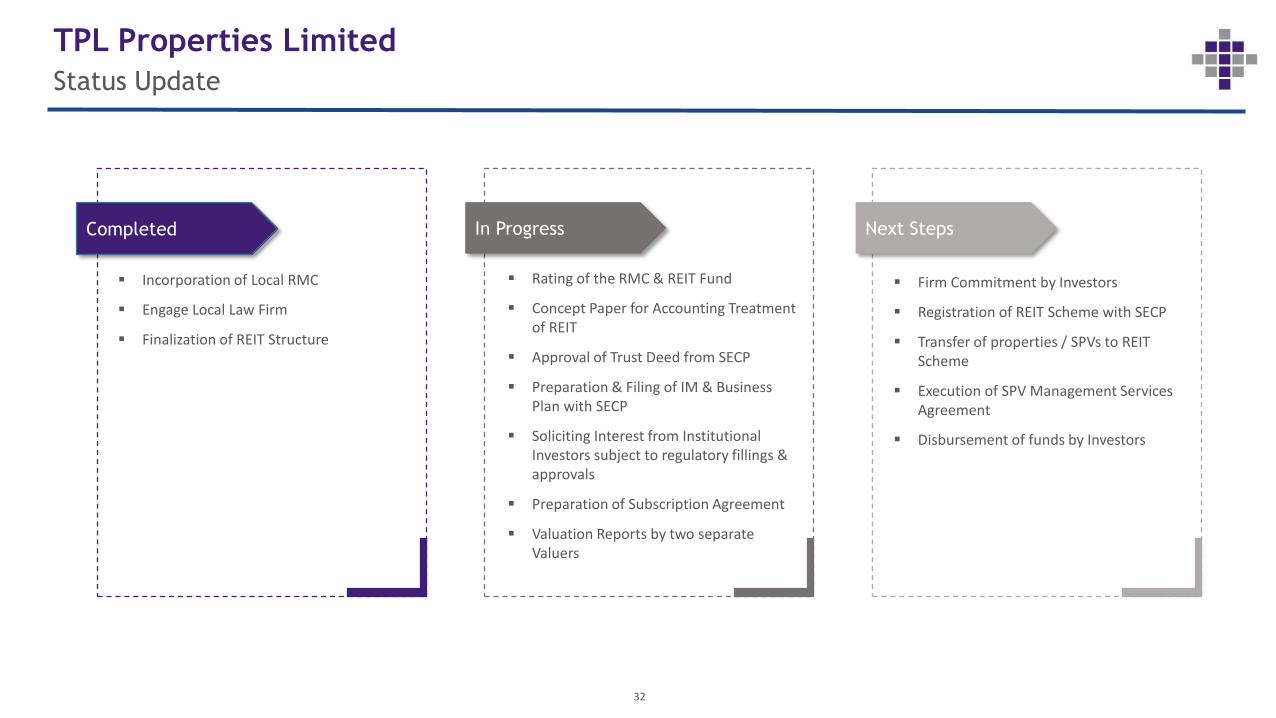
Status Update
TPL Properties Limited
Completed In Progress Next Steps
Incorporation of Local RMC
Engage Local Law Firm
Finalization of REIT Structure
Rating of the RMC & REIT Fund
Concept Paper for Accounting Treatment of REIT
Approval of Trust Deed from SECP
Preparation & Filing of IM & Business Plan with SECP
Soliciting Interest from Institutional Investors subject to regulatory fillings & approvals
Preparation of Subscription Agreement
Valuation Reports by two separate Valuers
Firm Commitment by Investors
Registration of REIT Scheme with SECP
Transfer of properties / SPVs to REIT Scheme
Execution of SPV Management Services Agreement
Disbursement of funds by Investors

Financials
• 30 June 2021
34
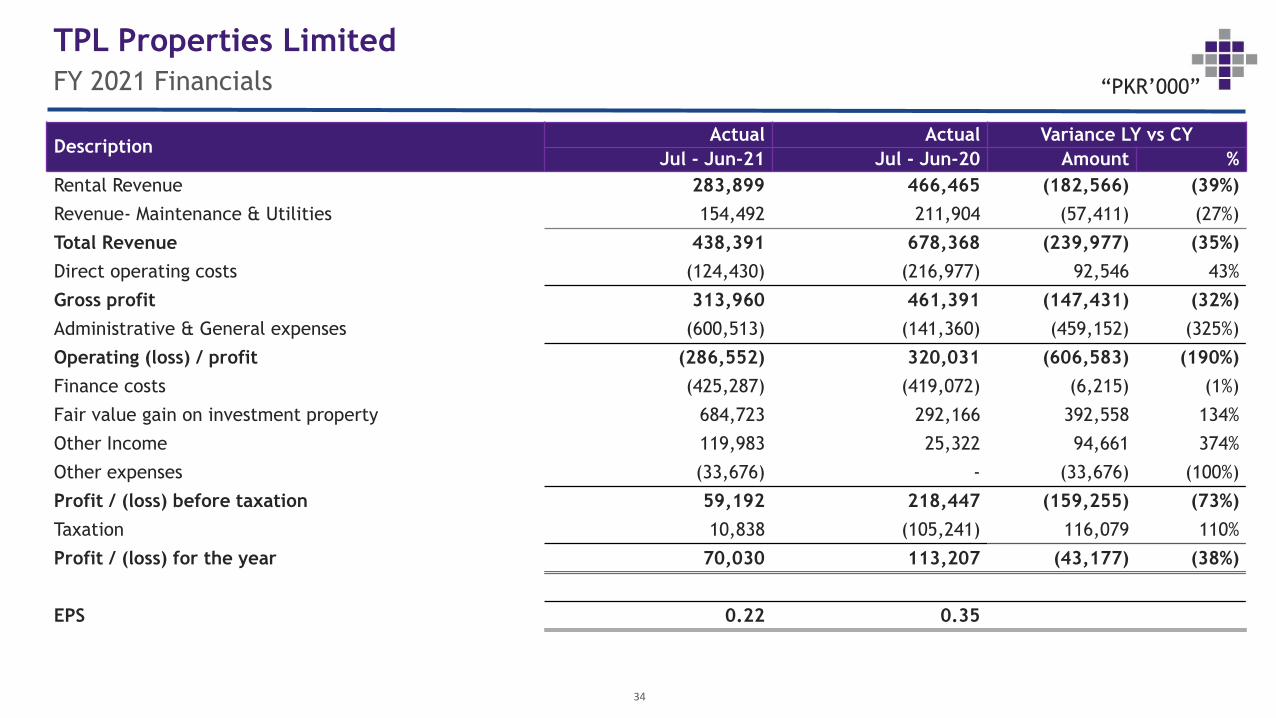
FY 2021 Financials
TPL Properties Limited
“PKR’000”
DescriptionActual Actual Variance LY vs CY
Jul - Jun-21 Jul - Jun-20 Amount %
Rental Revenue 283,899 466,465 (182,566) (39%)
Revenue- Maintenance & Utilities 154,492 211,904 (57,411) (27%)
Total Revenue 438,391 678,368 (239,977) (35%)
Direct operating costs (124,430) (216,977) 92,546 43%
Gross profit 313,960 461,391 (147,431) (32%)
Administrative & General expenses (600,513) (141,360) (459,152) (325%)
Operating (loss) / profit (286,552) 320,031 (606,583) (190%)
Finance costs (425,287) (419,072) (6,215) (1%)
Fair value gain on investment property 684,723 292,166 392,558 134%
Other Income 119,983 25,322 94,661 374%
Other expenses (33,676) - (33,676) (100%)
Profit / (loss) before taxation 59,192 218,447 (159,255) (73%)
Taxation 10,838 (105,241) 116,079 110%
Profit / (loss) for the year 70,030 113,207 (43,177) (38%)
EPS 0.22 0.35

TPL Life Insurance
Limited
`
36
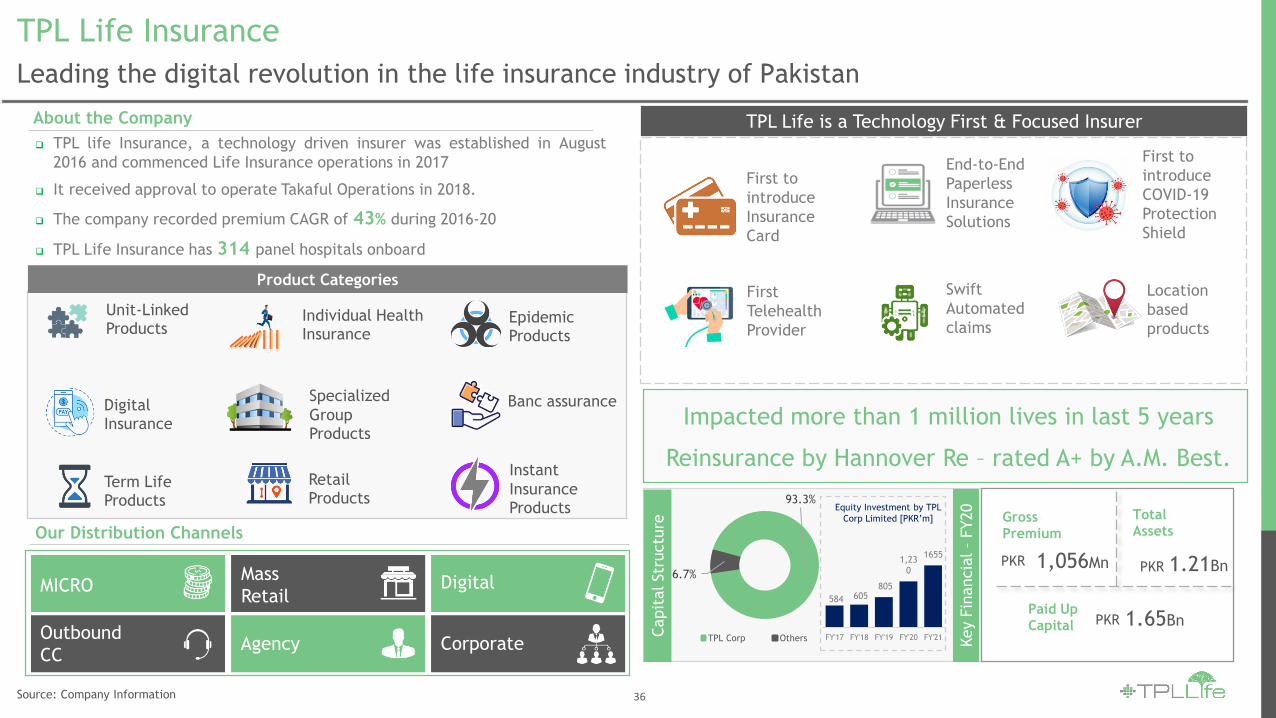
TPL Life Insurance
Leading the digital revolution in the life insurance industry of Pakistan
TPL life Insurance, a technology driven insurer was established in August
2016 and commenced Life Insurance operations in 2017
It received approval to operate Takaful Operations in 2018.
The company recorded premium CAGR of 43% during 2016-20
TPL Life Insurance has 314 panel hospitals onboard
Impacted more than 1 million lives in last 5 years
Reinsurance by Hannover Re – rated A+ by A.M. Best.
Our Distribution Channels
MICROMass
RetailDigital
Outbound
CCAgency Corporate
About the Company
Source: Company Information
Epidemic Products
Product Categories
Unit-Linked Products
Individual Health Insurance
Digital Insurance
TPL Life is a Technology First & Focused Insurer
End-to-End
Paperless
Insurance
Solutions
First to
introduce
Insurance
Card
First to
introduce
COVID-19
Protection
Shield
93.3%
6.7%
TPL Corp Others Key F
inancia
l –
FY20
Capit
al Str
uctu
re
584 605 805
1,230
1655
FY'17 FY'18 FY'19 FY'20 FY'21
Equity Investment by TPL
Corp Limited [PKR’m]
Term Life Products
Banc assurance
RetailProducts
Specialized
Group Products
Instant
Insurance Products
First
Telehealth
Provider
Swift
Automated
claims
Location
based
products
Gross Premium
1,056MnPKR
Total Assets
1.21BnPKR
Paid UpCapital 1.65BnPKR
`
37Source: Company Information
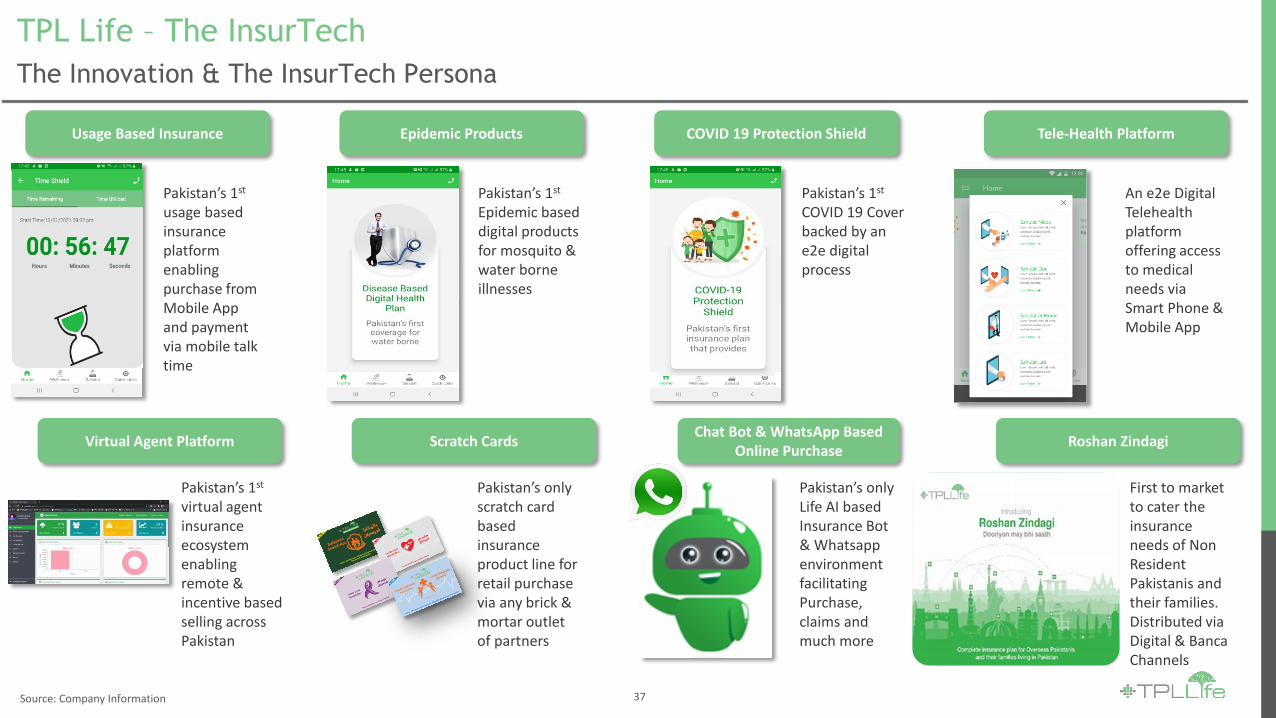
Usage Based Insurance Epidemic Products COVID 19 Protection Shield Tele-Health Platform
Virtual Agent Platform Scratch CardsChat Bot & WhatsApp Based
Online PurchaseRoshan Zindagi
Pakistan’s 1st
usage based insurance platform enabling purchase from Mobile App and payment via mobile talk time
Pakistan’s 1st
Epidemic based digital products for mosquito & water borne illnesses
Pakistan’s 1st
COVID 19 Cover backed by an e2e digital process
An e2e Digital Telehealth platform offering access to medical needs via Smart Phone & Mobile App
Pakistan’s 1st
virtual agent insurance ecosystem enabling remote & incentive based selling across Pakistan
Pakistan’s only scratch card based insurance product line for retail purchase via any brick & mortar outlet of partners
Pakistan’s only Life AI based Insurance Bot & Whatsapp environment facilitating Purchase, claims and much more
First to market to cater the insurance needs of Non Resident Pakistanis and their families. Distributed via Digital & Banca Channels
TPL Life – The InsurTech
The Innovation & The InsurTech Persona
`
38
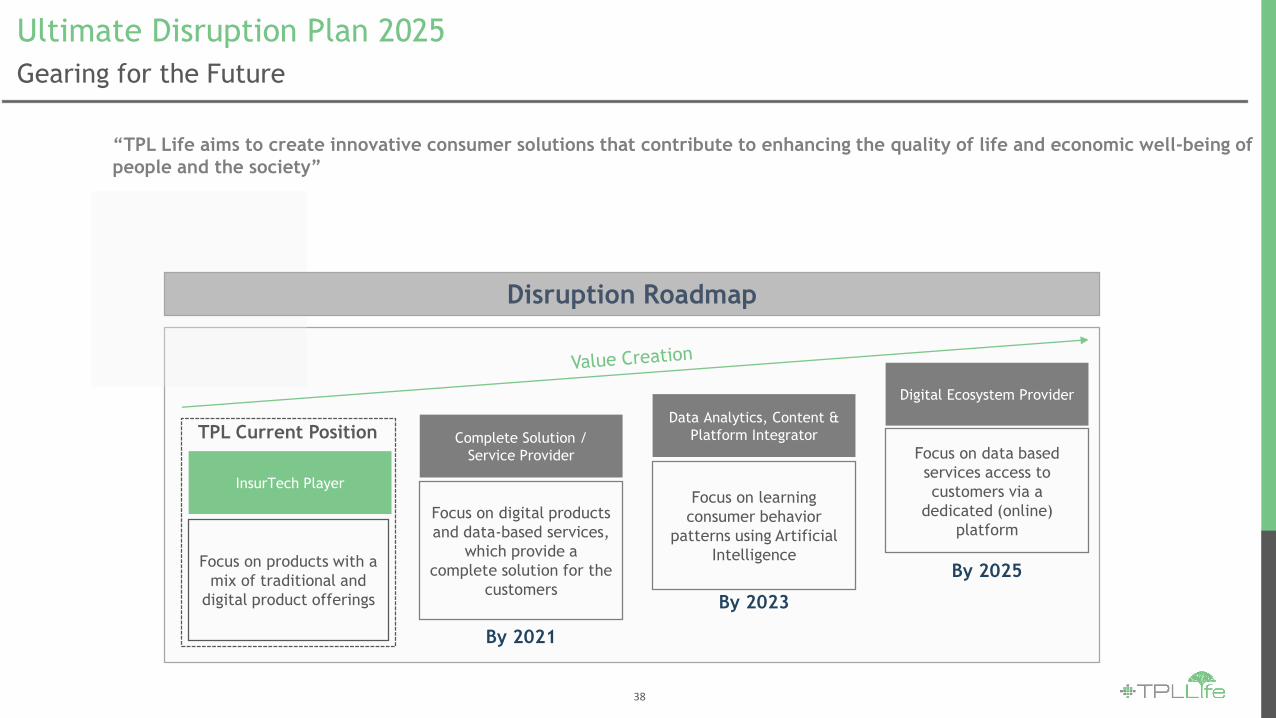
InsurTech Player
Focus on products with a
mix of traditional and
digital product offerings
Complete Solution /
Service Provider
Focus on digital products
and data-based services,
which provide a
complete solution for the
customers
Data Analytics, Content &
Platform Integrator
Focus on learning
consumer behavior
patterns using Artificial
Intelligence
Digital Ecosystem Provider
Focus on data based
services access to
customers via a
dedicated (online)
platform
By 2021
By 2023
By 2025
TPL Current Position
Disruption Roadmap
“TPL Life aims to create innovative consumer solutions that contribute to enhancing the quality of life and economic well-being of
people and the society”
Ultimate Disruption Plan 2025
Gearing for the Future
`
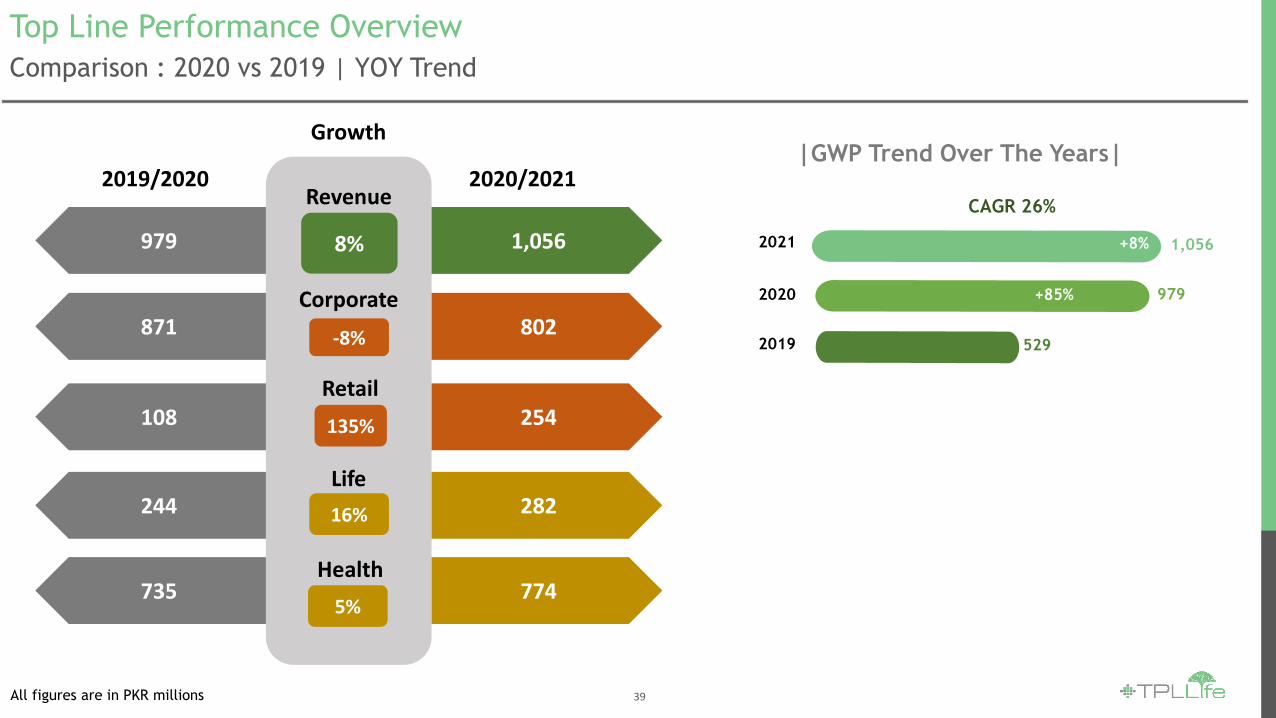
39All figures are in PKR millions
Comparison : 2020 vs 2019 | YOY Trend
Top Line Performance Overview
1,056
802
254
282
774
979
871
108
244
735
Revenue
Corporate
Retail
Life
Health
2019/2020 2020/2021
8%
-8%
16%
5%
135%
Growth
2019
2020
2021
529
979
1,056
CAGR 26%
+85%
+8%
|GWP Trend Over The Years|
`
40
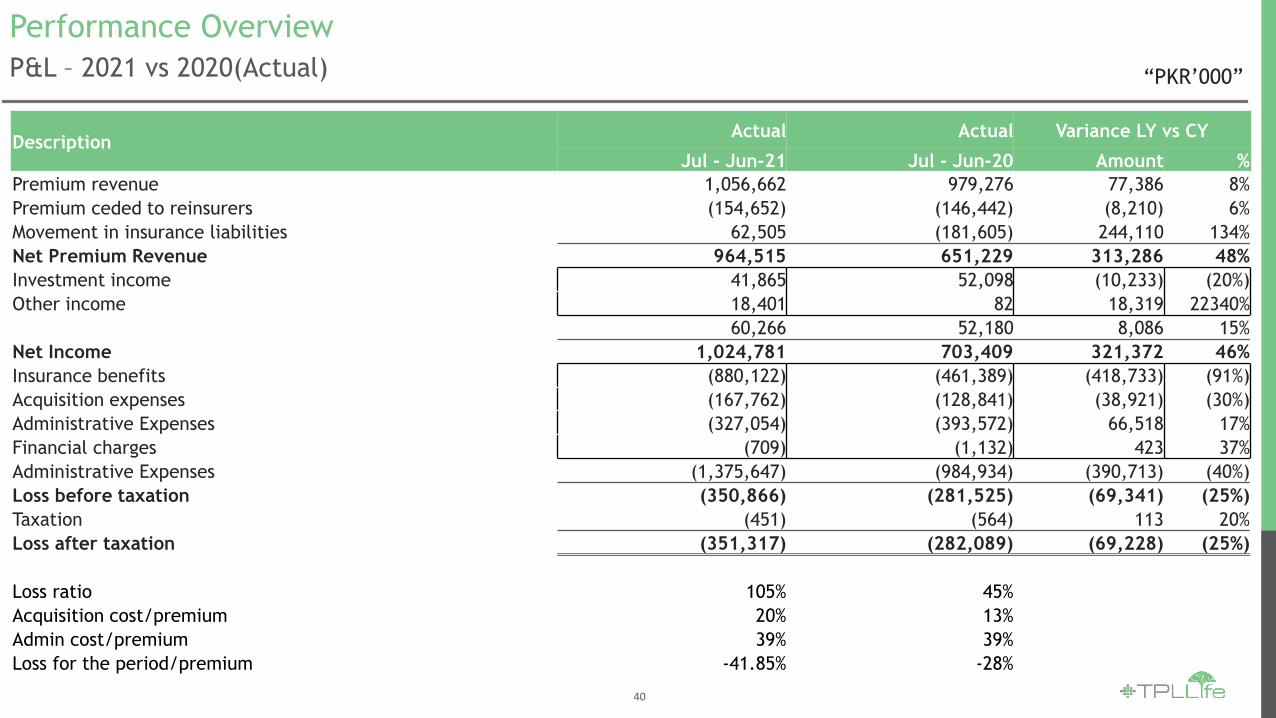
P&L – 2021 vs 2020(Actual)
Performance Overview
“PKR’000”
DescriptionActual Actual Variance LY vs CY
Jul - Jun-21 Jul - Jun-20 Amount %
Premium revenue 1,056,662 979,276 77,386 8%
Premium ceded to reinsurers (154,652) (146,442) (8,210) 6%
Movement in insurance liabilities 62,505 (181,605) 244,110 134%
Net Premium Revenue 964,515 651,229 313,286 48%
Investment income 41,865 52,098 (10,233) (20%)
Other income 18,401 82 18,319 22340%
60,266 52,180 8,086 15%
Net Income 1,024,781 703,409 321,372 46%
Insurance benefits (880,122) (461,389) (418,733) (91%)
Acquisition expenses (167,762) (128,841) (38,921) (30%)
Administrative Expenses (327,054) (393,572) 66,518 17%
Financial charges (709) (1,132) 423 37%
Administrative Expenses (1,375,647) (984,934) (390,713) (40%)
Loss before taxation (350,866) (281,525) (69,341) (25%)
Taxation (451) (564) 113 20%
Loss after taxation (351,317) (282,089) (69,228) (25%)
Loss ratio 105% 45%
Acquisition cost/premium 20% 13%
Admin cost/premium 39% 39%
Loss for the period/premium -41.85% -28%
TPL e-Ventures
(Private) Limited
42
`
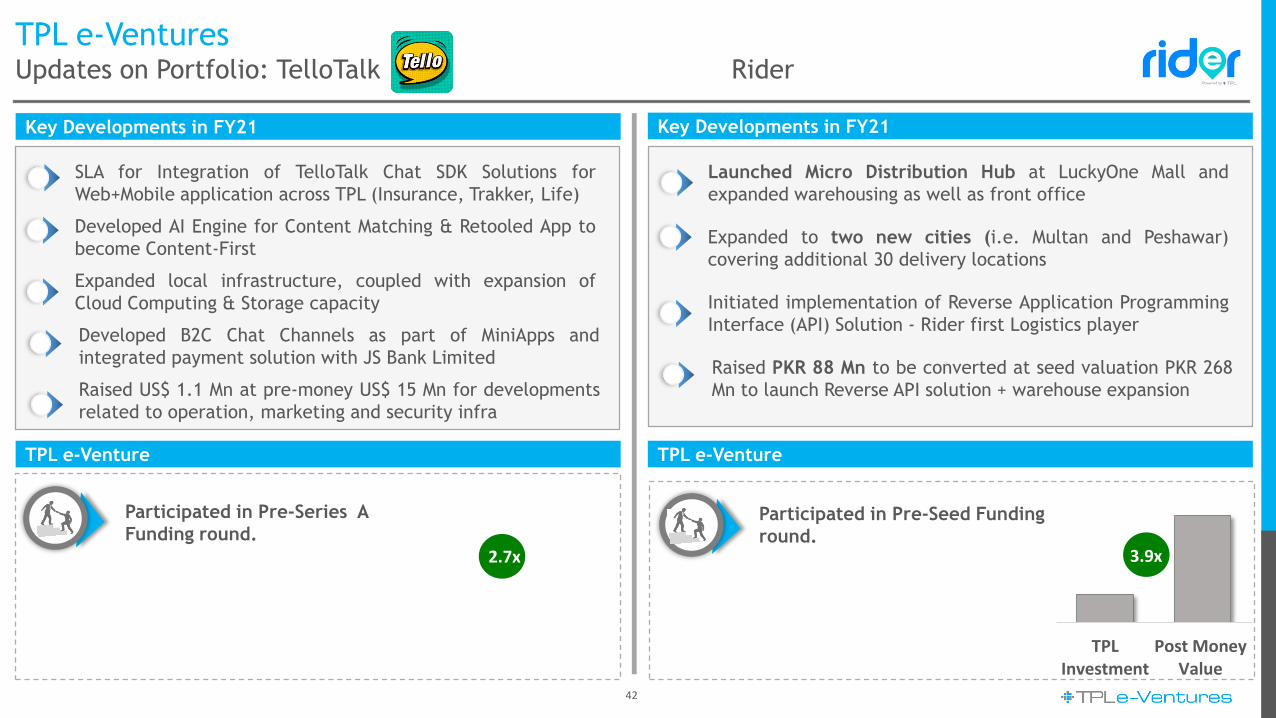
TPL e-VenturesUpdates on Portfolio: TelloTalk Rider
Key Developments in FY21 Key Developments in FY21
SLA for Integration of TelloTalk Chat SDK Solutions for
Web+Mobile application across TPL (Insurance, Trakker, Life)
Developed AI Engine for Content Matching & Retooled App to
become Content-First
Expanded local infrastructure, coupled with expansion of
Cloud Computing & Storage capacity
Developed B2C Chat Channels as part of MiniApps and
integrated payment solution with JS Bank Limited
TPL e-Venture
Raised US$ 1.1 Mn at pre-money US$ 15 Mn for developments
related to operation, marketing and security infra
Participated in Pre-Series A
Funding round.
2.7x
TPL e-Venture
Participated in Pre-Seed Funding
round.
TPLInvestment
Post MoneyValue
3.9x
Launched Micro Distribution Hub at LuckyOne Mall and
expanded warehousing as well as front office
Expanded to two new cities (i.e. Multan and Peshawar)
covering additional 30 delivery locations
Initiated implementation of Reverse Application Programming
Interface (API) Solution - Rider first Logistics player
Raised PKR 88 Mn to be converted at seed valuation PKR 268
Mn to launch Reverse API solution + warehouse expansion

Group Performance
TPL Corp Limited
Consolidated Financial
Statements
`
45
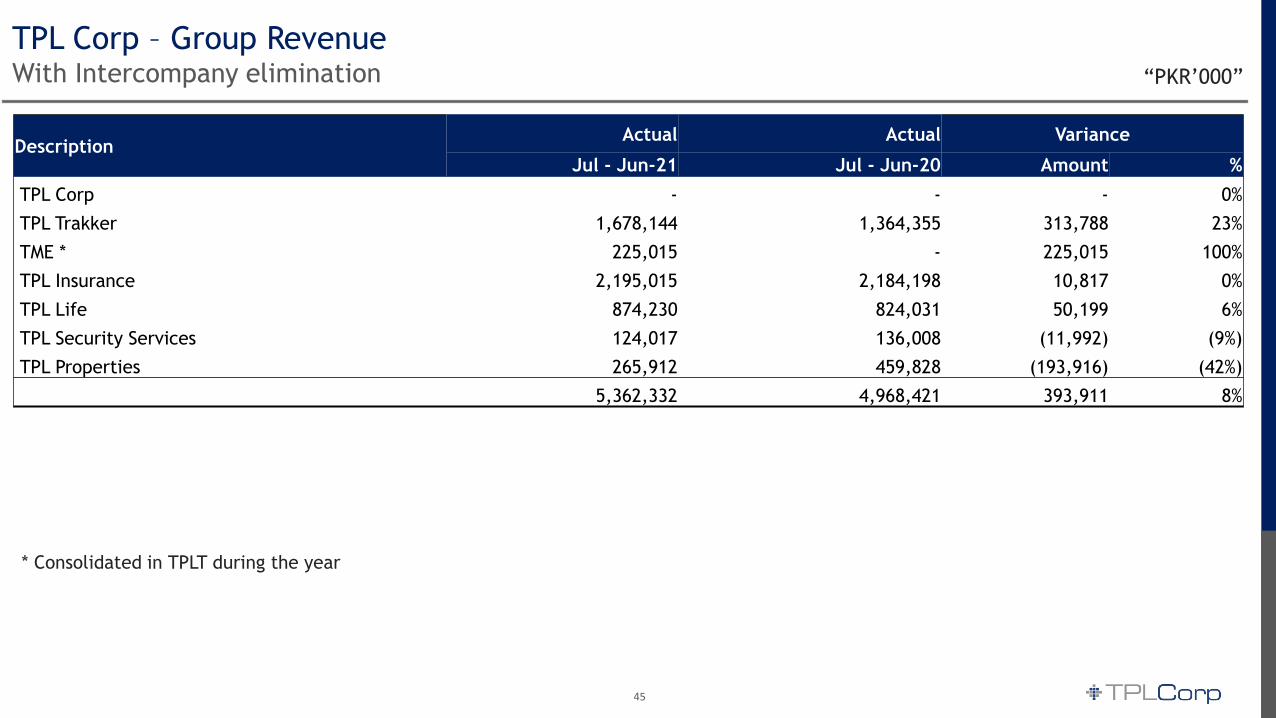
* Consolidated in TPLT during the year
TPL Corp – Group RevenueWith Intercompany elimination “PKR’000”
DescriptionActual Actual Variance
Jul - Jun-21 Jul - Jun-20 Amount %
TPL Corp - - - 0%
TPL Trakker 1,678,144 1,364,355 313,788 23%
TME * 225,015 - 225,015 100%
TPL Insurance 2,195,015 2,184,198 10,817 0%
TPL Life 874,230 824,031 50,199 6%
TPL Security Services 124,017 136,008 (11,992) (9%)
TPL Properties 265,912 459,828 (193,916) (42%)
5,362,332 4,968,421 393,911 8%
`
46
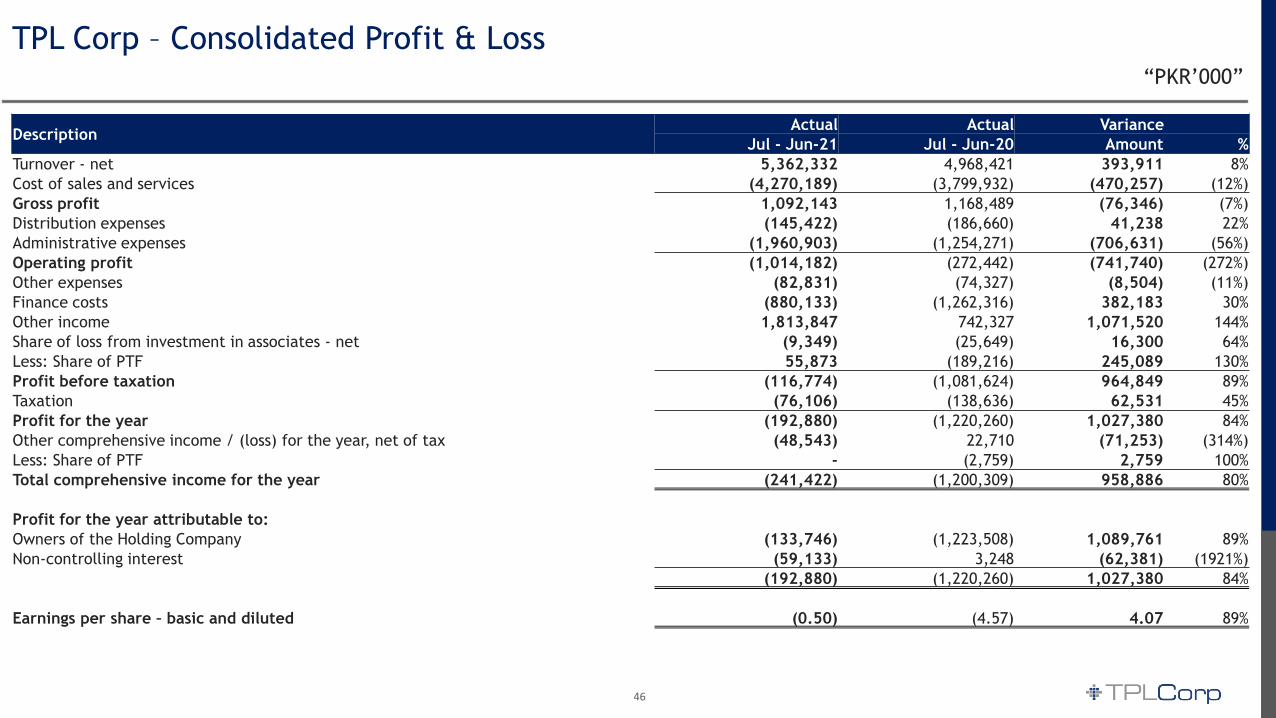
TPL Corp – Consolidated Profit & Loss“PKR’000”
DescriptionActual Actual Variance
Jul - Jun-21 Jul - Jun-20 Amount %
Turnover - net 5,362,332 4,968,421 393,911 8%
Cost of sales and services (4,270,189) (3,799,932) (470,257) (12%)
Gross profit 1,092,143 1,168,489 (76,346) (7%)
Distribution expenses (145,422) (186,660) 41,238 22%
Administrative expenses (1,960,903) (1,254,271) (706,631) (56%)
Operating profit (1,014,182) (272,442) (741,740) (272%)
Other expenses (82,831) (74,327) (8,504) (11%)
Finance costs (880,133) (1,262,316) 382,183 30%
Other income 1,813,847 742,327 1,071,520 144%
Share of loss from investment in associates - net (9,349) (25,649) 16,300 64%
Less: Share of PTF 55,873 (189,216) 245,089 130%
Profit before taxation (116,774) (1,081,624) 964,849 89%
Taxation (76,106) (138,636) 62,531 45%
Profit for the year (192,880) (1,220,260) 1,027,380 84%
Other comprehensive income / (loss) for the year, net of tax (48,543) 22,710 (71,253) (314%)
Less: Share of PTF - (2,759) 2,759 100%
Total comprehensive income for the year (241,422) (1,200,309) 958,886 80%
Profit for the year attributable to:
Owners of the Holding Company (133,746) (1,223,508) 1,089,761 89%
Non-controlling interest (59,133) 3,248 (62,381) (1921%)
(192,880) (1,220,260) 1,027,380 84%
Earnings per share – basic and diluted (0.50) (4.57) 4.07 89%
`
47
TPL Corp – Profit & Loss Account (Consolidated)Variance Analysis
Turnover
Refer revenue slide.
Cost of sales and services
Out of total increase of PKR 470m; TME contributed PKR 124m in the increase on account of its 1st year of consolidation.
TPLL claims posted an increase of PKR 214m for health related claims.
TPLI claim cost increased by 73M due to increase in spare parts due to currency depreciation and port congestions.
TPLT’s research & development cost contributed PKR 54.7m in the increase.
Administrative expenses
The reason of increase are as under:
PKR 237m relates to ESOP provision made by the group companies under scheme offered to management staff (PKR 57m TPLC, PKR 31m
TPLT, PKR 80m TPLP, PKR 69m TPLI)
PKR 70m relates to tenant compensation paid by TPLP on early vacation of floors on account of its sale transaction of Centrepoint
property to BAHL
Bonus provision of PKR 191m (PKR 13.5m TPLC, PKR 160m TPLP, PKR 18m TPLT).
TME inclusion in consolidation for the first time in financial year amounted to PKR 203.7m.
PKR 11m relates to impairment of investment in CompareOn (Karlo Compare) in TPLE.
`
48
TPL Corp – Profit & Loss Account (Consolidated)Variance Analysis
Other expenses
This relates to the translation losses recorded on foreign currency payables.
Finance costs
Reduction in finance cost is primarily attributable to Covid-19 related relaxations provided by SBP along with settlement of debt by Group
Companies.
Other income
The reason of increase are as under:
PKR 615m attributable to gain recorded by TPLC on disposal of Centrepoint property for the owner occupied portion of 11th to 13th Floors.
PKR 392.6m (PKR 684.7m current year vs PKR 292m prior year) attributable to TPLP on its TPL TZ property.
Upon consolidation of TME; TPLT recorded an aggregate gain amounting to PKR 122.8m on its investment comprising of fair value gain of
PKR 33.3m and gain on bargain purchase option of PKR 89.5m respectively.
Share of Loss from Associate
The share of loss amounting to PKR 9.3m in current fiscal year pertains to TPL Logistics.
Taxation
The decline is primarily attributable to the deferred tax income recorded by the group companies on ESOP reserve created during the year.
Other comprehensive income / (loss) for the year, net of tax
The OCI loss in current financial year primarily pertains to fair valuation loss on equity instruments designated at FVTOCI. The loss has been
partially offset by the exchange gain on translation of TME amounting to PKR 12.4m.

Thank You
`
50
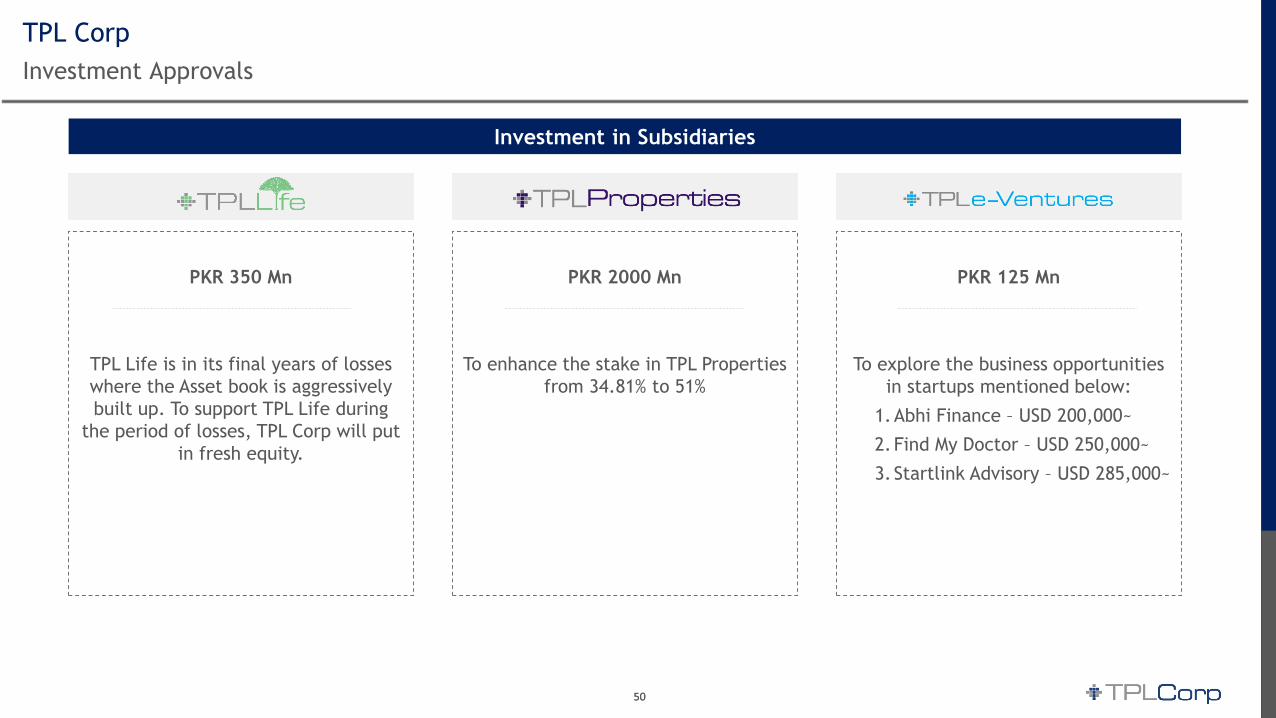
TPL Corp
Investment Approvals
`
50
PKR 350 Mn
TPL Life is in its final years of losses
where the Asset book is aggressively
built up. To support TPL Life during
the period of losses, TPL Corp will put
in fresh equity.
PKR 2000 Mn
To enhance the stake in TPL Properties
from 34.81% to 51%
PKR 125 Mn
To explore the business opportunities
in startups mentioned below:
1.Abhi Finance – USD 200,000~
2.Find My Doctor – USD 250,000~
3.Startlink Advisory – USD 285,000~
Investment in Subsidiaries
Related Documents