MANURE MANAGEMENT Corn Response to Composting and Time of Application of Solid Swine Manure Terrance D. Loecke, Matt Liebman,* Cynthia A. Cambardella, and Tom L. Richard ABSTRACT social impacts of doing so have some producers and scientists searching for alternative forms of management Swine production in hoop structures is a relatively new husbandry in which manure is handled as a solid (Honeyman, 1996). system in which a mixture of manure and bedding accumulates. This manure/bedding pack can be applied to crop fields directly from a hoop One option involves swine production in deep-bedded structure or piled for composting. During 2000 and 2001, field experi- hoop structures. In Iowa, nearly one million head of swine ments were conducted near Boone, IA, to determine the effects of are finished per year in these hoop structures (Leopold form of solid swine manure (fresh or composted) and time of manure Cent. for Sustainable Agric., 2001). Swine hoop struc- application (fall or spring) on corn (Zea mays L.) nutrient status and tures are typically bedded with corn stalks or cereal yield. Fresh and composted manure were applied at 340 kg total N straw, which absorb urine and feces throughout the four- ha 1 . Urea N fertilizer treatments of 0, 60, 120, and 180 kg N ha 1 to six-month production cycle. During this time, some were used to determine N fertilizer equivalency values for the manure. in situ composting occurs although the extent of this In 2000, but not in 2001, fresh manure decreased corn emergence by unmanaged decomposition varies widely. Swine manure 9.5% compared with the unamended, nonfertilized control treatment. from hoop structures can be spread on fields immedi- No corn yield differences due to the form or the time of manure ap- plication were detected in 2000, but all treatments receiving manure ately after animals are removed from the buildings, or it produced more corn grain than the unamended control. In 2001, fall can be piled for additional composting (Tiquia et al., application of manure increased corn grain yield more than spring 2000). application, and composted manure increased yield more than fresh Composted manure has a number of potential advan- manure, with spring-applied fresh manure providing no yield response tages over fresh manure, including reductions in viable beyond the unamended control. Mean N supply efficiency, defined weed seed content (Wiese et al., 1998; Eghball and Le- as the N fertilizer equivalency value as a percentage of the total N soing, 2000), improvements in handling characteristics applied, was greatest for fall-applied composted manure (34.7%), (by reducing manure volume and associated transporta- intermediate for fall-applied fresh manure (24.3%) and spring-applied tion costs), and a reduction in particle size leading to composted manure (25.0%), and least for spring-applied fresh ma- nure (10.9%). increased uniformity of field application (Rynk, 1992). Compost-amended soils can increase crop growth be- yond levels explainable by nutrient effects (Valdrighi et al., 1996), provide protection from plant pathogens O ver one billion metric tons of N are excreted in (Hoitink and Kuter, 1986), and suppress weed seedling swine (Sus scrofa L.) manure in the United States emergence (Menalled et al., 2002). Phytotoxic substances annually (NRCS, 2000). Swine manure applied to crop contained in fresh solid swine manure, such as high fields can be an important source of plant nutrients and concentrations of NH 4 –N, decrease with time of com- organic matter, which can improve soil quality (Khaleel posting (Tiquia and Tam, 1998) and time following soil et al., 1981). Nevertheless, current practices for man- application. Disadvantages of composting are poten- agement and utilization of swine manure can potentially tially large losses of C and N and labor and capital contribute to degradation of water and air quality costs associated with extra manure handling and space (Sharpley et al., 1998; Zebarth et al., 1999). Better man- requirements for the compost piles. Losses of N mea- agement options are needed. sured during composting of animal manure have ranged Most swine manure in the USA is handled and stored as a liquid (NRCS, 2000), but the environmental and from 20 to 70% (Martins and Dewes, 1992; Rao Bhami- dimarri and Pandey, 1996; Eghball et al., 1997; Tiquia et al., 2002). Garrison et al. (2001) estimated that 41% T.D. Loecke, Dep. of Crop and Soil Sci., Michigan State Univ., 539 Plant and Soil Sciences Bldg., East Lansing, MI 48824-1325; M. Lieb- of total N contained in fresh swine hoop manure was lost man, Dep. of Agron., 3405 Agronomy Hall, Iowa State Univ., Ames, during two months of intensively managed composting. IA 50011-1010; C.A. Cambardella, USDA-ARS, 310 Natl. Soil Tilth Synchrony of plant-available soil nutrients and crop Lab., Ames, IA 50011-3120; and T.L. Richard, Dep. of Agric. and nutrient demand is essential for optimum crop perfor- Biosyst. Eng., 3222 Natl. Swine Res. and Inf. Cent., Iowa State Univ., Ames, IA 50011-3080. Partial funding for this work was provided by mance and environmental protection (Magdoff, 1995). the Leopold Center for Sustainable Agriculture (Project 2000-42), If plant-available N (NO 3 and NH 4 ) is not supplied in the Iowa Department of Natural Resources (Project 00-G550-01CG), synchrony with crop demand, then substantial N losses and Chamness Technology (Project 1221). We thank J. Ohmacht, D. can occur before or after periods of crop demand. The Sundberg, and R. Vandepol for technical assistance in the field and quantity of plant-available N is dynamic and reflects the laboratory. Received 5 Dec. 2002. *Corresponding author (mliebman@ iastate.edu). balance between N mineralization, N immobilization, and removal of inorganic or organic N from the soil rooting Published in Agron. J. 96:214–223 (2004). zone (e.g., via leaching, volatilization, denitrification, American Society of Agronomy 677 S. Segoe Rd., Madison, WI 53711 USA soil erosion, and plant uptake). Soil physical conditions, 214

Welcome message from author
This document is posted to help you gain knowledge. Please leave a comment to let me know what you think about it! Share it to your friends and learn new things together.
Transcript
MANURE MANAGEMENT
Corn Response to Composting and Time of Application of Solid Swine Manure
Terrance D. Loecke, Matt Liebman,* Cynthia A. Cambardella, and Tom L. Richard
ABSTRACT social impacts of doing so have some producers andscientists searching for alternative forms of managementSwine production in hoop structures is a relatively new husbandryin which manure is handled as a solid (Honeyman, 1996).system in which a mixture of manure and bedding accumulates. This
manure/bedding pack can be applied to crop fields directly from a hoop One option involves swine production in deep-beddedstructure or piled for composting. During 2000 and 2001, field experi- hoop structures. In Iowa, nearly one million head of swinements were conducted near Boone, IA, to determine the effects of are finished per year in these hoop structures (Leopoldform of solid swine manure (fresh or composted) and time of manure Cent. for Sustainable Agric., 2001). Swine hoop struc-application (fall or spring) on corn (Zea mays L.) nutrient status and tures are typically bedded with corn stalks or cerealyield. Fresh and composted manure were applied at 340 kg total N straw, which absorb urine and feces throughout the four-ha�1. Urea N fertilizer treatments of 0, 60, 120, and 180 kg N ha�1
to six-month production cycle. During this time, somewere used to determine N fertilizer equivalency values for the manure.in situ composting occurs although the extent of thisIn 2000, but not in 2001, fresh manure decreased corn emergence byunmanaged decomposition varies widely. Swine manure9.5% compared with the unamended, nonfertilized control treatment.from hoop structures can be spread on fields immedi-No corn yield differences due to the form or the time of manure ap-
plication were detected in 2000, but all treatments receiving manure ately after animals are removed from the buildings, or itproduced more corn grain than the unamended control. In 2001, fall can be piled for additional composting (Tiquia et al.,application of manure increased corn grain yield more than spring 2000).application, and composted manure increased yield more than fresh Composted manure has a number of potential advan-manure, with spring-applied fresh manure providing no yield response tages over fresh manure, including reductions in viablebeyond the unamended control. Mean N supply efficiency, defined weed seed content (Wiese et al., 1998; Eghball and Le-as the N fertilizer equivalency value as a percentage of the total N
soing, 2000), improvements in handling characteristicsapplied, was greatest for fall-applied composted manure (34.7%),(by reducing manure volume and associated transporta-intermediate for fall-applied fresh manure (24.3%) and spring-appliedtion costs), and a reduction in particle size leading tocomposted manure (25.0%), and least for spring-applied fresh ma-
nure (10.9%). increased uniformity of field application (Rynk, 1992).Compost-amended soils can increase crop growth be-yond levels explainable by nutrient effects (Valdrighiet al., 1996), provide protection from plant pathogensOver one billion metric tons of N are excreted in(Hoitink and Kuter, 1986), and suppress weed seedlingswine (Sus scrofa L.) manure in the United Statesemergence (Menalled et al., 2002). Phytotoxic substancesannually (NRCS, 2000). Swine manure applied to cropcontained in fresh solid swine manure, such as highfields can be an important source of plant nutrients andconcentrations of NH�
4 –N, decrease with time of com-organic matter, which can improve soil quality (Khaleelposting (Tiquia and Tam, 1998) and time following soilet al., 1981). Nevertheless, current practices for man-application. Disadvantages of composting are poten-agement and utilization of swine manure can potentiallytially large losses of C and N and labor and capitalcontribute to degradation of water and air qualitycosts associated with extra manure handling and space(Sharpley et al., 1998; Zebarth et al., 1999). Better man-requirements for the compost piles. Losses of N mea-agement options are needed.sured during composting of animal manure have rangedMost swine manure in the USA is handled and stored
as a liquid (NRCS, 2000), but the environmental and from 20 to 70% (Martins and Dewes, 1992; Rao Bhami-dimarri and Pandey, 1996; Eghball et al., 1997; Tiquiaet al., 2002). Garrison et al. (2001) estimated that 41%T.D. Loecke, Dep. of Crop and Soil Sci., Michigan State Univ., 539
Plant and Soil Sciences Bldg., East Lansing, MI 48824-1325; M. Lieb- of total N contained in fresh swine hoop manure was lostman, Dep. of Agron., 3405 Agronomy Hall, Iowa State Univ., Ames, during two months of intensively managed composting.IA 50011-1010; C.A. Cambardella, USDA-ARS, 310 Natl. Soil Tilth Synchrony of plant-available soil nutrients and cropLab., Ames, IA 50011-3120; and T.L. Richard, Dep. of Agric. and
nutrient demand is essential for optimum crop perfor-Biosyst. Eng., 3222 Natl. Swine Res. and Inf. Cent., Iowa State Univ.,Ames, IA 50011-3080. Partial funding for this work was provided by mance and environmental protection (Magdoff, 1995).the Leopold Center for Sustainable Agriculture (Project 2000-42), If plant-available N (NO�
3 and NH�4 ) is not supplied in
the Iowa Department of Natural Resources (Project 00-G550-01CG), synchrony with crop demand, then substantial N lossesand Chamness Technology (Project 1221). We thank J. Ohmacht, D.can occur before or after periods of crop demand. TheSundberg, and R. Vandepol for technical assistance in the field andquantity of plant-available N is dynamic and reflects thelaboratory. Received 5 Dec. 2002. *Corresponding author (mliebman@
iastate.edu). balance between N mineralization, N immobilization, andremoval of inorganic or organic N from the soil rootingPublished in Agron. J. 96:214–223 (2004).zone (e.g., via leaching, volatilization, denitrification, American Society of Agronomy
677 S. Segoe Rd., Madison, WI 53711 USA soil erosion, and plant uptake). Soil physical conditions,
214

LOECKE ET AL.: FORM OF SWINE MANURE AND APPLICATION TIME AFFECT CORN YIELD 215
Table 1. Characteristics of the surface 20 cm of soil in experimentincluding temperature, water status, and aeration, andfields before treatment applications.the C/N ratio and C constituents (especially lignin quan-
Soil parameter 14 Oct. 1999 28 Sept. 2000tities) of organic materials are the primary factors affect-ing mineralization rates (Jenny, 1980; Swift et al., 1979). Bulk density, g cm�3 1.3 1.2
Total organic C, Mg ha�1 43.5 46.7In previous investigations, corn yield responses toTotal organic N, Mg ha�1 3.8 4.1composted and fresh manure have been similar when Nitrate N, kg ha�1 13.0 19.3
these amendments were applied at the same time (Reider Ammonium N, kg ha�1 4.0 1.8Mehlich-1 P, kg ha�1 115 113et al., 2000; Eghball and Power, 1999; Brinton, 1985;Mehlich-1 K, kg ha�1 381 270Ma et al., 1999; Xie and MacKenzie, 1986). However, pH 6.6 6.4Electrical conductivity, S m�1 0.0155 0.0178N use efficiencies observed in these studies indicate
that plant-available N from manure-derived compost istypically equal to or less than that from fresh manure. All of the fresh and composted hoop manure was producedTiming of amendment application can influence crop on the Iowa State University Rhodes Research Farm in Mar-responses but often interacts with weather conditions shall County, IA, except for the fresh manure applied in the
spring of 2001, which came from a commercial farm in Story(Warman, 1995; Talarczyk et al., 1996; Sanchez et al.,County, IA. Urea N was side-dressed in plots that did not re-1997).ceive manure at corn growth stage V6 (Hanway, 1963) (9 JuneCurrently, no guidelines are available for when and2000 and 18 June 2001) and was incorporated within 24 h ofin what form (composted or fresh) swine hoop manureapplication using an interrow cultivator. Corn (‘Pioneer 35P12’)should be field-applied to best utilize it as a nutrientwas planted at 68 000 seeds ha�1 on 4 May 2000 and 74 000 seedsresource and to minimize potential negative environ- ha�1 on 9 May 2001. Weed control was achieved with a preplant-
mental impacts. The objective of this study was to deter- incorporated application of metolachlor [2-chloro-N-(2-ethyl-6-mine first-year corn response to season of application methylphenyl)-N-(2-methoxy-1-methylethyl) acetamide] at 1.5(fall vs. spring) and form of swine hoop manure (com- kg a.i. ha�1, interrow cultivation at plant growth stage V6, andposted or fresh). hand weeding.
Plant, Soil, and Amendment Sampling and AnalysisMATERIALS AND METHODSA 4-L composite sample of each amendment (fresh or com-Field Site and Experimental Design posted manure) was collected immediately before materials
were applied to plots, generating one sample per plot andField plot research was conducted at the Iowa State Univer-sity Agronomy and Agricultural Engineering Research Farm four replicates per treatment. Samples were stored at �20�C
in plastic freezer bags, then thawed, homogenized, separatednear Boone, IA (42�1� N, 93�45� W), during 2000 and 2001 onClarion loam (fine-loamy, mixed, superactive, mesic Typic Hap- for various analyses (total P, K, NH�
4 –N, NO�3 –N, moisture,
ash content, pH, and electrical conductivity), and then refro-ludolls) and Nicollet loam (fine-loamy, mixed, superactive,mesic Aquic Hapludolls) soils. Soil samples taken from the zen until individual parameters were analyzed. Amendment
total C and N were determined after acidification with 0.5 Msurface 20 cm before fall application of amendments indicatedadequate P and K fertility levels in both years (Table 1). HCl (1:2 sample/solution ratio), air drying, grinding, and dry
combustion in a Carlo-Erba NA1500 NCS elemental analyzerThe field used for the 2000 experiment was cropped with oat(Avena sativa L.) in 1999; the field used for the 2001 experi- (Haake Buchler Instruments, Paterson, NJ) as described by
Cambardella et al. (2003). Total P and K were determined onment was cropped with soybean [Glycine max (L.) Merr.] in2000. Neither field had received animal manure for at least dried ground samples by USEPA method 3051 at a commercial
laboratory (Midwest Laboratory, Omaha, NE) following a pro-the previous 8 yr. Annual and long-term weather data werecollected from an automated weather station located �1 km tocol given by Dancer et al. (1998). Ammonium N and nitrate
N were determined using 2 M KCl extracts (1:80 amendment/from the field sites (Fig. 1).The core of the experiment consisted of a factorial treat- solution ratio) and Lachat flow analysis (Lachat Instruments,
Milwaukee, WI) (Keeney and Nelson, 1982). Amendmentment design that crossed season of application (fall or spring)with form of manure (fresh or composted hoop manure). An moisture content was determined by drying at 70�C for 48 h,
ash content was determined by ignition at 550�C, and pH andadditional set of treatments (0, 60, 120, and 180 kg N ha�1 urea)was applied to plots not receiving manure and was used to electrical conductivity were determined using a 1:5 amend-
ment/water slurry.estimate N fertilizer equivalency of the manure. Treatmentswere arranged in a randomized complete block design with To monitor plant and soil N status throughout the growing
season, late-spring soil NO�3 –N concentration, ear leaf N andfour replications. Plot size was 3.8 m (five rows with a 0.76-m
row spacing) by 10.7 m in 2000 and 12.2 m in 2001. Manure chlorophyll contents, and fall stalk NO�3 –N concentration were
measured. All plant and soil parameters were measured fromtreatments were applied by hand in the fall (22 Oct. 1999 and24 Oct. 2000) and spring (25 Apr. 2000 and 25 Apr. 2001) at the center three rows of each plot. Soil NO�
3 –N samples, con-sisting of a composite of ten 2-cm-diam. soil cores from thea rate of 340 kg N ha�1 based on moisture and total N content
of samples taken 2 wk before application (Table 2). Amend- surface 30 cm, were collected from each plot on 3 June 2000and 4 June 2001 and were processed according to proceduresments were incorporated with a disk into the surface 15 cm
within 6 h of application. Application rates were chosen based described by Blackmer et al. (1989).Thirty leaf chlorophyll meter readings were taken in eachon the assumption that one-third of the total applied N (i.e.,
110 kg N ha�1) would be available during the first year after plot using a Minolta SPAD-502 chlorophyll meter (Minolta,Ramsey, NJ) as others have done (Piekielek and Fox, 1992).application, as was observed by Eghball and Power (1999).
This expected quantity of available N is approximately equal Readings were taken 1.5 cm from the leaf edge of the center(lengthwise) of the topmost fully expanded leaf or the sameto the N harvested in 9.0 Mg of corn grain, the long-term
average yield per hectare from the experiment site. location on the ear leaf, when developed.
216 AGRONOMY JOURNAL, VOL. 96, JANUARY–FEBRUARY 2004
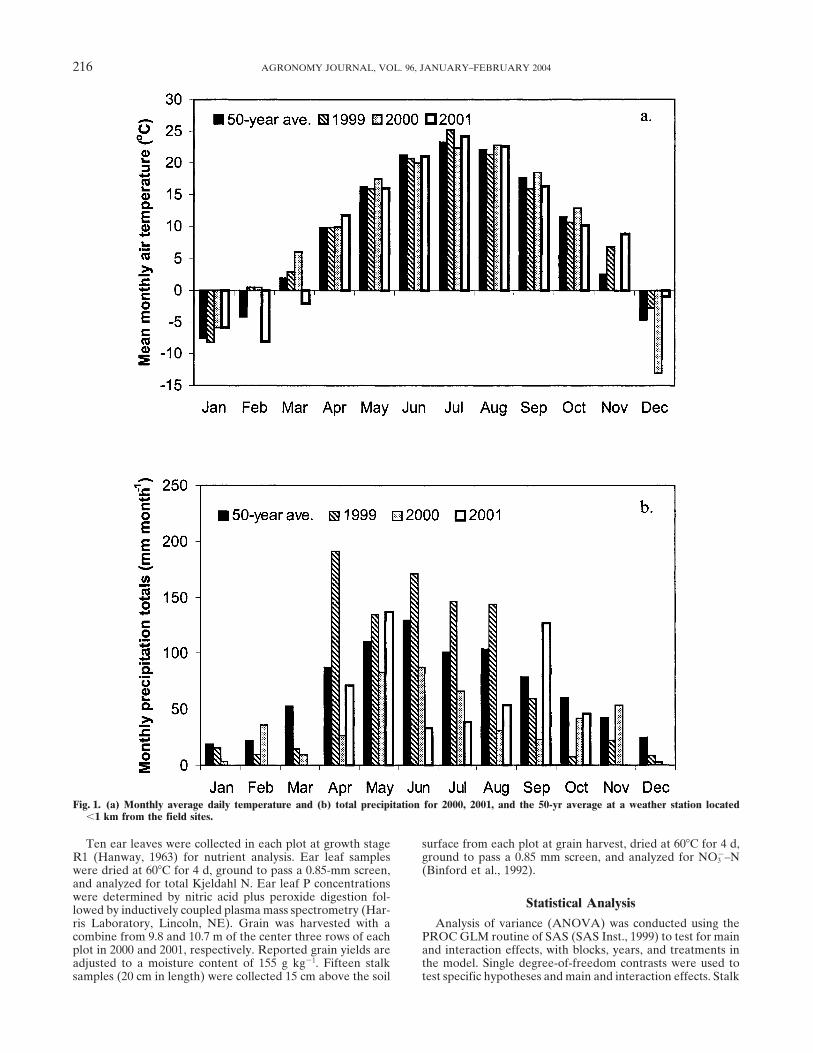
Fig. 1. (a) Monthly average daily temperature and (b) total precipitation for 2000, 2001, and the 50-yr average at a weather station located�1 km from the field sites.
Ten ear leaves were collected in each plot at growth stage surface from each plot at grain harvest, dried at 60�C for 4 d,ground to pass a 0.85 mm screen, and analyzed for NO�
3 –NR1 (Hanway, 1963) for nutrient analysis. Ear leaf sampleswere dried at 60�C for 4 d, ground to pass a 0.85-mm screen, (Binford et al., 1992).and analyzed for total Kjeldahl N. Ear leaf P concentrationswere determined by nitric acid plus peroxide digestion fol- Statistical Analysislowed by inductively coupled plasma mass spectrometry (Har-ris Laboratory, Lincoln, NE). Grain was harvested with a Analysis of variance (ANOVA) was conducted using the
PROC GLM routine of SAS (SAS Inst., 1999) to test for maincombine from 9.8 and 10.7 m of the center three rows of eachplot in 2000 and 2001, respectively. Reported grain yields are and interaction effects, with blocks, years, and treatments in
the model. Single degree-of-freedom contrasts were used toadjusted to a moisture content of 155 g kg�1. Fifteen stalksamples (20 cm in length) were collected 15 cm above the soil test specific hypotheses and main and interaction effects. Stalk

LOECKE ET AL.: FORM OF SWINE MANURE AND APPLICATION TIME AFFECT CORN YIELD 217
Table 2. Composition of organic amendments.
Total
Time of application Form H2O Ash P K C N C/N NH�4 –N NO�
3 –N pH† EC†
g kg�1‡ �g g�1 S m�1
1999 Fall Fresh manure 624 406 11.5 21.7 323 28.6 11.3 3500 15 8.8 0.46Composted manure 340 624 11.7 20.6 181 16.9 10.7 500 820 8.0 0.59
2000 Spring Fresh manure 631 302 11.0 24.7 343 30.0 11.5 2770 78 8.2 0.57Composted manure 313 726 8.8 15.4 144 12.8 11.2 730 750 8.1 0.55
2000 Fall Fresh manure 389 284 11.3 20.5 323 24.8 13.0 910 18 8.5 0.70Composted manure 317 608 7.4 12.9 199 17.2 11.6 360 750 7.4 0.50
2001 Spring Fresh manure 613 418 5.2 13.0 316 22.3 14.2 1560 96 8.3 0.23Composted manure 534 595 6.7 16.6 206 16.3 12.7 940 140 8.3 0.51
† Electrical conductivity (EC) and pH were determined using a 5:1 water/amendment slurry.‡ Moisture content is expressed on a wet weight basis, and all other concentration parameters are expressed on a dry matter basis.
nitrate concentrations were square-root–transformed before NH�4 –N to NO�
3 –N ratios observed here suggest that thestatistical analysis to meet the ANOVA assumption of homog- composted manure generally was more decomposed thaneneity of variances. Correlations between soil and plant parame- the fresh manure; the exception being the manureters were made on an experimental unit basis using PROC applied in the spring of 2001, which had a more simi-CORR in SAS. PROC REG of SAS was used to fit quadratic lar NH�
4 –N/NO�3 –N ratio than at all other applicationequations to the relationship between grain yields and urea
times (Table 2).N fertilizer rates.Each of the applied amendments contained a substan-
tial quantity of total P (Table 2). Annual applicationsRESULTS AND DISCUSSION of livestock manure to fields in corn–soybean rotationsat rates sufficient to meet corn N requirements haveWeather Conditionsthe potential to accumulate soil P (Jackson et al., 2000)The period from amendment application in October due to higher P application rates than grain P removal1999 until corn planting in May 2000 was warmer and rates. In our study, the P application rate ranged fromdrier than the 50-yr average (Fig. 1a and 1b) whereas 79 to 242 kg P ha�1 (Table 3), with mean P applicationthe 2000–2001 winter was colder and wetter than the rates of 121 and 188 kg P ha�1 for fresh and composted50-yr average (Fig. 1a and 1b). Mean monthly tempera-hoop manure, respectively, and 167 and 142 kg P ha�1
tures during the 2000 and 2001 growing seasons werefor fall- and spring-applied amendments, respectivelytypical compared with the 50-yr average (Fig. 1a). Both(Table 3). During 2000–2001, corn and soybean yieldsgrowing seasons had lower-than-normal total precipita-in Boone County, IA, averaged 9.7 and 2.7 Mg ha�1
tion (Fig. 1b), but the precipitation patterns differed(NASS, 2002), respectively, which would have removedbetween years. The 2000 growing season began with dryan estimated 28 kg P ha�1 yr�1 for corn and 16 kg Psoil conditions followed by timely but limited precipita-ha�1 yr�1 for soybean (Voss et al., 1999). The combinedtion. In contrast, the 2001 growing season was drier thanP removal rate from one cycle of a corn–soybean rota-normal from mid-June until September but began withtion therefore would have been 44 kg P ha�1. A compari-moist soil conditions in May following the wet winterson of the P applied in this study with the estimated Pseason (Fig. 1b).grain removal indicates that one application of eitherfresh or composted hoop manure per rotation cycleAmendment Composition and Applicationwould lead to soil P accumulation. It should be noted,
Carbon/N ratios of the applied amendments ranged however, that fresh hoop manure had a higher N/P ratiofrom 10.7:1 to 14.2:1 with means of 12.5:1 and 11.6:1 for (Table 3), which would slow soil P accumulation com-fresh and composted manures, respectively (Table 2). pared with composted hoop manure if P removal ratesMaterials with C/N ratios of less than 20:1 are generally for grain were equal in the two management systems.thought not to immobilize soil N (Mathur et al., 1993)although short-term immobilization with partially com- Table 3. Loading rates of organic amendments.posted hoop manure (C/N ratios of 12:1 to 15:1) has been
Application rate†observed (Cambardella et al., 2003). The amendmentsTime of application Form N P C DM‡applied in the spring of 2001 had the highest C/N ratios,
perhaps due to the cool and wet conditions of the fall– kg ha�1 Mg ha�1
winter–spring period of 2000–2001, which may have Fall 1999 Fresh manure 340 130 3.66 11.3Composted manure 340 240 3.74 20.7slowed decomposition in the compost windrows. These
Spring 2000 Fresh manure 340 120 3.85 11.2weather conditions also likely increased the beddingComposted manure 340 230 3.76 26.1requirement and/or altered the bedding management
Fall 2000 Fresh manure 340 150 4.38 13.6on the commercial farm from which the fresh manure Composted manure 340 140 3.89 19.5applied in the spring of 2001 was obtained. Spring 2001 Fresh manure 340 80 4.77 15.1
Composted manure 340 140 4.24 20.6The ratio of NH�4 –N to NO�
3 –N has been used as anindicator of compost maturity (Mathur et al., 1993), with † Application rates of total N, P, and C contained within each manure.
‡ DM, dry matter.lower ratios indicative of greater decomposition. The

218 AGRONOMY JOURNAL, VOL. 96, JANUARY–FEBRUARY 2004
Table 4. Treatment means, analysis of variance, and correlation to yield for plant population and late-spring soil nitrate concentrationduring 2000 and 2001.
Plant population Soil nitrate
Time of application Form Total rate 2000 2001 2000 2001
kg N ha�1 Plants ha�1 NO3� –N, �g g�1
None None (control) 0 65 900 72 800 8.3 3.3Side-dressed (at V6) Urea 60 63 300 72 700 7.8 3.2Side-dressed (at V6) Urea 120 67 400 73 300 8.5 4.6Side-dressed (at V6) Urea 180 65 200 72 900 8.9 3.5Fall Fresh manure 340 61 000 72 800 10.7 5.8Fall Composted manure 340 63 500 72 700 15.8 5.3Spring Fresh manure 340 58 300 72 500 9.1 5.2Spring Composted manure 340 64 000 73 800 19.6 5.8
Standard error (SE) 1 050 910 1.1 0.5Source of variationTreatment contrasts P � FForms (F)
Urea fertilizer linear response ns ns ns nsUrea fertilizer quadratic response ns ns ns nsUrea fertilizer cubic response * ns ns nsControl vs. all organic amendments ** ns *** ***Among amendments (fresh vs. composted) *** ns *** ns
Time of application (A)Amendments (fall vs. spring) ns ns ns ns
F � AAmendments (fresh vs. composted) � (fall vs. spring) ns ns * ns
Correlation to yield (r ) �0.20ns �0.11ns 0.47* 0.18ns
* Significant at the P � 0.05 probability level.** Significant at the P � 0.01 probability level.*** Significant at the P � 0.001 probability level.
Corn Emergence midwest and northeast USA to predict corn yield re-sponse to N fertilizer (Blackmer et al., 1989; Magdoff,In 2000, corn emergence was negatively affected by1991). Although this method has been calibrated forfresh manure applied in both fall and spring (Table 4).synthetic N fertilizer sources and to a limited extent forWe believe these plant emergence effects were likelysoils amended with liquid swine manure (Hansen, 1999),caused by a combination of physical and chemical influ-it has not been calibrated for soils receiving solid live-ences of the fresh manure. In the spring of 2000, fresh-stock manure. In an evaluation of corn yield responsesmanure clods were visible on the soil surface despiteto variations in soil NO�
3 –N concentration, Blackmer ettillage. Combined with dry soil surface conditions, whichal. (1989) set the maximum soil NO�
3 –N concentrationrequired a deeper-(8–10 cm)-than-normal (4–6 cm) plant-in the surface 30 cm at which to expect a yield responseing depth for seed to soil moisture contact, the physicalfrom applications of synthetic N fertilizer at 25 �g g�1
and/or chemical effects of the fresh-manure clods onfor unmanured soils in years with normal or below-the soil surface over the plant row prevented consistentnormal spring precipitation, at 20 to 22 �g g�1 for un-emergence. Fall-applied fresh manure tended to reducemanured soils in years with wet springs, and at 11 toplant emergence less than spring-applied fresh manure15 �g g�1 for manured soils.in 2000 (Table 4). This was probably due to degradation
In both years of our study, soil NO�3 –N concentrationsand/or dispersion of any potential phytotoxic substances
were higher in plots receiving manure than in the un-and physical degradation of the fresh manure clods thatamended fertilizer-free control (Table 4). A significantoccurred during the winter following fall application ofmanure form � application time interaction was de-manure. Tiquia et al. (1996) found NH�
4 –N concentra-tected for soil NO�
3 –N concentrations in 2000 (Table 4),tion (ranging from �500 to 4200 �g g�1) to be the mostwith the highest soil NO�
3 –N concentrations found inimportant chemical component of solid swine manureplots treated with spring-applied composted manurein predicting phytotoxic effects on vegetable seedlings.and the lowest found in plots amended with spring-Despite the stand reductions observed in the presentapplied fresh manure. The lower soil NO�
3 –N concentra-study, plant population densities were not correlatedtions observed in 2001 compared with 2000 (Table 4)with grain yields (Table 4).may have reflected the high soil moisture conditionsIn 2001, plant emergence was not affected by manurebefore sampling (Fig. 1b), which could have caused ni-treatments (Table 4). Moist soil conditions throughouttrate leaching or denitrification losses.the spring of 2001 allowed for adequate reductions of
fresh-manure clod size during tillage and thus elimi-Ear Leaf Nitrogen and Phosphorusnated the plant emergence problems observed in 2000.
Concentrations and Chlorophyll Meter ReadingsLate-Spring Soil Nitrate Concentration Chlorophyll meter readings of corn ear leaves at growth
stage R1 responded positively to urea application in bothThe NO�3 –N concentration in the surface 30 cm of soil
when corn is 20 to 30 cm tall has been used in the years (Table 5). A significant quadratic response to in-

LOECKE ET AL.: FORM OF SWINE MANURE AND APPLICATION TIME AFFECT CORN YIELD 219
Table 5. Treatment means, analysis of variance, and correlation to grain yield for SPAD chlorophyll meter readings and corn ear leafN and P concentrations at growth stage R1, and fall stalk nitrate concentrations in 2000 and 2001.
SPAD Ear leaf N Ear leaf P Fall stalk nitrate
Time of application Form Rate 2000 2001 2000 2001 2000 2001 2000 2001
kg N ha�1 g kg�1 NO3� –N, �g g�1†
None None (control) 0 55.7 52.6 20.5 25.2 2.5 2.0 4.5 (20) 4.9 (38)Side-dressed (at V6) Urea 60 60.4 54.6 24.5 25.1 2.9 2.2 4.5 (20) 4.3 (25)Side-dressed (at V6) Urea 120 61.2 56.2 26.5 26.7 3.1 2.1 26.0 (815) 23.3 (566)Side-dressed (at V6) Urea 180 61.8 58.0 27.0 27.9 3.3 2.2 77.7 (6123) 37.9 (1491)Fall Fresh manure 340 58.0 57.5 24.1 26.2 3.5 2.2 10.1 (135) 18.3 (402)Fall Composted manure 340 60.1 58.3 24.6 26.3 3.0 2.2 9.6 (119) 6.5 (52)Spring Fresh manure 340 57.2 50.7 23.1 23.2 3.4 2.1 5.3 (31) 8.0 (66)Spring Composted manure 340 60.0 55.1 25.5 25.5 3.4 2.2 7.1 (58) 5.0 (36)
Standard error (SE) 0.53 0.81 0.9 0.7 0.1 0.1 3.2 2.4Source of variationTreatment contrasts P � FForms (F)
Urea fertilizer linear response *** *** *** ** *** ‡ *** ***Urea fertilizer quadratic response *** ns ‡ ns ns ns *** **Urea fertilizer cubic response ns ns ns ns ns ns ns nsControl vs. all organic amendments *** ** *** ns *** * ns ns
Among amendments (fresh vs. composted) *** ** ns ‡ ns ns ns **Time of application (A)
Amendments (fall vs. spring) ns *** ns ** ns ns ns *F � A
Amendments (fresh vs. composted) � (fall vs. spring) ns * ns ‡ ‡ ns ns ‡Correlation to yield (r ) 0.70*** 0.51* 0.44* 0.55** 0.25ns 0.35* 0.54** 0.37*
* Significant at the P � 0.05 probability level.** Significant at the P � 0.01 probability level.*** Significant at the P � 0.001 probability level.† Analysis of variance conducted on square-root–transformed data. Data in parentheses are means of raw data.‡ Significant at the P � 0.1 probability level.
creasing rates of urea fertilizers (p � 0.001) was found phyll meter readings at growth stage R1 correlated wellwith final corn grain yield (Table 5). Eghball and Powerin 2000, suggesting that N was not limiting in the higher
urea application rates (120 and 180 kg N ha�1) at this (1999) also found a strong correlation (r � 0.71) be-tween chlorophyll meter readings and grain yield, exceptpoint in the season (Table 5). However, because chloro-
phyll meters are useful for indicating N deficiencies, but in a season of low precipitation. In our study, ear leafnot for determining excessive soil N availability (Schep- N concentration and chlorophyll readings at R1 wereers et al., 1992), this issue remains unresolved. also well correlated with each other (2000: r 0.54,
Eghball and Power (1999) found similar chlorophyll P � 0.01; 2001: r 0.64, P � 0.0001).meter reading results when comparing composted and Corn ear leaf P concentrations increased linearly withnoncomposted beef feedlot manure to unamended con- increasing rates of urea application in both years (Ta-trols throughout the growing season. In 2000 of our study, ble 5). This may indicate that plants in the higher ureacomposted manure treatments (fall- and spring-applied) treatments foraged for soil P more efficiently and/orhad higher chlorophyll readings than fresh manure (fall- that the hydrolysis of urea lowered soil pH, thus makingand spring-applied), and the mean of all manure treat- more soil P available to plants (Miller and Ohlrogge,ments was greater than the no-amendment control (Ta- 1958; Olson and Dreier, 1956). Differences in ear leafble 5). A significant interaction was detected in 2001 P between years may have been due to differences inbetween form of manure and timing of application (Ta- early-season soil moisture although many fertility andble 5). Spring-applied fresh-manure plots in 2001 had environmental factors can interact to influence ear leafthe lowest chlorophyll readings among the manure treat- P concentrations (Voss et al., 1970). In 2001, there werements whereas fall-applied fresh and composted manure minimal differences between treatments with regard tohad the highest readings and the spring-applied com- ear leaf P concentration (Table 5).posted manure gave an intermediate value (Table 5).
Corn ear leaf N concentration at growth stage R1 re- Corn Grain Yieldsponded positively to urea application in both years (Ta-
Corn grain yields increased in both years in responseble 5) although the intensity of the response was greaterto increasing rates of urea application (Fig. 2; Table 6).in 2000 than in 2001. The mean ear leaf N concentrationThe highest yields in response to urea application wereof all manure treatments was higher than that of thesimilar in both years, but the yield of the control treat-control in 2000, but no difference between manure treat-ment was lower in 2000 than in 2001. This pattern wasments and the control was detected in 2001 (Table 5).similar to that observed for the ear leaf N concentrationThe season of manure application was important for theat plant growth stage R1 and may reflect the influence2001 corn crop; fall-applied manure generated higherof the previous year’s crop on the quantity and qualityear leaf N concentrations than did spring-applied ma-of organic matter added to the soil and its N mineraliza-nure (Table 5).
Both the corn ear leaf N concentrations and chloro- tion rate (Green and Blackmer, 1995). At 0 kg N ha�1,
220 AGRONOMY JOURNAL, VOL. 96, JANUARY–FEBRUARY 2004
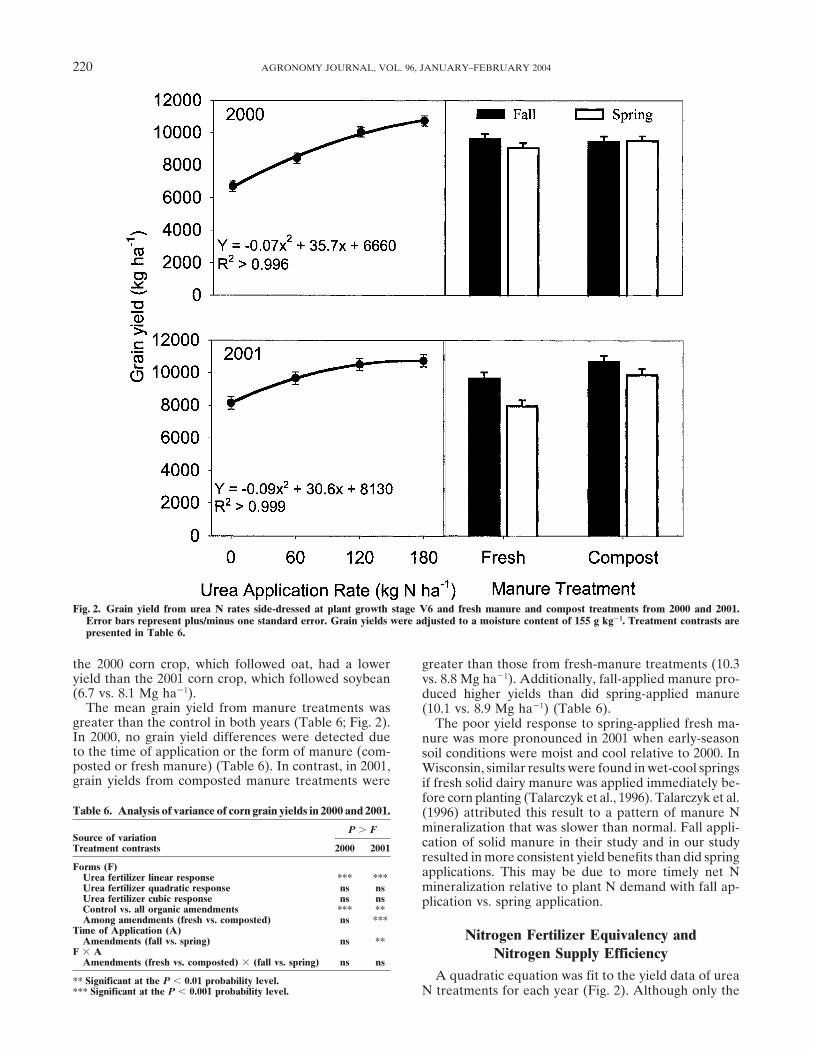
Fig. 2. Grain yield from urea N rates side-dressed at plant growth stage V6 and fresh manure and compost treatments from 2000 and 2001.Error bars represent plus/minus one standard error. Grain yields were adjusted to a moisture content of 155 g kg�1. Treatment contrasts arepresented in Table 6.
the 2000 corn crop, which followed oat, had a lower greater than those from fresh-manure treatments (10.3yield than the 2001 corn crop, which followed soybean vs. 8.8 Mg ha�1). Additionally, fall-applied manure pro-(6.7 vs. 8.1 Mg ha�1). duced higher yields than did spring-applied manure
The mean grain yield from manure treatments was (10.1 vs. 8.9 Mg ha�1) (Table 6).greater than the control in both years (Table 6; Fig. 2). The poor yield response to spring-applied fresh ma-In 2000, no grain yield differences were detected due nure was more pronounced in 2001 when early-seasonto the time of application or the form of manure (com- soil conditions were moist and cool relative to 2000. Inposted or fresh manure) (Table 6). In contrast, in 2001, Wisconsin, similar results were found in wet-cool springsgrain yields from composted manure treatments were if fresh solid dairy manure was applied immediately be-
fore corn planting (Talarczyk et al., 1996). Talarczyk et al.Table 6. Analysis of variance of corn grain yields in 2000 and 2001. (1996) attributed this result to a pattern of manure N
mineralization that was slower than normal. Fall appli-P � FSource of variation cation of solid manure in their study and in our studyTreatment contrasts 2000 2001
resulted in more consistent yield benefits than did springForms (F) applications. This may be due to more timely net NUrea fertilizer linear response *** ***
mineralization relative to plant N demand with fall ap-Urea fertilizer quadratic response ns nsUrea fertilizer cubic response ns ns plication vs. spring application.Control vs. all organic amendments *** **Among amendments (fresh vs. composted) ns ***
Time of Application (A) Nitrogen Fertilizer Equivalency andAmendments (fall vs. spring) ns **F � A Nitrogen Supply Efficiency
Amendments (fresh vs. composted) � (fall vs. spring) ns nsA quadratic equation was fit to the yield data of urea** Significant at the P � 0.01 probability level.
*** Significant at the P � 0.001 probability level. N treatments for each year (Fig. 2). Although only the

LOECKE ET AL.: FORM OF SWINE MANURE AND APPLICATION TIME AFFECT CORN YIELD 221
Table 7. Calculated N fertilizer equivalency values and N supply (Table 5). In 2001, fresh-manure applications resultedefficiencies of amendments, based on corn yield response to urea in higher stalk NO�
3 –N concentrations than composted-fertilizer side-dressed at corn growth stage V6, in 2000 and 2001.manure applications, and fall applications gave higher
N fertilizer N supply stalk NO�3 –N concentrations than did spring-applied
equivalency value efficiency†Time of manure. The relationship of stalk NO�
3 –N concentrationapplication Form 2000 2001 Mean 2000 2001 Mean to grain yield in 2000 followed closely the relationship
kg N ha�1 % described by Binford et al. (1992), but this pattern wasFall Fresh manure 103 60 82 30.7 17.9 24.3 not as distinct in 2001 (figure not shown). It is unclearFall Composted manure 96 137 117 28.6 40.8 34.7 if this was due to limited available soil N or increasedSpring Fresh manure 79 �6 37 23.5 �1.8 10.9
NO�3 assimilation efficiencies. For example, in 2001, de-Spring Composted manure 97 71 84 28.9 21.1 25.0
spite having similar yields, the fall-applied composted-† N supply efficiency defined as the N fertilizer equivalency value expressedmanure treatment resulted in lower stalk NO�
3 –N con-as a percentage of the total N applied (340 kg N ha�1).centrations than did the 120 and 180 kg N ha�1 urea Ntreatments. This suggests that factors other than N ef-linear trend was statistically significant (Table 6), thefects may have contributed to the grain yield responsequadratic function produced a better fit to the data andto manure.thus allowed for a more realistic extrapolation between
the yield data of urea N fertilizer and manure treatments(see Blevins et al., 1990). Based on each quadratic urea SUMMARYresponse curve, N fertilizer equivalency values were cal-
At the rates used in this study, spring application ofculated for each manure treatment mean (Table 7). Ni-fresh hoop manure resulted in problems with corn emer-trogen supply efficiencies for the different manure treat-gence, lower N use efficiencies, and inconsistent yields.ments were calculated by dividing N fertilizer equivalencyAlthough treatment effects were not always significant,values by the total amount of N applied in each manuremeasurements of soil NO�
3 –N concentrations at plant(Table 7). On average, fall application of manure gavegrowth stage V6 and apparent ear leaf chlorophyll and Nhigher N fertilizer equivalency values and higher N sup-concentrations at growth stage R1 indicated that spring-ply efficiencies than did spring application, and com-applied fresh manure supplied less N to the plants beforeposted manure provided more consistent N benefits thanand during flowering than did the other manure treat-did fresh manure. At the application rate used in thisments. Thus, N deficits may have contributed to lowerexperiment, spring-applied fresh manure produced in-yields in the spring-applied fresh-manure treatment com-consistent N benefits.pared with the other manure treatments. IncreasingIt is not surprising that fall application of manurespring-applied fresh hoop manure application rates totended to be more effective in supplying N to corn, givenmeet crop N demands may be detrimental to plant emer-the longer time and greater number of accumulated heatgence and may increase soil N immobilization.units associated with fall, rather than subsequent spring,
In 2001, stalk NO�3 –N concentrations in the manureapplication. Nevertheless, monitoring of soil N losses
treatments were low (�500 �g g�1) compared with theand net N mineralization in response to the timing ofstalk NO�
3 –N concentrations of urea N treatments de-manure application would help to clarify whether thespite similar grain yields (Tables 5 and 6; Fig. 2). Aobserved N fertilizer equivalencies and N supply effi-similar pattern was observed in the soil NO�
3 –N concen-ciencies were due to patterns of N transformation andtrations in the late spring of 2001 relative to grain yieldrelease or other non-N-related factors. More researchwhere manure treatments resulted in soil NO�
3 –N con-is needed to address this question.centrations below levels predicted to provide for opti-mal yield despite similar yields to urea N treatments.Fall Stalk Nitrate Concentration This finding supports the concept that soils freshlyamended with biologically active organic materials haveNitrate concentration in the lower portion of a corn
stalk (the section between 15 and 35 cm above the soil different N dynamics than those amended with mineralN fertilizers (Magdoff, 1991; Cambardella et al., 2003).surface) at plant maturity has been used as an indicator
of late-season soil NO�3 –N concentrations and/or envi- A more detailed examination of the seasonal N mineral-
ization and crop N uptake patterns in response to freshronmental stress (Binford et al., 1992). A stalk NO�3 –N
concentration of �2000 �g g�1 indicates excessive soil or composted hoop manure is needed to determinewhen and if supplemental N fertilizers may increase NNO�
3 or stress whereas concentrations �200 �g g�1 indi-cate insufficient inorganic soil N for maximum economic use efficiencies.
Although we observed similar mean N supply effi-grain yield (Binford et al., 1992).In our study, urea application resulted in positive ciencies for fall-applied fresh manure (24.3%) and
spring-applied compost (25.0%) (Table 7), the potentialstalk NO�3 responses in both years (Table 5). The signifi-
cant quadratic responses that were observed typically for large N losses during composting of fresh hoop ma-nure (Garrison et al., 2001) suggests that fall-appliedoccur as plant-available soil N becomes greater than the
plant’s ability to assimilate NO�3 into amino acids (Bin- fresh manure may be more desirable than spring-applied
compost for whole-farm N conservation. However, ni-ford et al., 1992). In both years, all manure treatmentsresulted in stalk NO�
3 –N concentrations �500 �g g�1, trate leaching potential could be relatively high withfall-applied fresh manure, which might result in negativeand the mean stalk NO�
3 –N concentration of manuretreatments was not different from the control treatment impacts on water quality. The multiple pathways through
222 AGRONOMY JOURNAL, VOL. 96, JANUARY–FEBRUARY 2004
p. 643–698. In A.L. Page et al. (ed.) Methods of soil analysis. Partwhich N may be lost following fall application of manure2. 2nd ed. Agron. Monogr. 9. ASA and SSSA, Madison, WI.need to be studied for a more complete whole-farm N
Khaleel, R., K.R. Reddy, and M.R. Overcash. 1981. Changes in soilbudget that considers both production and environmen- physical properties due to organic waste application: A review. J.tal endpoints. Environ. Qual. 110:133–141.
Leopold Center for Sustainable Agriculture. 2001. Hoop structuresIn cases where producers remove fresh manure fromchange Iowa landscape [Online]. Available at http://www.leopold.hoop structures in the spring, composting the materialiastate.edu/news/hoops.html (verified 3 Oct. 2003). Leopold Cent.for subsequent fall application appears to be a betterfor Sustainable Agric., Ames, IA.strategy than spreading it immediately before planting Ma, B.L., L.M. Dwyer, and E.G. Gregorich. 1999. Soil nitrogen amend-
corn since mean N supply efficiency was higher for the ment effects on nitrogen uptake and yield of maize. Agron. J.former management system (34.7%) than for the latter 91:650–656.
Magdoff, F. 1991. Understanding the Magdoff Pre-Sidedress Nitrate(10.9%) (Table 7). However, economic comparisons ofTest for corn. J. Prod. Agric. 4:297–305.manure management alternatives are needed to exam-
Magdoff, F. 1995. Soil quality and management. p. 349–364. In M.A.ine possible tradeoffs between composting costs, hauling Altieri (ed.) Agroecology: The science of sustainable agriculture.distance to the field with the associated reduction in 2nd ed. Westview Press, Boulder, CO.compost volume, and crop yield benefits. Economic and Martins, O., and T. Dewes. 1992. Loss of nitrogenous compounds
during composting of animal wastes. Bioresour. Technol. 42:103–111.environmental analyses will complement the agronomicMathur, S.P., G. Owen, H. Dinel, and M. Schnitzer. 1993. Determina-results presented here as all play critical roles in as-
tion of compost biomaturity: I. Literature review. Biol. Agric. Hor-sessing the suitability and sustainability of solid manure tic. 10:65–85.management alternatives. Menalled, F.D., M. Liebman, and D.D. Buhler. 2002. Impact of com-
posted swine manure on crop and weed establishment and growth.p. 183. In Proc. Workshop Eur. Weed Res. Soc. Working GroupREFERENCES on Physical and Cultural Weed Control, 5th, Pisa, Italy. 11–13 Mar.2002. Institut de Malherbologie, Ste. Anne de Bellevue, QC, Canada.Binford, G.D., A.M. Blackmer, and B.G. Meese. 1992. Optimal con-
centrations of nitrate in cornstalks at maturity. Agron. J. 84: Miller, M.H., and A.J. Ohlrogge. 1958. Principles of nutrient uptake881–887. from fertilizer bands: I. Effect of placement of nitrogen fertilizer
Blackmer, A.M., D. Pottker, M.E. Cerrato, and J. Webb. 1989. Corre- on uptake of band-placed phosphorus at different soil phosphoruslations between soil nitrate concentrations in late spring and corn levels. Agron. J. 50:95–97.yield in Iowa. J. Prod. Agric. 2:103–109. [NASS] National Agricultural Statistics Service. 2002. Iowa agricul-
Blevins, R.L., J.H. Herbek, and W.W. Frye. 1990. Legume cover tural statistics. County estimates [Online]. Available at http://crops as nitrogen sources for no-till corn and sorghum. Agron. www.nass.usda.gov/ia/ (verified 3 Oct. 2003). NASS, USDA, Wash-J. 82:769–777. ington, DC.
Brinton, W.F., Jr. 1985. Nitrogen response of maize to fresh and [NRCS] Natural Resources Conservation Service. 2000. Manure nutri-composted manure. Biol. Agric. Hortic. 3:55–64. ents relative to the capacity of cropland and pastureland to assimi-
Cambardella, C.A., T.L. Richard, and A. Russell. 2003. Compost late nutrients: Spatial and temporal trends for the United Statesmineralization in soil as a function of composting process condi- [Online]. Publ. nps00–0579. Available at http://www.nrcs.usda.gov/tions. Eur. J. Soil Biol. 39:117–127. technical/land/pubs/manntr.pdf (verified 3 Oct. 2003). NRCS,
Dancer, W.S., R. Eliason, and S. Lekhakul. 1998. Microwave assisted USDA, Washington, DC.soil and waste dissolution for estimation of total phosphorus. Com- Olson, R.A., and A.F. Dreier. 1956. Nitrogen, a key factor in fertilizermun. Soil Sci. Plant Anal. 29:1997–2006. phosphorus efficiency. Soil Sci. Soc. Am. Proc. 20:509–514.
Eghball, B., and G.W. Lesoing. 2000. Viability of weed seeds following Piekielek, W.P., and R.H. Fox. 1992. Use of a chlorophyll meter tomanure windrow composting. Compost Sci. Util. 8:46–53. predict sidedress nitrogen requirements for maize. Agron. J. 84:
Eghball, B., and J.F. Power. 1999. Composted and noncomposted 59–65.manure application to conventional and no-tillage systems: Corn Rao Bhamidimarri, S.M., and S.P. Pandey. 1996. Aerobic thermophilicyield and nitrogen uptake. Agron. J. 91:819–825. composting of piggery solid wastes. Water Sci. Technol. 33:89–94.
Eghball, B., J.F. Power, J.E. Gilley, and J.W. Doran. 1997. Nutrient, Reider, C.R., W.R. Herdman, L.E. Drinkwater, and R. Janke. 2000.carbon, and mass loss of beef cattle feedlot manure during compost- Yields and nutrient budgets under composts, raw dairy manureing. J. Environ. Qual. 26:189–193.
and mineral fertilizer. Compost Sci. Util. 8:328–339.Garrison, M.V., T.L. Richard, S.M. Tiquia, and M.S. Honeyman. 2001.Rynk, R. (ed.) 1992. On-farm composting handbook. NortheastNutrient losses from unlined bedded swine hoop structures and an
Regional Agric. Eng. Serv., Ithaca, NY.associated window composting site. ASAE Meeting Paper 01–2238.Sanchez, L., J.A. Diez, A. Polo, and R. Roman. 1997. Effect of timingASAE, St. Joseph, MI.
of application of municipal solid waste compost on N availabilityGreen, C.J., and A.M. Blackmer. 1995. Residue decomposition effectsfor crops in central Spain. Biol. Fertil. Soils 25:136–141.on nitrogen availability to corn following corn or soybean. Agron.
SAS Institute. 1999. The SAS system for Windows. Release 8.0. SASJ. 59:1065–1070.Inst., Cary, NC.Hansen, D.J. 1999. Soil testing and plant analysis to optimize nitrogen
Schepers, J.S., D.D. Francis, M. Vigil, and F.E. Below. 1992. Compari-management in manured cornfields. Ph.D. diss. Iowa State Univ.,son of corn leaf nitrogen concentration and chlorophyll meter read-Ames.ings. Commun. Soil Sci. Plant Anal. 23:2173–2187.Hanway, J.J. 1963. Growth stages of corn. Agron. J. 55:487–492.
Sharpley, A., J.J. Meisinger, A. Breeuwsma, J.T. Sims, T.C. Daniel,Hoitink, H.A., and G.A. Kuter. 1986. Effects of composts in growthand J.S. Schepers. 1998. Impacts of animal manure managementmedia on soilborne plant pathogens. p. 289–306. In Y. Chen and Y.on ground and surface water quality. p. 173–242. In J.L. HatfieldAvnimelech (ed.) The role of organic matter in modern agriculture.and B.A. Stewart (ed.) Animal waste utilization: Effective use ofMartinus Nijhoff, Dordrecht, the Netherlands.manure as a soil resource. Ann Arbor Press, Ann Arbor, MI.Honeyman, M.S. 1996. Sustainability issues of U.S. swine production.
Swift, M.J., O.W. Heal, and J.M. Anderson. 1979. Decomposition inJ. Anim. Sci. 74:1410–1417.terrestrial ecosystems. Studies in Ecol. 5. Blackwell, Oxford.Jackson, L.L., D.R. Keeney, and E.M. Gilbert. 2000. Swine manure
Talarczyk, K.A., K.A. Kelling, T.M. Wood, and D.E. Hero. 1996.management plans in north-central Iowa: Nutrient loading andTiming of manure application to cropland to maximize nutrientpolicy implications. J. Soil Water Conserv. 55:205–211.value. p. 257–263. In Proc. 1996 Wisconsin Fert., Aglime, and PestJenny, H. 1980. The soil resource. Ecological studies. Vol. 37. Springer-Manage. Conf., Madison, WI. Univ. of Wisconsin, Madison.Verlag, New York.
Keeney, D.R., and D.W. Nelson. 1982. Nitrogen—inorganic forms. Tiquia, S.M., T.L. Richard, and M.S. Honeyman. 2000. Effect of win-

LOECKE ET AL.: FORM OF SWINE MANURE AND APPLICATION TIME AFFECT CORN YIELD 223
dow turning and seasonal temperatures on composting of hog ma- mays L.) and the factors that influence this relationship. Agron. J.62:726–728.nure from hoop structures. Environ. Technol. 21:1037–1046.
Voss, R.D., J.E. Sawyer, A.P. Mallarino, and R. Killorn. 1999. Gen-Tiquia, S.M., T.L. Richard, and M.S. Honeyman. 2002. Carbon, nutri-eral guide for crop nutrient recommendations in Iowa [Online].ent, and mass loss during composting. Nutr. Cycling Agroecosyst.Iowa State Univ. Ext. PM-1688. Available at http://www.extension.62:15–24.iastate.edu/Publications/PM1688.pdf (verified 29 July 2003). IowaTiquia, S.M., and F.Y. Tam. 1998. Elimination of phytotoxicity during State Univ., Ames.
co-composting of spent pig-manure sawdust litter and pig sludge. Warman, P.R. 1995. Influence of rates and timing on incorporationBioresour. Technol. 65:43–49. of dairy manure compost on sweet corn yield, composition and
Tiquia, S.M., N.F.Y. Tam, and I.J. Hodgkiss. 1996. Effects of compost- soil fertility. Compost Sci. Util. 3:66–71.Wiese, A.F., J.M. Sweeten, B.W. Bean, C.D. Salisbury, and E.W.ing on phytotoxicity of spent pig-manure sawdust litter. Environ.
Chenault. 1998. High temperature composting of cattle feedlotPollut. 93:249–256.manure kills weed seed. Appl. Eng. Agric. 14:377–380.Valdrighi, M.M., A. Pera, M. Agnolucci, S. Frassinetti, D. Lunardi,
Xie, R., and A.F. MacKenzie. 1986. Urea and manure effects on soiland G. Vallini. 1996. Effects of compost-derived humic acids onnitrogen and corn dry matter yields. Soil Sci. Soc. Am. J. 50:vegetable biomass production and microbial growth within a plant 1504–1509.
(Cichorium intybus)–soil system: A comparative study. Agric. Eco- Zebarth, B.J., J.W. Paul, and R. Van Kleeck. 1999. The effect ofsyst. Environ. 58:133–144. nitrogen management in agricultural production on water and air
Voss, R.E., J.J. Hanway, and L.C. Dumenil. 1970. Relationship be- quality: Evaluation on a regional scale. Agric. Ecosyst. Environ.72:35–52.tween grain yield and leaf N, P, and K concentrations for corn (Zea
Related Documents