SOFTWARE Open Access CoreSlicer: a web toolkit for analytic morphomics Louis Mullie 1,2 and Jonathan Afilalo 1,2,3* Abstract Background: Analytic morphomics, or more simply, “morphomics,” refers to the measurement of specific biomarkers of body composition from medical imaging, most commonly computed tomography (CT) images. An emerging body of literature supports the use of morphomic markers measured on single-slice CT images for risk prediction in a range of clinical populations. However, uptake by healthcare providers been limited due to the lack of clinician-friendly software to facilitate measurements. The objectives of this study were to describe the interface and functionality of CoreSlicer- a free and open-source web-based interface aiming to facilitate measurement of analytic morphomics by clinicians - and to validate muscle and fat measurements performed in CoreSlicer against reference software. Results: Measurements of muscle and fat obtained in CoreSlicer show high agreement with established reference software. CoreSlicer features a full set of DICOM viewing tools and extensible plugin interface to facilitate rapid prototyping and validation of new morphomic markers by researchers. We present published studies illustrating the use of CoreSlicer by clinicians with no prior knowledge of medical image segmentation techniques and no formal training in radiology, where CoreSlicer was successfully used to predict operative risk in three distinct populations of cardiovascular patients. Conclusions: CoreSlicer enables extraction of morphomic markers from CT images by non-technically skilled clinicians. Measurements were reproducible and accurate in relation to reference software. Keywords: Analytic morphomics, Morphometric analysis, Body composition analysis, Planimetric measurements, Medical image segmentation, Computed tomography, Obesity, Sarcopenia Background Syndromes characterized by pathological alterations of body composition, such as sarcopenia, cachexia and obesity, are increasingly prevalent and portend an in- creased risk of adverse health outcomes. Accordingly, there is a growing interest, both at the clinical and aca- demic levels, in using body composition analysis to iden- tify vulnerable patients who would benefit from targeted evaluation and treatment [1]. Analytic morphomics, or more simply, “morphomics,” refers to the measurement of specific biomarkers of body composition from med- ical imaging, most commonly computed tomography (CT) images [2–4]. An emerging body of literature supports the use of morphomic markers measured on single-slice CT images for risk prediction in a range of clinical populations (Table 1). The analytic morphomics group at the University of Michigan has had a pioneer- ing influence in the field and has undertaken a major standardization effort with the publication of reference values derived from a large population of patients [5]. Despite promising results, adoption by healthcare pro- viders has been limited due to the lack of clinician- friendly software to facilitate measurements. Figure 1 displays a typical workflow for determination of morphomic markers; which begins by opening a study in DICOM format, selecting a validated reference ana- tomical level on a reconstructed view (e.g. the level of the 4th lumbar vertebra on a sagittal view), visualizing the corresponding axial image, and finally performing measurements using a combination of automatic and manual segmentation tools. Markers that can be * Correspondence: [email protected] 1 Department of Medicine, McGill University, 3755 Cote Ste Catherine Rd, E-222, Montreal, QC H3T 1E2, Canada 2 Division of Cardiology, McGill University, Montreal, QC, Canada Full list of author information is available at the end of the article © The Author(s). 2019 Open Access This article is distributed under the terms of the Creative Commons Attribution 4.0 International License (http://creativecommons.org/licenses/by/4.0/), which permits unrestricted use, distribution, and reproduction in any medium, provided you give appropriate credit to the original author(s) and the source, provide a link to the Creative Commons license, and indicate if changes were made. The Creative Commons Public Domain Dedication waiver (http://creativecommons.org/publicdomain/zero/1.0/) applies to the data made available in this article, unless otherwise stated. Mullie and Afilalo BMC Medical Imaging (2019) 19:15 https://doi.org/10.1186/s12880-019-0316-6

Welcome message from author
This document is posted to help you gain knowledge. Please leave a comment to let me know what you think about it! Share it to your friends and learn new things together.
Transcript

SOFTWARE Open Access
CoreSlicer: a web toolkit for analyticmorphomicsLouis Mullie1,2 and Jonathan Afilalo1,2,3*
Abstract
Background: Analytic morphomics, or more simply, “morphomics,” refers to the measurement of specificbiomarkers of body composition from medical imaging, most commonly computed tomography (CT) images. Anemerging body of literature supports the use of morphomic markers measured on single-slice CT images for riskprediction in a range of clinical populations. However, uptake by healthcare providers been limited due to the lackof clinician-friendly software to facilitate measurements. The objectives of this study were to describe the interfaceand functionality of CoreSlicer- a free and open-source web-based interface aiming to facilitate measurement ofanalytic morphomics by clinicians - and to validate muscle and fat measurements performed in CoreSlicer againstreference software.
Results: Measurements of muscle and fat obtained in CoreSlicer show high agreement with established referencesoftware. CoreSlicer features a full set of DICOM viewing tools and extensible plugin interface to facilitate rapidprototyping and validation of new morphomic markers by researchers. We present published studies illustrating theuse of CoreSlicer by clinicians with no prior knowledge of medical image segmentation techniques and no formaltraining in radiology, where CoreSlicer was successfully used to predict operative risk in three distinct populationsof cardiovascular patients.
Conclusions: CoreSlicer enables extraction of morphomic markers from CT images by non-technically skilledclinicians. Measurements were reproducible and accurate in relation to reference software.
Keywords: Analytic morphomics, Morphometric analysis, Body composition analysis, Planimetric measurements,Medical image segmentation, Computed tomography, Obesity, Sarcopenia
BackgroundSyndromes characterized by pathological alterations ofbody composition, such as sarcopenia, cachexia andobesity, are increasingly prevalent and portend an in-creased risk of adverse health outcomes. Accordingly,there is a growing interest, both at the clinical and aca-demic levels, in using body composition analysis to iden-tify vulnerable patients who would benefit from targetedevaluation and treatment [1]. Analytic morphomics, ormore simply, “morphomics,” refers to the measurementof specific biomarkers of body composition from med-ical imaging, most commonly computed tomography(CT) images [2–4]. An emerging body of literature
supports the use of morphomic markers measured onsingle-slice CT images for risk prediction in a range ofclinical populations (Table 1). The analytic morphomicsgroup at the University of Michigan has had a pioneer-ing influence in the field and has undertaken a majorstandardization effort with the publication of referencevalues derived from a large population of patients [5].Despite promising results, adoption by healthcare pro-viders has been limited due to the lack of clinician-friendly software to facilitate measurements.Figure 1 displays a typical workflow for determination
of morphomic markers; which begins by opening a studyin DICOM format, selecting a validated reference ana-tomical level on a reconstructed view (e.g. the level ofthe 4th lumbar vertebra on a sagittal view), visualizingthe corresponding axial image, and finally performingmeasurements using a combination of automatic andmanual segmentation tools. Markers that can be
* Correspondence: [email protected] of Medicine, McGill University, 3755 Cote Ste Catherine Rd,E-222, Montreal, QC H3T 1E2, Canada2Division of Cardiology, McGill University, Montreal, QC, CanadaFull list of author information is available at the end of the article
© The Author(s). 2019 Open Access This article is distributed under the terms of the Creative Commons Attribution 4.0International License (http://creativecommons.org/licenses/by/4.0/), which permits unrestricted use, distribution, andreproduction in any medium, provided you give appropriate credit to the original author(s) and the source, provide a link tothe Creative Commons license, and indicate if changes were made. The Creative Commons Public Domain Dedication waiver(http://creativecommons.org/publicdomain/zero/1.0/) applies to the data made available in this article, unless otherwise stated.
Mullie and Afilalo BMC Medical Imaging (2019) 19:15 https://doi.org/10.1186/s12880-019-0316-6

extracted using this workflow include tissue areas(muscle, fat, solid organs, bone), as well as attenuationvalues in Hounsfield units (HU), which provide an indexof tissue composition or “quality.” Key advantages overother methods of body composition assessment includethe wide availability of existing CT datasets, the abilityto perform measurements retrospectively, and the abilityto accurately assess tissue quantity, quality and distribu-tion with high reproducibility and minimal assumptions.Table 1 displays selected examples of morphomic
markers of muscle and adipose tissue derived fromsingle-slice measurements on abdominal or thoracic CTscans, with accompanying references to clinical valid-ation studies. The wide range of applications illustratesthe versatility of the proposed workflow. Automated seg-mentation algorithms are referenced when available.Given the increasing availability of clinically indicated
CT imaging studies [6] and the mounting recognition ofmorphomics as a prognostically relevant method of bodycomposition assessment, it is highly desirable to facilitatemeasurements for researchers and clinicians. However,developing software for the morphomics communityposes unique development challenges because the fieldexists at the confluence of multiple scientific disciplines,including medical image analysis (MIA), body compos-ition research, clinical medicine, and epidemiology. Wehave identified four key challenges and correspondingdesign requirements for software to bring morphomics“to the bedside” and to a larger community of re-searchers (Table 2). In this section, we review existingMIA software in light of these design constraints andidentify pertinent limitations of established approaches.A first key challenge is to bridge the gap in technical
knowledge between body composition researchers, whodevelop and validate morphomic markers, and health-care providers who can utilize these markers to enhancetheir evaluation and treatment of patients. The abilityquickly review and edit results is crucial in the clinical
Table 1 Selected single-slice morphomic markers derived frommuscle and adipose tissue area measurements on thoracic andabdominal CT scansCategory Marker name and definition Segmentation algorithms ID
Muscle(lumbar)− 29 to+ 150HU [24]
Psoas muscle area:combined area of the rightand left psoas muscles, inmm2 [25–47].
Shape model [48, 49] PMA
Psoas muscle attenuation:mean attenuation valuewithin the psoas muscles, inHU [31, 46, 50–55].
– PMA_HU
Lumbar dorsal muscle area:combined area musclecontained within the regionposterior to the spine andribs, no more lateral thanthe lateral-most edges ofthe erector spinae muscles(includes latissimus dorsi,quadratus lumborum, anderector spinae muscles), inmm2 [56–59].
Atlas-based [60],thresholding-based [61],fuzzy C-means [62, 63]
LDMA
Lumbar dorsal muscleattenuation: meanattenuation value within thedorsal muscles, in HU [63,64].
– LDMA_HU
Total lumbar muscle area:combined area of the psoas,rectus abdominis,pyramidalis, transversusabdominis, internal andexternal oblique, plus thedorsal muscle area, in mm2
[31, 56, 64–66]
FEM-based [67, 68] TLMA
Total lumbar muscleattenuation: meanattenuation value within thelumbar muscles, in HU [69].
– TLMA_HU
Muscle(thoracic)− 129 to+ 150HU
Total thoracic muscle area:combined area of thepectoralis, intercostal andparaspinal muscles, in mm2
[70–73].
FEM-based [74] TTLMA
Total thoracic muscleattenuation: meanattenuation value within thelumbar muscles, in HU (ND).
– TTLMA_HU
Fat(lumbar)−190 to− 30 HU
Visceral fat area: total area ofintraperitoneal fat, in mm2
[31, 54, 55, 75–79].
Fuzzy C-means [80], fuzzyaffinity [81], thresholding[82], separation mask [83],polar projection ([84], edgelinking [85], other [86]
VFA
Visceral fat attenuation:mean attenuation valuewithin the visceral fat, in HU[51, 53, 87–93].
– VFA_HU
Subcutaneous fat area: totalarea of fat tissue betweenthe skin and abdominal/back wall, in mm2 [31, 51,54, 55].
FEM-based [68], separationmask [93], other [93]
SFA
Subcutaneous fatattenuation: meanattenuation value within thesubcutaneous fat, in HU [53,87–91].
– SFA_HU
Total abdominal fat area:combined area of visceraland subcutaneous fat tissue,
– TAA
Table 1 Selected single-slice morphomic markers derived frommuscle and adipose tissue area measurements on thoracic andabdominal CT scans (Continued)Category Marker name and definition Segmentation algorithms ID
plus intramuscular fat, inmm2 [93].
Total abdominal fatattenuation: meanattenuation value within theabdominal fat, in HU (ND).
– TAA_HU
Fat(thoracic)− 190 to− 30 HU
Epicardial fat area: fatlocated between the heartand the pericardium, inmm2 [94–100].
Random forest [101, 102],geodesic active contours[103], fuzzy C-means [104],other [105]
EFA
Epicardial fat attenuation:mean attenuation valuewithin the epicardial fat, inHU [106]
– EFA_HU
Mullie and Afilalo BMC Medical Imaging (2019) 19:15 Page 2 of 14

setting, where expert validation of computer-generateddata is considered standard of care. Thus, for morpho-mics data to translate into improved decision-making, astreamlined, “clinician-friendly” interface for reviewingresults is essential.Current MIA software packages have adopted the
“toolbox” approach of user interface organization. Thisapproach is flexible, yet results in a high level of inter-face complexity due to the multiplicity of controls andmenus. For example, the main user control interface in-cludes 27 visible clickable control elements in Nora [7],28 in ImageJ [8], and 32 in slice-O-Matic [9]. By con-trast, the “wizard” approach is an organizational patternthat presents essential controls in step-by-step fashion,which facilitates the execution of unfamiliar tasks. Thewizard or “workflow-oriented” approach is most usefulfor “a non-expert user [who] needs to perform an infre-quent complex task consisting of several subtasks, wheredecisions need to be made in each subtask.” [10] Whilethe workflow-oriented pattern may be a valuable ap-proach for clinician-facing MIA software, only one ofthe major packages evaluated has adopted this approachas a primary user interface organization pattern, and thissoftware did not support workflows for measurement ofanalytic morphomics [11].A second key challenge is cross-platform compatibil-
ity, which is crucial to address owing to the heterogen-eity in computing environments deployed by teams ofresearchers and clinicians working across different
institutions. Of the major currently existing tools,Slice-O-matic, Materialize [12] and Segment [13] onlyoffer Windows support, while Osirix only supportsMac environments [14]. 3DSlicer [15], ImageJ [15]and ITKSnap [16] are notable free options with goodcross-platform compatibility. Although extremely power-ful, their interfaces have not been adapted to facilitatemeasurements by non-clinicians with little technicalknowledge in image analysis.Most current MIA software packages (e.g. ImageJ, Seg-
ment, Osirix, 3DSlicer) are distributed via desktop apps thatare installed on end-user machines, and these require con-tinuous updating to ensure forward-compatibility. Yet, clini-cians may be performing measurements on work machineswhere MIA software has not been installed, and, in manycases, institutional restrictions prevent end-users from in-stalling such software in the clinical environment. Over thelast decade, browser applications, or “web apps,” haveemerged as a more sustainable means of achieving robustcross-platform independence; these can be used instantly onany machine connected to the Internet, without prior instal-lation. Nora is an example of an MIA software with an em-phasis on brain imaging that is written entirely as a browserapplication [7]. Nora provides many advanced analysis fea-tures; limitations of this project are the lack of a pluginarchitecture, moderate to high interface complexity, and lackof a formal open-source development process.A third challenge is to facilitate prototyping, validation
and adoption of algorithms to segment scans and
Table 2 Design objectives for translational morphomics software
Design objective Rationale
Clinician-friendly, goal-directed interface Clinicians may not have the time and technical know-how required to use professional medical imageanalysis software.
Cross-platform support, minimal or noinstall required
Researchers and clinicians collaborating on morphomics projects across institutions are likely to work indifferent computer system environments. Clinicians may be performing measurements on work machineswhere MIA software has not been installed.
Extensibility via cloud-enabled plugins A flexible plugin interface enables application of the software to a wider variety of use cases, and cloudabilities facilitate the processing of large datasets.
Free license and open source codebase An open-source codebase and reuse-friendly license contributes to project sustainability by allowingcontributions from other researchers.
Fig. 1 Typical workflow for measurement of analytic morphomics
Mullie and Afilalo BMC Medical Imaging (2019) 19:15 Page 3 of 14

measure morphomic markers. Notably, at the time ofwriting, none of the segmentation algorithms presentedin Table 1 had been released as a plugin compatible withfreely available MIA software. While some MIA softwarehave support for language-specific plugins (e.g. Java forImageJ, Objective C for Osirix, Matlab for Segment,Python and C++ for 3DSlicer), the lack of cross-talk be-tween these languages hinders the development of a ro-bust plugin ecosystem. A modern method of providingextensibility via “plugins” is the use of HTTP applica-tion programming interfaces (APIs), which enable thedeveloper to write plugins in any language capable ofrunning a simple web server. As an added benefit,computational resources in the cloud can be leveragedwith the same interface and ease of use as local plugins.The neuroimaging community has already adoptedcloud-based tools such as MRIcloud [17], CBRAIN [18]and VolBrain [19] to facilitate collaboration and sharingof computational resources across geographically dis-persed research groups. Given the large-scale nature ofthe data sets used in morphomics, the communitywould benefit from a platform that enables rapid proto-typing and deployment of morphomics algorithms inthe cloud.Finally, a free licensing model and an open-source
development process was chosen as a design goal to fa-cilitate greater adoption of the software amongst re-searchers, and to promote project sustainability by
allowing developers to contribute their own updatesand plugins. Given that the adoption of commercialMIA software imposes a financial limit on wider-scalecollaboration, it is in the multidisciplinary spirit of themorphomics community to involve all stakeholders inbuilding free, open-source alternatives that are equit-ably available to a global audience of clinicians irre-spective of cost.As summarized in Table 3, a review of existing MIA
software identified that none satisfactorily addressed allof the key design constraints that we have proposed toguide development of translational morphomics soft-ware. While many are comprehensive and powerfultools, none of the currently available software tools pro-vides a simple, clinician-friendly pipeline to facilitatemorphomic analysis. To address this unmet need, weintroduce the first web-based interface optimized formeasurement of morphomics, called CoreSlicer, which ispublicly available free of charge at https://www.coresli-cer.com. Users can extend the software with their ownplugins running on their own machine or on cloud ser-vices through HTTP endpoints. The source code to theinterface is available on GitHub, and allows users to runthe application on their local machines. In this paper, wediscuss the structure and functionality of CoreSlicer, val-idate its results against reference software, and discusspublished studies illustrating its relevance for cliniciansand researchers.
Table 3 Selected major medical image analysis tools potentially suitable for morphomic analysis, features and limitations
Project name and URL Workflow-oriented
Webinterface
Platformindependent
Plugininterface
Webplugins
Freelicense
Opensource
Slice-o-matichttp://www.tomovision.com/products/sliceomatic.html
N N N (Windows-only) N N N N
ImageJhttps://imagej.nih.gov/ij/
N N Y (Java app) Java only N Y Y
Materializehttp://www.materialise.com/en/medical/software/mimics
N N N(Windows-only) N N N N
Segmenthttps://github.com/Cardiac-MR-Group-Lund/segment-open/
N N N (Windows-only) Matlab only N Y Y
MIAhttp://mia.sourceforge.net/
Y N N (POSIX-only) C++ only N Y Y
ITKSnaphttp://www.itksnap.org/pmwiki/pmwiki.php
N N Y (binaries) C++ only N Y Y
3DSlicerhttps://www.slicer.org/
N N Y (binaries) Python C++ N Y Y
Osirixhttp://www.osirix-viewer.com/
N N N (Mac only) Objective Conly
N Y Y
Norahttp://www.nora-imaging.com/
N Y Y N N Y N
CoreSlicerhttps://www.coreslicer.com
Y Y Y Anylanguage
Y Y Y
Mullie and Afilalo BMC Medical Imaging (2019) 19:15 Page 4 of 14

ImplementationSpecifications of CoreSlicerCoreSlicer is a browser-based application and is writtenentirely in Javascript, conformant to the ECMAScript 5specification. A public running instance of CoreSlicer isprovided free of use at www.coreslicer.com. This publicrunning instance showcases elemental plugins for segmen-tation of abdominal structures (Additional files 1 and 2).Users may also download a standalone version of CoreSli-cer free of charge at https://github.com/louismullie/coresli-cer. The standalone version of CoreSlicer is released underthe MIT license.
Testing requirementsCoreSlicer is developed for and was tested on GoogleChrome, versions 65.0 and above. The Google Chromeplatform was selected due to its widespread adoption andstability across multiple operating systems. Otherbrowsers are not currently supported. Tests were con-ducted on a machine with a 2 GHz intel Core i5 processorand 8 GB of rapid-access memory (RAM). A minimum 1GB of RAM is recommended to load full-body CT scansat 2.5 mm slice thickness, or 2 GB RAM at 1mm slice
thickness. A minimum processor speed of 1.0 GHz is rec-ommended to support interface drawing functions.
Program structureCoreSlicer is divided into 4 main modules (Fig. 2). As iscommon for web applications, a “model-view-controller”architecture is employed to enforce separation of con-cerns between different application modules [20]. The“Uploader” controlled provides functionality for loadingDICOM files from disk. The “Series” controlled handlesselection of a series of interest within a DICOM file anddecompression of the DICOM file, if necessary. The“Level” controlled provides functionality to select a levelof interest on a sagittal reconstruction. The “Regions”controller provides functionality for displaying DICOMimages and creating and editing regions of interest(ROIs).
Graphical user interfaceThe CoreSlicer interface is organized into 4 main win-dows (Fig. 3). From the “Uploader” window (Fig. 3a),users can load one or more DICOM file(s) by draggingand dropping or via the operating system’s native file se-lect input. From the “Series” window, users can select a
Fig. 2 Program structure overview
Mullie and Afilalo BMC Medical Imaging (2019) 19:15 Page 5 of 14

series of interest among those contained in the DICOMarchive. From the “Level” window (Fig. 3b), users can se-lect a level of interest on a sagittal reconstruction imageof the previously selected series. From the “Region” win-dow (Fig. 3c), users can define one or more ROIs, andassign a custom HTTP endpoint that provides automaticsegmentation functionality for the relevant ROI. Userscan draw and edit an ROI using the threshold brush anderaser tools. Results are exported to a ZIP archive con-taining the segmentation masks as well as area andHounsfield unit measurements in comma-separatedvalue (CSV) format.
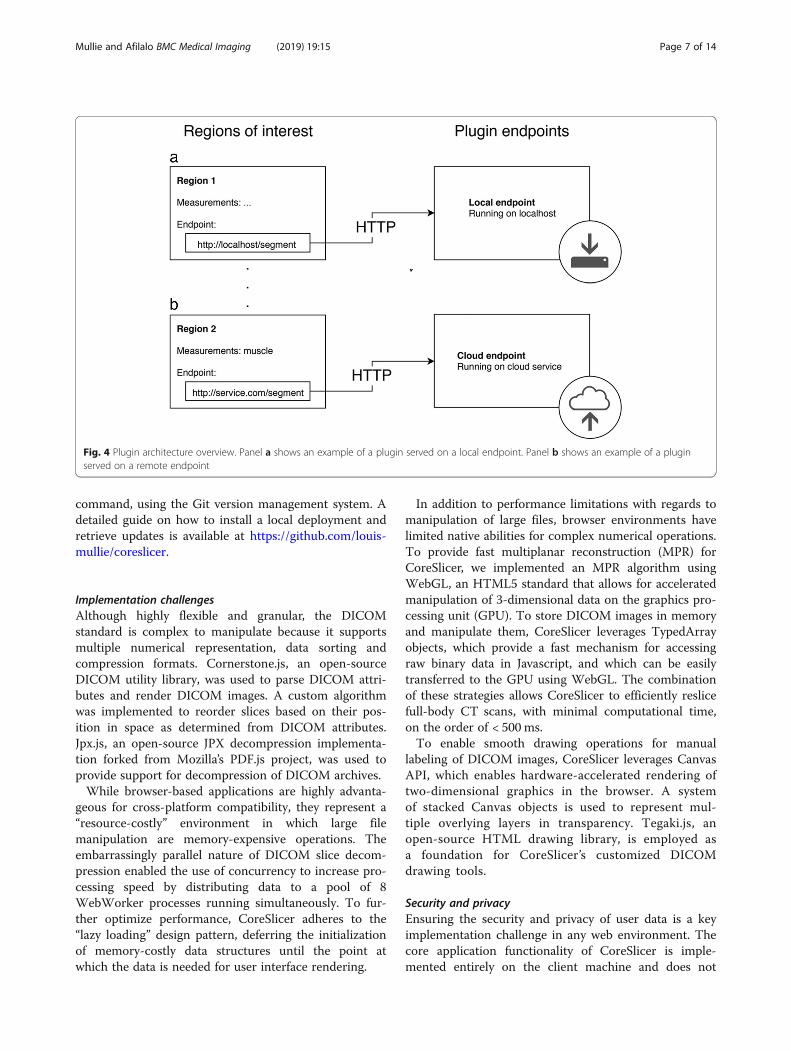
Extensibility via pluginsCoreSlicer can be extended via user-supplied webhooksthat provide segmentation functionality over an HTTPinterface. CoreSlicer’s plugin API structure is illustratedin Fig. 4.From the “Regions” window, when creating a new cus-
tom region, CoreSlicer allows users to assign a custom
HTTP webhook that is triggered when a user initiatesthe draw action assigned to the corresponding ROI. Inresponse, a POST request is sent to the assigned end-point containing the anonymized DICOM image binarydata and additional slice information encoded as a mul-tipart FormData object (request MIME type multipart/form-data). User endpoints return a binary segmentationmask in PNG format (response MIME type image/png),where all non-zero pixels are assigned a value of 1.Further information is available from the user manual,which can be found on Github (https://github.com/louismullie/coreslicer).
Local deploymentDeployment on a local server can be performed withminimal technical knowledge using Node.js, an opensource programming runtime that is supported by allmajor operating systems including Windows, Mac OSand UNIX. Local deployments can be updated to thelatest public version of CoreSlicer’s code via a single
Fig. 3 Graphical user interface overview. Panel a shows the “Uploader” window, where DICOM archives can be imported. Panel b shows the“Level” window, using which an anatomical level can be selected. Panel c shows the “Region” window, using which regions of interest canbe segmented
Mullie and Afilalo BMC Medical Imaging (2019) 19:15 Page 6 of 14
command, using the Git version management system. Adetailed guide on how to install a local deployment andretrieve updates is available at https://github.com/louis-mullie/coreslicer.
Implementation challengesAlthough highly flexible and granular, the DICOMstandard is complex to manipulate because it supportsmultiple numerical representation, data sorting andcompression formats. Cornerstone.js, an open-sourceDICOM utility library, was used to parse DICOM attri-butes and render DICOM images. A custom algorithmwas implemented to reorder slices based on their pos-ition in space as determined from DICOM attributes.Jpx.js, an open-source JPX decompression implementa-tion forked from Mozilla’s PDF.js project, was used toprovide support for decompression of DICOM archives.While browser-based applications are highly advanta-
geous for cross-platform compatibility, they represent a“resource-costly” environment in which large filemanipulation are memory-expensive operations. Theembarrassingly parallel nature of DICOM slice decom-pression enabled the use of concurrency to increase pro-cessing speed by distributing data to a pool of 8WebWorker processes running simultaneously. To fur-ther optimize performance, CoreSlicer adheres to the“lazy loading” design pattern, deferring the initializationof memory-costly data structures until the point atwhich the data is needed for user interface rendering.
In addition to performance limitations with regards tomanipulation of large files, browser environments havelimited native abilities for complex numerical operations.To provide fast multiplanar reconstruction (MPR) forCoreSlicer, we implemented an MPR algorithm usingWebGL, an HTML5 standard that allows for acceleratedmanipulation of 3-dimensional data on the graphics pro-cessing unit (GPU). To store DICOM images in memoryand manipulate them, CoreSlicer leverages TypedArrayobjects, which provide a fast mechanism for accessingraw binary data in Javascript, and which can be easilytransferred to the GPU using WebGL. The combinationof these strategies allows CoreSlicer to efficiently reslicefull-body CT scans, with minimal computational time,on the order of < 500 ms.To enable smooth drawing operations for manual
labeling of DICOM images, CoreSlicer leverages CanvasAPI, which enables hardware-accelerated rendering oftwo-dimensional graphics in the browser. A systemof stacked Canvas objects is used to represent mul-tiple overlying layers in transparency. Tegaki.js, anopen-source HTML drawing library, is employed asa foundation for CoreSlicer’s customized DICOMdrawing tools.
Security and privacyEnsuring the security and privacy of user data is a keyimplementation challenge in any web environment. Thecore application functionality of CoreSlicer is imple-mented entirely on the client machine and does not
Fig. 4 Plugin architecture overview. Panel a shows an example of a plugin served on a local endpoint. Panel b shows an example of a pluginserved on a remote endpoint
Mullie and Afilalo BMC Medical Imaging (2019) 19:15 Page 7 of 14

require any transmission of data. This includes loadingDICOM files, decompressing image files if needed, per-forming multiplanar reconstruction, as well as manuallydrawing and editing measurements. The use of optionalsegmentation plugins requires transmission of informa-tion over the Internet. This information is protected intransit using RSA encryption with 4096-bit keys, via theSecure Sockets Layer (SSL) protocol. In addition,through its plugin interface, CoreSlicer allows users tosecurely transmit data directly from their machine touser-controlled processing endpoints, without any infor-mation transiting via CoreSlicer’s servers. Users who de-sire enhanced privacy can run the CoreSlicer interfaceon their local machines. CoreSlicer automatically stripsDICOM files of identifying information prior to anyform of external transmission in order to preventdisclosure of protected health information.
Validation methodsMeasurements from CoreSlicer were validated againstslice-O-matic, a commercial cadaver-validated referencesoftware. Cross-sectional area measurements (Fig. 4)were performed by two trained observers (LM and JA),respectively designated observer A and observer B. Ob-server A performed measurements of VFA, SFA, TLMAand PMA in triplicate, once using the slice-O-matic soft-ware package (version 5.0), and twice using the manualdrawing tools in the CoreSlicer web interface (version1.0). Repeated measurements were performed at least 1week apart to limit observer bias. In a subset of 20 scans,observers A and B each obtained measurements of VFA,SFA, TLMA and PMA using CoreSlicer. All measure-ments were performed on axial series at the superior as-pect of L4, immediately below the vertebral endplate.ROIs were defined as: psoas muscle area (PMA), total
lumbar muscle area (TLMA), visceral fat area (VFA) and
subcutaneous fat area (SFA). These were chosen amongmarkers illustrated in Table 1 based on the robustnessof the supporting clinical evidence. A representativelabeled image is illustrated in Fig. 5. Hounsfield unitranges were − 190 to − 30 for adipose tissue (VFA andSFA), and − 29 to 150 for skeletal muscle (TLMA andPMA) [9].
Statistical analysesFor comparisons between sets of measurements, meandifference, 95% level of agreement (LOA), and Spear-man’s correlation coefficient were calculated. Results arepresented using Bland-Altman plots (Additional file 3).Additionally, for the main outcome of interest, whichcompared measurements in CoreSlicer with measure-ments in slice-O-matic, the intraclass correlation coeffi-cient was calculated, and power analysis was performed.Assuming a hypothesized ICC of 0.99, and a null ICCvalue of 0.90, a sample of 50 subjects (2 measurements persubject) has 100% power to detect a difference betweenthe two measurement methods at a 5% type 1 error rate.All statistical analyses were performed with the STATAsoftware package (version 14.0, College Station, Texas).
ResultsA total of 50 CT scans were drawn and analyzed from acohort of older adults undergoing a routine pre-operative CT scans during assessment for a heart valveprocedure. The population comprised 24 women and 26men, with a mean age of 80 years (range 64 to 96 years).The mean BMI was 26.2 (range 20.5 to 44.5). Descriptivestatistics of the study population are presented inTable 4.Mean cross-sectional areas were 202.6 ± 82.5 cm2 for
VFA, 214.2 ± 105.8 cm2 for SFA, 119.05 ± 26.5 cm2 forTLMA, and 19.77 ± 5.6 cm2 for PMA. In Fig. 6, a
Fig. 5 Illustration of muscle and fat segmentation at L4 in CoreSlicer
Mullie and Afilalo BMC Medical Imaging (2019) 19:15 Page 8 of 14
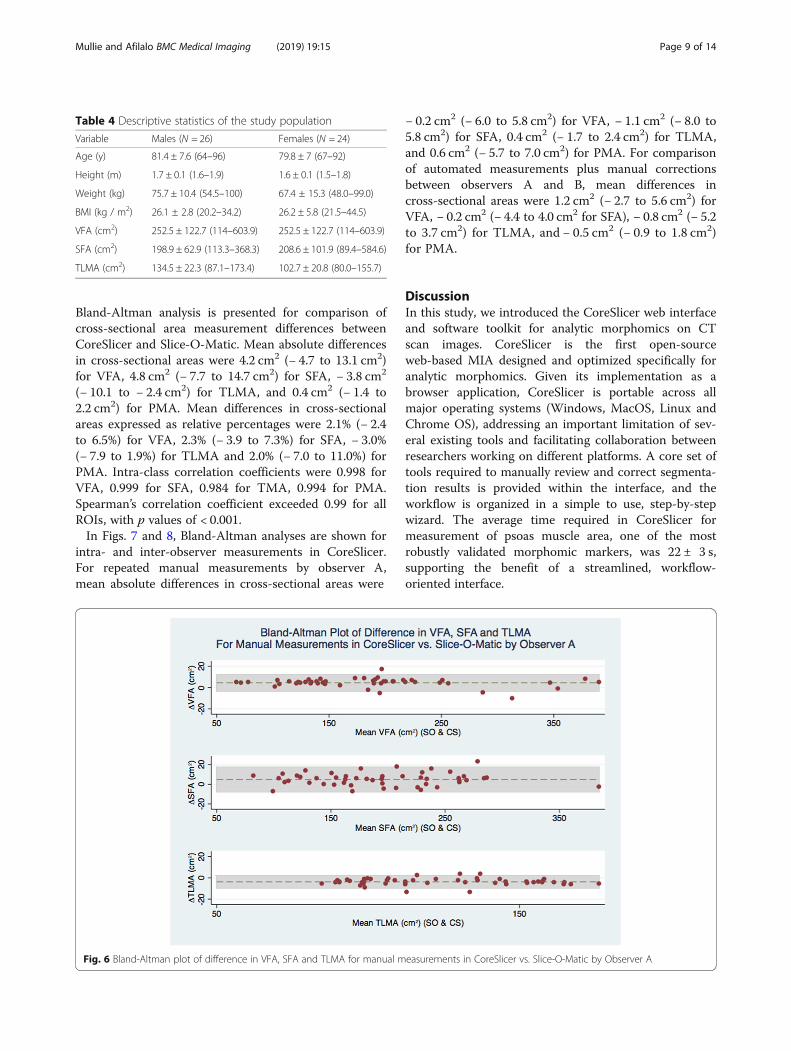
Bland-Altman analysis is presented for comparison ofcross-sectional area measurement differences betweenCoreSlicer and Slice-O-Matic. Mean absolute differencesin cross-sectional areas were 4.2 cm2 (− 4.7 to 13.1 cm2)for VFA, 4.8 cm2 (− 7.7 to 14.7 cm2) for SFA, − 3.8 cm2
(− 10.1 to − 2.4 cm2) for TLMA, and 0.4 cm2 (− 1.4 to2.2 cm2) for PMA. Mean differences in cross-sectionalareas expressed as relative percentages were 2.1% (− 2.4to 6.5%) for VFA, 2.3% (− 3.9 to 7.3%) for SFA, − 3.0%(− 7.9 to 1.9%) for TLMA and 2.0% (− 7.0 to 11.0%) forPMA. Intra-class correlation coefficients were 0.998 forVFA, 0.999 for SFA, 0.984 for TMA, 0.994 for PMA.Spearman’s correlation coefficient exceeded 0.99 for allROIs, with p values of < 0.001.In Figs. 7 and 8, Bland-Altman analyses are shown for
intra- and inter-observer measurements in CoreSlicer.For repeated manual measurements by observer A,mean absolute differences in cross-sectional areas were
− 0.2 cm2 (− 6.0 to 5.8 cm2) for VFA, − 1.1 cm2 (− 8.0 to5.8 cm2) for SFA, 0.4 cm2 (− 1.7 to 2.4 cm2) for TLMA,and 0.6 cm2 (− 5.7 to 7.0 cm2) for PMA. For comparisonof automated measurements plus manual correctionsbetween observers A and B, mean differences incross-sectional areas were 1.2 cm2 (− 2.7 to 5.6 cm2) forVFA, − 0.2 cm2 (− 4.4 to 4.0 cm2 for SFA), − 0.8 cm2 (− 5.2to 3.7 cm2) for TLMA, and − 0.5 cm2 (− 0.9 to 1.8 cm2)for PMA.
DiscussionIn this study, we introduced the CoreSlicer web interfaceand software toolkit for analytic morphomics on CTscan images. CoreSlicer is the first open-sourceweb-based MIA designed and optimized specifically foranalytic morphomics. Given its implementation as abrowser application, CoreSlicer is portable across allmajor operating systems (Windows, MacOS, Linux andChrome OS), addressing an important limitation of sev-eral existing tools and facilitating collaboration betweenresearchers working on different platforms. A core set oftools required to manually review and correct segmenta-tion results is provided within the interface, and theworkflow is organized in a simple to use, step-by-stepwizard. The average time required in CoreSlicer formeasurement of psoas muscle area, one of the mostrobustly validated morphomic markers, was 22 ± 3 s,supporting the benefit of a streamlined, workflow-oriented interface.
Table 4 Descriptive statistics of the study population
Variable Males (N = 26) Females (N = 24)
Age (y) 81.4 ± 7.6 (64–96) 79.8 ± 7 (67–92)
Height (m) 1.7 ± 0.1 (1.6–1.9) 1.6 ± 0.1 (1.5–1.8)
Weight (kg) 75.7 ± 10.4 (54.5–100) 67.4 ± 15.3 (48.0–99.0)
BMI (kg / m2) 26.1 ± 2.8 (20.2–34.2) 26.2 ± 5.8 (21.5–44.5)
VFA (cm2) 252.5 ± 122.7 (114–603.9) 252.5 ± 122.7 (114–603.9)
SFA (cm2) 198.9 ± 62.9 (113.3–368.3) 208.6 ± 101.9 (89.4–584.6)
TLMA (cm2) 134.5 ± 22.3 (87.1–173.4) 102.7 ± 20.8 (80.0–155.7)
Fig. 6 Bland-Altman plot of difference in VFA, SFA and TLMA for manual measurements in CoreSlicer vs. Slice-O-Matic by Observer A
Mullie and Afilalo BMC Medical Imaging (2019) 19:15 Page 9 of 14

Implementation challenges were addressed with stateof the art browser application technologies includingdistributed processing of large files using WebWorkers,hardware-accelerated 2D drawing using the Canvasobject, 3D multiplanar reconstruction on the GPU
using WebGL, and memory optimizations usingTypedArrays.Researchers can use CoreSlicer to rapidly prototype
image segmentation tools in the language of their choiceusing a standardized HTTP interface. Additionally,
Fig. 7 Bland-Altman plot of difference in VFA, SFA and TLMA for repeated manual measurements in CoreSlicer by Observer A
Fig. 8 Bland-Altman plot of difference in VFA, SFA and TLMA for computed-assisted measurements in CoreSlicer by Observers A and B
Mullie and Afilalo BMC Medical Imaging (2019) 19:15 Page 10 of 14

CoreSlicer is the first web-based MIA software without-of-the-box support for asynchronous plugin execu-tion, enabling the use of segmentation tools served inthe cloud at the click of a button. For researchersseeking to expand, refine, or adapt the capabilities Core-Slicer, the source code has been made available via anopen source repository.We conducted duplicate measurements of well-
validated fat and muscle morphomic markers usingCoreSlicer and slice-O-matic, and demonstrated goodagreement between the two methods. The limits ofagreement were comparable with previously reportedvalues for comparison of the NIH ImageJ andSlice-O-Matic software packages [8]. The intra- andinter-observer variability of measurements was alsocomparable with previously reported results [21], withthe relative differences all being < 3% and unlikely to beclinically significant. Thus, measurements of VFA, SFAand TLMA in CoreSlicer were reproducible and accur-ate in relation to reference software.The potential impact of CoreSlicer as a translational tool
for morphomics has been demonstrated in three studiesaiming to validate the prognostic value of PMA in cardiacand vascular surgery patients. Our work and that of othershas shown that psoas muscle area (PMA), a surrogate oflean muscle mass and lower extremity strength, correlateswith clinical frailty scores and is an important risk factorfor morbidity and mortality following invasive procedures(Table 1). Mamane et al. [32] showed that PMA measuredusing CoreSlicer was predictive of mortality in elderlywomen undergoing TAVR. Drudi et al. [38] similarlyshowed that PMA was predictive of mortality in patientsundergoing abdominal aortic aneurysm repair. Zuckermanet al. [30] used CoreSlicer to show that PMA correlatedwith length of stay following major cardiac surgery. Thus,measurements of PMA in CoreSlicer were incrementallypredictive of adverse health outcomes in vulnerable pa-tients undergoing invasive procedures. These measure-ments could be obtained by medical trainees with no priormedical image analysis training in under 1min.These examples illustrate how morphomics can
empower healthcare professionals with prognostic infor-mation to tailor treatment strategies and individualizecare. Patients found to have low muscle mass, oftenunrecognized by the de facto “eyeball assessment”, maybenefit from targeted interventions such as exercisetherapy and nutritional supplementation to build musclemass and strength and minimize their risk of failed re-covery after an illness or surgery [22]. This information,which has been consciously absent from the clinicalarena owing to the inaccessible nature of its measure-ment tools, is now readily obtainable within < 1 min atthe point of care by healthcare professionals with min-imal pre-training.
LimitationsThe results of this study must be considered in light of thefollowing limitations. First, since CT incurs ionizingradiation and is not appropriate for the sole purpose of bodycomposition analysis, CoreSlicer is currently limited to theanalysis of images that have been acquired for clinicalpurposes. Protocols are in development to acquire limitedslices with lower radiation. Second, although the CoreSlicersoftware has been designed to visualize DICOM imagesproduced by both CT and MRI scanners, only the formermodality was tested and validated in this initial release ofthe software. Given the widespread availability of clinicallyindicated CT studies, we believe that this in no way limitsthe potential large-scale impact of our software. Third,CoreSlicer is currently capable of performing measurementson one slice per study and is therefore not amenable tocompute volumetric measurements in its current iteration.Importantly, the aims of the CoreSlicer project are not toprovide a comprehensive MIA or image segmentation tool-kit, but rather to provide a streamlined workflow for analyticmorphomics, and to maintain the simplicity to achieve ourtranslational goal of a clinician-friendly interface. A largenumber of single- slice morphomic markers have alreadybeen validated and can be measured using CoreSlicer. Oncecareful planning identifies how to optimally integratemulti-slice functionality while keeping the interface com-plexity at a minimum, three-dimensional visualization willbe implemented using existing open-source libraries [23].
ConclusionsCoreSlicer is a free and open-source web-based interfaceaiming to facilitate measurement of analytic morphomicson DICOM images by non-technically skilled clinicians.CoreSlicer features a full set of DICOM viewing tools andextensible plugin interface to facilitate rapid prototypingand validation of new morphomic markers by researchers.In this study, the CoreSlicer interface and functionality isdescribed, and validity of CoreSlicer measurements is estab-lished by comparing its results with reference software on aset of 50 abdominal CT scans, demonstrating good repro-ducibility and agreement with reference software. Wepresent published studies illustrating the clinical relevanceof morphomic measurements obtained in CoreSlicer inthree distinct populations of cardiovascular patients.
Availability and requirementsProject name: CoreSlicer.Project home page: www.coreslicer.comOperating system(s): platform independent.Programming language: Javascript.Other requirements: none.License: MIT.Restrictions: CoreSlicer is not licensed for clinical or
commercial use.
Mullie and Afilalo BMC Medical Imaging (2019) 19:15 Page 11 of 14
Additional files
Additional file 1: Algorithm for computer-assisted adipose and muscletissue segmentation on abdominal CT scan images. Describes the elementalsegmentation algorithms used to showcase CoreSlicer’s functionality onwww.coreslicer.com. (DOCX 100 kb)
Additional file 2: Figure S1. Illustration of muscle and adipose tissueboundary detection in pseudo-polar coordinates. (PDF 1579 kb)
Additional file 3: Figure S2. Bland-Altman plot of difference in VFA,SFA and TLMA for manual measurements in CoreSlicer by Observers Aversus automated segmentation. (PDF 836 kb)
AbbreviationsBMI: Body mass index; CT: Computed tomography; DICOM: Digital Imagingand Communications in Medicine; GPU: Graphics processing unit; MIA: Medical image analysis; MR: Magnetic resonance; PMA: Psoas muscle area;ROI: Region of interest; SFA: Subcutaneous adipose tissue area; TLMA: Totalskeletal muscle area; VFA: Visceral adipose tissue area
AcknowledgementsWe would like to acknowledge Christophe Marois for his help in developingthe CoreSlicer user interface.Trademarks: DICOM is a registered trademark of the National ElectricalManufacturers Association for its standards publications relating to digitalcommunication of medical information.
FundingJonathan Afilalo is supported by the Fonds de recherche du Québec enSanté, Heart and Stroke Foundation of Canada, and Canadian Institutes ofHealth Research.
Availability of data and materialsThe anonymized datasets used in the current study are available from thecorresponding author upon reasonable request.
Authors’ contributionsLM designed and programmed the software and wrote major portions ofthe paper. JA oversaw writing the software and wrote and edited portionsthe paper. LM and JA collected measurements. Both authors read andapproved the final manuscript.
Ethics approval and consent to participateThe study protocol was approved by the Ethics Review Board of the JewishGeneral Hospital.
Consent for publicationNot applicable.
Competing interestsLouis Mullie and Jonathan Afilalo declare that they have no conflicts ofinterest. Louis Mullie and Jonathan Afilalo developed the CoreSlicer softwarebut do not hold any financial incentives or patents related to its use.
Publisher’s NoteSpringer Nature remains neutral with regard to jurisdictional claims inpublished maps and institutional affiliations.
Author details1Department of Medicine, McGill University, 3755 Cote Ste Catherine Rd,E-222, Montreal, QC H3T 1E2, Canada. 2Division of Cardiology, McGillUniversity, Montreal, QC, Canada. 3Centre for Clinical Epidemiology, LadyDavis Institute, Jewish General Hospital, McGill University, Montreal, QC,Canada.
Received: 24 April 2018 Accepted: 21 January 2019
References1. Friedman J, Lussiez A, Sullivan J, Wang S, Englesbe M. Implications of
sarcopenia in major surgery. Nutr Clin Pract. 2015 Apr;30(2):175–9.2. Stidham RW, Waljee AK, Day NM, Bergmans CL, Zahn KM, Higgins PD, et al.
Body fat composition assessment using analytic morphomics predictsinfectious complications after bowel resection in Crohn's disease. InflammBowel Dis. 2015 Jun;21(6):1306–13.
3. Chughtai K, Song Y, Zhang P, Derstine B, Gatza E, Friedman J, et al. Analyticmorphomics: a novel CT imaging approach to quantify adipose tissue andmuscle composition in allogeneic hematopoietic cell transplantation. BoneMarrow Transplant. 2016 Mar;51(3):446–50.
4. Singal AG, Zhang P, Waljee AK, Ananthakrishnan L, Parikh ND, Sharma P, etal. Body composition features predict overall survival in patients withhepatocellular carcinoma. Clin Transl Gastroenterol. 2016 May 26;7:e172.
5. Morphomics Research Group. Michigan Medicine. http://www.med.umich.edu/surgery/morphomics/index.html. 2018. Accessed 24 Apr 2018.
6. Smith-Bindman R, Miglioretti DL, Johnson E, Lee C, Feigelson HS, Flynn M,et al. Use of diagnostic imaging studies and associated radiation exposurefor patients enrolled in large integrated health care systems, 1996-2010.JAMA. 2012;307(22):2400–9.
7. C Anastasopoulos, M Reisert, E Kellner. “Nora Imaging”: A Web-BasedPlatform for Medical Imaging. Neuropediatrics. 2017; doi: https://doi.org/10.1055/s-0037-1602977
8. Schneider CA, Rasband WS, Eliceiri KW. NIH image to ImageJ: 25 years ofimage analysis. Nat Methods. 2012;9(7):671–5.
9. Abate N, Burns D, Peshock RM, Garg A, Grundy SM. Estimation of adiposetissue mass by magnetic resonance imaging: validation against dissection inhuman cadavers. J Lipid Res. 1994;35(8):1490–6.
10. Martijn van W, Hallvard T. Monitor Changes: Interaction Patterns in UserInterfaces: 2000; doi: 10.1.1.36.7484.
11. Wollny G, Kellman P, Ledesma-Carbayo MJ, Skinner MM, Hublin JJ, Hierl T.MIA - a free and open source software for gray scale medical imageanalysis. Source Code Biol Med. 2013;8(1):20.
12. Gelaude F, Vander Sloten J, Lauwers B. Accuracy assessment of CT-basedouter surface femur meshes. Comput Aided Surg. 2008;13(4):188–99.
13. Heiberg E, Sjögren J, Ugander M, Carlsson M, Engblom H, Arheden H.Design and validation of segment--freely available software forcardiovascular image analysis. BMC Med Imaging. 2010;10:1.
14. Rosset A, Spadola L, Ratib O. OsiriX: an open-source software for navigatingin multidimensional DICOM images. J Digit Imaging. 2004;17(3):205–16.
15. Yushkevich PA, Piven J, Hazlett HC, Smith RG, Ho S, Gee JC, et al. User-guided 3D active contour segmentation of anatomical structures:significantly improved efficiency and reliability. NeuroImage. 2006;31(3):1116–28.
16. Pieper S, Halle M, Kikinis R. 3D Slicer. IEEE International Symposium onBiomedical Imaging: Nano to Macro 2004; doi: https://doi.org/10.1109/ISBI.2004.1398617.
17. Susumu M, Dan W, Can C. MRICloud: delivering high-throughput MRINeuroinformatics as cloud-based software as a service. Computing inScience & Engineering. 2016;18(5):21–35.
18. Sherif T, Rioux P, Rousseau ME, Kassis N, Beck N, Adalat R, et al. CBRAIN: aweb-based, distributed computing platform for collaborative neuroimagingresearch. Front Neuroinform. 2014;8:54.
19. Manjón JV, Coupé P. volBrain: An Online MRI Brain Volumetry System. FrontNeuroinform. 2016;10:30.
20. A Leff, JT Rayfield. Web-application development using the Model/View/Controller design pattern Enterprise Distributed Object ComputingConference: 2001; doi: https://doi.org/10.1109/EDOC.2001.950428.
21. Sottier D, Petit JM, Guiu S, Hamza S, Benhamiche H, Hillon P, et al.Quantification of the visceral and subcutaneous fat by computedtomography: interobserver correlation of a single slice technique. DiagnInterv Imaging. 2013;94(9):879–84.
22. Malafarina V, Uriz-Otano F, Iniesta R, Gil-Guerrero L. Effectiveness ofnutritional supplementation on muscle mass in treatment of sarcopenia inold age: a systematic review. J Am Med Dir Assoc. 2013;14(1):10–7.
23. Haehn D, Rannou N, Ahtam B, Grant E, Pienaar R. Neuroimaging in thebrowser using the X toolkit. Neuroinformatics. 2014. https://doi.org/10.3389/conf.fninf.2014.08.00101.
Mullie and Afilalo BMC Medical Imaging (2019) 19:15 Page 12 of 14

24. Mitsiopoulos N, Baumgartner RN, Heymsfield SB, Lyons W, Gallagher D, RossR. Cadaver validation of skeletal muscle measurement by magneticresonance imaging and computerized tomography. J Appl Physiol (1985).1998 Jul;85(1):115–22.
25. Zakaria HM, Massie L, Basheer A, Elibe E, Boyce-Fappiano D, Shultz L, et al.Application of Morphometrics as a Predictor for Survival in Patients withProstate Cancer Metastasis to the Spine. World Neurosurg. 2018.
26. Zakaria HM, Massie L, Basheer A, Boyce-Fappiano D, Elibe E, Schultz L,et al. Application of morphometrics as a predictor for survival in femalepatients with breast cancer spinal metastasis: a retrospective cohortstudy. Spine J. 2018.
27. Tsutsumi S, Kawahara T, Teranishi JI, Yao M, Uemura H. A low psoas musclevolume predicts longer hospitalization and cancer recurrence in upperurinary tract urothelial carcinoma. Mol Clin Oncol. 2018;8(2):320–2.
28. Indrakusuma R, Zijlmans JL, Jalalzadeh H, Planken RN, Balm R, KoelemayMJW. Psoas muscle area as a prognostic factor for survival in patients withan asymptomatic Infrarenal abdominal aortic aneurysm: a retrospectivecohort study. Eur J Vasc Endovasc Surg. 2018;55(1):83–91.
29. Garg L, Agrawal S, Pew T, Hanzel GS, Abbas AE, Gallagher MJ, et al. Psoasmuscle area as a predictor of outcomes in Transcatheter aortic valveimplantation. Am J Cardiol. 2017;119(3):457–60.
30. Zuckerman J, Ades M, Mullie L, Trnkus A, Morin JF, Langlois Y, et al. Psoasmuscle area and length of stay in older adults undergoing cardiacoperations. Ann Thorac Surg. 2017;103(5):1498–504.
31. Miller BS, Ignatoski KM, Daignault S, Lindland C, Doherty M, Gauger PG, etal. Worsening central sarcopenia and increasing intra-abdominal fatcorrelate with decreased survival in patients with adrenocortical carcinoma.World J Surg. 2012;36(7):1509–16.
32. Mamane S, Mullie L, Piazza N, Martucci G, Morais J, Vigano A, et al. Psoasmuscle area and all-cause mortality after Transcatheter aortic valvereplacement: the Montreal-Munich study. Can J Cardiol. 2016;32(2):177–82.
33. Peng P, Hyder O, Firoozmand A, Kneuertz P, Schulick RD, Huang D, et al.Impact of sarcopenia on outcomes following resection of pancreaticadenocarcinoma. J Gastrointest Surg. 2012;16(8):1478–86.
34. Krell RW, Kaul DR, Martin AR, Englesbe MJ, Sonnenday CJ, Cai S, et al.Association between sarcopenia and the risk of serious infection amongadults undergoing liver transplantation. Liver Transpl. 2013;19(12):1396–402.
35. Smith AB, Deal AM, Yu H, Boyd B, Matthews J, Wallen EM, et al. Sarcopeniaas a predictor of complications and survival following radical cystectomy. JUrol. 2014;191(6):1714–20.
36. Kuroki LM, Mangano M, Allsworth JE, Menias CO, Massad LS, Powell MA, etal. Pre-operative assessment of muscle mass to predict surgicalcomplications and prognosis in patients with endometrial cancer. Ann SurgOncol. 2015;22(3):972–9.
37. Wakabayashi H, Matsushima M, Uwano R, Watanabe N, Oritsu H, Shimizu Y.Skeletal muscle mass is associated with severe dysphagia in cancer patients.J Cachexia Sarcopenia Muscle. 2015;6(4):351–7.
38. Drudi LM, Phung K, Ades M, Zuckerman J, Mullie L, Steinmetz OK, et al.Psoas muscle area predicts all-cause mortality after endovascular and openaortic aneurysm repair. Eur J Vasc Endovasc Surg. 2016;52(6):764–9.
39. Peng PD, van Vledder MG, Tsai S, de Jong MC, Makary M, Ng J, et al. Sarcopenianegatively impacts short-term outcomes in patients undergoing hepaticresection for colorectal liver metastasis. HPB (Oxford). 2011;13(7):439–46.
40. Lee JS, He K, Harbaugh CM, Schaubel DE, Sonnenday CJ, Wang SC, et al.Frailty, core muscle size, and mortality in patients undergoing openabdominal aortic aneurysm repair. J Vasc Surg. 2011;53(4):912–7.
41. Miller AL, Englesbe MJ, Diehl KM, Chan CL, Cron DC, Derstine BA, et al.Preoperative psoas muscle size predicts postoperative delirium in older adultsundergoing surgery: a pilot cohort study. J Am Geriatr Soc. 2017;65(1):e23–4.
42. Paknikar R, Friedman J, Cron D, Deeb GM, Chetcuti S, Grossman PM, et al.Psoas muscle size as a frailty measure for open and transcatheter aorticvalve replacement. J Thorac Cardiovasc Surg. 2016;151(3):745–51.
43. Sheetz KH, Zhao L, Holcombe SA, Wang SC, Reddy RM, Lin J, et al.Decreased core muscle size is associated with worse patient survivalfollowing esophagectomy for cancer. Dis Esophagus. 2013;26(7):716–22.
44. Underwood PW, Cron DC, Terjimanian MN, Wang SC, Englesbe MJ, WaitsSA. Sarcopenia and failure to rescue following liver transplantation. ClinTranspl. 2015;29(12):1076–80.
45. Caram MV, Bellile EL, Englesbe MJ, Terjimanian M, Wang SC, Griggs JJ, et al.Sarcopenia is associated with autologous transplant-related outcomes inpatients with lymphoma. Leuk Lymphoma. 2015;56(10):2855–62.
46. Sabel MS, Lee J, Cai S, Englesbe MJ, Holcombe S, Wang S. Sarcopenia as aprognostic factor among patients with stage III melanoma. Ann Surg Oncol.2011;18(13):3579–85.
47. Hawkins RB, Mehaffey JH, Charles EJ, Kern JA, Lim DS, Teman NR, et al.Psoas Muscle Size Predicts Risk-Adjusted Outcomes After Surgical AorticValve Replacement. Ann Thorac Surg. 2018.
48. Kamiya N, Zhou X, Chen H, Hara T, Hoshi H, Yokoyama R, et al. Automatedrecognition of the psoas major muscles on X-ray CT images. Conf Proc IEEEEng Med Biol Soc. 2009;2009:3557–60.
49. Kamiya N, Zhou X, Chen H, Muramatsu C, Hara T, Yokoyama R, et al.Automated segmentation of psoas major muscle in X-ray CT images by useof a shape model: preliminary study. Radiol Phys Technol. 2012;5(1):5–14.
50. Yamashita M, Kamiya K, Matsunaga A, Kitamura T, Hamazaki N, MatsuzawaR, et al. Prognostic value of psoas muscle area and density in patients whoundergo cardiovascular surgery. Can J Cardiol. 2017;33(12):1652–9.
51. De Amorim BK, Bos SA, Veld J, Lozano-Calderon SA, Torriani M, Bredella MA.Body composition predictors of therapy response in patients with primaryextremity soft tissue sarcomas. Acta Radiol. 2018;59(4):478–84.
52. Locke JE, Carr JJ, Nair S, Terry JG, Reed RD, Smith GD, et al. Abdominal leanmuscle is associated with lower mortality among kidney waitlist candidates.Clin Transplant. 2017 Mar;31:3.
53. Veld J, Vossen JA, De Amorim BK, Halpern EF, Torriani M, Bredella MA. Adiposetissue and muscle attenuation as novel biomarkers predicting mortality inpatients with extremity sarcomas. Eur Radiol. 2016;26(12):4649–55.
54. Zhang P, Peterson M, Su GL, Wang SC. Visceral adiposity is negativelyassociated with bone density and muscle attenuation. Am J Clin Nutr. 2015;101(2):337–43.
55. Torriani M, Hadigan C, Jensen ME, Grinspoon S. Psoas muscle attenuationmeasurement with computed tomography indicates intramuscular fataccumulation in patients with the HIV-lipodystrophy syndrome. J ApplPhysiol (1985). 2003 Sep;95(3):1005–10.
56. DiMartini A, Cruz RJ Jr, Dew MA, Myaskovsky L, Goodpaster B, Fox K, et al.Muscle mass predicts outcomes following liver transplantation. LiverTranspl. 2013;19(11):1172–80.
57. Lee CS, Cron DC, Terjimanian MN, Canvasser LD, Mazurek AA, Vonfoerster E,et al. Dorsal muscle group area and surgical outcomes in livertransplantation. Clin Transpl. 2014;28(10):1092–8.
58. Onuma T, Kamishima T, Shimamura T, Kawamura N, Yamashita K, SutherlandK, et al. Longitudinal CT study of sarcopenia due to hepatic failure afterliving donor liver transplantation. Quant Imaging Med Surg. 2018;8(1):25–31.
59. Canvasser LD, Mazurek AA, Cron DC, Terjimanian MN, Chang ET, Lee CS, etal. Paraspinous muscle as a predictor of surgical outcome. J Surg Res. 2014;192(1):76–81.
60. Yong W, Xu B, Xiuping T, Junfeng Q. Paraspinal muscle segmentation in CTimages using a single atlas. Progress in Informatics and Computing. 2015.https://doi.org/10.1109/PIC.2015.7489839.
61. Fortin M, Omidyeganeh M, Battié MC, Ahmad O, Rivaz H. Evaluation of anautomated thresholding algorithm for the quantification of paraspinalmuscle composition from MRI images. Biomed Eng Online. 2017;16(1):61.
62. Wei Y, Tao X, Xu B, Castelein A. Paraspinal muscle segmentation in CTimages using GSM-based fuzzy C-means clustering. Journal of Computerand Communications. 2014. https://doi.org/10.4236/jcc.2014.29010.
63. Battaglia N V, Mahfouz M R, Johnson M. Semi-Automatic segmentation of thelumbar muscles and gender specific cross-sectional areas (Abstract). 58thAnnual Meeting of the Orthopaedic. Research Society, San Francisco, CA, 2012.
64. Otemuyiwa B, Derstine BA, Zhang P, Wong SL, Sabel MS, Redman BG, et al.Dorsal muscle attenuation may predict failure to respond to Interleukin-2 therapyin metastatic renal cell carcinoma. Acad Radiol. 2017 Sep;24(9):1094–100.
65. Weijs PJ, Looijaard WG, Dekker IM, Stapel SN, Girbes AR, Oudemans-vanStraaten HM, et al. Low skeletal muscle area is a risk factor for mortality inmechanically ventilated critically ill patients. Crit Care. 2014;18(2):R12.
66. Englesbe MJ, Lee JS, He K, Fan L, Schaubel DE, Sheetz KH, et al. Analyticmorphomics, core muscle size, and surgical outcomes. Ann Surg. 2012 Aug;256(2):255–61.
67. Hyunkwang Lee, Fabian M T,Shahein T, Georg F,Julia M, Florian J F,Synho D.Artificial Intelligence Quantifies Muscle on Computed Tomography for BodyMorphometric Analysis. J Digit Imaging. 2017; doi:https://doi.org/10.1007/s10278-017-9988-z
68. Popuri K, Cobzas D, Esfandiari N, Baracos V, Jägersand M. Body compositionassessment in axial CT images using FEM-based automatic segmentation ofskeletal muscle. IEEE Trans Med Imaging. 2016;35(2):512–20.
Mullie and Afilalo BMC Medical Imaging (2019) 19:15 Page 13 of 14
69. Silva de Paula N, de Aguiar BK, Azevedo Aredes M, Villaça Chaves G.Sarcopenia and skeletal muscle quality as predictors of postoperativecomplication and early mortality in gynecologic Cancer. Int J GynecolCancer. 2018;28(2):412–20.
70. Lee S, Paik HC, Haam SJ, Lee CY, Nam KS, Jung HS, et al. Sarcopenia ofthoracic muscle mass is not a risk factor for survival in lung transplantrecipients. J Thorac Dis. 2016 Aug;8(8):2011–7.
71. Derstine BA, Holcombe SA, Goulson RL, Ross BE, Wang NC, Sullivan JA, et al.Quantifying sarcopenia reference values using lumbar and thoracic muscleareas in a healthy population. J Nutr Health Aging. 2017;21(10):180–5.
72. Miller JA, Harris K, Roche C, Dhillon S, Battoo A, Demmy T, et al.Sarcopenia is a predictor of outcomes after lobectomy. J Thorac Dis.2018 Jan;10(1):432–40.
73. Fintelmann FJ, Troschel FM, Mario J, Chretien YR, Knoll SJ, Muniappan A, etal. Thoracic Skeletal Muscle Is Associated With Adverse Outcomes AfterLobectomy for Lung Cancer. Ann Thorac Surg. 2018.
74. Karteek P, Dana C, Martin J, Nina E, Vickie B. Fem-based automaticsegmentation of muscle and fat tissues from thoracic CT images. IEEE TransMed Imaging. 2016;35(2):512–20.
75. Wajchenberg BL. Subcutaneous and visceral adipose tissue: their relation tothe metabolic syndrome. Endocr Rev. 2000;21(6):697–738.
76. Guiu B, Petit JM, Bonnetain F, Ladoire S, Guiu S, Cercueil JP, et al. Visceral fat areais an independent predictive biomarker of outcome after first-line bevacizumab-based treatment in metastatic colorectal cancer. Gut. 2010;59(3):341–7.
77. Ladoire S, Bonnetain F, Gauthier M, Zanetta S, Petit JM, Guiu S, et al. Visceralfat area as a new independent predictive factor of survival in patients withmetastatic renal cell carcinoma treated with antiangiogenic agents.Oncologist. 2011;16(1):71–81.
78. Ryo M, Kishida K, Nakamura T, Yoshizumi T, Funahashi T, Shimomura I.Clinical significance of visceral adiposity assessed by computedtomography: a Japanese perspective. World J Radiol. 2014;6(7):409–16.
79. Cakir H, Heus C, van der Ploeg TJ, Houdijk AP. Visceral obesity determinedby CT scan and outcomes after colorectal surgery; a systematic review andmeta-analysis. Int J Color Dis. 2015;30(7):875–82.
80. Demerath EW, Ritter KJ, Couch WA, Rogers NL, Moreno GM, Choh A, et al.Validity of a new automated software program for visceral adipose tissueestimation. Int J Obes. 2007 Feb;31(2):285–91.
81. Amol P, Alok NB, Ioannis AK. Application of computer vision. Appl CompVis. 2005. https://doi.org/10.1109/ACVMOT.2005.31.
82. Nemoto M, Yeernuer T, Masutani Y, Nomura Y, Hanaoka S, Miki S, et al.Development of automatic visceral fat volume calculation software for CTvolume data. J Obes. 2014;2014:495084.
83. Kim YJ, Lee SH, Kim TY, Park JY, Choi SH, Kim KG. Body fat assessmentmethod using CT images with separation mask algorithm. J Digit Imaging.2013;26(2):155–62.
84. Zhao B, Colville J, Kalaigian J, Curran S, Jiang L, Kijewski P, et al. Automatedquantification of body fat distribution on volumetric computedtomography. J Comput Assist Tomogr. 2006;30(5):777–83.
85. Pan-Fu K, Kuo Y-L, Po-Tsun L, Wei-Chen C, Ya-Ling H, Chiun-li C. Fullyautomatic abdominal fat segmentation system from a low resolution CTimage. J Comput. 2015;36(2):65–77.
86. Lee SJ, Liu J, Yao J, Kanarek A, Summers RM, Pickhardt PJ. Fully automatedsegmentation and quantification of visceral and subcutaneous fat atabdominal CT: application to a longitudinal adult screening cohort. Br JRadiol. 2018;28:20170968.
87. Rosenquist KJ, Pedley A, Massaro JM, Therkelsen KE, Murabito JM, HoffmannU, et al. Visceral and subcutaneous fat quality and cardiometabolic risk.JACC Cardiovasc Imaging. 2013;6(7):762–71.
88. Shah RV, Allison MA, Lima JA, Abbasi SA, Eisman A, Lai C, et al. Abdominalfat radiodensity, quantity and cardiometabolic risk: the multi-ethnic study ofatherosclerosis. Nutr Metab Cardiovasc Dis. 2016;26(2):114–22.
89. Therkelsen KE, Pedley A, Rosenquist KJ, Hoffmann U, Massaro JM, MurabitoJM, et al. Adipose tissue attenuation as a marker of adipose tissue quality:associations with six-year changes in body weight. Obesity (Silver Spring).2016;24(2):499–505.
90. Yeoh AJ, Pedley A, Rosenquist KJ, Hoffmann U, Fox CS. The associationbetween subcutaneous fat density and the propensity to store fat viscerally.J Clin Endocrinol Metab. 2015;100(8):E1056–64.
91. Murabito JM, Pedley A, Massaro JM, Vasan RS, Esliger D, Blease SJ, et al.Moderate-to-vigorous physical activity with accelerometry is associated withvisceral adipose tissue in adults. J Am Heart Assoc. 2015;4(3):e001379.
92. Rosenquist KJ, Massaro JM, Pedley A, Long MT, Kreger BE, Vasan RS, et al.Fat quality and incident cardiovascular disease, all-cause mortality, andcancer mortality. J Clin Endocrinol Metab. 2015;100(1):227–34.
93. Alvey NJ, Pedley A, Rosenquist KJ, Massaro JM, O'Donnell CJ, Hoffmann U,et al. Association of fat density with subclinical atherosclerosis. J Am HeartAssoc. 2014;3:4.
94. Yong HS, Kim EJ, Seo HS, Kang EY, Kim YK, Woo OH, et al. Pericardial fat ismore abundant in patients with coronary atherosclerosis and even in thenon-obese patients: evaluation with cardiac CT angiography. Int JCardiovasc Imaging. 2010;26(Suppl 1):53–62.
95. Jang HC, Lee HK, Lee H, Cha JG, Kim YS, Cho JH. Analyzing correlationbetween epicardial fat area and metabolic syndrome risk factor by usinglow-dose lung CT. Pak J Med Sci. 2015;31(5):1207–12.
96. Song DK, Hong YS, Lee H, Oh JY, Sung YA, Kim Y. Increased Epicardialadipose tissue thickness in type 2 diabetes mellitus and obesity. DiabetesMetab J. 2015;39(5):405–13.
97. Balci A, Celik M, Balci DD, Karazincir S, Yonden Z, Korkmaz I, et al. Patientswith psoriasis have an increased amount of epicardial fat tissue. Clin ExpDermatol. 2014;39(2):123–8.
98. Dagvasumberel M, Shimabukuro M, Nishiuchi T, Ueno J, Takao S, FukudaD, et al. Gender disparities in the association between epicardial adiposetissue volume and coronary atherosclerosis: a 3-dimensional cardiaccomputed tomography imaging study in Japanese subjects. CardiovascDiabetol. 2012;11:106.
99. Oyama N, Goto D, Ito YM, Ishimori N, Mimura R, Furumoto T, et al. Single-slice epicardial fat area measurement: do we need to measure the totalepicardial fat volume? Jpn J Radiol. 2011;29(2):104–9.
100. Maimaituxun G, Shimabukuro M, Fukuda D, Yagi S, Hirata Y, Iwase T, et al. Localthickness of Epicardial adipose tissue surrounding the left anterior descendingartery is a simple predictor of coronary artery disease - new prediction modelin combination with Framingham risk score. Circ J. 2018;21.
101. Norlén A, Alvén J, Molnar D, Enqvist O, Norrlund RR, Brandberg J, et al.Automatic pericardium segmentation and quantification of epicardial fatfrom computed tomography angiography, 034003. J Med Imaging(Bellingham). 2016;3(3).
102. Rodrigues EO, Morais FFC, Morais NA, Coni LS, Neto LV, Conci A. A novelapproach for the automated segmentation and volume quantification ofcardiac fats on computed tomography. Comput Methods Prog Biomed.2016;123:109–28.
103. Coppini G, Favilla R, Marraccini P, Moroni D, Pieri G. Quantification ofEpicardial fat by cardiac CT imaging. Open Med Inform J. 2010;4:126–35.
104. Vladimir Z, Lidija K, Lazar V, Branislav P, Marko J, Ratko O, Nebojsa M.Semiautomatic Epicardial fat segmentation based on fuzzy c-meansclustering and geometric ellipse fitting. Journal of Healthcare Engineering.2017. https://doi.org/10.1155/2017/5817970.
105. Bandekar AN, Naghavi M, Kakadiaris IA. Automated pericardial fatquantification in CT data. Conf Proc IEEE Eng Med Biol Soc. 2006;1:932–5.
106. Abazida O. H Saqqaab. Epicardial fat quality effect on subclinicalatherosclerosis. J Saudi Heart Assoc. 2016;28(3):129–220.
Mullie and Afilalo BMC Medical Imaging (2019) 19:15 Page 14 of 14
Related Documents
![PEP Web - The Analytic Third: Working with Intersubjective ... … · analytic third'. This third subjectivity, the intersubjective analytic third Green's [1975] 'analytic object'),](https://static.cupdf.com/doc/110x72/6099619e2d4b51336024f694/pep-web-the-analytic-third-working-with-intersubjective-analytic-third.jpg)