Core fucosylation and α2-3 sialylation in serum N-glycome is significantly increased in prostate cancer comparing to benign prostate hyperplasia Radka Saldova 2 , Yue Fan 3,4 , John M Fitzpatrick 3,5 , R William G Watson 3,4 , and Pauline M Rudd 1,2 2 Dublin-Oxford NIBRT Glycobiology Laboratory, NIBRT, Conway Institute; 3 UCD School of Medicine and Medical Science; 4 UCD Conway Institute of Biomolecular and Biomolecular Research, University College Dublin, Belfield, Dublin 4, Ireland; and 5 Mater Misericordiae University Hospital, Dublin, Ireland Received on May 13, 2010; revised on July 28, 2010; accepted on September 15, 2010 One of the most urgent requirements in prostate cancer diagnosis is the development of a blood-based test which would be able to distinguish prostate cancer from benign prostate hyperplasia (BPH). Previously published results found a significant difference between specific glycan levels in patients with advanced prostate cancer and healthy controls. N-Glycans from the whole serum glycoproteins were measured using our fully quantitative high-through- put N-glycan analysis in combination with exoglycosidase digestions in sera from 13 BPH and 34 prostate cancer samples (17 Gleason score 5 and 17 Gleason score 7). The levels of core-fucosylated biantennary glycans and α2-3- linked sialic acids were significantly increased in prostate cancer patients compared with patients with BPH. Triantennary trigalactosylated glycans and tetraantennary tetrasialylated glycans with outer arm fucose were signifi- cantly decreased, and tetraantennary tetrasialylated glycans increased in Gleason 7 compared with Gleason 5. All these glycans can distinguish prostate cancer patients from BPH or Gleason 7 from Gleason 5 prostate cancer patients better than the current clinical test, prostate- specific antigen; therefore, their measurement may provide a new noninvasive approach to diagnose prostate cancer. However, additional validation studies would need to be carried out to further support this finding. Decreases in tri- antennary trigalactosylated glycans and/or bisected core- fucosylated biantennary monosialylated glycans and increases in tetraantennary tetrasialylated glycans corre- late with perineural invasion, which could further help to diagnose tumor spread and predict patients’ survival. Keywords: BPH/N-linked glycans/perineural invasion/prostate cancer/serum biomarkers Introduction Prostate cancer is the most common cancer diagnosed in men in Europe (Ferlay et al. 2010) and United States (Jemal et al. 2009). Prostate-specific antigen (PSA) is currently used for the detection of prostate cancer, but it lacks sensitivity and speci- ficity (Nogueira et al. 2010). Many new biomarkers have recently emerged, such as kallikrein 2, urokinase-type plasmi- nogen activator receptor, prostate-specific membrane antigen, early prostate cancer antigen, PCA3, α-methylacyl-CoA race- mase and glutathione S-transferase-π hypermethylation, but only a few have shown valuable clinical value (Nogueira et al. 2010). Novel markers with high sensitivity and specificity and preferably noninvasive (from body fluids as serum, urine etc.) are needed. The outcome of prostate cancer patients is signifi- cantly correlated with the Gleason score. Patients with Gleason score 7 (high-grade disease) are more commonly found to have advanced disease and thus the likelihood of relapse is higher than patient with low-grade prostate cancer (Fanning et al. 2010). The transrectal ultrasound-guided biopsy suffers from the randomness in the sampling process, and up-grading is not uncommon after the removal of the prostate gland (Fanning et al. 2010). The ability to reliably predict low and high Gleason-grade disease using noninvasive biomarkers will provide valuable information for prostate cancer prognosis. Glycosylation is the most common post-translation modifi- cation of secreted proteins, and alterations in cellular pathways can affect glycan processing. These glycosylation changes in the serum glycome and on individual glycoproteins could provide promising biomarkers for prostate cancer (Arnold et al. 2008). The aim of this study was to investigate whether differential glycosylation patterns could distinguish prostate cancer from benign prostate hyperplasia (BPH), which is a significant clinically relevant question. We have analyzed 13 BPH and 34 prostate cancer samples (17 Gleason score 5 and 17 Gleason score 7) using our fully quantitative high-throughput N-glycan analysis based on high-performance liquid chrom- atography (HPLC) separation of released glycans from both the serum. The serum N-glycome has previously been charac- terized to contain 117 glycans (Royle et al. 2008), and in this study, we have identified significant changes in the serum N-glycome of prostate cancer patients. 1 To whom correspondence should be addressed: Tel: +353-1716-6728; Fax: +353-1716-6950; E-mail: [email protected] Glycobiology vol. 21 no. 2 pp. 195–205, 2011 doi:10.1093/glycob/cwq147 Advance Access publication on September 22, 2010 © The Author 2010. Published by Oxford University Press. All rights reserved. For permissions, please e-mail: [email protected] 195 at University College Dublin on January 6, 2011 glycob.oxfordjournals.org Downloaded from

Welcome message from author
This document is posted to help you gain knowledge. Please leave a comment to let me know what you think about it! Share it to your friends and learn new things together.
Transcript

Core fucosylation and α2-3 sialylation in serum N-glycomeis significantly increased in prostate cancer comparingto benign prostate hyperplasia
Radka Saldova2, Yue Fan3,4, John M Fitzpatrick3,5,R William GWatson3,4, and Pauline MRudd1,2
2Dublin-Oxford NIBRT Glycobiology Laboratory, NIBRT, Conway Institute;3UCD School of Medicine and Medical Science; 4UCD Conway Institute ofBiomolecular and Biomolecular Research, University College Dublin,Belfield, Dublin 4, Ireland; and 5Mater Misericordiae University Hospital,Dublin, Ireland
Received on May 13, 2010; revised on July 28, 2010; accepted onSeptember 15, 2010
One of the most urgent requirements in prostate cancerdiagnosis is the development of a blood-based test whichwould be able to distinguish prostate cancer from benignprostate hyperplasia (BPH). Previously published resultsfound a significant difference between specific glycan levelsin patients with advanced prostate cancer and healthycontrols. N-Glycans from the whole serum glycoproteinswere measured using our fully quantitative high-through-put N-glycan analysis in combination with exoglycosidasedigestions in sera from 13 BPH and 34 prostate cancersamples (17 Gleason score 5 and 17 Gleason score 7). Thelevels of core-fucosylated biantennary glycans and α2-3-linked sialic acids were significantly increased in prostatecancer patients compared with patients with BPH.Triantennary trigalactosylated glycans and tetraantennarytetrasialylated glycans with outer arm fucose were signifi-cantly decreased, and tetraantennary tetrasialylatedglycans increased in Gleason 7 compared with Gleason5. All these glycans can distinguish prostate cancer patientsfrom BPH or Gleason 7 from Gleason 5 prostate cancerpatients better than the current clinical test, prostate-specific antigen; therefore, their measurement may providea new noninvasive approach to diagnose prostate cancer.However, additional validation studies would need to becarried out to further support this finding. Decreases in tri-antennary trigalactosylated glycans and/or bisected core-fucosylated biantennary monosialylated glycans andincreases in tetraantennary tetrasialylated glycans corre-late with perineural invasion, which could further help todiagnose tumor spread and predict patients’ survival.
Keywords: BPH/N-linked glycans/perineural invasion/prostatecancer/serum biomarkers
Introduction
Prostate cancer is the most common cancer diagnosed in menin Europe (Ferlay et al. 2010) and United States (Jemal et al.2009). Prostate-specific antigen (PSA) is currently used for thedetection of prostate cancer, but it lacks sensitivity and speci-ficity (Nogueira et al. 2010). Many new biomarkers haverecently emerged, such as kallikrein 2, urokinase-type plasmi-nogen activator receptor, prostate-specific membrane antigen,early prostate cancer antigen, PCA3, α-methylacyl-CoA race-mase and glutathione S-transferase-π hypermethylation, butonly a few have shown valuable clinical value (Nogueira et al.2010). Novel markers with high sensitivity and specificity andpreferably noninvasive (from body fluids as serum, urine etc.)are needed. The outcome of prostate cancer patients is signifi-cantly correlated with the Gleason score. Patients with Gleasonscore 7 (high-grade disease) are more commonly found to haveadvanced disease and thus the likelihood of relapse is higherthan patient with low-grade prostate cancer (Fanning et al.2010). The transrectal ultrasound-guided biopsy suffers fromthe randomness in the sampling process, and up-grading is notuncommon after the removal of the prostate gland (Fanninget al. 2010). The ability to reliably predict low and highGleason-grade disease using noninvasive biomarkers willprovide valuable information for prostate cancer prognosis.Glycosylation is the most common post-translation modifi-
cation of secreted proteins, and alterations in cellular pathwayscan affect glycan processing. These glycosylation changes in theserum glycome and on individual glycoproteins could providepromising biomarkers for prostate cancer (Arnold et al. 2008).The aim of this study was to investigate whether differential
glycosylation patterns could distinguish prostate cancer frombenign prostate hyperplasia (BPH), which is a significantclinically relevant question. We have analyzed 13 BPH and34 prostate cancer samples (17 Gleason score 5 and 17Gleason score 7) using our fully quantitative high-throughputN-glycan analysis based on high-performance liquid chrom-atography (HPLC) separation of released glycans from boththe serum. The serum N-glycome has previously been charac-terized to contain 117 glycans (Royle et al. 2008), and in thisstudy, we have identified significant changes in the serumN-glycome of prostate cancer patients.
1To whom correspondence should be addressed: Tel: +353-1716-6728; Fax:+353-1716-6950; E-mail: [email protected]
Glycobiology vol. 21 no. 2 pp. 195–205, 2011doi:10.1093/glycob/cwq147Advance Access publication on September 22, 2010
© The Author 2010. Published by Oxford University Press. All rights reserved. For permissions, please e-mail: [email protected] 195
at University C
ollege Dublin on January 6, 2011
glycob.oxfordjournals.orgD
ownloaded from

Results
Total serum N-glycans from 13 BPH and 34 prostate cancersamples (17 Gleason score 5 and 17 Gleason score 7; Table I)were analyzed by normal phase (NP)- and weak anionexchange (WAX)-HPLC, combined with exoglycosidasedigestions with structural assignments made using databasematching (GlycoBase; http://glycobase.nibrt.ie:8080/database/show_nibrt.action/) and Royle et al. (2008). In this approach,glycans are labeled stoichiometrically in a structurallyunbiased manner with 2-aminobenzamide (2AB), allowingaccurate quantitative measurements and relative comparisonbetween samples (Royle et al. 2008). This method enablesthe analysis of glycan isoforms based on sequence andlinkage (e.g. core α1-6 fucosylation can be distinguished from
α1-3-linked outer arm fucosylation). Glycan size and linkageresult in a specific elution position that can be converted toglucose units (GUs) using a dextran hydrolysate standardladder. GUs are comparable between HPLC platformsand make interpretation easier as they can be used in conjunc-tion with GlycoBase, a web-based GU database collection(http:/glycobase.nibrt.ie:8080/database/show_nibrt.action).
Significant changes in whole serum N-glycome in prostatecancerUsing NP-HPLC, serum N-glycans were separated into 24peaks (Figure 1) and each peak was examined to see if it sig-nificantly separates BPH from prostate cancer patients or dis-tinguishes the Gleason score. Peaks 10, containing mostly
Table I. Characteristics of BPH and prostate cancer patients used in this study
Diagnosis ECE Margins PIN Volume Lymph nodes Seminal vesicles Perineuralinvasion
% glandinvolved
Preop PSA AGE DRE
BPH 13.2 66BPH 3.7 62BPH 5 83BPH 0.5 55BPH 16.6 71BPH 4.2 51BPH 2 76BPH 13 68BPH 6.3 71BPH NABPH 3.9 79BPH 8.4 75BPH 14 77Gleason 5 Neg Neg No 56 Neg Neg Neg 14.1 56 PosGleason 5 Neg Neg No 42 Neg Neg Neg 50 7.5 69 NegGleason 5 Neg Neg No 39 Neg Neg Neg 5 4.4 65 NegGleason 5 Neg Pos No 37 Neg Neg Neg 20 11 59Gleason 5 Neg Pos Yes 30 Neg Neg Neg 3.6 50Gleason 5 Neg Pos No 64 Neg Neg Neg 10 10.8 69Gleason 5 Neg Pos No Neg Neg Neg 5 4.5 53Gleason 5 Neg Neg No 63 Neg Neg Neg 8.73 65 NegGleason 5 Pos Neg No 63 Neg Neg Neg 15.7 67 NegGleason 5a Neg Neg No 53 Neg Neg Neg 60 6.5 67 NegGleason 5 Pos Neg No 52 Pos Neg Neg 5 10.7 56 PosGleason 5 Neg Neg No 48 Neg Neg Neg 5 8.7 61 NegGleason 5 Neg Neg No 45 Neg Neg Neg 5 9.8 57 NegGleason 5 Neg Neg No Neg Neg Pos 30 11.1 59Gleason 5 Neg Neg No Neg Neg Pos 60 4.1 59 NegGleason 5 Pos Pos No 250 Neg Neg Neg 7 58 NegGleason 5 Neg Pos No Neg Neg Neg 5 6 56 NegGleason 7 Pos Pos No 26 Neg Neg Pos 5 20 60 PosGleason 7 Neg Pos No 56 Neg Neg Neg 20 8.7 60Gleason 7 Neg Neg Yes 47 Neg Neg Neg 10 6.4 61Gleason 7 Neg Neg No 38 Neg Neg Neg 5 6.24 66 NegGleason 7 Pos Pos No Neg Neg Pos 10 6.1 66Gleason 7 Pos Pos Yes 46 Neg Pos Pos 80 6.4 68 PosGleason 7 Neg Neg No 35 Neg Neg Neg 30 7 64 NegGleason 7 Neg Urethral margin No 44 Neg Pos Neg 20 6.5 70 NegGleason 7 Pos Neg No 19 Neg Neg Pos 40 5.3Gleason 7 Pos Pos Yes Neg Pos Pos 30 8.9 48 PosGleason 7 Pos Neg No Neg Neg Pos 50 13.6 69Gleason 7 Pos Neg No Neg Neg Neg 8.8 56 NegGleason 7 Neg Neg No Neg Neg Neg 10 15.5 65 PosGleason 7 Pos Neg No Neg Neg Pos 15 14.9 67 NegGleason 7 Pos Neg No Neg Pos Pos 50 17.1 63 NegGleason 7 Neg Neg No Neg Pos Neg 30 11.5 66 NegGleason 7 Neg Pos No Neg Pos Neg 15 59 Neg
aCaecal carcinoma and metastatic to liver.
R Saldova et al.
196
at University C
ollege Dublin on January 6, 2011
glycob.oxfordjournals.orgD
ownloaded from

core-fucosylated biantennary glycans FA2G2, FA2(6)G1S1 andFA2(6)BG1S1, was found to be significantly increased in pros-tate cancer patients (Figure 2A, Table II). Peaks 15 (FA2BG2S1and A3G3), 19 (A3G3S2), 21 (A3G3S3) and 24 (A4G4F1S4)are significantly decreased, and peak 23 (A4G4S4) is signifi-cantly increased in Gleason 7 comparing with Gleason 5 pros-tate cancer patients (Figure 2B, Table II); therefore, there is adecrease in triantennary trigalactosylated glycans and in tetraan-tennary tetrasialylated outer arm-fucosylated glycans andincrease in tetraantennary tetrasialylated glycans in Gleason 7compared with Gleason 5 prostate cancer patients.Using WAX-HPLC, all serum N-glycans were separated
according to the number of sialic acids into mono-, di-, tri-and tetrasialylated glycans, quantified and compared betweenthe BPH and prostate cancer patient groups. No significantdifferences between BPH and prostate cancer patients werefound (data not shown).To investigate sialic acid linkage distribution in BPH and
prostate cancer sera, N-glycan pool was digested withStreptococcus pneumoniae sialidase (NAN1), which digestsα2-3-linked sialic only. N-Glycans were separated into 15peaks (Figure 1), and each peak was examined to see if itsignificantly separates BPH from prostate cancer patients ordistinguishes the Gleason score. Peaks 1 (A2) and 5 (A2G2)were significantly increased and peaks 7 [A2G2S(6)1,A2BG2S(6)1], 9 [A3G3, FA2BG2S(6)1], 10 [A2G2S(6,6)2,A2BG2S(6,6)2] and 13 [A3G3S(6,6)2] significantlydecreased in prostate cancer patients compared with BPH(Figure 2C, Table II). Peaks 8 [FA2G2S(6)1], 9 [A3G3,
FA2BG2S(6)1] and 10 [A2G2S(6,6)2, A2BG2S(6,6)2] weresignificantly different between BPH and Gleason scores(Figure 2D, Table II). The most abundant glycan in peak 5,which is increased in prostate cancer, is A2G2 (Table II), thisis a digestion product of mono- and disialylated biantennaryglycans with 1 or 2 sialic acid linked α2-3. Peaks 7, 8, 9, 10and 13 decreased in prostate cancer (Table II) and are diges-tion products of glycans with 1 α2-3-linked sialic acid orglycans which do not digest with NAN1; therefore, theirsialic acid is linked α2-6. The glycans containing α2-6-linkedsialic acid further digest with Arthrobacter ureafaciens siali-dase (ABS), which digests all sialic acids (Figure 1). Theseresults lead to the conclusion that there is a significantincrease in α2-3-linked sialic in prostate cancer serum proteinscomparing with BPH. No significant alterations in sialic acidlinkage were found between Gleason scores.
Comparison of the glycan markers with the gold standardPSAAfter the major glycosylation changes in the serum glycome wereidentified, the potential glycan markers and their combinationswere compared with the gold standard PSA. We first comparedthe markers in order to distinguish BPH from prostate cancer. Allpeaks (peak 10 from undigested profile and peaks 1, 5, 7, 9, 10and 13 from NAN1-digested profiles) significantly differentiatedprostate cancer patients from BPH patients, with improved areaunder the curve (AUC) values than PSA itself (Figure 3A). Thebest AUC was given by peak 5 (A2G2) from the NAN1-digestedprofile. Second, we investigated the ability to distinguish Gleason
Fig. 1. Typical NP-HPLC profiles of undigested, NAN1- and ABS-digested serum N-glycome from BPH and prostate cancer patients. N-Glycans fromundigested glycome were separated into 24 peaks, NAN1-digested glycome into 15 peaks (BPH profiles). Significantly altered peaks between BPH and prostatecancer sera are numbered in black and significantly altered peaks between Gleason 5 and Gleason 7 are numbered in grey in the prostate cancer profiles. Allstructures in each peak have been fully characterized previously by Royle et al. (2008).
Specific changes in prostate cancer serum N-glycome
197
at University C
ollege Dublin on January 6, 2011
glycob.oxfordjournals.orgD
ownloaded from
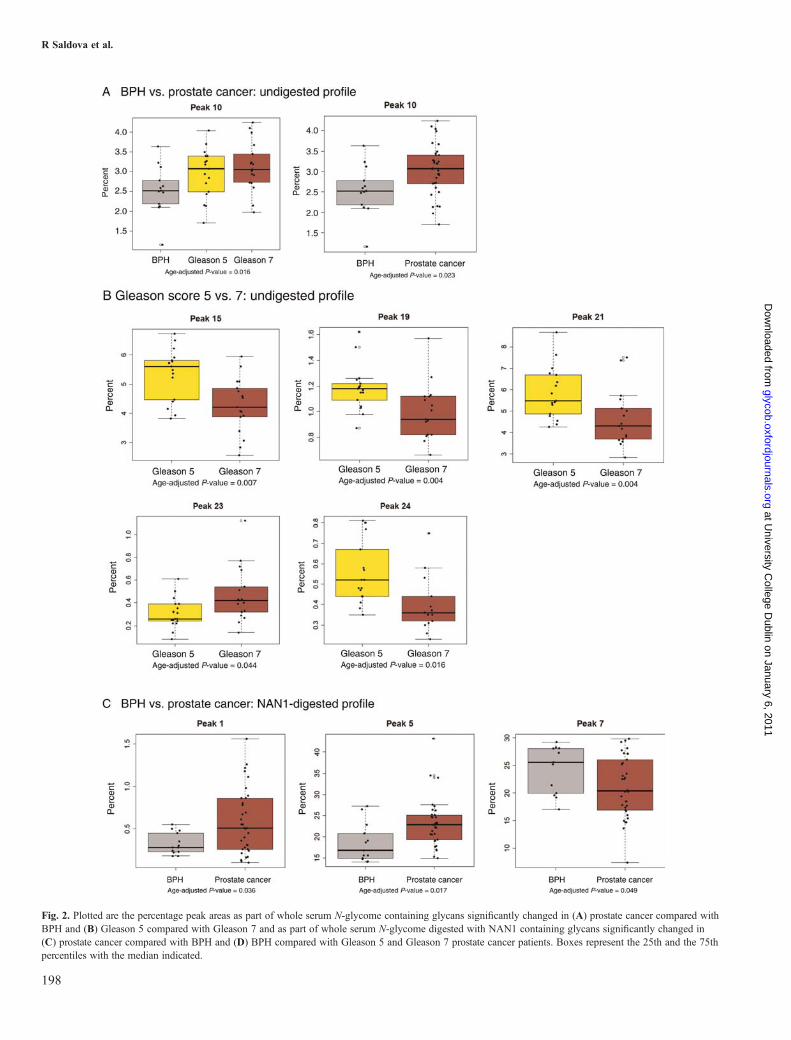
Fig. 2. Plotted are the percentage peak areas as part of whole serum N-glycome containing glycans significantly changed in (A) prostate cancer compared withBPH and (B) Gleason 5 compared with Gleason 7 and as part of whole serum N-glycome digested with NAN1 containing glycans significantly changed in(C) prostate cancer compared with BPH and (D) BPH compared with Gleason 5 and Gleason 7 prostate cancer patients. Boxes represent the 25th and the 75thpercentiles with the median indicated.
R Saldova et al.
198
at University C
ollege Dublin on January 6, 2011
glycob.oxfordjournals.orgD
ownloaded from

scores. We compared peaks 15, 19, 21, 23 and 24 from the undi-gested profile, which significantly separate Gleason 5 and 7, withPSA. All AUCs for these peaks preformed better then PSA, withthe combination of peaks 15 (FA2BG2S1 and A3G3) and 21(A3G3S3; Figure 3B) showing the best separation.
Clinical data correlationsWe next undertook to investigate the ability of the peaks todistinguish between organ- and nonorgan-confined diseases,where extracapsular extension (ECE), prostatic intraepithelialneoplasia (PIN), lymph node and seminal vesicles involve-ment are important factors (Makarov et al. 2007). No signifi-cant correlations existed to distinguish organ-confined diseasefrom nonorgan-confined disease. This could be due to lowpatient numbers in these groups.However, we did find a significant increase in peak 23
(A4G4S4) and decrease in peak 15 (FA2BG2S1, A3G3) inpatients with positive perineural invasion (PNI; Figure 4A,Table III). This would indicate a decrease in triantennary tri-galactosylated glycans and/or bisected core-fucosylated bian-tennary monosialylated glycans and increase in tetraantennarytetrasialylated glycans. The AUC values for PNI are includedin Figure 4B.
DiscussionIncreases in core fucosylation and α2-3 linkage of sialicacid is consistent with altered fucosylation and sialylationpathways in prostate cancerThe most significant changes we found in the prostate cancerserum glycomes were increases in core fucosylation and
α2-3-linked sialic acid. All our results were normalized forage, as it is known to influence glycosylation (Knezevic et al.2009), especially core-fucosylated, nongalactosylated, digalac-tosylated and disialylated biantennary glycans were found tobe age-dependent (Knezevic et al. 2010).Core fucosylation has been shown to be altered in cancer
(Peracaula et al. 2008). Kyselova et al. (2008) describes a signifi-cant increase in fucosylation in 24 prostate cancer patient sera vs.10 healthy control males. However, there was no comparisonwith benign samples in this study. Decreases in core fucosylationhave been found on the PSA protein isolated from cancer patientserum comparing with seminal plasma PSA from healthy indi-vidual (Tabares et al. 2006). The change in core fucosylationmay reflect changes in fucosylation pathways [levels or activityof α1-6 fucosyltransferase (FUT8) or availability of GDP-L-fucose as a nucleotide donor]. FUT8 was found to be overex-pressed in thyroid carcinoma tissue and linked directly to tumorsize and lymph-node mestastasis, but was decreased in anaplasticcarcinoma (undifferentiated with poor prognosis; Ito et al. 2003).High FUT8 expression increases fucosylation on the epidermalgrowth factor receptor (EGFR), which is often highly expressedin cancers and this expression correlate with poor prognosis(Matsumoto et al. 2008). In addition, increased fucosylation onEGFR promotes EGF-mediated cellular growth and decreasessensitivity to tyrosin kinase inhibitors, which target EGFR andexhibit antitumor activity (Matsumoto et al. 2008). FUT8 regu-lates the expression of E-cadherin which is upregulated in cancerand cell–cell adhesion, suggesting that core fucosylation couldregulate metastatic potential of cancer cells (Osumi et al. 2009).High levels of fucosylation in hepatocellular carcinoma is predo-minantly dependent on increased expression of GDP-4-keto-6-
Fig. 2. (Continued)
Specific changes in prostate cancer serum N-glycome
199
at University C
ollege Dublin on January 6, 2011
glycob.oxfordjournals.orgD
ownloaded from

Table II. Significant glycosylation changes in BPH and prostate cancer patients
Peak IDa Predominant N-glycansb Median % N-glycan Age-adjusted P-valuec
Abbreviationsd Structurese BPH(n = 13)
Prostate cancer patients BPH andGleason 5and 7
BPH andprostatecancer
Gleason5 and 7
Gleason 5(n = 17)
Gleason 7(n = 17)
Undigested profilePeak 10 FA2G2, FA2(6)G1S1, FA2(6)BG1S1 2.52 3.08 3.06 0.016 0.023 0.518
Peak 15 FA2BG2S1, A3G3 4.38 5.60 4.21 0.611 0.263 0.007
Peak 19 A3G3S2 1.10 1.18 0.94 0.340 0.548 0.004
Peak 21 A3G3S3 5.43 5.48 4.38 0.384 0.600 0.006
Peak 23 A4G4S4 0.39 0.26 0.42 0.366 0.654 0.044
Peak 24 A4F1G4S4 0.42 0.52 0.36 0.442 0.412 0.002
NAN1 digestPeak 1 A2 0.28 0.51 0.55 0.065 0.036 0.871
Peak 5 A2G2 16.78 22.81 22.78 0.199 0.017 0.186
Peak 7 A2G2S(6)1, A2BG2S(6)1 25.58 20.20 22.50 0.349 0.049 0.183
Continued
R Saldova et al.
200
at University C
ollege Dublin on January 6, 2011
glycob.oxfordjournals.orgD
ownloaded from

deoxymannose-3,5-epimerase-4-reductase followed by increasesin GDP-L-fucose, substrate for fucosyltransferases, but also onenhancement in FUT8 expression (Noda et al. 2003). Thesereports indicate that core fucosylation plays an important role incancer development and are in agreement with our results.The increases in α2-3-linked sialic acid on total serum glyco-
proteins are consistent with the work of Ohyama et al. Theyreported an increase in α2-3-linked sialic acid in serum PSAfrom prostate cancer patients compared with BPH (Ohyamaet al. 2004) using Maackia amurensis lectin which recognizesα2-3 sialic acid. Increases in α2-3 sialic acid on PSA in prostatecancer patients compared with control were also observed in ourrecent study (Sarrats et al. 2010). Increases in α2-3 sialic acidcould link to increased expression of α2-3 sialyltransferases(ST3Gal IV and VI) that are important for SLex expression(Holmes et al. 1986). We have not seen increased expression ofSLex in prostate cancer patients compared with BPH patients,which is probably due to the fact that SLex is not only increased
in cancer, but also in chronic inflammation (Arnold et al. 2008),which occurs both in BPH and prostate cancer patients.
Altered glycosylation in Gleason stages is consistent withclinical dataThe outcome of prostate cancer patients is significantly corre-lated with the Gleason score. Patients with Gleason score 7(high-grade disease) is more commonly found to haveadvanced disease, and thus, the likelihood of relapse is higherthan patient with low-grade prostate cancer (Fanning et al.2010). We found a decrease in triantennary trigalactosylatedglycans and in tetraantennary tetrasialylated outer arm-fucosylated glycans and increase in tetraantennary tetrasialy-lated glycans in Gleason 7 compared with Gleason 5 prostatecancer patients. Using these changes, we were able to predictthe Gleason score in higher specificity and sensitivity thanPSA, which provides valuable information for prostate cancerprognosis.
Table II. (Continued)
Peak IDa Predominant N-glycansb Median % N-glycan Age-adjusted P-valuec
Abbreviationsd Structurese BPH(n = 13)
Prostate cancer patients BPH andGleason 5and 7
BPH andprostatecancer
Gleason5 and 7
Gleason 5(n = 17)
Gleason 7(n = 17)
Peak 8 FA2G2S(6)1 7.06 6.23 5.91 0.042 0.074 0.362
Peak 9 A3G3, FA2BG2S(6)1 1.55 1.01 0.99 0.017 0.021 0.624
Peak 10 A2G2S(6,6)2, A2BG2S(6,6)2 6.15 3.39 2.56 0.049 0.017 0.878
Peak 13 A3G3S(6,6)2 4.34 2.32 2.11 0.100 0.031 0.791
aPeak ID relates to Figure 1.bThe most abundant glycans in each peak are listed. Detailed N-glycan composition of human serum is described in Royle et al. (2008).cLinear regression model was carried out on the following groups to see if there are significant differences based on N-glycosylation. All 24 peaks fromundigested profiles and 15 from NAN1-digested profiles were tested. Only peaks that were significant (P < 0.05, in bold) in at least one comparison are listed.dStructure abbreviations: All N-glycans have two core GlcNAcs and a trimannosyl core; F at the start of the abbreviation indicates a core fucose linked α1-6 tothe core GlcNAc; A(y)a, represents the number a of antenna (GlcNAc) on the trimannosyl core linked to the α1-y mannose arm; B, bisecting GlcNAc linkedβ1-4 to β1-4 core mannose; Fb after Aa, represents the number b of fucose linked α1-3 to antenna GlcNAc; Gc, represents the number c of galactose on antenna;S(z)d, represents number d of sialic acids linked α2-z to the galactose.eSymbol representation of glycans in as follows: GlcNAc, filled square; mannose, open circle; galactose, open diamond; fucose, diamond with a dot inside; betalinkage, solid line; alpha linkage, dotted line; 1-4 linkage, horizontal line; 1-3 linkage, (/); 1-2 linkage, vertical line; and 1-6 linkage, (\).
Specific changes in prostate cancer serum N-glycome
201
at University C
ollege Dublin on January 6, 2011
glycob.oxfordjournals.orgD
ownloaded from

Afterwards, we attempted to correlate these glycosylationchanges with clinical data. Organ-confined prostate cancer isdefined as disease with no evidence of ECE, adjacent lymphnode or seminal vesicle involvement (Makarov et al. 2007).The selection of the most appropriate treatment plan is depen-dent on the identification of the grade of disease: if the canceris localized or organ-confined, cure by radical prostatectomyis possible. However, patients with disease that has progressedbeyond the capsule of the gland will not benefit from surgery.In this current study, due to the limited patient sample avail-ability, the numbers of patients with or without lymph node,PIN and seminal vesicles invasion were unbalanced; therefore,we are not able to draw any conclusions on organ-confined ornonorgan-confined disease.However, we did find significant decreases in triantennary
trigalactosylated glycans and/or bisected core-fucosylatedbiantennary monosialylated glycans and increase in tetraan-tennary tetrasialylated glycans with PNI which is alsoassociated with the Gleason score. Increase in highlybranched and sialylated glycans is known to be associated
with cancer progression (Arnold et al. 2008). This couldreflect the fact that the Gleason 7 patients have more inva-sive disease then Gleason 5 patients including increases inpatients with positive PNI (Table I). PNI is an importantpreoperative predictor of the pathologic stage (de la Tailleet al. 1999). Previous studies have shown that at least 50%of cases involving ECE occurred by spreading of the cancerwithin the perineural spaces (Villers et al. 1989). Cancercells in the perineural space have increases in proliferationand a decrease in apoptosis and were found to acquire asurvival and growth advantage using a NFκB survivalpathway (Ayala et al. 2004). Therefore, the detection ofPNI glycosylation in serum could help diagnose tumorspread and predict patients’ survival.
SummaryIn conclusion, using our fully quantitative high-throughputN-glycan analysis, we have identified the most significant gly-cosylation changes between BPH and prostate cancer patient
Fig. 3. Plotted are the ROC curves of significantly changed peaks in comparison with PSA in (A) prostate cancer compared with BPH and (B) Gleason 5compared with Gleason 7.
R Saldova et al.
202
at University C
ollege Dublin on January 6, 2011
glycob.oxfordjournals.orgD
ownloaded from

serum glycomes: increased levels of core-fucosylated bian-tennary glycans and α2-3-linked sialic acids. These changesare consistent with altered fucosylation and sialylation path-ways in prostate cancer. We have also identified significantchanges in Gleason 7 compared with Gleason 5 prostatecancer patient sera: decrease in triantennary trigalactosylatedglycans and tetraantennary tetrasialylated glycans with outerarm fucose and increase in tetraantennary tetrasialylatedglycans. All these identified glycans have better predictivepower than the currently used PSA and therefore may providea new noninvasive approach to diagnose prostate cancer andthe grade and stage of disease. However, additional validationstudies would need to be carried out to further support thesefinding. One of the recent improvements in PSA measurementtechnologies is the measurements of free/total PSA ratios (f/tPSA). However, f/t PSA levels are not measured routinely inclinical practice, and they are only reported to work in menwho have total PSA levels between 4 and 10 ng/mL and anegative digital rectal examination (DRE) according to theEAU guidelines 2010 (Heidenreich et al. 2010). In our dataset, the total PSA is a wider range and some of the patientshave positive DRE (Table I). This would indicated that theglycan level may work in a more general patient population
than the f/t PSA ratio. Decreases in triantennary trigalactosy-lated glycans and/or bisected core-fucosylated biantennarymonosialylated glycans and increases in tetraantennary tetra-sialylated glycans correlate with PNI which could help diag-nose tumor spread and predict patients’ survival.
Materials and methodsSerum samplesSamples were collected with consent from prostate cancerpatients before undergone radical prostatectomy and from menwith BPH following a standard operating procedure, which ispart of the Prostate Cancer Research Consortium BioResource.Ethical consent was granted from respective Hospital ethicscommittee of the consortium. Blood samples (10 mL) werecollected into anticoagulant-free tubes. Samples were codedand transported on ice to the laboratory. The tubes were centri-fuged at 2500 rpm at 20°C for 10 min within a 30 min timeframe. Serum from each patient sample was then collected, ali-quoted and stored at −80°C until time of analysis. Each serumsample underwent no more than three freeze/thaw cycles priorto analysis.
Fig. 4. Plotted are (A) the percentage peak areas as part of whole serum N-glycome containing glycans significantly changed in prostate cancer patients withpositive compared with negative PNI, boxes represent the 25th and the 75th percentiles with the median indicated, and (B) the ROC curves of significantlychanged peaks in comparison with PSA in prostate cancer patients with positive compared with negative PNI.
Specific changes in prostate cancer serum N-glycome
203
at University C
ollege Dublin on January 6, 2011
glycob.oxfordjournals.orgD
ownloaded from

2AB labeling of glycansReleased glycans were labeled by reductive amination withthe fluorophore 2AB (Bigge et al. 1995), using a LudgerTag™ 2AB glycan labeling kit as described by the manufac-turer (Ludger Ltd, Oxford, UK). Excess 2AB reagent wasremoved by ascending chromatography on Whatman 3MMpaper (Clifton, NJ) in acetonitrile.
Normal-phase HPLCNP-HPLC was performed using a TSK-Gel Amide-80 4.6 ×250 mm column (Anachem, Luton, Bedfordshire, UK) on a2695 Alliance separations module (Waters, Milford, MA)equipped with a Waters temperature control module and aWaters 2475 fluorescence detector. Solvent A was 50 mMformic acid adjusted to pH 4.4 with ammonia solution.Solvent B was acetonitrile. The column temperature was setto 30°C. A 60-min method was used—a linear gradient of35–47% solvent A over 48 min at a flow rate of 0.8 mL/min,followed by 1 min at 47–100% A and 4 min at 100% A,returning to 35% A over 1 min and then finishing with 35%A for 6 min (Royle et al. 2008). Samples were injected in80% acetonitrile (Royle et al. 2006). Fluorescence wasmeasured at 420 nm with excitation at 330 nm. The systemwas calibrated using an external standard of hydrolyzed and2AB-labeled glucose oligomers to create a dextran ladder, asdescribed previously (Royle et al. 2006).
Weak anion exchange HPLCWAX-HPLC was performed using a Vydac 301VHP575 7.5 ×50 mm column (Anachem) on a 2695 Alliance separations
module with a 474 fluorescence detector (Waters). Solvent Awas 0.5 M formic acid adjusted to pH 9.0 with ammonia sol-ution, and solvent B was 10% (v/v) methanol in water.Gradient conditions were as follows: a linear gradient of 0–5%A over 12 min at a flow rate of 1 mL/min, followed by 5–21%A over 13 min and then 21–50% A over 25 min, 80–100% Aover 5 min, and then 5 min at 100% A. Samples were injectedin water. A fetuin N-glycan standard was used for calibration(Royle et al. 2006). All HPLC units were equipped withWaters temperature control modules and Waters 2475 fluor-escence detectors set with excitation and emission wavelengthsof 330 and 420 nm, respectively (Royle et al. 2008).
Exoglycosidase digestionsAll enzymes were purchased from Prozyme, San Leandro, CA.The 2AB-labeled glycans were digested in 10 μL of 50 mMsodium acetate buffer, pH 5.5 for 18 h at 37°C, using arrays ofthe following enzymes at the indicated concentrations: ABS(EC 3.2.1.18), 1 U/mL; NAN1 (EC 3.2.1.18), 1 U/mL. Afterincubation, enzymes were removed by filtration through aprotein-binding EZ filters (Millipore Corporation; Royle et al.2006). N-Glycans were then analyzed by NP-HPLC.
StatisticsWe are fully aware of the confounding effect of age on theglycosylation, so we fit our patient groups and their age withthe glycan levels in a linear regression model. The P-valuecalculated for each peak from the linear regression model hastaken the age effect into account. A P-value of <0.05 wasconsidered as statistically significant. Then, the significant
Table III. Significant glycosylation changes in these correlating with clinical data in prostate cancer patients
Peak IDa Predominant N-glycansb Median % N-glycan Age-adjusted P-valuec
Abbreviationsd Structurese Perineural invasion
Negative (n = 24) Positive (n = 10)
Undigested profilePeak 15 FA2BG2S1, A3G3 5.30 4.00 0.029
Peak 23 A4G4S4 0.32 0.49 0.012
aPeak ID relates to Figure 1.bThe most abundant glycans in each peak are listed. Detailed N-glycan composition of human serum is described in Royle et al. (2008).cLinear regression model was carried out on the following groups to see if there are significant differences based on N-glycosylation. All 24 peaks fromundigested profiles and 15 from NAN1-digested profiles were tested. Only peaks which were significant (P < 0.05) are listed.dStructure abbreviations: All N-glycans have two core GlcNAcs and a trimannosyl core; F at the start of the abbreviation indicates a core fucose linked α1-6 tothe core GlcNAc; A(y)a represents the number a of antenna (GlcNAc) on the trimannosyl core linked to the α1-y mannose arm; B, bisecting GlcNAc linkedβ1-4 to β1-4 core mannose; Fb after Aa represents the number b of fucose linked α1-3 to antenna GlcNAc; Gc represents the number c of galactose on antenna;S(z)d represents number d of sialic acids linked α2-z to the galactose.eSymbol representation of glycans as follows: GlcNAc, filled square; mannose, open circle; galactose, open diamond; fucose, diamond with a dot inside; betalinkage, solid line; alpha linkage, dotted line; 1-4 linkage, horizontal line; 1-3 linkage, (/); 1-2 linkage, vertical line; and 1-6 linkage, (\).
R Saldova et al.
204
at University C
ollege Dublin on January 6, 2011
glycob.oxfordjournals.orgD
ownloaded from

glycan-peaks list was fitted into a linear regression model, anda stepwise backward variable elimination method based onAkaike’s information criteria was used for variable selection(Akaike 1987). The final selected model was internally vali-dated through 200 times bootstrapping using partialleast-square regression. The predictive power of PSA, selectedindividual glycan peaks and combined panel were assessedusing receiver operating characteristics (ROC) curves and theAUC value was calculated as an indication of prediction accu-racy in the internal validation. The ROC curves were gener-ated using R package digeR (Fan et al. 2009).All the data analysis was carried out using statistical soft-
ware R.
Funding
This work was supported by grant from Irish Cancer Societyvia the Prostate Cancer Research Consortium.
Conflict of interest statement
None declared.
Abbreviations
2AB, 2-aminobenzamide; ABS, Arthrobacter ureafaciens sia-lidase; AUC, area under the curve; BPH, benign prostatichyperplasia; DRE, digital rectal examination; ECE, extracap-sular extension; EGFR, epidermal growth factor receptor; f/tPSA, free/total PSA ratio; FUT8, α1-6 fucosyltransferase;GUs, glucose units; HPLC, high-performance liquid chrom-atography; NAN1, Streptococcus pneumoniae sialidase; NP,normal phase; PIN, prostatic intraepithelial neoplasia; PNI,perineural invasion; PSA, prostate-specific antigen; ROC,receiver operating characteristic; WAX, weak anion exchange.
References
Akaike H. 1987. Factor analysis and AIC. Psychometrika. 52:317–332.Arnold JN, Saldova R, Hamid UM, Rudd PM. 2008. Evaluation of the serum
N-linked glycome for the diagnosis of cancer and chronic inflammation.Proteomics. 8:3284–3293.
Ayala GE, Dai H, Ittmann M, Li R, Powell M, Frolov A, Wheeler TM,Thompson TC, Rowley D. 2004. Growth and survival mechanisms associ-ated with perineural invasion in prostate cancer. Cancer Res.64:6082–6090.
Bigge JC, Patel TP, Bruce JA, Goulding PN, Charles SM, Parekh RB. 1995.Nonselective and efficient fluorescent labeling of glycans using 2-aminobenzamide and anthranilic acid. Anal Biochem. 230:229–238.
de la Taille A, Katz A, Bagiella E, Olsson CA, O’Toole KM, Rubin MA.1999. Perineural invasion on prostate needle biopsy: An independent pre-dictor of final pathologic stage. Urology. 54:1039–1043.
Fan Y, Murphy TB, Watson RW. 2009. digeR: A graphical user interface Rpackage for analyzing 2D-DIGE data. Bioinformatics. 25:3033–3034.
Fanning DM, Kay E, Fan Y, Fitzpatrick JM, Watson RW. 2010. Prostatecancer grading: The effect of stratification of needle biopsy Gleason score4 + 3 as high or intermediate grade. BJU Int. 105:631–635.
Ferlay J, Parkin DM, Steliarova-Foucher E. 2010. Estimates of cancer inci-dence and mortality in Europe in 2008. Eur J Cancer. 46:765–781.
Heidenreich A, Bolla M, Joniau S, Mason MD, Matveev V, Mottet N,Schmid H-P, van der Kwast TH, Wiegel T, Zattoni F. 2010. EuropeanAssociation of Urology: ARNHEM, The Netherlands: European
Association of Urology: Guidelines: Online Guidelines: (2010) English.Available from: http://www.uroweb.org/guidelines/online-guidelines/Accessed July 2010.
Holmes EH, Ostrander GK, Hakomori S. 1986. Biosynthesis of the sialyl-Lexdeterminant carried by type 2 chain glycosphingolipids (IV3NeuAcIII3FucnLc4, VI3NeuAcV3FucnLc6, and VI3NeuAcIII3V3Fuc2nLc6)in human lung carcinoma PC9 cells. J Biol Chem. 261:3737–3743.
Ito Y, Miyauchi A, Yoshida H, Uruno T, Nakano K, Takamura Y, Miya A,Kobayashi K, Yokozawa T, Matsuzuka F, et al. 2003. Expression ofalpha1,6-fucosyltransferase (FUT8) in papillary carcinoma of the thyroid:Its linkage to biological aggressiveness and anaplastic transformation.Cancer Lett. 200:167–172.
Jemal A, Siegel R, Ward E, Hao Y, Xu J, Thun MJ. 2009. Cancer statistics,2009. CA Cancer J Clin. 59:225–249.
Knezevic A, Gornik O, Polasek O, Pucic M, Redzic I, Novokmet M, RuddPM, Wright AF, Campbell H, Rudan I, et al. 2010. Effects of aging, bodymass index, plasma lipid profiles, and smoking on human plasma N-glycans. Glycobiology. 20:959–969.
Knezevic A, Polasek O, Gornik O, Rudan I, Campbell H, Hayward C, WrightA, Kolcic I, O’Donoghue N, Bones J, et al. 2009. Variability, heritabilityand environmental determinants of human plasma N-glycome. J ProteomeRes. 8:694–701.
Kyselova Z, Mechref Y, Kang P, Goetz JA, Dobrolecki LE, Sledge GW,Schnaper L, Hickey RJ, Malkas LH, Novotny MV. 2008. Breast cancerdiagnosis and prognosis through quantitative measurements of serumglycan profiles. Clin Chem. 54:1166–1175.
Makarov DV, Trock BJ, Humphreys EB, Mangold LA, Walsh PC, Epstein JI,Partin AW. 2007. Updated nomogram to predict pathologic stage of prostatecancer given prostate-specific antigen level, clinical stage, and biopsyGleason score (Partin tables) based on cases from 2000 to 2005. Urology.69:1095–1101.
Matsumoto K, Yokote H, Arao T, Maegawa M, Tanaka K, Fujita Y, ShimizuC, Hanafusa T, Fujiwara Y, Nishio K. 2008. N-Glycan fucosylation of epi-dermal growth factor receptor modulates receptor activity and sensitivity toepidermal growth factor receptor tyrosine kinase inhibitor. Cancer Sci.99:1611–1617.
Noda K, Miyoshi E, Gu J, Gao CX, Nakahara S, Kitada T, Honke K, SuzukiK, Yoshihara H, Yoshikawa K, et al. 2003. Relationship between elevatedFX expression and increased production of GDP-L-fucose, a commondonor substrate for fucosylation in human hepatocellular carcinoma andhepatoma cell lines. Cancer Res. 63:6282–6289.
Nogueira L, Corradi R, Eastham JA. 2010. Other biomarkers for detectingprostate cancer. BJU Int. 105:166–169.
Ohyama C, Hosono M, Nitta K, Oh-eda M, Yoshikawa K, Habuchi T, Arai Y,Fukuda M. 2004. Carbohydrate structure and differential binding of pros-tate specific antigen to Maackia amurensis lectin between prostate cancerand benign prostate hypertrophy. Glycobiology. 14:671–679.
Osumi D, Takahashi M, Miyoshi E, Yokoe S, Lee SH, Noda K, Nakamori S,Gu J, Ikeda Y, Kuroki Y, et al. 2009. Core fucosylation of E-cadherinenhances cell-cell adhesion in human colon carcinoma WiDr cells. CancerSci. 100:888–895.
Peracaula R, Barrabes S, Sarrats A, Rudd PM, de Llorens R. 2008. Alteredglycosylation in tumours focused to cancer diagnosis. Dis Markers. 25:207–218.
Royle L, Campbell MP, Radcliffe CM, White DM, Harvey DJ, Abrahams JL,Kim YG, Henry GW, Shadick NA, Weinblatt ME, et al. 2008.HPLC-based analysis of serum N-glycans on a 96-well plate platform withdedicated database software. Anal Biochem. 376:1–12.
Royle L, Radcliffe CM, Dwek RA, Rudd PM. 2006. Detailed structural analy-sis of N-glycans released from glycoproteins in SDS-PAGE gel bandsusing HPLC combined with exoglycosidase array digestions. Methods MolBiol. 347:125–143.
Sarrats A, Saldova R, Comet J, O’Donoghue N, de Llorens R, Rudd PM,Peracaula R. 2010. Glycan characterization of PSA 2-DE subforms fromserum and seminal plasma. OMICS. 14:465–474.
Tabares G, Radcliffe CM, Barrabes S, Ramirez M, Aleixandre RN, Hoesel W,Dwek RA, Rudd PM, Peracaula R, de Llorens R. 2006. Different glycanstructures in prostate-specific antigen from prostate cancer sera in relationto seminal plasma PSA. Glycobiology. 16:132–145.
Villers A, McNeal JE, Redwine EA, Freiha FS, Stamey TA. 1989. The role ofperineural space invasion in the local spread of prostatic adenocarcinoma. JUrol. 142:763–768.
Specific changes in prostate cancer serum N-glycome
205
at University C
ollege Dublin on January 6, 2011
glycob.oxfordjournals.orgD
ownloaded from
Related Documents