Finalizing the Regional MPA Monitoring Protocol: Coral Reef Monitoring and 4th MC Measures Group Workshop (2 nd Marine Measures Working Group Meeting) WORKSHOP REPORT 6 – 9 February, 2012 Koror State Government Assembly Hall/ Palau International Coral Reef Center Conference Room Koror, Palau

Welcome message from author
This document is posted to help you gain knowledge. Please leave a comment to let me know what you think about it! Share it to your friends and learn new things together.
Transcript

Finalizing the Regional MPA Monitoring Protocol: Coral Reef Monitoring and
4th MC Measures Group Workshop (2nd Marine Measures Working Group Meeting)
WORKSHOP REPORT
6 – 9 February, 2012 Koror State Government Assembly Hall/
Palau International Coral Reef Center Conference Room Koror, Palau
ii
TABLE OF CONTENTS Table of Contents………………………………………………………………………………………………………………………... ii Acknowledgements…………………………………………………………………………………………………………………..... iv Acronyms ……………………………………………………………………………………………………………………………………. v List of Participants…………………………………………………………………………………………………………………....... vi Executive Summary………………………………………………………………………………………………………………...... viii Background …………………………………………………………………………………………………………………………….…… 1 Workshop objectives, outputs & deliverables……………………………………………………………………………... 2 Workshop Report ………………………………………………………………………………………………………………........... 3 DAY 1 Opening Remarks by Mrs. Sandra S. Pierantozzi, Chief Executive Officer, PICRC……….………………… 3 MC Workshop Background & Introduction (Dr. Yimnang Golbuu, PICRC).………………………..………….. 3
I. CAPACITY ENHANCEMENT PROJECT FOR CORAL REEF MONITORING Session 1: Capacity Enhancement Project for Coral Reef Monitoring (CEPCRM) 1. Update on CEPCRM since 2010 (Dr. Seiji Nakaya, JICA)…………………………………………. 4 II. REGIONAL MPA MONITORING PROTOCOL Session 2: Marine Monitoring Protocol
2. Introduction of the Marine Monitoring Protocol (Dr. Yimnang Golbuu, PICRC) ……. 5 Session 3: Jurisdictional Updates 3. Presentations from all MC states on ecological & socioeconomic monitoring since 2010.… 5 Group Breakout #1: General Issues and challenges since 2010…………………………………………………. 6 PLENARY DISCUSSION:
Key issues/challenges in monitoring experienced by Jurisdictions since 2010…………………… 7 DAY 2 Session 4: Monitoring of MPAs across Micronesia 4. Toward measuring the effectiveness of the Micronesia Challenge: Current status of
Micronesia’s monitoring activities and future directions for the MC & beyond (Dr. Peter Houk, PMRI) .… 8
5. Presentation of the results of surveys done across Micronesia & Lessons Learned (Lukes Isechal, PICRC) …………………………………………………………………………………………... 9
PLENARY DISCUSSION: Improving & finalizing marine monitoring indicators (Final MC Monitoring Indicators)…. 10
Session 5: Status of Socioeconomic Monitoring 6. 2009 Hatohobei Community socioeconomic survey (Rosania Victor, HRRMP)……………… 11

iii
7. Socioeconomic Assessment on the perspective of divers & snorkelers visiting the Rock Islands‐Southern Lagoon Management Area (King Sam, KSG)…………………… 12
Group Breakout #2: SE Measures: Status, issues & future directions .…………………………………… 13 PLENARY DISCUSSION:
Socioeconomic Measures ………………………………………………………………………………………………. 14 DAY 3 Session 6: Capacity Needs PLENARY DISCUSSION:
Identified capacity needs by each jurisdiction…………………………………………………………….... 15 Parking Lot...................................................................................................................................... 16 DAY 4 III. REGIONAL DATABASE MANAGEMENT SERVICE Session 7: MC Database 8. MC Monitoring Database: Progress on its development (Lukes Isechal [PICRC] and
Franck Magron [SPC])………………………………………………………………………………….. 16 IV. MPA MANAGEMENT EFFECTIVENESS TOOL Session 8: Management Effectiveness 9. Introduction of a Marine Protected Areas Management Effectiveness (MPA‐ME) Tool
(Steven Victor, TNC)……………………………………………………………………………………. 18 10. Testing the Marine Protected Areas Management Effectiveness (MPA‐ME) Tool (Lukes Isechal, PICRC)……………………………………………………………………………………..….. 20 11. Feedback from pilot sites for the MPA‐ME Tool (Del. Wayne Andrew, OEK)………. 21 12. Update on past management effectiveness efforts: Demonstration of a similar Used in
Lenger Island, Pohnpei (Eugene Joseph, CSP)………………………………………… 23 Session 9: Open Discussion on MPA Management Effectiveness Tool PLENARY DISCUSSION:
MPA Management Effectiveness Tool……………………………………………………………………………. 24 Session 10: Specific Regional Collaboration Group Breakout #4: Assess current collaboration and identify opportunities for future Collaboration 25

iv
Attachments 1. Workshop Program and Agenda 2. Jurisdiction Updates 3. Group Breakout 1: 2010 Monitoring Issues 4. Group Breakout 2: Improving MC Regional Monitoring Indicators 5. Group Breakout 3: Progress & Future Directions of SE Monitoring 6. Plenary Discussion on MPA ME Tools 7. Group Breakout 4: Regional Collaboration & ME Tools Sites 8. Fish List Acknowledgements Generous support for this meeting was made possible through the Capacity Enhancement Project for Coral Reef Monitoring (CEPCRM) – a joint project between Japan International Cooperation Agency (JICA) and Palau International Coral Reef Center (PICRC). Additional funding support was provided by The Nature Conservancy (TNC) and Micronesia Conservation Trust (MCT). Special thanks also go to those who helped with logistical and facilitation support, including staff from PICRC, JICA, MC Regional Office, TNC and PALARIS. The Pacific Marine Resources Institute (PMRI) and Secretariat of the Pacific Community (SPC) also deserve special recognition for their contribution in technical and scientific presentations and discussions. And last, but not least, many thanks to all the participants for their enthusiastic effort, informative updates and discussions, and willingness to share lessons learned, which further enhanced the spirit of regional collaboration amongst all five MC jurisdictions.

v
Acronyms BMR Bureau of Marine Resources ME Management Effectiveness
BD Biodiversity MPA Marine Protected Area
BR Biosphere Reserve MRD Marine Resources Development
CA Conservation Area NGO Non‐government Organization
CAP Conservation Area Planning NOAA National Oceanic and Atmospheric Administration
CC Climate Change OEK Olbiil Era Kelulau (Palau National Congress)
CCS Chuuk Conservation Society OERC Office of Environment & Response Coordination
CEPCRM Capacity Enhancement Project for Coral Reef Monitoring
PA Protected Area
CMAC Coastal Management Advisory Council PACC Pacific Adaptation to Climate Change
CMR Chuuk Marine Resources PALARIS
Palau Automated Land and Resources Information System
CNMI Commonwealth of the Northern Mariana Islands
PAN Protected Areas Network
CSP Conservation Society of Pohnpei PCAA Palau Community Action Agency
DEQ Division of Environmental Quality PCC Palau Community College
FP Focal Points (for MC) PCS Palau Conservation Society
FSM Federated States of Micronesia PICRC Palau International Coral Reef Center
GCC Guam Community College PIMPAC
Pacific Islands Managed and Protected Areas Community
GCRMO Guam Coastal Resource Management Office PH Public Health
GEF Global Environment Facility PMDC Palau Mariculture Demonstration Center
GIS Geographical Information System PMRI Pacific Marine Resources Institute
HOPE Hatohobei Organization for People & Environment
PMR Pohnpei Marine Resources
HRRMP Helen Reef Resources Management Program RMI Republic of the Marshall Islands
Is‐SEAS Island ‐ Social and Ecological Applied Sciences
ROP Republic of Palau
JICA Japan International Cooperation Agency SAP Strategic Action Plan
JOCV Japan Overseas Cooperation Volunteers SC Steering Committee (for MC)
KCSO Kosrae Conservation & Safety Organization SD Sustainable Decisions
LE Learning Exchange SE Socio‐economic
LMMA Locally Managed Marine Areas SEM Socio‐economic Monitoring
LTMP Long‐term Monitoring Protocol SEM‐P Socio‐economic Monitoring‐Pasifika
KSG Koror State Government SPC Secretariat of the Pacific Community
MC Micronesia Challenge TNC The Nature Conservancy
MCRO Micronesia Challenge Regional Organization UOG University of Guam
MCT Micronesia Conservation Trust VA‐LEAP
Vulnerability Assessment‐Local Early Action Planning
YapCAP Yap Community Action Program
MICS Marshall Islands Conservation Society YC Young Champions
MIMRA Marshall Islands Marine Resources Authority

vi
List of Participants
Jurisdiction/
Island Name Title Agency /Organization Email
1 Chuuk Curtis Graham Marine Program Manager CCS [email protected]
2 Chuuk Chimres Teresio Conservation Officer CMR n/a
3 Kosrae Osamu Nedlic Marine Program assistant KCSO [email protected]
4 Kosrae Marston Luckymis Marine Program Manager KCSO [email protected]
5 Pohnpei Eugene Joseph Director CSP [email protected]
6 Pohnpei Selino Maxin Marine Program Manager CSP [email protected]
7 Pohnpei Scottie Malakai Pohnpei Marine Resources PMR [email protected]
8 Pohnpei Liz Terk Conservation Program Manager
MCT conservation@ourmicronesia. org
9 Yap Thomas Gorong Community Project Manager
Kaday Village [email protected]
10 Yap Jonathan K. Gorong Community Surveillance & WQ monitoring member
Kaday Village [email protected]
11 Yap Vanessa Fread Environment Program Development Officer
YapCAP [email protected]
12 RMI Henry Muller Marine Program Manager MICS [email protected]
13 RMI Benedict Yamamura Intern MIMRA [email protected]
14 Guam Dave Burdick Biologist/Coastal GIS Specialist
GCRMO [email protected]
15 CNMI Steven Johnson Biologist/Water QualitySpecialist
16 CNMI John Ingel Environmental Specialist DEQ [email protected]
17 CNMI David Benavente Marine Technician CRM [email protected]
18 Palau Lolita Decherong‐ Gibbons
Management Planning Coordinator
19 Palau Del. Wayne Andrew Hatohobei StateChairman
OEK PAN Committee
20 Palau Rosania Victor Program Manager HRRMP [email protected]
21 Palau Stella Patris Education & Awareness Officer
HRRMP [email protected]
22 Palau William Andrew Palau LMMA (BLMA) HOPE [email protected]
23 Palau King Sam Rock Islands Development Officer
KSG Dept. of Conservation and Law Enforcement
24 Palau Percy Rechelluul Fisheries Technician Fin Fish Hatchery, BMR
25 Palau Lawrence Sumor Fisheries Technician PMDC, BMR
26 Palau Leon Remengesau Admin. Officer II PMDC, BMR
27 Palau Harvey Renguul Fisheries Specialist PMDC, BMR
28 Palau Irene Mercader‐Guzman
Regional Database Analysts
PALARIS [email protected]
29 Palau Steven Victor Program Officer TNC [email protected]

vii
30 Palau Sandra SumangPierantozzi
Chief Executive Officer PICRC [email protected]
31 Palau Carol Emaurois Head of Education & Public Relations Department
PICRC
32 Palau Adelle Lukes Isechal Researcher PICRC [email protected]
33 Palau Shirley D. Koshiba Researcher PICRC [email protected]
34 Palau Takashi Anzawa Counselor Embassy of Japan
35 Palau Naoko Hayashi Researcher Embassy of Japan [email protected]
36 Palau Taiji Usui Resident Representative JICA Palau Office [email protected]
37 Palau Mark Defley Research student [email protected]
38 Palau Asap Bukurrow Consultant SD [email protected]
39 Palau Mike Aulerio GIS Specialist TNC [email protected]
Facilitation/Resource Team
1 Guam Trina Leberer Director TNC [email protected] CNMI Peter Houk Chief Biologist PMRI [email protected] 3 New
Caledonia Franck Magron
Reef Fisheries Information Manager
4 Palau Seiji Nakaya Chief Advisor CEPCRM [email protected] Palau Setsuko Matsumoto Project Coordinator CEPCRM [email protected] Palau Takanori Sato JOCV Volunteer JICA Volunteer 7 Palau Yimnang Golbuu Chief Researcher PICRC [email protected] Palau Geory Mereb Research Assistant PICRC [email protected] Palau Jay Andrew Research Assistant PICRC [email protected] Palau Arius Merep Research Assistant PICRC n/a 11 Palau Dawnette Olsudong Research Assistant PICRC [email protected] Palau Byron Silil Student Intern PCC/PICRC [email protected]
13 Palau Surech Hideyos Office Manager/MC Interns Coordinator
MCRO [email protected]
14 Palau Madelsar Ngiraingas Program Manager PALARIS [email protected] Palau Tiare Holm Consultant SD [email protected] Palau Charlene Mersai Consultant Is‐SEAS [email protected]

viii
Executive Summary In the midst of global decline in biodiversity and increasing impacts of critical threats, such as climate change, particularly on small island nations, the Chief Executives of the Republic of Palau, Republic of the Marshall Islands, Federated States of Micronesia, U.S. Territory of Guam, and U.S. Commonwealth of the Northern Mariana Islands, launched a regional conservation initiative in 2006 that not only challenged themselves, but also the international community, to do better and exceed United Nation’s minimum goals for the Program of Work on Protected Areas (POWPA) under the Convention of Biological Diversity (CBD). This ambitious goal is called the Micronesia Challenge (MC), a shared commitment by these leaders to “effectively conserve at least 30% of the near‐shore marine resources and 20% of the terrestrial resources by 2020” in an effort to ensure sustainable livelihoods and a healthy future for their people by safeguarding the island biodiversity of Micronesia. During the same year, 2006, these leaders proceeded to hold the first MC regional meeting to begin the process of implementing the MC. Since then, there have been a total of six additional MC regional meetings, one on climate change adaptation, one on regional communication and four on identifying measures of progress and ensuring effective conservation. This workshop, “Finalizing the Regional MPA Monitoring Protocol: Coral Reef Monitoring and 4th MC Measures Group Workshop”, the fourth and most recent of the MC Measures Working Group meetings, was held in Koror, Republic of Palau from 6‐9 February 2012. Representatives from all five MC jurisdictions reconvened at this workshop to finalize the work they had begun two years earlier and to chart their course for the next few years to ensure that they stay organized and remain focused towards achieving the goals of MC’s marine component. The main purpose of the workshop was to finalize the MC regional MC Marine Monitoring Protocol (consisting of survey design, indicators, and methods), which was initiated in the previous regional workshop in 2010 and has been tested in marine protected areas in several islands throughout Micronesia since then. Other objectives of the workshop included updating the participants on the progress of the joint PICRC/JICA mission, Capacity Enhancement Project for Coral Reef Monitoring (CEPCRM), reach consensus on the proposed data management service, learn about the MPA Management Effectiveness Tool and identify new MPA sites to use this tool, and finally identify next steps for future collaborative activities. All the objectives set out for this workshop were achieved. The participants of this workshop learned, shared, approved proposals and made plans for continued collaboration. More specifically, they learned about the progress of relevant activities and new developments since the last regional meeting in 2010 (e.g., status of CEPCRM, progress of ecological and socioeconomic monitoring, and the new MPA Management Effectiveness tool which has been tested in a couple of pilot MPA sites). What they shared included issues and challenges associated with implementing the proposed regional marine monitoring indicators, trends in monitoring activities in each jurisdiction and current capacity needs both for ecological and socioeconomic monitoring in the region. The participants also approved the final marine monitoring indicators and the proposed service and process for regional database management. Finally, to ensure that this Marine Working Group does not lose momentum after this workshop, the participants also laid out some concrete next steps for their continued collaboration, including identifying new sites to undergo the MPA Management Effectiveness Tool; identifying current capacity needs that will receive their attention; and laying out future directions of socioeconomic monitoring in the region, which remains one of the greatest challenges for the MC Working Group.

1
Background The history of the Micronesia Challenge Measures Working Group began in 2008, when more than sixty participants from the five MC jurisdictions (Federated States of Micronesia [FSM], Republic of the Marshal Islands [RMI], Republic of Palau [ROP], US Commonwealth of the Northern Mariana Islands [CNMI] and the US Territory of Guam) gathered in Pohnpei to participate in their first regional MC Measures Working Group meeting. Prior to that meeting, there was another MC regional meeting held in 2006, the 1st Regional Action Planning Meeting. The Planning Meeting laid out the foundation and set the stage for the Measures Working Group to move forward by producing a wide‐ranging set of recommendations, including base definitions for the various components of the MC commitment; broad categories of indicators to track regional progress on achieving the goals of the MC; and a strategy for regional outreach. In 2008, the Measures Group convened for the first time as a unit. The goal of this workshop, “Moving Toward Measuring Our Effectiveness: The 1st Meeting of the MC Measures Working Group” was to continue the discussion on regional indicators to measure effective conservation. More specifically, they needed to define a proposed process and timeline for a regular review and analysis of the progress toward achieving the goals of the MC. When this workshop was completed, the group had developed a condensed set of essential indicators to help measure progress toward the goals of the MC. However, further refinement of these indicators was still needed, along with a plan on how to build the necessary capacity to measure these indicators in each of the jurisdictions. In order to meet these needs, the workshop recommended the formation of smaller working groups to follow up and carry out the following tasks: 1. Refine the indicators and clarify the exact protocol for monitoring the indicators. 2. Develop a simpler protocol for more regular monitoring and a more thorough protocol for periodic
monitoring, in the case of the Ecological group. 3. Identify the capacity needed to monitor the indicators. 4. Clarify each jurisdiction’s capacity needs. 5. Assist in the development of a data analysis and reporting approach for the indicators. In 2010, a sub‐component of the MC Measures Working Group (Marine Measures Group) convened in Palau to participate in a follow‐up workshop, “Moving Toward Measuring Our Effectiveness: The 2nd Meeting of the MC Measures Working Group and PICRC‐JICA Coral Reef Monitoring Project Meeting” to take what had been collectively agreed in 2008 and use that information to develop a regional marine monitoring framework (e.g., what should be measured; how should they be measured; who will be involved; and what level of capacity is needed to carry out this measures work). This second MC regional meeting, coincided with the PICRC/JICA project called Capacity Enhancement Project for Coral Reef Monitoring (CEPCRM) that shared a key objective with the Marine Measures Group: to produce a marine monitoring protocol that is realistic, relevant and achievable to be used by all MC jurisdictions to measure conservation progress of the MC goals. At the end of the 2010 workshop, the Marine Measures Group had further refined a set of selected indicators and methods which may meet both the realistic/achievable criteria as well as the minimum scientific rigor that is needed to ensure quality monitoring data. Due to limited time, the group was not able to discuss and develop consensus on some of the suggested indicators. This led to a creation of several even smaller working groups, including Marine Ecology, Socioeconomics and Score Card, that were tasked to continue discussions and work out the missing details, via email or other electronic means, until a consensus is reached by representatives of all jurisdictions. Fast‐forward to the present, 2012: The Marine Measures Group, reconvened, after not only having continued their discussions to agree on the proposed marine monitoring indicators, but also after having tested these indicators throughout Micronesia, to finalize the MC Regional Marine Monitoring Protocol. This workshop, “Finalizing the Regional MPA Monitoring Protocol: Coral Reef Monitoring and 4th MC Measures Working Group Workshop (2nd

2
Marine Measures Working Group Meeting)” took place from 6‐9 February with an extremely ambitious set of objectives, including understanding recently developed tools to measure MPA management effectiveness; arriving at a consensus on a proposed regional data management service; sharing progress and future directions of socioeconomic monitoring; receiving an update on CEPCRM; identifying capacity gaps in relation to the recently tested monitoring indicators; and identifying next steps on regional collaborative activities. However, the most critical of all the objectives was to finalize the regional monitoring protocol, with the latest proposed modifications.
Workshop Objectives:
I. CEPCRM a) Participants understand status of CEPRM
II. Regional MPA Monitoring Protocol a) Participants obtain outline of protocol. b) Participants share issues/challenges in implementing monitoring. c) Participants share the status and trends of monitoring activities of each jurisdiction as a
basis for discussion to make future plans and to improve monitoring capacity. d) Participants arrive at a consensus on the proposed regional monitoring indicators and
methods with latest proposed modifications. e) Participants share progress and future directions of socioeconomic monitoring. f) Participants identify current capacity needs (e.g., resource, capacity, policy, etc.) to
implement agreed monitoring methods. III. Regional Database Management Service
a) Participants arrive at a consensus on the proposed regional data management service. b) Participants approve process for regional database management.
IV. MPA Effectiveness Tool a) Participants understand MPA management effectiveness tool, its needs and application. b) Participants agree on the work plan for MPA management effectiveness tool.
V. Regional Collaboration a) Participants identify next steps and agree on future regional collaborative activities.
Output and Deliverables
(1) Workshop Report (2) Finalized MC marine monitoring indicators (3) List of capacity gaps for implementing the approved regional and standardized MPA monitoring
methods (3) Regional collaborative work plan towards implementing the approved regional MPA monitoring
methods

3
Workshop Report Day 1 Opening Remarks by Mrs. Sandra Sumang Pierantozzi, Chief Executive Officer, PICRC “Micronesia is very small and when I look around the room, I recognize many faces, as we’ve worked together in other work before. I’m really proud to be a Micronesian standing here because for a small place, we’ve made some great strides. However, we should not stop there.” Mrs. Pierantozzi remarked that the Micronesia Challenge (MC) was a creation of our respective Chief Executives to get us to move forward together to conserve 30% of our marine resources and 20% of our terrestrial resources. They have done their part, and now it’s up to us, this group, to determine how to ensure that we have made progress in our conservation efforts and are indeed achieving these MC goals. It is for this reason, she pronounced, that this workshop was organized – to provide a setting to come together to talk about monitoring process and to see where we are successful; where we are failing; and how best to use these information and move on. In short, she highlighted the fundamental role of the Marine Measures Group which is to make sure that what is done actually makes a difference as we move forward, and part of this work includes collaboration. She ended her remarks by thanking the group for their participation and to enjoy the workshop that her staff worked hard to organize. But more importantly, to continue to measure what has been learned; what has been done; and what else can be done, especially with climate change threats upon us. “So let’s collaborate, from the westernmost island to the easternmost island, and continue the work that we have begun. We all have a responsibility to protect our small earth and this is our part in this big task. If we don’t do our job, the next generation will have to start all over again.”
MC Workshop Background & Introduction – Yimnang Golbuu, PhD, PICRC Dr. Golbuu recollected on the 2nd MC regional meeting for the Measures Working Group in 2010, which was the first meeting for the Marine Working Group. It was at that meeting that this group began more detailed discussions on how to really get at monitoring indicators and methods, which can be standardized and used in all the MC states. By the end of that meeting, the participants had agreed on a proposed set of marine monitoring indicators and methods that met the minimum criteria of standardization and can be applied in all the MC jurisdictions. After that meeting, PICRC began to test the proposed indicators, starting with four MPAs in Palau. After those were done, they went to several islands across the region, including Yap, Chuuk and RMI. The Pacific Marine Resources Institute (PMRI) also visited several islands doing the same thing. In short, all of us have been using the indicators that we had agreed on back in 2010, during that first Marine Measures Group. The same Marine Measures Group is meeting again this week with a purpose to discuss the issues that we faced while testing the indicators and to identify ways to move forward with them. Goals for this workshop include:
Workshop Goals 1 Finalize indicators and methods – achieve this by discussing issues faced while implementing the
agreed indicators and identifying ways to move forward with them. 2 Data management – agree on a way to ensure that data can be more accessible and can be
accessed early so that they can be used for management. 3 Management effectiveness – learn about relevant tools we’ve used in some parts of the region 4 Regional collaboration – come up with an agreement on how we will work together to help each
other to continue our collective effort Dr. Golbuu acknowledged and thanked Franck Magron from the Secretariat of the Pacific Community (SPC) who is here to provide assistance with the database.

4
With regards MC’s goals to effectively conserve 30% of our marine resources, Dr. Golbuu questioned what this might mean to us. He pointed out that while the pursuit of achieving effective conservation to meet the MC goals is critically important for the MC at the regional level, it is also just as important at the local level – not only at each jurisdiction, but also at each site. In other words, there are different scales to consider here – site, national and regional. So we need to be aware that while all this work is important at the regional level, it is also important to emphasize its significance at the local level, especially when management is done at the local level, so we will be able to answer the question, “Are we really conserving our resources?”
I. Capacity Enhancement Project for Coral Reef Monitoring Session 1: Capacity Enhancement Project for Coral Reef Monitoring (CEPCRM) 1. Update on CEPCRM Since 2010 (last MC Measures Marine Working Group Workshop) ‐ Seiji Nakaya, PhD, JICA After PICRC was constructed under Japan’s grant‐aid and inaugurated in 2001, it has contributed to coral reef studies and environmental education in Palau. After recognizing the importance of conservation of coral reef resources through MPA and importance of monitoring, a collaboration project between PICRC and JICA, Capacity Enhancement Project for Coral Reef Monitoring (CEPCRM) was initiated in 2009. The purpose and goal of CEPCRM project was to enhance the technical capacity of PICRC in coral reef monitoring required for management of MPAs and transfer this capacity to other MC jurisdictions. After the project started, we discussed the objectives, indicators and survey methods in the previous regional meeting held in Koror in 2010. Our first pilot sites were 4 selected MPA sites, out of 34 existing MPAs in Palau, and applied the methods to monitor these MPAs. We then trained rangers; developed a monitoring plan; helped to develop the needed database; and drafted a monitoring protocol. We also expanded our work to other jurisdictions (Pohnpei, Yap, Chuuk and RMI). In addition to theses, we also disseminate information on the project activities and survey results through public meetings, international conferences, a web page, newsletters (ReefTalk), a TV program and a number of newspaper articles. In the next five months, we will try to have the monitoring protocol adopted in Palau and have it used in MC jurisdictions as a template. We also expect that PICRC gets funds to help with monitoring work in Palau and MC jurisdictions. We will continue disseminating information and updates through leadership meetings, at the upcoming 12th International Coral Reef Symposium, and other relevant venues and explore future plans of JICA’s contribution to MPA monitoring and MC.

5
II. Regional MPA Monitoring Protocol
Session 2: Marine Monitoring Protocol 2. Introduction of the Marine Monitoring Protocol – Yimnang Golbuu, PhD, PICRC Dr. Golbuu introduced the Marine Monitoring Protocol by comparing it to what may be a typical monitoring plan. Like a typical monitoring plan, the Monitoring Protocol consists of methods and indicators, similar to what was discussed in the 2010 workshop. However, in addition to methods and indicators, the Monitoring Protocol, which has recently been developed, also includes a clear step‐by‐step guide for a site‐specific monitoring plan. This consists of a process of setting up MPAs; for reporting monitoring results; and possible ways to communicate these results back to managers so that they can be used to improve MPA management. The Monitoring Protocol can also be used as a guide to develop a general monitoring plan. In order for it to be useful, however, it needs to be site‐specific, and thus also jurisdiction‐specific. A draft Monitoring Protocol, designed for Palau, has been completed by PICRC, with the anticipation that it may serve as a template for other jurisdictions to develop their own tailored Monitoring Protocol that would ‘fit’ their needs better.
Session 3: Jurisdictional Updates
3. Presentations from all MC states Note: Table below shows only the pooled summary of all jurisdictions, with four FSM states providing their own update bringing a total number of updates to 8). See Appendix 2 for individual updates. MC jurisdictions’ Combined Update Summary Monitoring status
Ecological ‐ All 8 islands are doing monitoring in their jurisdictions. However, most are not monitoring all their designated MPA sites, due to limited human resources, limited finances or limited authority. Fish and coral surveys are done throughout the region, but a few are also monitoring sediment runoff, seagrass and macro‐invertebrates (e.g., Pohnpei & Palau) and water quality (e.g., Kosrae, Palau, Yap & Pohnpei). Others have not completed analyzing their data (e.g., Guam and Chuuk) Socioeconomic – Most of the jurisdictions (6 out of 8) have done a SEM‐P training, which involves conducting a SE survey in a community. Guam and Pohnpei are the two that have not had a SEM‐P training but expect to have it soon, within this year.
Monitoring results
Ecological monitoring results vary across the region: CNMI shows higher numbers of corals in the MPAs (especially in Rota), while others show fish density to be lower in the MPA compared to their reference site (e.g., Pohnpei); and Guam is not done with analysis so has no data to share. Chuuk, on the other hand, shows that fish biomass in inner barrier reefs is larger than those in patch reef areas.
Data manage‐ment
Data management ranges from having no database (i.e., Kosrae, Yap), to using Microsoft Excel spreadsheets (i.e., CNMI & Guam) or using both Excel and Access spreadsheets (i.e., Palau). Kosrae and Yap send their data to Dr. Peter Houk for analysis. Guam is in the process of developing their database.

6
Lessons learned, issues & capacity needs
Need more training on data management and analysis. Preferably, these training will be long‐term programs, rather than short‐term.
Policy and legislation gaps still need to be filled, especially with the relatively recent issue of sea cucumbers in Chuuk and Palau.
Staff/team member turnover – continues to be a common occurrence Need to eliminate observer bias and improve consistency Need to continue to invest in partnership (with agencies and with communities) Manpower and money still limited Need to match data collection efforts with priority management questions Remoteness of some of the islands compounds
Have you used MPA Mgmt Effectiveness Tools? If so, share experience
Of the 8 jurisdictions, 5 have used it; 3 have not.
Future plans for monitoring & MPA Effectiveness Management Tools
Provide more training for Ecological and SE monitoring; need to find funding to carry out monitoring and training programs
Plans to include long‐swim fish surveys (beginning this year) Plans are underway to add more monitoring sites Update GIS, centralize monitoring data and get database training Do more SEM‐P trainings in the region
Breakout Group # 1 on issues and challenges since 2010: 1. Which issues were resolved?
‐ What were the key factors that led to resolution of issues and overcoming challenges? 2. Which issues were not resolved
‐ What were key factors that prevented the resolution of issues? 3. What are likely to be the key issues and challenges for 2012?
Note: Below are summarized tables for all groups. See Attachment 3 for detailed summaries of each group.
Challenges/Issues since 2010 1 Communities – not involved enough; need to build their capacity2 Remoteness of sites 3 Ecological representation – do we need to add more sites? 4 Timing & scheduling work with partners 5 Lack of database – (can do this as a group) 6 Data analysis and reporting – (can do this as a group) 7 Limited funding 8 Communication – need to be more strategic and targeted at right audience
Unresolved Issues since 2010 1 Limited local capacity & funding & lack of political will2 Turnover of trained personnel 3 Geographic issues – may be resolved through design?4 Enforcement – may need separate workshop dedicated to this

7
Anticipated Challenges for this year (2012) 1 Testing and evaluating adaptation strategies
2 Integrating stronger socioeconomic monitoring to ongoing ecological monitoring 3 Understanding local impacts of climate change 4 Data interpretation & communication (e.g., tailoring analyzed data to community level) 5 Linking traditional, state government and national government laws related to enforce MPA regulations 6 How to shift from ‘% of established MPAs’ to ‘% of effectively conserved MPAs
Plenary discussion on issues and challenges that jurisdictions have experienced
in monitoring since 2010: 1 Timing and monitoring schedule. Scheduling work with communities is difficult due to differing priorities
and schedules between partners and communities (timing – barriers to scheduling between all partners.
2 Lack of database
3 Need to involve communities more – how?
4 Communicating data analysis (reporting) to communities and decision makers.
5 Data interpretation and translation (data analysis)
6 Adding to the communication – how do you convey it in a manner that is understood by the community. Also being strategic about what your communicating (appropriate conveyance of messages; know your audience; be strategic)
7 Need to build capacity, especially at community level
8 Lack of social relevance of the effort – the mgmt agencies are disconnected from the communities and entire purpose and goals of monitoring. So basically monitoring is irrelevant – social irrelevance
9 Adding to scheduling and planning for remote places – we have the same challenge of remoteness
10 Ecological representation – do we need to add more sites? If so, need more funding?
END of DAY 1

8
DAY 2
Session 4: Monitoring in MPAs across Micronesia 4. Towards Measuring the Effectiveness of the Micronesia Challenge: Current Status of Micronesia’s Monitoring Activities and Future Directions for the MC
and Beyond ‐ Peter Houk, PhD, PMRI
In the last two years, much collaboration and monitoring progress have been made, as we strove to reach an agreement on a standardized set of measures and process to assess effectiveness of the Micronesia Challenge (MC), However, it is now 2012 and many jurisdictions have yet to define their MC design (i.e., geographic scope and specifically defining 30% of what will be effectively conserved). When we look at the monitoring data, we realize that many monitoring programs are not only MPA‐centric, but also fish‐centric. However, it’s not all about fish or all about MPAs – we need to address a greater suite of questions which will provide enough resolution for management (if MPAs cover 30% of reef, what about the remaining 70%?). While the MC is important, the whole ecosystem is important too.
If we continue to stick with MPAs only, we would be able to answer only one question ‐ MPA efficacy. However, we will miss a whole set of other important issues, including watersheds, gradients of fishing pressures, biodiversity patterns and climate change impacts, among others. The benefits of an ecosystems approach is that it will allow us to see patterns that show how resources are distributed not only within the MPAs but the broader area as well. These patterns will also help us identify indicators of change, which are applicable to the MC. The bottom‐line here is that our monitoring design and approach need to provide better logic and confidence to ensure quality control in science.
Results of the work I did recently in RMI show a gradient of human influence on fish size and abundance – as you move away from population centers (where human influence is greater), you get more and bigger fish. Gradients are great because we can figure out, through time, what is needed for things to be normal so we can determine best response/solution. Similar situation was also found with coral surveys – there was higher density of corals (more encrusting and massive corals) in the outer island of Rongelap, compared to Majuro, the population center. In short, better coral reef foundation was found in Rongelap, than in Majuro, but then again, these results are not surprising. What was unexpected, however, was the influence of apex predators (i.e., sharks). Based on surveys in Rongelap, when shark biomass goes up, the size and density of the parrotfish also go up. In other words, sharks appear to protect the biomass of many highly desirable food‐fish better than a small population on a remote island. Having larger sizes of fish in the water is important to know because bigger fish not only produce more eggs (e.g., a 26” fish produces 86 times more eggs than one half its size at 13”), but they also eat a lot more algae than smaller fishes (double fish size, quadruple algae grazing). It seems that sharks increase the grazing efficiency of grazers, in addition to protecting biomass of many fishes.
Our challenge is particularly complicated as we need to figure out a way to balance the needs of the MC with scientific rigor, in the midst of budgetary and capacity constraints, as well as spatial constraints. Given the vastness of the Micronesia region with many remote and isolated islands, we need to better define the focus of the MC if we want to measure and determine when success is attained. One alternative, which is more realistic and practical, is to limit our monitoring focus to the main islands, rather than all conservation areas across entire countries. After all, the MC is focused upon humans and their ability to sustainably use and benefit from healthy reefs (e.g., fishing, tourism and sustainable livelihoods). And we’ve found that the main islands, where most of the people live, are more vulnerable than remote islands. This way, monitoring capacity becomes more manageable so we can build on capacity and monitor trends and change over time. It’s not that the remote islands are not highly influential – it’s just the scope of the MC – are they realistic to include? If a lack of progress continues with a formal, geographic definition of the MC, it will eventually translate into lack of progress for the Measures Group. If we limit our focus to the ‘main’ islands, then the MC goals become more realistic and 30% effective conservation becomes easier to define. Of course more capacity is still needed and data development remains a work in progress, but effective conservation becomes more realistic.

9
5. Presentation of the results of surveys done across Micronesia & Lessons Learned ‐ Lukes Isechal, PICRC
With funding support from the CEPCRM project, PICRC tested the proposed indicators from the 2010 workshop in several MC islands, including Palau, RMI, Yap, Chuuk and Pohnpei. Surveys were conducted in MPAs and reference sites, with an attempt to sample the different habitats in the MPAs and their respective reference sites. These surveys covered fish (density, biomass and diversity), corals (cover and richness), coral recruits (density and richness) and macro‐invertebrates (density and richness). However, in the interest of time, this presentation will only show results for density and biomass for the fish surveys and coral cover and richness for the coral surveys, just to provide a glimpse of some of our results, as what I’d really want to share in this presentation are the lessons learned. For the survey results, they appeared to be mixed. For the fish surveys, while some MPAs did not show any difference in fish biomass compared to their reference sites, others did, such as Nimpal which showed significant fish biomass, compared to its reference site, in all the habitats (i.e., channel, inner reef & outer reef) that were surveyed. For the lessons learned, during these surveys across the region, some important issues and lessons became apparent as they were consistent everywhere that PICRC staff conducted these surveys. Therefore, they should be considered in this workshop when we are having the discussion to finalize the indicators. Below is the list of these issues: 1. 3 stations sometimes not possible for small MPAs – although an attempt was made to select 3 stations, some of the
MPAs were so small that we cannot fit 3 stations within one MPA. 2. Sometimes hard to find suitable reference site 3. Application of methods needs to be consistent, especially with fish surveys (e.g., need to stay within the belt transect). 4. Using a fish list should be mandatory ‐ we also found that it would be better to use a fish list so that everyone will be
counting the same fish, no matter who the observer is so the data is not influenced by the observer’s choice or how familiar they are with fish (e.g., a counter who is more familiar with fishes would count more different fish than one who knows less).
5. In analyzing the photo quadrat, we need to use the same CPCe (Coral Point Count with Excel extensions) code file to
ensure that the data are consistent 6. The last lesson is that everywhere, data management and data analysis is an issue that needs attention. In summary, for the most part, the indicators and methods that we agreed to use in 2010 were tested and deemed appropriate. However, in testing them we discovered some emerging lessons in terms of site selection, application of methods and data analysis, which we hope will be considered during our discussion to finalize the indicators.

10
Plenary discussion to Improve MPA monitoring indicators and methods
Note: The workshop participants were not able to complete their discussion within the allotted time and thus reporting of results was moved to the following day after a smaller working group, composed of representatives from each jurisdiction, has met to continue the discussion and come up with recommendations to share with everyone. Notes from the discussions prior to the finalized set of indicators can be found in Appendix 4a and 4b. The Final MC Marine Monitoring Indicators and methods (see table below) were finalized after a consensus was reached by the participants.
Final MC Marine Monitoring Indicators and Methods
(Approved via consensus by workshop participants) Survey design:
• At each MPA and reference site, at least one station in one habitat type will be surveyed. The same transects will be used for fish, coral and invertebrate surveys.
– five 50 m transects – survey roughly same transects each year (e.g. based on GPS points, depth and
designated direction) Fish surveys:
• Belt transects (5m x 50m) • Record the number and estimated size of fish on species list • OK to do SPC method or both and we can evaluate in future years
Benthic/Corals/Seagrass Surveys 50 photoquadrats (0.5m x 0.5m) on a 50 m transect tape Analyses by CPCe Corals are identified at genus level (Training needs to be provided to indentify genus for
accuracy and consistency) Coral recruits:
1st 10m of transect by 30 cm or 30 cm x 10 m belt transect Only corals that are 5 cm or less are recorded (genus and size)
(If already doing quadrats for colony size, then doing this recruit survey is not needed, since the recruits will be captured in the size quadrats
Invertebrates: • 2 x 50m belt transects • Species and individual size are recorded
*When seagrass bed is chosen, five data points per 0.5m x 0.5m quadrat along 50 m or shorter transects will be used for benthos. (Palau is currently doing both photo and in situ and will evaluate)

11
Session 5: Status of Socioeconomic Monitoring 6. 2009 Hatohobei Community Socioeconomic Survey‐ Rosania Victor, HRRMP
Intro Helen Reef is a protected area of the Hatohobei State, located about 300km southwest from Koror. It is one of the largest MPAs in Palau and currently the largest PAN site. This survey was done as part of the SEM‐P training so we had many agencies working with us on this. Why this survey was important to us is that Helen Reef is owned by the people of Hatohobei and such socioeconomic surveys give us the tools to engage them Helen Reef’s management.
Threats Illegal fishing by foreign fishermen – its location is very close to Indonesia so we constantly have to deal with fishermen from this place.
Local overharvesting – while most of Hatohobei people reside in Koror, when they do visit H. Reef, they take as much fish as they can to bring back to Koror. However, this doesn’t happen frequently.
Coral bleaching – we’ve had some bleaching in the past and with the continued warming in sea surface temperature, this remains one of our biggest threats.
Sea level rise – as a low‐lying island, this is also one of our biggest threats Local actions
One of the major local actions taken to help reduce some of these threats was to create the Helen Reef Act in 2001, which declared Helen Reef as Marine Protected Area. Included in this act was the Helen Reef Management Board, which was tasked to create the Helen Reef Management Plan. Since then, most of our efforts have been focused on developing the management plan and building capacity, initially in underwater monitoring and recently in socioeconomic surveys. Due to our recent socioeconomic surveys, we revised our management plan to include socioeconomic monitoring.
Survey objectives
For this survey, our objectives include: 1) Determine perceived changes in resources, since the new regulations were put in place 2) Determine perceived level of enforcement 3) Collect basic demographic information 4) Determine community satisfaction with management (support for process and level of agreement
with rules) 5) Identify community members’ long‐term visions for Helen Reef (including interest and feasibility of
relocating back to Hatohobei). 6) Determine ways to improve management
Survey results
Since most of the people from Hatohobei State live in Echang Village in Koror, this was our target group. We surveyed 94% of the target group (97/103).
70% of the respondents lived on Hatohobei as a child and 81% would like to move back in the future. We found this interesting because this includes individuals who were born and raised in Koror, but would still want to move there. 73% have not gone there in the past 5 years.
Poaching by foreigners considered to be the main threat to Helen Reef. Poaching and overfishing by locals and climate change, ranked second and third, respectively.
Overall, the community members have a good understanding of the rules and regulations for Helen Reef, especially of the no‐take area. (93% of the community members know that commercial fishing is not allowed in the no‐take area.)
60% believe no‐take area regulation has led to more fish; 33% did not know if this was the case. The fact that many people in the community still did not know about increased fish numbers, suggests that we haven’t done good enough work in sharing the results of the underwater surveys.
Most respondents view Helen Reef Program favorably, but 1/3 feels that the rules don’t provide enough access to fish and other resources
87% would like to be more involved in the management of Helen Reef Program.

12
What do these results mean?
A large majority of the community members support the work of the Helen Reef Program because they feel that their families benefit from the rules that are in place. However, there are a few areas that still need improvement: a) Involve the community more in H. Reef’s management b) Increase enforcement effort c) Improve transportation to H.Reef
7. Socioeconomic Assessment on the Perspective of Divers & Snorkelers visiting the Rock Islands Southern Lagoon Management Area ‐ King Sam, KSG Dept. of Conservation & Law Enforcement
Objectives: 1. To examine the perceived crowdedness of different dive sites 2. To understand expectations of divers and snorkelers who visit the Rock Is. 3. To examine experiences and satisfaction with diving and snorkeling 4. To explore levels of willingness of divers and snorkelers to support high quality tourism and low environmental
impacts 5. To determine the willingness of visitors to financially support the Rock Island and the fee amounts 6. To explore problems, issues and suggestions regarding high quality tourism experience and low environmental
tourism impacts among related tour operators (for key informants) 7. To understand demographic profiles and patterns of activities of the divers and snorkelers Process: 1. Development of survey (done with partners – e.g., PICRC, CEPCRM, BTA, NOAA and MCT) 2. Translation (4 different languages: English, Japanese, Mandarin & Korean) – drafted the questionnaire in English, had it translated into other languages and then back‐translated into English to assure consistency and intent of question. Survey Method, Distribution, Data Collection & Analysis
Target number: 1700 Surveys Visitors who pay the permit to dive/snorkel
– Currently at approximately 200 – Deadline is May 31st, 2012
Self‐administered – Average time needed for survey is 11min 27sec
Distributed and collected on‐site Data entry and analysis conducted at PICRC A component of this is key informant interviews to follow
Issues/Challenges
Lack of incentive can deter some people from participating in survey Large area to cover Language barrier Logistics (have to meet participants at proper time, under ideal conditions) Needs dedicated time

13
Breakout Group # 2 on SE Measures regarding status, issues and future plans of SE monitoring in each MC jurisdiction 1. What is the current status of SE monitoring in your jurisdiction? 2. What have been key issues & challenges to conducting and using SE monitoring? 3. What is your jurisdiction hoping to accomplish over the next two years in the area of SE monitoring? Note: See Appendix 5 for detailed summaries of each jurisdiction Most jurisdictions, with the exception of Guam and Pohnpei, have participated in the SEM‐P training, which is sponsored by NOAA, MCT and PIMPAC. While most of these SEM‐P trainings were focused on MPAs, CNMI did their survey on a public park. This showed that the process used by SEM‐P, while designed for MPA sites, is not necessarily restricted to only MPAs, but can also be applied to other types of socioeconomic surveys. On the other hand, other jurisdictions have conducted SE surveys without following the SEM‐P process. These include CNMI with their fishermen’s survey, which focused on understanding traditional knowledge about fisheries, and Palau with their earlier MPA evaluation surveys which were done before SEM‐P was developed. In addition, Palau is currently doing a survey to determine carrying capacity of the most popular dive sites, based on divers’ perceptions. This survey is jointly done by KSG and PICRC. Overall, SE surveys in the MC states is few and far between, relative to ecological surveys and monitoring. Palau has done the most SE surveys with 15 surveys done since 1998 by various agencies. Unfortunately, all of these surveys were done independently of each other and thus were not streamlined to meet overlapping objectives. Overlapping key issues related to SE monitoring amongst the jurisdictions include limited or lack of skilled persons to do this work, in particular designing the surveys, analyzing and interpreting the data. Limited funding, not surprisingly, was also mentioned amongst all the groups. Another issue, rarely experienced in ecological surveys, is dependency on other agencies and/or communities to do the surveys. For example, it often takes a long time and much effort just to organize the fieldwork in a village, versus getting on a boat with dive equipments and driving to one of the MPA monitoring sites. Finally, it was echoed, repeatedly by the participants, that SE is simply not yet considered a priority for most MPA monitoring efforts and among the reasons for this, is due to lack of awareness on the part of the implementing agencies and/or donor agencies. All the jurisdictions clearly emphasized that they want to do more SEM‐P trainings because they simply do not have this capacity at this time. All the individuals who were trained during the first round are often the same individuals tasked with ecological monitoring so they cannot be relied upon to ensure continuity with SE monitoring in their respective jurisdictions. In addition building capacity in SE monitoring, the participants recognized that they also need to work more with other sectors (e.g., Public Health) if they want to do SE surveys right. Another activity that was mentioned several times, and is perhaps one of our greatest challenges for the jurisdictions, is figuring out how to incorporate SE work with ecological work ‐ and not stop there, but also figuring out how to apply survey results to influence management.

14
Plenary Discussion for SE Measures
In yesterday’s discussion, we mentioned social relevance so in the context of MC, can we come up with social measures of success? Some of this is being done via the MC Scorecard.
If we identify constraints, we’ll be able to determine how we could move forward with this. But was thinking
can we move forward if the same people have to work in both ecological and SE monitoring or should we (Marine Measures Group) continue to consider SE as a secondary priority? This goes back to a comment on building capacity within resource management agencies, but possibly with separate resources. We can link with other sectors but it will be difficult to come back with results. With PICRC, they created a separate position for SE and that’s why this progress was made.
Not sure if we can establish a separate position because of limited funds and people. But now PIMPAC is doing a
major effort to train enforcement officers so maybe we can do similar effort for SE.
Sometimes the collected SE information is not acted upon and used to improve management. An example of one of our MPAs that was established based on both SE and ecol surveys – Ngederrak Reef was established as a temporary MPA based on community concerns. After it was established, the ecological monitoring came into the picture because the 2 year sunset clause was enough to ensure ecological goals (e.g., maintain function).
If SE becomes part of PA management in Palau, it can be semi‐mainstream? SE will be required to be incorporate into management plans for sites that want to access PAN funds so eventually, all PAs in Palau will need to incorporate SE monitoring into their plans.
Need to make the relevant link from the SE to the ecological work.
END of DAY 2

15
Day 3 Session 6: Capacity Needs (Plenary discussion) – Facilitated by Trina
Identify issues, problems and capacity needs for coral reef monitoring in each jurisdiction (both ecological and SE)
Needs CNMI Kosrae Chuuk Palau Pohnpei Yap Guam RMICoral taxonomy (in situ and analysis of photo quadrats)
X X X X X X X X
Size estimation of fish X X X X X X Address integration of SEM and ecological monitoring
X X X X X X X X
Diving certification X X X X X X X X Seagrass training X Training in community‐based monitoring X Data analysis (SEM and ecological) X X X X X X X X Training in how to use the database X X X X X X X X Training in SEM monitoring X X X X X X X X Training in SEM and ecological interpretation and reporting
X
X X X X X X X
Training in social marketing X X X X X X X X Equipment: ‐ Dive gear ‐ Cameras ‐ Boats ‐ Servers and software ‐ GPS ‐ Computers ‐ YSI probes
Taxonomy reference materials X • At least one dedicated person per
jurisdiction devoted to SEM • Formal education for monitoring staff • Direct aid from Australia Embassy
Discussions on Capacity Needs:
Need training in socio‐economic monitoring (SEM) and on ecological interpretation and reporting How do you incentivize training?
With ‘reporting’ which aspect are we referring to? Presenting to the community, writing up the reports, or what? It’s both – developing the report and communicating it to the community.
We need to move from assessment to monitoring – there may be trained people but not doing this regularly after they are trained. We need to dedicate at least one person devoted to SEM so we can have a better chance of beginning this process.
Need to know a set time to discuss this. MCT is planning to host a stand‐alone SE regional monitoring. We recognize now that there needs to be a formal vector to get formal training.
For SE, some found it difficult to identify more specific capacity needs as SE indicators have not been identified yet. For now, however, there is a strong message coming from the participants that more SE training is needed as capacity is still very low and also that we need to really think how to integrate SE and ecological monitoring data.

16
Parking Lot 1. Common parameters for effectiveness ‐ Everyone agreed to the recommended indicators to help with this. Additionally, it’s also not just the numbers (e.g., fish abundance, coral cover, etc.) that we look at but how does it look over time and how does it compare to the reference or control site.
2. Focus on main islands
‐ Everyone agreed to this suggestion as a minimum standard for the MC regional monitoring effort. This is because we need to be realistic with our given resources and capacity, against the MC timeline. However, it doesn’t mean that the remote islands will be neglected – just that they do not fall into the minimum regional measures standard.
END of DAY 3
DAY 4
III. Regional Database Management Service Session 7: MC Database 8. MC Monitoring Database – Lukes Isechal (PICRC) & Franck Magron (SPC)
Progress on development – Lukes Isechal
Situation Many organizations and agencies collect reef data, which has resulted in a lot of data that have been
accumulated over many years. . These data sets have often been stored in Excel files in personal computers. Others have not even been entered into a spreadsheet yet and thus still on datasheets. Some are stored in such a way that the only person who can decipher them is the one who entered them. Finally, some got lost when the personal computer that stored them had mechanical problems. In short, much of these reef data are either lost or available but inaccessible.
Need Central repository for the region where reef data can be safely stored and accessed when needed.
Goal 1. Quality ‐ incorporates the necessary quality controls 2. Security – provides enough security to protect integrity of the data 3. Standardized – to ensure consistency of data 4. Simple – easy data entry and generates simple reports
Access – convenient, obtainable and manageable Progress Due to opportunistic events, several agencies and individuals have made it possible for us to meet this
need. The MC Measures Marine Working Group is developing a standardized monitoring protocol which includes developing a regional database, with assistance from partners, including PALARIS and SPC who

17
have the expertise in this area. And funding for this effort was provided by MCT and CEPCRM) Data vs. Information
What we really want is not just a place to store data, but also ‘translation’ of these data into useful information.
Not done yet
QC begins in the water; consistent app of the methods; check data sheets right after data collection; and of course need to populate this database – if nothing gets entered there, then it has no purpose. We need to not only ensure that all the formulas which support the query are right and tighten security and back –up controls, to ensure QC, but also ensure that QC begins at the very beginning of this process – in the water, which means ensuring the needed capacity should also be in place. Discussions needed:
a) housing the database b) data sharing c) reporting d) role of PICRC
MC Monitoring Database (and data backup/sharing) – Franck Magron
For this session, Franck showed what the database looked like; explained the concept behind its design; and
demonstrated how to enter data into it. Some examples are provided below: Structure of the data
‐ each site is composed of permanent stations (no change over time) ‐ stations can be grouped according to their status (MPA/Reference) and exposure
Stations are resurveyed regularly for fishes, inverts, coral recruits, seagrass underwater visual census (UVC)) and benthos (CPCe)
‐ transects are selected for station and monitoring type ‐ The year of the survey is the year of the start date
Data entry steps – (shown with demo page – see Franck’s PowerPoint presentation in your CD copies)
Discussions on MC Monitoring Database
It is not case‐sensitive – you just use the Drop Down List How would you use this to do t‐test, since you have those lumped or grouped? There are over 170 queries. So
if you wanted to run statistics, it would be better to copy and paste into a stats program rather than adding more queries. Otherwise, with too many queries, it could take forever for you to locate what you’re looking for.
In terms of quality, would this allow you to log in names so that there is no inconsistency in spelling? Yes, we select species name from the Drop Down List. Also for stations, once you type in something, you can always use the Drop Down List. If you entered something with a wrong spelling, you can just edit it.
For reporting – can we still do our own reports? This design is pre‐set to do reports so it can save you time with this, but if you want to do a different report, you’re still able to do it.
Dave – going back to the question about incorporating sites, which are neither MPAs, nor reference sites, would it be necessary to have “Other” category so that we can maintain consistency with sites that are not MPAs?
Is there a way to design this so that for the report, we can use local names? No, that would be too difficult because of different names for the same species and even different names for the same species at different growth stages.

18
IV. MPA Management Effectiveness Tool
Session 8: Management Effectiveness
9. Introduction of a Marine Protected Area (MPA) Management Effectiveness
(ME) Tool – Steven Victor, TNC In introducing the MPA Management Effectiveness tool, Steven tried to explain it within the context of what the participants of the workshop are already doing in conservation and for the MC. He acknowledged that some of the participants have been exposed to it or heard about it, and for those who have not, should have by now, given all the effort he’s put into this. What is it? This is a tool that you can use to see how you’re doing against meeting goals and objectives, whether they are social or ecological. So depending on the goals, this will measure how your efforts are doing in meeting these goals. In other words, it is not so much about how many fish is there, but rather, if the actions we’re taking will help us to reduce the targeted threats. Why is it needed? Leads to better management assistance in effective allocation of resources; promotes accountability and transparency and help involve community; builds constituency and promotes protected area (PA) values. For involving the community, we’ve come to the point where we realize that for everything we do, we need to involve them. How does this tool work? (6 Elements of the Framework)
1. Context – begins with reviewing the context 2. Progresses through planning and 3. Allocation of resources (inputs by 1 person, by consensus or by scientific or social data) – so getting us back to
the time when we were coming up with the rational to establish the PA 4. As a result of mgmt actions (process) 5. Eventually produces goods and services (outputs) 6. That results in impacts or outcome
General approaches – this is not the first time such a tool has been developed as there are other approaches:
a) Detailed site‐level assessments b) Quicker site‐level approach (this tool) c) Others developed for a system‐wide scale
The second approach was selected because it can link with the first approach when dealing with biological monitoring; links with third approach if one wants to know the broader jurisdictional level. So has this flexibility. Our approach – a) Quicker scorecard system (questionnaire format) b) Site‐specific c) Conceptualizes the general chronological stages of MPA development management continuum d) Site assessments can potentially be aggregated to present a picture of a network of site
The Conservation Measures Partnership (diagram) 1. Conceptualize 4. Analyze, use & adapt 2. Plan actions and monitoring 5. Capture & share learning 3. Implement actions and monitoring

19
Why are we developing this tool? Isn’t our tool box already full? Plan Actions and Monitoring (step 2) – this not the same as the monitoring you’ve been doing in this workshop but more about planning ‐don’t get too discouraged if you don’t get your answers right away. Implement Actions and Monitoring (step 3) – often times we begin with step three, having completely ignored the first two. Or, we focus so much on this 3rd step because it’s easier and we like it, but its relevance will be more meaningful if we know where it came from. Also we often get stuck in this 3rd box and don’t know how to get out of this box. So important to know that we need to do adaptive management – we’re not trained as mangers, but in counting fish and corals – not managing people. But we’re being asked to use our training to do planning, management and even to share the lessons learned even though we’re also not trained as communicators. This tool is meant to help us by showing the linkages between these different boxes. We’ve been asked to use many tools and be able to do so many things so we need to know how to accomplish all these. So the management evaluation tool, which we hope you’ll adopt, is trying to link monitoring data to adaptive management. How resources have changed over time? You’ll need to be able to identify those connections between monitoring data and management gaps, so you can identify actions needed to adapt and for this we always go back to the planning process. Management of natural resources is not easy because we’re managing people – and not only 2‐3 employees but whole communities. Discussion on MPA Management Effectiveness Tool introduction
Do you have any examples out there where it’s gone full circle? Yes, and in fact, Delegate Wayne Andrew will show you their example.
There is a similar tool that LMMA Network uses ‐ we have the same steps but it’s not the image but how you interpret the cycle. For communities it’s how you interpret that image – I presented CBAM (Community Based Adaptive Management) with similar steps but it’s a spiral diagram, rather than circular one. Once you get to step 3, you implement the activities and depending on how you implement your work, it will affect the others ‐ thus the spiral shape.
Excellent point! We always present things in a logical order. What is important is that these are the elements that you need to consider and this is what needs to be done. You have to do adaptive management ‐ it’s something that just has to be done – so you cannot only focus on one box because depending on how successful you are in one box influences your success (or lack of success) in others.

20
10. Testing the MPA Management Effectiveness (MPA‐ME) Tool in Sites Across Micronesia – Lukes Isechal, PICRC
To be better determine management effectiveness of MPAs, this tool attempts to capture the whole management continuum into 5 management levels and after a series of questions you get a score. We’ve tested this tool in 11 MPA sites in Palau, Yap, Pohnpei and RMI. It’s a scorecard system with questions arranged into 5 tables, each representing one management level and it is conducted through a facilitated group. Components of the 5 levels:
1 ‐ Initiation ‐ Identifying the drivers of site selection ‐ Identifying current or past management
efforts the site ‐ Public consultation ‐ Formal designation ‐ Delineation of boundary
2 – Established
‐ Development of the planning process ‐ Development of the management plan ‐ Endorsement of the management plan ‐ Identifying the management body ‐ Operations (e.g., preliminary budget and
personnel, procedures for core operations & basic equipment)
3‐ Implemented ‐ Management body has the capacity to implement
the plan ‐ Begin monitoring (ecological and SE) ‐ Awareness activities ‐ Community support of the MPA ‐ Enforcement activities ‐ Demarcation ‐ Exploration of sustainable funding & alternative
livelihood opportunities
4 Sustained ‐ Capacity building opportunities for management
staff ‐ Incorporate more formalized education/training
programs ‐ Active enforcement ‐ Integrating monitoring results into decision‐
making process ‐ Established mechanisms for leadership and
stakeholder input ‐ Components of sustainable financing implemented ‐ Status of biophysical (ecological) indicators 5 – Fully functional (institutionalized) ‐ Implementation of a sustainable finance plan ‐ Reduction of threats (including illegal and/or
destructive activities) ‐ Integration to larger spatial planning (zoning or
land‐use) ‐ Regular evaluation of management plan ‐ Staff proficiency increased ‐ Connectivity and networking ‐ Economic contribution of the MPA ‐ Ecosystem services conserved ‐ Government commitment of resources in place
Results 4 sites are in management level 1 or lower (if you score 75% or higher you go up to next level) 2 sites at level 2 3 sites at level 3 1 site at level 4

21
Trends
Local Knowledge: 7 sites were selected based on local knowledge Designation: 8 sites have been formally designated Management Plans: 7 sites have; 1 site in drafting phase; 3 sites have reviewed theirs; 2 sites have action plans Monitoring: 6 sites have initiated ecological monitoring; 2 sites doing SEM Enforcement: 6 sites have enforcement activities
Equipment: 7 sites lack basic equipment & facilities Personnel: 5 sites have adequate staff size for critical management activities Budget: 7 sites’ limited budget impacting management capacity Sustainable financing: 2 sites have seriously explored this
Fish for thought: ‐ Is there a need for ME tool? ‐ How could it be calibrated better to capture the ‘reality’ of management? ‐ Is it able to accommodate the unique community‐based management efforts? ‐ Usefulness at jurisdictional and regional level?
How best to aggregate the questions into broader categories? (governance, legal framework, research and monitoring)
Questions deferred until after Delegate Andrew’s presentation
11. Feedback from pilot sites for the MPA ME Tool – Delegate Wayne Andrew, Hatohobei State
I think this tool is a really great tool and I encourage you all to use it. We also have a similar tool with LMMA and that’s also good. As Steven and Lukes showed, there are 5 levels of process in this program. It was interesting to learn that, through this tool, we realized that we’ve actually gone through all the 5 levels. We’ve been working for so many years and this helped to give us the bigger picture – something that is critically needed once in a while. 1st part ‐ we scored really low because of 3 things that we did not do well in the beginning: 1. Data was available but not considered in the planning; 2) despite having started the program, we still did not have clear boundaries – we only had a law that said 1mile around, but this didn’t help to show the take zone and the no take zone 2nd part we scored higher (hi average) ‐ three things that could have made it higher
‐ Adequate number of staff. There is still a need to get more trained people in enforcement, management, etc. ‐ Facilities and equipments – example is a bigger enforcement boat ‐ Budget – scored low because even now with the Green Fee that is supposed to be available, we’re still not
getting the flow of money
3rd part of management implementation – scored low ‐ No clear boundary markers ‐ ID activities but did not implement them
4th part ‐ areas that need improvement
‐ Monitoring data needs to be analyzed

22
‐ Enforcement capacity (training needs) ‐ Community was not fully involved ‐ Boundary markers – continued to pull us down because we don’t have them
5th – management institutionalized
‐ Scored a bit low on this mainly because even though we have explored some options of sustainable financing, we haven’t actually started
‐ Did not use data to improve management ‐ Government commitment to provide resources – Green Fee is part of our sustainable financing scheme
Points to consider 1.. Very helpful because showed us the big picture. However, would like to insert a timeline in there to show it better. Because each of us came into the effort at different times, it helped to have the Governor there who was there from
the beginning. Whether or not the original players are still involved in management, it’s still helpful to have them be involved.
2. Realized that in doing this survey, it’s most important to know where you scored low so can re‐focus effort on those
areas. 3. For someone who has just started or about to start, he/she needs to be involved in this discussion so that person can
hear what had happened and what could happen. So that in the future, when we talk about management effectiveness, they fully comprehend what we’re talking about. At least ME has been defined and that’s great!
4. Noticed that some of our staff was not speaking enough during the discussions so this is something we need to think about.
5. Language – because we spoke in Tobian, Lukes and Steven didn’t really understand but their skills in facilitation still helped us finish the work fast. Discussion: ‐ The questions in this tool are all supposed to be relevant. With boundaries the boundaries having to be clearly
marked, this is needed for effective enforcement. We also recognize that our sites are established due to traditional knowledge, but that question on science is there because this tool was originally designed in Indonesia. So we kept it but added the traditional knowledge in there. Also recognizing the complexity of the issues, we don’t just ask for Yes and No questions but allow for explanations. Maybe you can help us to determine how we can rationalize the answers in those questions.
‐ Going back to the boundary issues, they scored low, too, because there was even a disagreement on the boundary location amongst the management group.
‐ I think this shows that the tool is useful because it raised these issues. So the score itself is not important but the discussions that are generated from those scores are valuable.
‐ As for the cycle, I think this is the ideal management cycle and the important point to note here is to identify which part you’re stuck in. So you can figure out why and find a way to get out of that stage.
‐ Instead of a YES/NO type system, may be the design will be more on gauging progress. The tool could help the site managers to self‐evaluate and to gauge their progress rather than a YES or a NO, as this one may not be very helpful to the community. As the tool was designed in Indonesia, they did this only with a Yes or No and we’ve already made some changes to it to better fit our situation and we will take your point but would need further discussion to put some rational for each score. This tool is meant to get at some kind of standardization across the sites. So we definitely recognize that there is a range and progression, but this one is more at standardization.
‐ So if the output is for both local and regional look, then something missing is the overall biological health of the MPA and amazing biological significance. Another example comes from Kosrae with two MPAs – one of them is a dredged

23
channel but very small and the other is huge, the Utwe Biosphere Reserve, but this tool makes them look the same when they are not.
‐ We often get stuck in level three because we tend to focus on the threats which never get resolved. Also this tool looks like it is putting pressure on communities (e.g., boundary markers)… So how do we take into account some unique managed areas in Micronesia – no one goes there, no buoys but they achieve their objective?
Recommended sites to carry out ME Tools (done in Break Out Group #4)
Island/Jurisdiction Next ME :Pilot Sites Island/Jurisdiction Next ME :Pilot Sites CNMI Managaha & Bird Island Chuuk Onunun & SapukGuam Piti & Achong Yap Reey & Nimpal Pohnpei Enipein & Dehpek Palau Ngiwal & PeleliuKosrae Utwe (BP) & Tafunsak RMI Arno & Namdrik
12. Update of Past Management Effectiveness Efforts: Demonstration of a Similar Tool in Lenger Is., Pohnpei – Eugene Joseph, CSP
Application of the WCPA‐Marine/WWF guidebook on evaluating effectiveness, “How is Your MPA Doing: A Guidebook of Natural and Social Indicator for Evaluating Marine Protected Area Management Effectiveness” This is the book that later evolved into SocMon and later SEM‐Pasifika and now we’re using SEM‐P. This project was done in 2003 and we did this to look at how some of our MPAs were doing. Like many other places, we have similar MPA issues – lack of capacity, funding, and technical resources so it’s not easy to do all that we need to do regarding MPA management. However, we still need to do what we can and we still need to evaluate how these MPAs are doing. We do MPA management effectiveness evaluations because they:
1. Guide us with adaptive management strategies to improve MPAs’ performance 2. Help us to prioritize projects ‐ not only looking at how the communities want to protect their MPAs but also how
state and nation‐wide ecosystems can benefit from it 3. Improve accountability 4. Implement measures to maximize MPAs’ benefits to the society
Lenger Is. is a designated MPA, but it is right next to the airport. So this is one of those lessons we’ve learned ‐ when selecting a site, need to consider four factors: 1. Social Characteristics – how many people are impacting this area 2. Institutional arrangements – is led by the community, by the government or by NGO? 3. Outreach training, stakeholder participation 4. Challenges for this particular MPA (e.g., location) Since we worked with the community, we only picked one indicator from each of the three sections of this book.

24
Section Indicators
Biophysical Focal species, abundanceSocioeconomic (12 informants) Local values & beliefs regarding the marine resources Governance Understanding of the rules & regulations by the community
Section Results Biophysical All focal species, with exception of humpback snapper (Lutjanus gibbus) were found
in the MPA. While absent in the MPA, this species was found in the reference site. Monitoring will continue so hopefully we’ll be able to figure this out.
Socioeconomic ‐ 45% of this community fishes at least once per week ‐ Nets, sling spears, and hand‐lines are the primary gear ‐ Serranids, Scarids, and Siganids made up the majority of the catch
Governance ‐ Of the 12 respondents, 2 were not aware that Lenger Is. had rules and regulations ‐ 9 of the respondents said that it was a ‘no‐take or no fishing zone
It may be fun to go out diving and collect data but what is your data actually doing? For LMMA, we’re using the CBAM as a guide for adaptive management ‐ similar to that diagram Steven showed with the different stages – are your data showing something? For us, our monitoring is showing that our MPAs have more fish than their reference sites. However, the communities who survey their top 5 species show the opposite – more fish in the reference sites. When we asked about this, they told us that they monitor during the time when there are more fish. This was an important finding for us. Another story is when we went to monitor during high tide. As we were getting into the water, the chief asked what we were doing so we said, “We’re monitoring.” Then he said, “No, let’s go have sakau.” We were confused with his remark and asked him “Why?” He said, “Because it’s high tide and the fishes are in the mangroves.” Not only did this survey help us to learn the tools but it also helped us afterwards to expand our education and awareness efforts by incorporating these traditional knowledge and methods into that program. For example, even though we talked to community about spawning season, they would sometimes talk about breadfruit season. We did not make the connection between these two until we did the SE surveys. So the tool we used not only helped our own programs, it also encouraged the community to do conservation but doing it their way ‐ connecting traditional knowledge and management with scientific monitoring. Session 9: Discussion on MPA Management Effectiveness Tool Guiding questions
1. Is there a need for such an ME evaluation tool? 2. How can it be calibrated to better capture the ‘reality’ of mgmt? 3. Is the tool able to accommodate the unique community‐based mgmt efforts? 4. Usefulness at jurisdictional and regional level?
Lessons Learned & Reality Check :
‐ 75% is passing grade so respondents try to get to 75% ‐ Need way to get more objective answers

25
‐ Need to tweak the tool by putting questions into proposed categories, and not by level should come out with less biased results
‐ Could respondents use % as answers? ‐ Timeline – not incorporated in tool but can be included. May be based on score over time? ‐ Need to ensure that ‘score’ is not seen as judgment on community managers, etc., but that it’s intended to help
communities to self‐assess their efforts. ‐ What if community does everything right but then funding breaks down – and they continue to adapt? Can this
be captured with this tool? Possibly, but may get answers in several sections. ‐ Issues with weighting of each question:
o Wayne views tool as what we would need to do vs. getting the score. It’s a way to check in and address deficiencies
‐ Financing question: Do you have access to sustainable financing? Are you using sustainable financing mechanism?
‐ With mainstreaming PAN, can this tool remain flexible to accommodate PAN evaluation schedule? Specific goals per year, not over whole management plan?
‐ Some questions are very lengthy – they seem to encompass multiple issues so hard to give answers ‐ Can we simplify for communities? ‐ Have tried to select relevant questions from Indonesia tool, but need additional feedback ‐ May be good to have external participants to help question – provide tough love ‐ Levels may not be sequential/relevant for Micronesia ‐ Incorporate SE indicators when they become available ‐ Useful for individual sites but may be too subjective for regional evaluation for MC. May be a way to decrease
subjectivity is through small working group ‐ Is there a way to measure if communities are adapting ‐ e.g., doing action because of results of this tool?
o Currently not in there but hope to tie it to score and put some standardizations to it with some clear rationale.
‐ Tool will be disseminated to the group for review. Current timeline to finalize this tool is for this version to be completed by June so send comments before then.
Session 10: Specific Regional Collaboration Below is an extract of some of the future collaborative activities the participants identified during Group Breakout #4. See Attachment 6 for the complete list by each group. Set up standard indicators for monitoring management effectiveness (not just conservation effectiveness) Everyone should do at least one round of the MC marine monitoring protocol, data entered into database and
analyzed. Also present outcomes (how this information has been used to influence decisions) Shared learning in taxonomy/data/database. Share resources, including human resources (e.g., scientists, managers & community leaders). This can be done
through learning exchanges. On‐site database training at each jurisdiction with follow‐up to continue communication. Socio‐economic monitoring – need assistance at local and regional level
Critique of monitoring protocol – what works, what doesn’t? SC to determine a more formal recognition of the Working Group members. Do learning exchanges (LEs) between monitoring groups from all jurisdictions – this can assist other
jurisdictions in meeting their capacity needs.

1
Finalizing the Regional MPA Monitoring Protocol:
Coral Reef Monitoring and
4th MC Measures Group Workshop
6 –9 February 2012 Koror State Government Assembly Hall/
Palau International Coral Reef Center Conference Room Koror, Palau

2
Contents Contents .................................................................................................................................... 2 Acronyms ................................................................................................................................... 2 Workshop Objectives ................................................................................................................ 3 Output and Deliverables .......................................................................................................... 3 Program ..................................................................................................................................... 4 Facilitators ................................................................................................................................ 6 Secretariat ................................................................................................................................. 6 Attachment 1. Participants List .............................................................................................. 7 Attachment 2. Minutes of Discussions of the Previous Workshop ............................................ 9 Attachment 3. Status of Existing MPAs…………… …………………………………………….13
Acronyms
BMR Bureau Marine Resources CCS Chuuk Conservation Society CEPCRM Capacity Enhancement Project for Coral Reef Monitoring CNMI Commonwealth of the Northern Mariana Islands CSP Conservation Society of Pohnpei DEQ Department of Environmental Quality FSM Federated States of Micronesia KCSO Kosrae Conservation & Safety Organization JICA Japan International Cooperation Agency MC Micronesia Challenge MCT Micronesia Conservation Trust MIC Micronesians in Island Conservation MICS Marshall Islands Conservation Society MIMRA Marshall Islands Marine Resources Authority MPA Marine Protected Areas PAN Protected Areas Network OEK Obiil Era Kelulau (Palau House of Delegates) PCS Palau Conservation Society PICRC Palau International Coral Reef Center PIMPAC Pacific Islands Marine Protected Area Community RMI Republic of the Marshall Islands ROP Republic of Palau PMRI Pacific Marine Resources Institute SPC Secretariat of the Pacific Community SPREP Secretariat of the Pacific Regional Environment Programme TNC The Nature Conservancy YapCAP Yap Community Action Program

3
This workshop is hosted by PICRC/JICA collaboration project: Capacity Enhancement Project for Coral Reef Monitoring (CEPCRM) with funding support from JICA, Palau International Coral Reef Center (PICRC), The Nature Conservancy (TNC) and Micronesia Conservation Trust (MCT). Workshop Objectives I. CEPCRM a) Participants understand status of CEPRM II. Regional MPA Monitoring Protocol a) Participants obtain outline of protocol. b) Participants share issues/challenges in implementing monitoring. c) Participants share the status and trends of monitoring activities of each jurisdiction as a basis for discussion to make future plans and to improve monitoring capacity. d) Participants arrive at a consensus on the proposed regional monitoring indicators and methods with latest proposed modifications. e) Participants share progress and future directions of Socioeconomic monitoring. f) Participants identify current capacity needs (e.g., resource, capacity, policy, etc.) to implement agreed monitoring methods. III. Regional Database Management Service a) Participants arrive at a consensus on the proposed regional data management service. b) Participants approve process for regional database management. IV. MPA Effectiveness Tool a) Participants understand MPA management effectiveness tool, its needs and application. b) Participants agree on the work plan for MPA management effectiveness tool. V. Regional Collaboration a) Participants identify next steps and agree on future regional collaborative activities. Output and Deliverables (1) Workshop Report (2) List of capacity gaps for implementing the approved regional and standardized MPA monitoring methods (3) Regional collaborative work plan towards implementing the approved regional MPA monitoring methods

4
Program Day 1 (Monday, Feb 6): 8:30 Registration9:15 Opening Remarks Mrs. Sandra S. Pierantozzi,
PICRC CEO/CEPCRM Project Manager
9:25 MC Workshop Background and Introduction Dr. Yimnang GolbuuChief Researcher, PICRC
9:45 Introduction of the Participants and Roadmap Ms. Tiare Holm I. CEPCRM 10:00 Session1:
Update of activities since 2010 Workshop from CEPCRM Dr. Seiji Nakaya CEPCRM Chief Advisor
10:15-10:30 Coffee Break, Group photo II. Regional MPA Monitoring Protocol 10:30-10:50 Session2:
Introduction of monitoring protocol (including indicators and monitoring methods)
Dr. Yimnang GolbuuChief Researcher, PICRC
10:50 Session 3: Update ecological and socioeconomic monitoring activities since the 2010 Workshop at each jurisdiction (15 min. presentation + 5 min. Q+A)
Status of establishment and management of MPAs Status of monitoring Data management Lessons learned, issues, capacity needs Status of MPA Management Effectiveness Tools Future plans for ecological/socioeconomic monitoring
incl. MPA management effectiveness tools
(1) Yap (2) Chuuk
11:30 Lunch 13:00 Report from each MC jurisdiction
(3) Pohnpei (4) Kosrae (5) RMI (6) Guam (7) CNMI (8) Palau
Representative from each MC jurisdiction Ms. Shirley Koshiba Researcher, PICRC
15:00 Q& A, Issues/Challenges related to monitoring Ms. Tiare Holm16:00 Wrap-up Ms. Tiare Holm
Day 2 (Tuesday, Feb 7)
9:00 Review of Day1 Volunteer 9:10 Session 4: Monitoring in MPAs across Micronesia
Presentation on the study on the current status and future needs of Micronesia’s monitoring programs to address the goals of the Micronesian Challenge
Dr. Peter Houk, PMRI
9:40 Presentation on the results of surveys in Pohnpei, Yap, Chuuk and RMI and lessons learned (Q+A 10 min)
Ms. Lukes Isechal, Researcher, PICRC
10:05 - Group session: How to improve indicators and methods Ms. Tiare Holm 10:10-10:30 Coffee Break

5
10:30 Group session 10:45 Plenary Session :
-discuss and feedback on improving the monitoring indicators and methods
Ms. Tiare Holm
11:30-13:00 Lunch 13:00 Plenary Session Ms. Tiare Holm 13:30 Session 5: Status of socioeconomic Monitoring
Presentation on the socioeconomic study in Palau (Q+A 10 min)
Rosania Victor and King Sam, SemPasifika
13:55 Group Session Status, issues and future plan of each MC jurisdiction
Ms. Tiare Holm
14:15 Plenary Session -Discuss the issues and future plan of socioeconomic monitoring
Ms. Tiare Holm
14:30-14:40 Coffee Break 14:40 Plenary Session Ms. Tiare Holm 14:55 Session 6:Capacity Needs
Identify issues, problems, and capacity needs for coral reef monitoring in each jurisdiction (both ecological and socioeconomic)
Ms. Tiare Holm
15:55 Wrap up Ms. Tiare Holm Day 3 (Wednesday, Feb 8):
9:00 Review of Day2 Volunteer III. Regional Database Management Service 9:10 Session 7: MC Database
Presentation on progress on the development of monitoring database. (Q+A 15 min)
Ms. Lukes Isechal, Researcher, PICRC and Mr. Franck Magron
10:05-10:25 Coffee Break 10:25 Current concept of regional data management service Dr Yimnang Golbuu10:40 Breakout session: Regional data management Ms. Tiare Holm 11:00 Plenary session Ms. Tiare Holm 11:30-13:00 Lunch 13:00 Plenary Session
Arrive at consensus of database management service that PICRC will provide
Ms. Tiare Holm
13:30 Introduce questions and issues/challenges on the process for jurisdictions to access and use database management services
Dr Yimnang Golbuu
13:45 Group session and plenary session: Process for accessing and use of database management service
Ms. Tiare Holm
14:45-15:05 Coffee Break 15:05 Resolve “parking lots” and other issues Ms. Tiare Holm16:00 Wrap up Ms. Tiare Holm
Day 4 (Thursday: Feb 9): 9:00 Review of Day3 Ms. Tiare Holm IV. MPA management effectiveness tool 9:15 Session 8: Management Effectiveness
Introduction of an MPA management effectiveness tool Mrs. Lukes Isechal
9:30 Testing the MPAME tool: Feedback from pilot sites Del. Wayne Andrew9:45 Update past management effectiveness efforts:
Demonstration of a similar tool in Lenger Island, Pohnpei Mr. Eugene Joseph
10:00-10:20 Coffee Break

6
10:20 Session 9: Open discussion - Strengths and weaknesses of the existing tool - Develop next steps and a draft work plan to roll out
the MPAME tool in - Work plan for MPA Management Effectiveness Tool
Micronesia—identify potential sites and individuals who will implement the tool
Ms. Trina Leberer, TNC
11.30 Lunch V. Regional Collaboration 13:00 Session 10: Specific regional collaborative work plan
Group discussion (7 groups) Plenary Session Discuss specific regional collaborative work plan
Ms. Trina Leberer, TNC
15:00 Wrap up Facilitator 15:30 Closing Remark Dr. Yimnang Golbuu
Chief Researcher, PICRC Facilitators Tiare T. Holm Trina Leberer Surech Hideyos
Secretariat Setsuko Matsumoto, Janis Merep, Randa Jonathan

7
Attachment 1. Participants List
Place Name Title Agency /Organization email
1 Chuuk Curtis Graham Marine Program Manager CCS [email protected]
2 Chuuk Chimres Teresio Conservation Officer Chuuk Marine Resources n/a
3 Kosrae Osamu Nedlic Marine Program assistant KCSO [email protected]
4 Kosrae Marston Luckymis Marine Program Manager KCSO [email protected]
5 Pohnpei Eugene Joseph Director CSP [email protected]
6 Pohnpei Selino Maxin Marine Program Manager CSP [email protected]
7 Pohnpei Scottie Malakai Pohnpei Marine Resources Pohnpei Marine Resources [email protected]
8 Pohnpei Liz Terk Conservation Program Manager MCT conservation@ourmicronesia.
org
9 Yap Thomas Gorong Community Project Manager Kaday Village [email protected]
10 Yap Jonathan K. Gorong
Community Surveillance & WQ monitoring member
Kaday Village n/a
11 Yap Vanessa Fread Environment Program Development Officer
Yap Community Action Program [email protected]
12 RMI Henry Muller Marine Program Manager MICS [email protected]
13 RMI Benedict Yamamura Intern MIMRA [email protected]
14 Guam Brent Tibbats Fisheries Biologist Division of Fish and Wildlife Resources [email protected]
15 Guam Dave Burdick Biologist/Coastal GIS Specialist
Guam Coastal Resource Management Office [email protected]
16 Guam Trina Leberer Director The Nature Conservancy, Micronesia Program [email protected]
17 Saipan Steven Johnson Biologist/Water Quality Specialist
Division of Environmental Quality
18 Saipan Peter Houk Chief Biologist Pacific Marine Resources Institute (PMRI) [email protected]
19 Saipan Dave Benavente Marine Technician Department of Environmental Quality [email protected]
20 Saipan John Iguel Environmental Specialist
Department of Environmental Quality [email protected]
21 New Caledonia Franck Magron Reef Fisheries
Information Manager SPC [email protected]
22 Palau Honorable Harry Fritz Minister MNRET
23 Palau Joe Aitaro PAN Coordinator MNRET [email protected]
24 Palau Sebastian Marino National Environment Planner and MC Focal Point for Palau
Office of Environmental Response and Coordination (OERC)
25 Palau Lolita Decherong- Gibblns
Management Planning Coordinator
Palau Conservation Society
26 Palau Heather Katebengang
Wildlife Health Species Coordinator
Palau Conservation Society
27 Palau Wayne Andrew Chairman PAN Committee, OEK 28 Palau Rosania Victor Program Manager, Helen Reef Program
Manager [email protected]

8
29 Palau Stella Patris Education & Awareness Officer, Helen Reef Program [email protected]
30 Palau King Sam Rock Island Development Officer
Koror State Department of Conservation and Law Enforcement
31 Palau David Orrukem Director BMR [email protected]
32 Palau Percy Rechelluul Fisheries Technician BMR, fin Fish Hatchery
33 Palau Elizer Ngotel Fisheries Specialist BMR, Development
34 Palau Harvey Renguul Fisheries Specialist BMR, PMDC
35 Palau Lawrence Sumor Fisheries Technician BMR, PMDC
36 Palau Joshua Eberdong Coordinator Endangered Species BMR, Endanger Spec. Dev
37 Palau Sherryl Solang Administrative asistant I BRM, Endanger Spec. Dev
38 Palau Madelsar Ngiraingas Program Manager PALARIS [email protected]
om
39 Palau Irene Mercader- Guzman
Regional Database Analysts PALARIS [email protected]
40 Palau Surech Hideyos Office Manager MC Regional Office [email protected]
41 Palau Umiich Sengebau Deputy Director of Conservation, Micronesia Program
42 Palau Steven Victor Program Officer TNC [email protected]
43 Palau Tiare Holm Consultant Sustainable Decisions [email protected] 44 Palau Charlene Mersai President Island-SEAS [email protected] 45 Palau Parick U. Tellei President PCC [email protected]
46 Palau Sandra S. Pierantozzi CEO PICRC [email protected]
47 Palau Carol Emaurois Head of Education & Public Relations Department
PICRC [email protected]
48 Palau Yimnang Golbuu Chief Researcher PICRC [email protected]
49 Palau Adelle Lukes Isechal Researcher PICRC [email protected]
50 Palau Shirley D. Koshiba Researcher PICRC [email protected] 51 Palau Geory Mereb Research Assistant PICRC [email protected]
52 Palau Dawnette Olsudong Research Assistant PICRC [email protected]
53 Palau Jay Andrew Research Assistant PICRC [email protected] 54 Palau Arius Merep Research Assistant PICRC n/a 55 Palau Seiji Nakaya Chief Advisor CEPCRM [email protected]
56 Palau Setsuko Matsumoto Project Coordinator CEPCRM [email protected]
58 Palau Byron Silil Student Intern PCC/PICRC
59 Palau Mark Defley Student [email protected]
60 Palau Naoko Hayashi Researcher Embassy of Japan [email protected]
61 Palau Taiji Usui Resident Representative JICA Palau Office [email protected]

9
Attachment 2. Minutes of Discussions of the Previous Workshop Moving Toward Measuring Our Effectiveness: The 2nd Meeting of the MC Measures Working Group and
PICRC/JICA Coral Reef Monitoring Project Workshop Purpose: To enhance regional capacity of monitoring of MPAs for improved management of near shore resources, the Workshop, “Moving Toward Measuring Our Effectiveness: The 2nd Meeting of the MC Measures Working Group and PICRC/JICA Coral Reef Monitoring Project Workshop” was co-hosted by Japan International Cooperation Agency, Palau International Coral Reef Center, Micronesia Challenge Regional Office and The Nature Conservancy. The following information was obtained through discussions below:
Items Descriptions
Issues of management • Lack of management
plan or strategy • Insufficient finance • Personnel issues
(numbers and training) • Lack of political will • Enforcement
difficulties • Tourism impacts • Military buildup Issues of monitoring • Local capacity
o Training and skill sets
o Recruitment and retainment
• Resources o Financial o Human resources
• Geographic issues o Large spatial areas o Isolation of many
sites o Increasing impacts
of climate change • Capacity needs vary
widely be jurisdiction. More specific capacity assessments are done by respective jurisdiction teams
The primary focus for all MPAs in the region is fisheries – a few sites have additional objectives but the overwhelming majority focus on fisheries resources. Each jurisdiction’s current MPA status and monitoring situation is described below.
Palau • 32 sites in 14 states; all habitats represented • Most monitoring is done by PICRC with some assistance
from PCS, others • Data include general condition, information on fish,
coral and seagrass. • A social survey to gauge perceptions and threats exists.
There needs to be closer alignment between social and biological monitoring.
FSM • 4 states with 607 islands and 3 million square miles of
ocean. Sites throughout communities. • Guided by strategic development plan principles to
manage and protect the nation’s natural environment • Current monitoring efforts vary by state but focus on
biological data with some socioeconomic information collected
RMI: • 40+ sites coordinated by national effort but managed
and implemented at local or community level • Under national framework Reimaanlok, including
integration climate lens in resource management • Monitoring includes coral disease, COTS, water quality
data, pollutants and others. Some socioeconomic data. • Need coordination between monitoring programs for
better understanding of effectiveness.
Guam • 5 sites passed in 1997 and enforced since 2001 • Monitoring is required by legislation creating preserves.
Focus on fish stocks, with some data on coral and other parameters
• Little socioeconomic information captured, but enforcement data and water quality available.
CNMI • 6 sites and federal marine monument
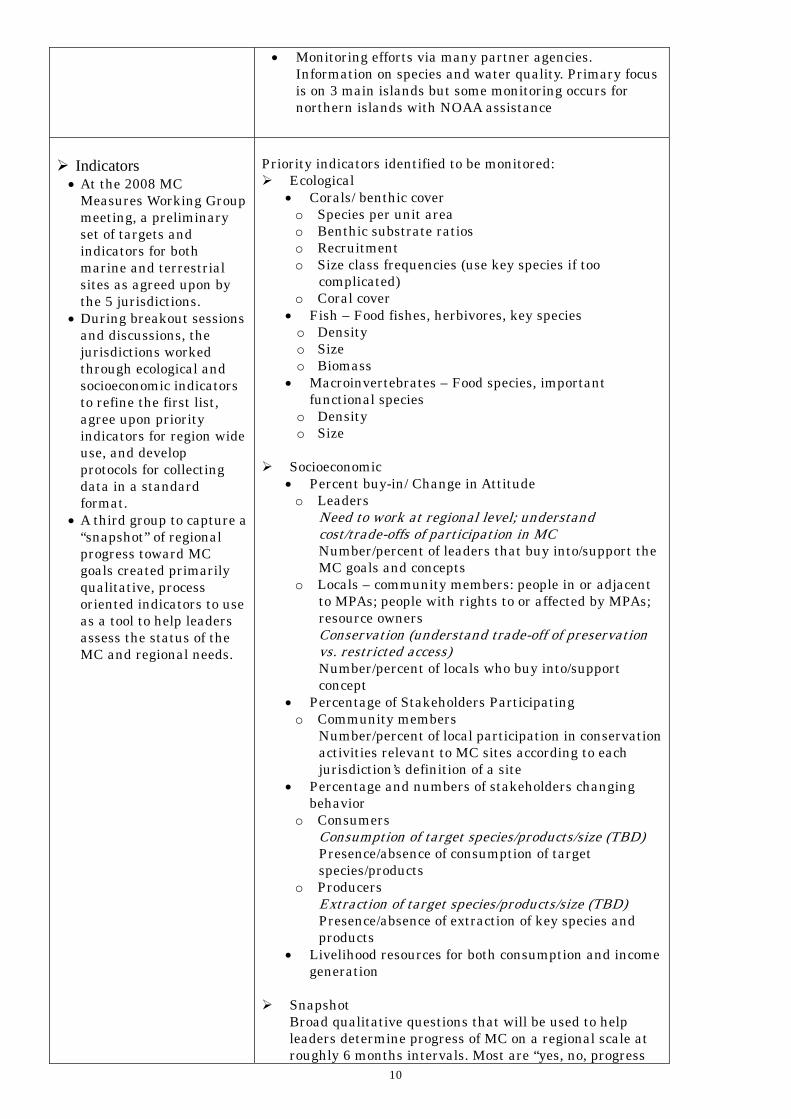
10
• Monitoring efforts via many partner agencies. Information on species and water quality. Primary focus is on 3 main islands but some monitoring occurs for northern islands with NOAA assistance
Indicators • At the 2008 MC
Measures Working Group meeting, a preliminary set of targets and indicators for both marine and terrestrial sites as agreed upon by the 5 jurisdictions.
• During breakout sessions and discussions, the jurisdictions worked through ecological and socioeconomic indicators to refine the first list, agree upon priority indicators for region wide use, and develop protocols for collecting data in a standard format.
• A third group to capture a “snapshot” of regional progress toward MC goals created primarily qualitative, process oriented indicators to use as a tool to help leaders assess the status of the MC and regional needs.
Priority indicators identified to be monitored:
Ecological • Corals/ benthic cover
o Species per unit area o Benthic substrate ratios o Recruitment o Size class frequencies (use key species if too
complicated) o Coral cover
• Fish – Food fishes, herbivores, key species o Density o Size o Biomass
• Macroinvertebrates – Food species, important functional species
o Density o Size
Socioeconomic • Percent buy-in/ Change in Attitude
o Leaders Need to work at regional level; understand cost/trade-offs of participation in MC Number/percent of leaders that buy into/support the MC goals and concepts
o Locals – community members: people in or adjacent to MPAs; people with rights to or affected by MPAs; resource owners Conservation (understand trade-off of preservation vs. restricted access) Number/percent of locals who buy into/support concept
• Percentage of Stakeholders Participating o Community members
Number/percent of local participation in conservation activities relevant to MC sites according to each jurisdiction’s definition of a site
• Percentage and numbers of stakeholders changing behavior
o Consumers Consumption of target species/products/size (TBD) Presence/absence of consumption of target species/products
o Producers Extraction of target species/products/size (TBD) Presence/absence of extraction of key species and products
• Livelihood resources for both consumption and income generation
Snapshot
Broad qualitative questions that will be used to help leaders determine progress of MC on a regional scale at roughly 6 months intervals. Most are “yes, no, progress

11
made” questions that can be answered by key individuals in each jurisdiction. • Percent extent of near shore marine areas under some
form of conservation • Percent of progress toward each MC endowment goal • Status of jurisdiction’s finance mechanism • Percentage of sites with governance mechanisms with
authority • Skilled people actively working at the site relative to
the number of skilled people needed to achieve core objectives
• Funding source; amount of funding relative to funding needed to meet core objectives
• Jurisdictions have developed their capacity development strategies
• Ongoing capacity development system (professional development programs)
• Number of partnerships in place relative to the number needed to meet core objectives
• Ecosystem based climate change adaptation strategies applied to jurisdiction conservation plans
• Percentage of sites with effective enforcement programs as defined by their jurisdiction’s standards
• Percentage of sites with active enforcement programs as defined by their jurisdiction
Monitoring methods For each indicator, monitoring methods were identified as below:
Ecological monitoring • Coral
o Photo quadrats o Random points o Belt Transects
• Fish o Belt transects o Timed swim
• Macroinvertebrates o Transects
Socioeconomic monitoring • Formal surveys • Key informant interviews • Observation • Existing data
Snapshot/Score card Information will be collected through questionnaires for key individuals within each jurisdiction.

12
Next steps
Smaller group meetings via calls and emails to address concerns with indicators and protocol
• Working group leads designated and targets for discussion dates are set • TNC and MC will check in with group leads to monitor progress
Meeting report • Draft in one month • Two week comment period • Minutes and working materials • CD of presentations
Each jurisdiction needs to define their management approach, define target species for
some of the surveys, and look at existing data and gaps within one year.
Next MC Measures Working Group Meeting

Country/Jurisdiction State Name of MPA Size
Type (mangrove: MG;seagrass: SG;
reef:CR)
Mangement Objectives (Fishstock replenishment: FSR;
Habitat recovery: HR;
Management body (state,national, NGO, etc.) Monitoring (methods) Year
Established
Designated by (national,state, traditional,
international, mixed)
Speciesprotected
Management Activities (eg.,enforcement)
USA Guam Achang Reef Flat 4.85 km2Seagrass, reef,mangrove
Fish stock replenishment,habitat recovery
Territorial Dept. ofAgriculture
visual transects,documentation of illegalharvest 1997 Territorial government
reef, fish,inverts, corals,sea turtles
enforcement, monitoring, publiceducation and outreach
USA Guam Sasa Bay 3.12km2 MangroveFish stock replenishment,habitat recovery
Territorial Dept. ofAgriculture
documentation of illegalharvest 1997 Territorial government
mangroves, reeffish,
enforcement, monitoring, publiceducation and outreach
USA Guam Piti Bomb Holes 3.63km2Seagrass, reef,special features
Fish stock replenishment,habitat recovery
Territorial Dept. ofAgriculture
visual transects,documentation of illegalharvest 1997 Territorial government
sea grass, reeffish, corals
enforcement, monitoring, publiceducation and outreach
USA Guam Tumon Bay 4.52km2 reefFish stock replenishment,habitat recovery
Territorial Dept. ofAgriculture
visual transects,documentation of illegalharvest 1997 Territorial government
reef fish,inverts, corals
enforcement, monitoring, publiceducation and outreach
USA Guam Pati Point 20.00km2 reefFish stock replenishment,habitat recovery
Territorial Dept. ofAgriculture
documentation of illegalharvest 1997 Territorial government
reef fish,inverts, corals
enforcement, monitoring, publiceducation and outreach
USA (CNMI)CNMI (NorthernIslands) Marianas Trench Monument ?
Coral reef,seamounts,deepwater trench
Habitat protections, otherobjective to be determined
US Federal Govt. withpossible inclusion of stategovt. NA 2009 US President
coral reef andvent associatedtaxa To be determined
USA (CNMI) CNMI (Saipan)Managaha Marine ConservationArea 5.06 km coral reef
Fisheries enhancement,habitat protection State
Transect based in-wtaersurveys 2000 CNMI Legislature All
Fisheries Enforcement, CoastalZone Enforcement, Permittingof recreation activities.
USA (CNMI) CNMI (Saipan) Forbidden Island 2.5 km coral reefFisheries enhancement,habitat protection State
Transect based in-wtaersurveys 2000 CNMI Legislature All
Fisheries Enforcement, CoastalZone Enforcement, Permittingof recreation activities.
USA (CNMI) CNMI (Tinian) Tinian Sanctuary 9 km coral reefFisheries enhancement,habitat protection State NA 2007 Tinian Legislature All
Fisheries Enforcement, CoastalZone Enforcement, Permittingof recreation activities.
USA (CNMI) CNMI (Rota) Sasanhaya Fish Reserve 0.84 km coral reefFisheries enhancement,habitat protection State
Transect based in-wtaersurveys 1994 Rota Legislature All
Fisheries Enforcement, CoastalZone Enforcement, Permittingof recreation activities.
USA (CNMI) CNMI (Saipan)Lighthouse Reef TrochusReserve 1.11 km coral reef Trochus enhancement State NA 2000 CNMI Legislature
Trochusnilioticus
Fisheries Enforcement, CoastalZone Enforcement, Permittingof recreation activities.
USA (CNMI) CNMI (Saipan) Bird Island Marine Sanctuary 0.79 km coral reefFisheries enhancement,habitat protection State
Transect based in-wtaersurveys 2001 CNMI Legislature All
Fisheries Enforcement, CoastalZone Enforcement, Permittingof recreation activities.
USA (CNMI) CNMI (Saipan)Laulau Bay Sea CucumberReserve 1.58 km coral reef Sea Cucumber Enhancement State NA 2000 CNMI Legislature Sea Cucumbers
Fisheries Enforcement, CoastalZone Enforcement, Permittingof recreation activities.
Palau Kayangel Ngeruangel Reserve 34.96 km2atoll island, reefs,andlagoons fisheries, tourism state government
Quaterely monitoring byPCS up until 2007,PICRC monitoring yearly 1996 State law
Fish, turtles,invertebrates
Quaterely monitoring by PCSup until 2007, PICRCmonitoring yearly
Palau Ngerchelong Ebiil Conservation Area 19.11 km2 reefprotect spawningaggregations of reef fish state government
PCS monthly until 2007,PCS with SCRFA Julyand Aug 2008 and April-Sept 2009 , PICRCresearch study 2007-2009 1999 State law
all marineresources withinthe area
PCS monthly until 2007, PCSwith SCRFA July and Aug 2008and April-Sept 2009 , PICRCresearch study 2007-2009
Palau Ngardmau Ileyakl Beluu 0.62 km2 reef fisheries protection state government none 2005 State lawfish and edibleinvertebrates none
Palau NgardmauNgermasech to BkulachelidConservation Area 2.93 km2
mangrove,seagrass,coral reef fisheries protection state government
PCS baseline2007, followup survey in 2008;PICRC quarterely fishand inverts 1998 State law
fish and edibleinvertebrates
PCS baseline2007, follow upsurvey in 2008; PICRCquarterely fish and inverts

Palau NgaraardMangrove conservation area(west coast) 1.42 km2 mangrove state government None 1994 State law mangrove trees None
Palau Ngeremlengui Bkulengriil conservation area 1.5 km2mangrove and reefflat fisheries protection state government
PCS and PICRC baseline2006; Quaterelymonitoring by StateGovernment assisted byPICRC 2006 State law
fish and allmarine life
PCS and PICRC baseline2006; Quaterely monitoring byState Government assisted byPICRC
Palau NgeremlenguiTewachel Mlengui GrouperSpawning Area (Bkul a Beluu) ? reef fisheries protection state government none 1987 State law fish none
Palau NgatpangClam conservation area (OruaolLibuchel Reef) ? patch reef fisheries protection state government none 1999 State law giant clams none
Palau Ngatpang Crab conservation area ? mangrove fisheries protection state government none 1999 State law mangrove crab none
Palau Ngatpang Fish conservation area ?mangrove,seagrass,coral reef fisheries protection state government none 1999 State law fish none
Palau
Ngeremlengui,Ngatpang,Aimeliik Ngermeduu conservation area 98 km2 mangrove state government none 1999 State law not specified none
Palau Melkeok Melekeok nearshore waters ? reef and seagrass fisheries protection state government none 1997 State law fish none
Palau MelkeokNgerang Clam ConservationArea ? reef flat fisheries protection state government none 1999 State law giant clams none
Palau Ngchesar Ngelukes conservation area 0.5 km2 patch reef fisheries protection state government
Monitoring by StateGovernment assisted byPICRC, research byPICRC 2002 State law not specified
Monitoring by StateGovernment assisted byPICRC, research by PICRC
Palau AimeliikNgerchebal Island WildlifeConservation ? island and reef fisheries protection state government none 2006 State law
birds, animalsand marine life none
Palau AimeliikImul Mangrove ConservationArea ? mangrove state government none 2002 State law
plants in themangroves none
Palau AiraiNgcheschang mangroveconservation area 0.97 km2 mangrove state government none 1994 State law not specified none
Palau AiraiOikull mangrove conservationarea 0.78 km2 mangrove state government none 2002 State law not specified none
Palau Airai Airai reef conservation area ?mangroves, coral reefand seagrass fisheries protection state government
Monitoring by StateGovernment assisted byPICRC 2005 State law fish
Monitoring by StateGovernment assisted byPICRC
Palau Airai Ngeream conservation area 1.64 km2 mangrove state government none 1997 State law not specified none
Palau KororNgerkebesang ConservationZone* ? reef flat Protect resources for tourist state government
patrol by Koror StateRangers 2002 State law
all marine floraand fauna patrol by Koror State Rangers
Palau Koror Ngederrak conservation area* 5.98 km2seagrass,reef flat,reef crest
Maitain fisheries and otherresources state government
patrol by Koror StateRangers 2001 State law
all marine floraand fauna patrol by Koror State Rangers
Palau Koror Ngerumekaol Spawning area* 2.08 km2 reefProtection of spawningaggregation site state government
patrol by Koror StateRangers 1976 State and national law not specified patrol by Koror State Rangers
Palau KororSoft Coral Arch, Cemetery Reef,any marine lake, Ngkisaol Islet* ?
coral reef, marinelake, mangrove,seagrass
protect spawning populationsof herring and maintain floraand fauna at popular divesites state government
patrol by Koror StateRangers 1999 state
any flora andfauna, erau(Spratelloidesdelicatulus),mekebud(Herklotsichthysquadrimaculatus), teber(Athrinomoruslacunosus) patrol by Koror State Rangers
Palau KororNgerukewid Islands WildlifePreserve 11.02 km2
islands, reefs andlagoons
Maintain the island in naturalstage free from humaninterference state government
patrol by Koror StateRangers 1956 State and national law
marine andterrestrial faunaand flora patrol by Koror State Rangers
Palau Koror Ngemelis Island complex* 40.26 km2 islands and reefs
decrease erosion, protectcoral reef from damage, andmaintain water clarity andquality state government
patrol by Koror StateRangers 1995 State law
protection ofmarineecosystem patrol by Koror State Rangers
Palau Peleliu Teluleu conservation area 0.83 km2 seagrass and reef flat state governmentinitial assessment byPCS in 2009 2001 State law not specified
initial assessment by PCS in2009
Palau Angaur Angaur conservation area seagrass and reef flat state governmentecological monitoring byPICRC 2006 State law not specified ecological monitoring by PICRC
Palau Hatohobei Helen Reef Reserve 163 km2island, reefs andlagoons state government/PAN
Patrolled by rangers,monitoring by rangers,baseline surveys 2001 State law fish
Patrolled by rangers,monitoring by rangers, baselinesurveys

Palau KororRock island Southern lagoonmanagement area** 621 km2
rock island, lagoonsand barrier reefs state government
patrol by Koror StateRangers 1997 State law not specified patrol by Koror State Rangers
Palau Ngaraard Ungelel Conservation Area ? mangrove state government none 2007 State law not specified none
Palau Ngaraard Marine Life Conservation Area ? reef state government none 1990 State law not specified none
FSM Yap Riken Marine Managed Area 34.8251 Ha Riken VillageDeclared and run by localcommunities
FSM Yap Ngulu Atoll-zone A 90514.2 Hapatch reef, inner reef,channel, outer reef
Ngulu Atoll ResourceManagement Committee yes/SE
Declared and run by localcommunities
FSM Yap Rumung 286.214 Ha Local MunicipalDeclared and run by localcommunities
FSM YapNimpal Channel MarineConservation Area 77.481 Ha
inner-reef, channel,outer-reef
Conservation/preservation oftraditional fishing grounds Community fish count 2008
Traditional (2006) &public declaration (2008)
Habitat and allspeciesprotection
Enforcement, biologicalmonitoring
FSM Yap Ngulu Atoll-zone B 21508.9 Hapatch reef, inner reef,channel, outer reef
Ngulu Atoll ResourceManagement Committee yes/SE
Declared and run by localcommunities
FSM Yap Ngulu Atoll-zone C 408.689 Hapatch reef, inner reef,channel, outer reef
Ngulu Atoll ResourceManagement Committee yes/SE
Declared and run by localcommunities
FSM Yap Wacholab 2 99.3537 Ha Wacholab VillageDeclared and run by localcommunities
FSM Yap Wacholab 1 22.9044 Ha Wacholab VillageDeclared and run by localcommunities
FSM Chuuk Pulusuk Atoll 516.924 Ha CR, MG, atoll Traditional Closure (Clan) noDeclared and run byIndigenous peoples
FSM Chuuk West Puluwat 1373.21 Ha MG, CR Traditional Closure (Clan) noDeclared and run byIndigenous peoples
FSM Chuuk Southwest Pulap 5077.84 Ha CR Traditional Closure (Clan) noGovernment-delegatedmanagement
FSM Chuuk North Weno Marine 13.087 Ha MG Community Members noDeclared and run byIndigenous peoples
FSM Chuuk SPAGS 706.251 Hainner-reef, channel,outer-reef FP Community Members yes
Declared and run by localcommunities
FSM Chuuk Namoluk Atoll 1583.91 Ha nearshore marine Traditional Closure (Clan) noDeclared and run byIndigenous peoples
FSM Chuuk Etal Atoll Marine 2657.41 Ha Traditional Closure (Clan) noDeclared and run byIndigenous peoples
FSM Chuuk Esan Reef 2791.91 Ha Traditional Closure (Clan) noDeclared and run byIndigenous peoples
FSM Chuuk Oneop Island 58.0875 Ha nearshore marine Traditional Closure (Clan) noDeclared and run byIndigenous peoples
FSM Chuuk Satowan Island 119.506 Ha Traditional Closure (Clan) noDeclared and run byIndigenous peoples
FSM Chuuk Northwest Reef 2050.48 Ha Community Members noDeclared and run byIndigenous peoples
FSM Chuuk Fonufon Reef 565.841 Ha CR (patch reefs) FP, HR Community Members yesDeclared and run byIndigenous peoples
FSM Chuuk Grouper Spawning Site 900.871 Ha Traditional Closure (Special) noDeclared and run byIndigenous peoples
FSM Chuuk Grouper Spawning Site 130.814 Ha Traditional Closure (Special) noDeclared and run byIndigenous peoples
FSM Chuuk Kuop Atoll 11597.9 Ha CR, atolls, lagoonconserve traditional fishinggrounds Traditional Closure (Clan) no
Declared and run byIndigenous peoples
FSM Chuuk Namwanan Marine 166.74 Ha MG Traditional Closure (Clan) noDeclared and run byIndigenous peoples
FSM ChuukUnuno-Fongen-Onongoch,Fefan 114.307 Ha MG,CR HR, FP UFO Women Association yes
Declared and run by localcommunities
FSM Chuuk Totiw 10.7996 Ha CR HR, FP Community Members yesDeclared and run byIndigenous peoples
FSM Chuuk Southeast Reef 1235.28 Ha Community Members noDeclared and run byIndigenous peoples
FSM Chuuk Esan Reef 63.5857 Ha CR, atoll Traditional Closure (Clan) noDeclared and run byIndigenous peoples
FSM Chuuk Feneppi 1.1862 Hainner-reef, channel,outer-reef
conserve traditional fishinggrounds Traditional Closure (Clan) no
Declared and run byIndigenous peoples

FSM Chuuk Ipisinner-reef, channel,outer-reef
conserve traditional fishinggrounds Traditional Closure (Clan) yes
Collaborativemanagement
FSM ChuukEpinup Mangrove ConservationSite 21.3807 Ha MG Epinup Conservation Group yes
Declared and run by localcommunities
FSM Pohnpei Nahtik 924.575 HaMG, CR (inner andouter) FP/FSR Enipein community yes
FSM Pohnpei Sapwitik 153.713 HaCR, spawningaggregations FP/FSR
Deptartment of Land andNatural Resources (Div. ofMarine Conservation andForestry), ConservationSociety of Pohnpei, Lengercommunity yes
FSM Pohnpei Kehpara 67.4776 HaCR, spawningaggregations FP/FSR
State Government andConservation Society ofPohnpei (CSP) yes
FSM PohnpeiNamwen Naningih StingraySanctuary 29.1331 Ha cultural site, stingray cultural traditional no traditional
FSM Pohnpei Namwen Na Stingray Sanctuary 23.3013 Ha stingray cultural traditional no traditional
FSM Pohnpei Kepidau Deleur 451.818 Ha CR, channel FP, FSR
Deptartment of Land andNatural Resources (Div. ofMarine Conservation andForestry) yes
FSM Pohnpei Dehpehk Marine Sanctuary 173.3 Ha MG, CR FP/FSR
Deptartment of Land andNatural Resources (Div. ofMarine Conservation andForestry), CSP amdcommunity yes
FSM Pohnpei Enipein Mangrove Reserve 57.9451 Ha MG HRState Government andcommunity
FSM Pohnpei Mwahnd Marine Sanctuary 792.67 Ha CR, manta ray FP, FSR
Deptartment of Land andNatural Resources (Div. ofMarine Conservation andForestry), CSP amdcommunity
FSM Pohnpei Pakin Reef 324.092 Ha CR, atoll FP, FSRPakin CommunityAssociation no
FSM Pohnpei Uhrek 5.07499 Ha beach habitat FSR Mwoalakoa community yes
FSM Pohnpei Pahnmuk 1394.78 Ha CR FP, FSR Nanpei estate no
FSM Pohnpei Dauenai Channel 413.045 Ha CR, channel FSR, HR, FP Nanpei estate no
FSM Pohnpei Pasa 1099.67 Ha CR (giant clams) FP, FSR Nanpei estate no
FSM Pohnpei Oroluk 46928.3 Ha CR, atoll FSR, HR, FP State Government no
FSM Pohnpei Minto Reef 4914.06 Ha CR, atoll FSR, HR, FPDepartment of Land andNatural Resource no
FSM Pohnpei Pwudoi Marine Sanctuary 71.0951 Ha MG, CR FSR, HR, FP CSP, Pwudoi community no
FSM Kosrae Awane 173.144 Ha MG, SG, CR FP, HRFSM Kosrae Kosrae Biosphere Reserve 512.93 Ha MG, SG, CR FP, HR, FSR yes
FSM Kosrae Malem 20.8018 Ha MG HR
FSM KosraeYela Watershed TerminaliaStand 520.356 Ha MG HR
FSM Kosrae James Palsis Marine Park 268.923 Ha CR, SG FSR, HR yes
FSM Kosrae Trouchus Sanctuary 140.245 Ha SG, CR Trochus enhancement yes
FSM Kosrae Weok 2.75805 Ha CR, SG FP, HR yesFSM Kosrae Yenyen Island 1.8835 Ha MG, CR, SG HR

RMI Namdrik Namdrik Atoll (whole atoll) 16.19 km2
Hab pro, for enhanceresillience and for foodsecurity; tourism expected
Co manage(community+Local gov)
No real monitoring isgoing on
RMI Majuro Woja (Majuro Atoll)
Hab pro, for enhanceresillience and for foodsecurity; tourism expected
Co manage(community+Local gov)
No real monitoring isgoing on
RMI Majuro Drenmeo (Majuro Atoll)
Hab pro, for enhanceresillience and for foodsecurity; tourism expected
Co manage(community+Local gov)
No real monitoring isgoing on
RMI Majuro Bikirin (Majuro Atoll)
Hab pro, for enhanceresillience and for foodsecurity; tourism expected
Co manage(community+Local gov)
No real monitoring isgoing on
RMI (Majuro Atoll)
Hab pro, for enhanceresillience and for foodsecurity
Co manage(community+Local gov)
No real monitoring isgoing on
RMI Mili Mili Atoll
Hab pro, for enhanceresillience and for foodsecurity; tourism expected
Co manage(community+Local gov)
No real monitoring isgoing on
RMI Rongerik Rongerik Atoll
Hab pro, for enhanceresillience and for foodsecurity
Co manage(community+Local gov)
No real monitoring isgoing on
RMI Wotje Atoll Erikub Atoll (whole atoll)
Hab pro, for enhanceresillience and for foodsecurity
Co manage(community+Local gov)
No real monitoring isgoing on
RMI Ailuk Atoll Eneneman Pass 1 km2
Hab pro, for enhanceresillience and for foodsecurity; tourism expected;Shellfish culture
Co manage(community+Local gov)
No real monitoring isgoing on
RMI Ailuk Atoll Marok Pass
Hab pro, for enhanceresillience and for foodsecurity; tourism expected;Shellfish culture
Co manage(community+Local gov)
No real monitoring isgoing on
RMI Ailuk Atoll Agulue Pass 1 km2
Hab pro, for enhanceresillience and for foodsecurity; tourism expected;Shellfish culture
Co manage(community+Local gov)
No real monitoring isgoing on
RMI Ailuk Atoll Enije Pass 1 km2
Hab pro, for enhanceresillience and for foodsecurity; tourism expected;Shellfish culture
Co manage(community+Local gov)
No real monitoring isgoing on
RMI Ailuk Atoll Enije, Ailuk 1 km2
Hab pro, for enhanceresillience and for foodsecurity; tourism expected;Shellfish culture
Co manage(community+Local gov)
No real monitoring isgoing on
RMI Rongelap Atoll Rongelap Atoll (whole atoll) 2723 km2
Hab pro, for enhanceresillience and for foodsecurity
Co manage(community+Local gov)
No real monitoring isgoing on
RMI Rongelap Atoll Ailinginae Atoll (whole atoll) 1014 km2
Hab pro, for enhanceresillience and for foodsecurity
Co manage(community+Local gov)
No real monitoring isgoing on
RMI Bikini Atoll Bikini Atoll (whole atoll) 2001 km2
Hab pro, for enhanceresillience and for foodsecurity
Co manage(community+Local gov)
No real monitoring isgoing on
RMI Arno Atoll Arno, Arno (terrestrial&marine) 10 km2
Hab pro, for enhanceresillience and for foodsecurity; Shellfish culture
Co manage(community+Local gov)
No real monitoring isgoing on
RMI Arno Atoll Arno, Arno 3 km2
Hab pro, for enhanceresillience and for foodsecurity; Shellfish culture
Co manage(community+Local gov)
No real monitoring isgoing on
RMI Arno Atoll Arno #2 (terrestrial&marine) 6 km2
Hab pro, for enhanceresillience and for foodsecurity; Shellfish culture
Co manage(community+Local gov)
No real monitoring isgoing on
RMI Arno Atoll Jabo (terrestrial&marine) 2 km2
Hab pro, for enhanceresillience and for foodsecurity; Shellfish culture
Co manage(community+Local gov)
No real monitoring isgoing on
RMI Arno Atoll Ine (terrestrial&marine) 2 km2
Hab pro, for enhanceresillience and for foodsecurity; Shellfish culture
Co manage(community+Local gov)
No real monitoring isgoing on

RMI Arno Atoll Arno - Matolen Lagoon 7 km2
Hab pro, for enhanceresillience and for foodsecurity; Shellfish culture
Co manage(community+Local gov)
No real monitoring isgoing on
RMI Arno Atoll Matolen (terrestrial&marine) 2 km2
Hab pro, for enhanceresillience and for foodsecurity; Shellfish culture
Co manage(community+Local gov)
No real monitoring isgoing on
RMI Arno Atoll Malel (terrestrial&marine) 2 km2
Hab pro, for enhanceresillience and for foodsecurity; Shellfish culture
Co manage(community+Local gov)
No real monitoring isgoing on
RMI Arno Atoll Kirage (terrestrial&marine) 3 km2
Hab pro, for enhanceresillience and for foodsecurity; Shellfish culture
Co manage(community+Local gov)
No real monitoring isgoing on
RMI Arno AtollLanar/Tenaku(terrestrial&marine) 3 km2
Hab pro, for enhanceresillience and for foodsecurity; Shellfish culture
Co manage(community+Local gov)
No real monitoring isgoing on
RMI Arno Atoll Anearean 4 km2
Hab pro, for enhanceresillience and for foodsecurity; Shellfish culture
Co manage(community+Local gov)
No real monitoring isgoing on
RMI Arno AtollJarkwij-Enelauraren (terrestrial& marine) 6 km2
Hab pro, for enhanceresillience and for foodsecurity; Shellfish culture
Co manage(community+Local gov)
No real monitoring isgoing on
RMI Jaluit Atoll Dri Bako Mo-Pinglep 51 km2
Hab pro, for enhanceresillience and for foodsecurity
Traditionally managed(community+Local gov)
No real monitoring isgoing on
RMI Jaluit AtollMejai - Bird Island(terrestrial&marine) 4.9 km2
Hab pro, for enhanceresillience and for foodsecurity
Traditionally managed(community+Local gov)
No real monitoring isgoing on
RMI Jaluit Atoll Matolen Mo 5.6 km2
Hab pro, for enhanceresillience and for foodsecurity
Traditionally managed(community+Local gov)
No real monitoring isgoing on
RMI Jaluit AtollDri Bako Mo-Pinglep (Bokwen-Aruboe) 9 km2
Hab pro, for enhanceresillience and for foodsecurity
Traditionally managed(community+Local gov)
No real monitoring isgoing on
RMI Jaluit Atoll Jitoken Mo 5 km2
Hab pro, for enhanceresillience and for foodsecurity
Traditionally managed(community+Local gov)
No real monitoring isgoing on
RMI Jaluit Atoll Loraa Mo-Ae 5 km2
Hab pro, for enhanceresillience and for foodsecurity
Traditionally managed(community+Local gov)
No real monitoring isgoing on
RMI Jaluit Atoll Nono Mo-Imroj 0.9 km2
Hab pro, for enhanceresillience and for foodsecurity
Traditionally managed(community+Local gov)
No real monitoring isgoing on
RMI Jaluit Atoll Jea Ko Mo-Imroj
Hab pro, for enhanceresillience and for foodsecurity
Traditionally managed(community+Local gov)
No real monitoring isgoing on
RMI Jaluit Atoll Bar Mo-Imiej 1 km2
Hab pro, for enhanceresillience and for foodsecurity
Traditionally managed(community+Local gov)
No real monitoring isgoing on
RMI Jaluit Atoll Karajraj Kan Mo-Jabor 1 km2
Hab pro, for enhanceresillience and for foodsecurity
Traditionally managed(community+Local gov)
No real monitoring isgoing on
RMI Jaluit Atoll Enninto Mo-Ae 1 km2
Hab pro, for enhanceresillience and for foodsecurity
Traditionally managed(community+Local gov)
No real monitoring isgoing on
RMI Likiep Atoll Aujaroj-Likiep
Hab pro, for enhanceresillience and for foodsecurity; tourism expected
Co manage(community+Local gov)
No real monitoring isgoing on
RMI Likiep Atoll Anenuaan-Likiep
Hab pro, for enhanceresillience and for foodsecurity; tourism expected
Co manage(community+Local gov)
No real monitoring isgoing on

1
Attachment 2. Jurisdiction updates: Ecological and socioeconomic [SE] monitoring activities since last workshop in 2010
1 Kosrae Presenter ‐ Osamu Nedlic (KCSO) Monitoring
status Ecological: 10 monitoring stations, but only 4 are monitored; been using the same method as other jurisdictions. Began in 2008 with photo quadrat method; Coral and fish monitoring within Utwe Biosphere Reserve and the Tafunsak MPA (ongoing) Water quality monitoring – did this in the Utwe BR last year. SE: SEM‐P done in 2009
Monitoring results
Coral cover in the two monitoring sites have increased; For Utwe BR, there was a slight decrease in cover in 2009, but don’t know yet what caused this For fish – started monitoring in 2010 Fish size class results – when we monitor the fish, we make 3 size class Based on our data, we have more small fish than big fish in our reserves.
Data mgmt input the data into a spreadsheet and send to Pete for verification. Don’t have database yet. Lessons learned (LL), issues &
capacity needs Need more training on data management and analysis
Have you used MPA Mgmt Effectiveness Tools? If so, share experience
Haven’t used it yet. However, when we’ve asked community members, they say there are more fish
Future plans for monitoring & MPA Effectiveness Management Tools
Plan to add additional sites and to expand monitoring collection, especially on fish and coral size – want to understand what the small corals and large size corals indicate. We also want to include macro invertebrates, water quality monitoring, and improve fish monitoring And we want to work with partners to learn these.
Questions: ‐ Could you highlight big challenges on data management? We don’t have specific challenges with our coral monitoring, but we cannot incorporate the monitoring sites of the state governments into our monitoring protocol, as they have not begun to use the method we are using now and still using Reef Check methods. ‐ Of the four sites, are some inside and some outside? Buffer zones only.

2
2 Chuuk Presenter ‐ Curtis (CCS) Monitoring
status Ecological: doing fish, coral and macro‐invertebrates; 7 monitoring stations within Chuuk Lagoon; monitoring done annually SE: SEM‐P done in 2011 on Parem Island
Monitoring results
Monitoring results slide – average of sea cucumber total and clam abundance – declined Total biomass – fish biomass in inner barrier are larger than patch reef sites
Data mgmt Basically collect data but what? LL, issues &
capacity needs
More technical expertise, especially in data mgmt needed Lacking legislation to help with conservation. Recently became aware of this with our recent experience with the export of inverts. We lack the know‐how to get the process started; need to do better reporting , especially to our grantors and local communities.
Have you used MPA Mgmt Effectiveness Tools? If so, share experience Not yet Future plans for monitoring & MPA Effectiveness Management Tools ‐ train new monitoring team members
‐ train community conservation officers to monitoring ‐ complete Parem MPA management plan ‐ begin using MC database & upload information to it ‐ improve data management and analysis ‐ learn to use MPA Management Effectiveness tool
Questions: ‐ What is the most driving question in your MPA program? Obviously, with our limited staffing, we need to pick and prioritize. We want to do MPA
monitoring to advise management, but we also want to know how they are doing. ‐ Wondering about the sudden decrease of your inverts – is that sea cucumber? Were there people purchasing them for shipping out? In the last 3‐
4 yrs, we had local partners involved in export. Unfortunately, we can’t do before–and‐after analyses, because our survey is recent, but we can say that the population is low.
‐ Interested because we have a similar situation in Palau and wondered if your areas might have recovered. No. This is a good case on why we should have baseline data
‐ On the same note – not only seeing a change but identifying that there is a change and pair up ecological data with economic data on exports. ‐ The good thing is that the methods will remain the same even if we change the design (e.g., scale up from inside and outside to bigger areas) and
also by then capacity should have been built. So methods agreed are still useful

3
3 Yap Presenter –Vanessa Fread (YapCAP) Monitoring
status Ecological: Have added sites (total 10 sites; 16 stations); 12‐member team. Doing fish, coral and macro‐invertebrates. New site set up in 2011 (Reey site). While our program is focused on MPAs, we also have non‐MPA monitoring sites and plan on adding more non‐MPA sites; sites with no monitoring stations now are looking to establish MPAs in their reefs. Marine monitoring in Yap is a joint effort between Yap State Gov’t EPA, MCT, Yap CAP, NOAA and other agencies. Other Yap Team members are Thomas Gorong and Jonathan, who’s working on the database and is also an Intern for the MC. One point worth noting is that one of the limitations is human resources and skilled people, so to overcome this is, we’ve set up monitoring teams formed at the community level who have been trained and are helping us to do monitoring, while also collecting data in their own sites. Have 12‐member team now SE: SEM‐Pasifika in 2009.
Monitoring results Not presented Data mgmt Data entered by YapCAP staff and monitoring team members, then sent to Pete for analysis; data stored YapCAP office
Data processing and analysis done by PICRC and PMRI LL, issues &
capacity needs
Issues: weather conditions, sustainable funding, team member turnover and data analysis and trend interpretation LL: working with community members to fill in human resource gap Capacity needs: trained/skilled human resources, local capacity to do timely analysis and interpretation of data & need to expand and synergize with community‐led conservation initiatives.
Have you used MPA Mgmt Effectiveness Tools? If so, share experience
Ngulu and Nimpal underwent the pilot assessment last year. Haven’t seen the results yet but expect results will be shown this week;
Future plans for monitoring & MPA Effectiveness Management Tools
• Conduct Coral Reef Monitoring Training with team to refresh protocols; • Conduct data collection at 10 established sites; expand program to include more non‐MPA
sites; incorporate water quality measures; and incorporate more socio‐economic monitoring • Enter and analyze data • Regularly assess program and MPA effectiveness.
Questions: ‐ Yap is in unique situation in that they go directly with community members and do the monitoring. But it’s a double‐edged sword in that data
piles up because often time, communities don’t have capacity and/or resources. So while we need community members to do monitoring, we cannot rely on only them, as we also need agencies that can help with data analysis.
‐ There are a couple of guys who have just graduated and looking for jobs but we have not funds to hire them, nor to build an office for them, if we hired them – our office is already too crowded. So we also need space and funding to hire folks.
‐ Perhaps if MPAs are not established through law, this is another reason why agencies may not be able to step in and help out because no mandate and/or no budget for this kind of work.
‐ Despite these challenges at the community level, it’s still not impossible to be a community‐based MPA and do good ‐ Nimpal is a community‐led MPA but is so successful with reports being provided, reef health maintained and results communicated.
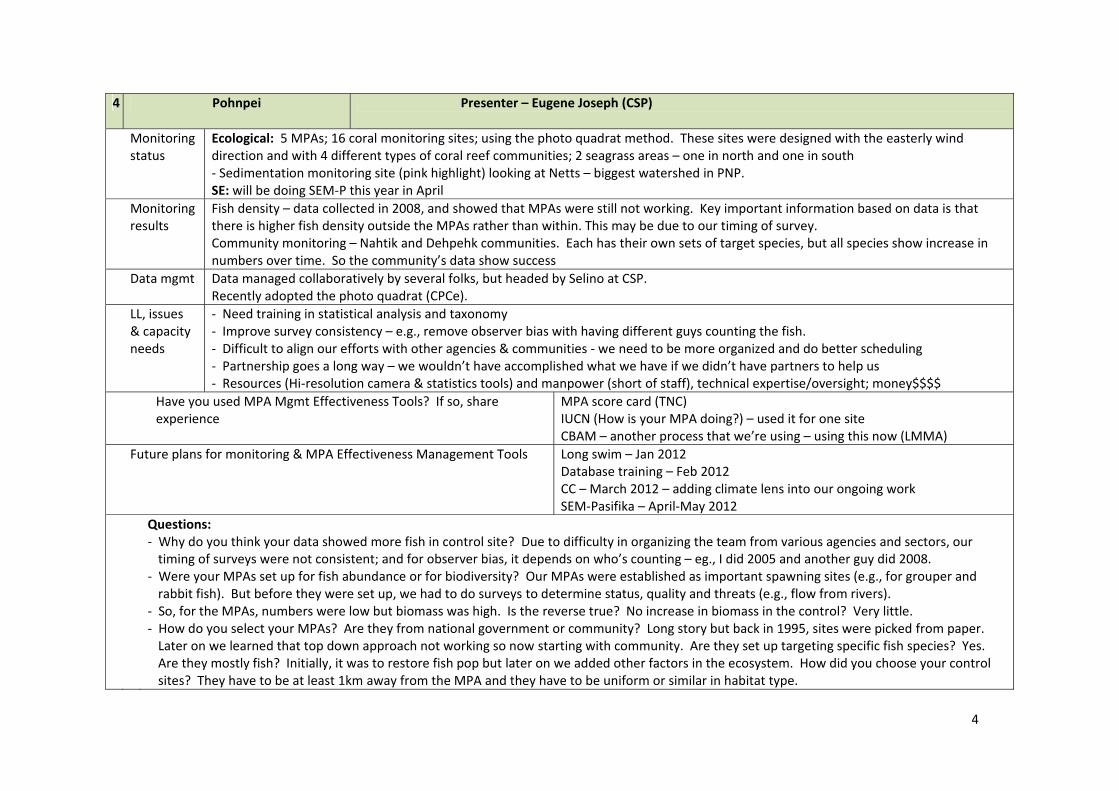
4
4 Pohnpei Presenter – Eugene Joseph (CSP)
Monitoring status
Ecological: 5 MPAs; 16 coral monitoring sites; using the photo quadrat method. These sites were designed with the easterly wind direction and with 4 different types of coral reef communities; 2 seagrass areas – one in north and one in south ‐ Sedimentation monitoring site (pink highlight) looking at Netts – biggest watershed in PNP. SE: will be doing SEM‐P this year in April
Monitoring results
Fish density – data collected in 2008, and showed that MPAs were still not working. Key important information based on data is that there is higher fish density outside the MPAs rather than within. This may be due to our timing of survey. Community monitoring – Nahtik and Dehpehk communities. Each has their own sets of target species, but all species show increase in numbers over time. So the community’s data show success
Data mgmt Data managed collaboratively by several folks, but headed by Selino at CSP. Recently adopted the photo quadrat (CPCe).
LL, issues & capacity needs
‐ Need training in statistical analysis and taxonomy ‐ Improve survey consistency – e.g., remove observer bias with having different guys counting the fish. ‐ Difficult to align our efforts with other agencies & communities ‐ we need to be more organized and do better scheduling ‐ Partnership goes a long way – we wouldn’t have accomplished what we have if we didn’t have partners to help us ‐ Resources (Hi‐resolution camera & statistics tools) and manpower (short of staff), technical expertise/oversight; money$$$$
Have you used MPA Mgmt Effectiveness Tools? If so, share experience
MPA score card (TNC) IUCN (How is your MPA doing?) – used it for one site CBAM – another process that we’re using – using this now (LMMA)
Future plans for monitoring & MPA Effectiveness Management Tools Long swim – Jan 2012 Database training – Feb 2012 CC – March 2012 – adding climate lens into our ongoing work SEM‐Pasifika – April‐May 2012
Questions: ‐ Why do you think your data showed more fish in control site? Due to difficulty in organizing the team from various agencies and sectors, our
timing of surveys were not consistent; and for observer bias, it depends on who’s counting – eg., I did 2005 and another guy did 2008. ‐ Were your MPAs set up for fish abundance or for biodiversity? Our MPAs were established as important spawning sites (e.g., for grouper and
rabbit fish). But before they were set up, we had to do surveys to determine status, quality and threats (e.g., flow from rivers). ‐ So, for the MPAs, numbers were low but biomass was high. Is the reverse true? No increase in biomass in the control? Very little. ‐ How do you select your MPAs? Are they from national government or community? Long story but back in 1995, sites were picked from paper.
Later on we learned that top down approach not working so now starting with community. Are they set up targeting specific fish species? Yes. Are they mostly fish? Initially, it was to restore fish pop but later on we added other factors in the ecosystem. How did you choose your control sites? They have to be at least 1km away from the MPA and they have to be uniform or similar in habitat type.

5
5 CNMI Presenter ‐ Steven Johnson (DEQ) Monitoring
status Ecological: All MPAs are managed by Dept. of Fish and Wildlife and they do MPAs and reference sites. However, the CNMI marine monitoring team has been working a while and has 30 sites in Saipan and Rota. We have 8 MPAs and marine monitoring team monitors 6. The two that we’re not doing is the Lighthouse Sanctuary (trochus) and the north island one which is too far. SE: SEM‐P in 2009 (not in MPA, though)
Monitoring results
High numbers especially for coral – in Rota
Data mgmt Microsoft excel – data maintained in this, drop down menu, auto‐fill and save as feature. Lessons learned, issues & capacity needs Have you used MPA Mgmt Effectiveness
Tools? If so, share experience Since we don’t’ manage MPAs, haven’t used these tools
Future plans for monitoring & MPA Effectiveness Management Tools
Mgmt still resides with fish and wildlife. If they don’t collaborate, we’ll still continue monitoring.
Questions: ‐ Do both federal and local gov’ts monitor the northern site? Every 3 years, they do Rapid Ecological Assessments on a cruise. Currently developing
the scientific plan for their own sanctuary and how they will monitor it. ‐ Some of the sites are monitored but have no reference sites. And some sites are so small so can’t find reference site. Is there a way to fix this
problem, other than only doing inside the MPA and doing it over time? Yes you can do this but problem is if you have more fish, it’s hard to tell if the increase is due to the MPA mgmt or some other reason.
‐ Is Fish and Wildlife using the same method you’re using? No. They are more interested in fish while we’re more interested in the ecosystem. Not sure what they are trying to do but doing lots of work with huge transects and so many stations and depths. This way, it’s very hard to do references sites. Goes back to the question, “What’s driving your work?” As no one has a perfect situation, we need to make do with what we’ve got so it’s really interesting to see how everyone is dealing with theirs.
‐ What is your biggest issue? Enforcement ‐ Who analyzes your data? Mainly it’s us. There are 3 natural resource agencies (EPA, Coastal Resource Mgmt, and Div. of Fish and Wildlife) and
between us, we manage all the resources. ‐ Do your messages go out to the community? Education is a big component of our work and we have full‐time people working on these. ‐ Was wondering if your team or other agencies have done SE work? There was a SEM‐P work on Lao Lao Bay, but because we’re not in charge of
managing the MPA, some of the questions were not really directly about the MPA. The Lao Lao Bay work was done for littering, so we really haven’t done SE for MPAs.

6
6 Guam Presenter ‐ Dave Burdick (GCRMO) Monitoring
status Ecological: ‐ Coordinator of a relatively new, comprehensive long term monitoring program, funded by NOAA. Hasn’t been a regular monitoring in Guam so this is new. Bio/Environmental – comprehensive and long term; Marine preserve monitoring – on indefinite hiatus and data collected was not as strong as it could be so this monitoring program is sort of filling in that role. Creel surveys – (ongoing) – catch numbers and have one of the best data sets in the Pacific; Fish belts but now have moved to SPCC’s fish ; Hope to install water quality logger to continuously collect data SE: – expect something done in March or April
Monitoring results
Not done analyzing our data so don’t have results to share. Preliminary results using primer – you recall that we had single stratum along that fore reef terrace. All the data with W on the left of the line and E on the right of the line very distinctive so may need to separate them in analysis. (see blue and green bar graph). Fish density and biomass – fresh off the press and don’t tell anybody about this. Haven’t done statistical pairs of these, but when we made comparison, density was slightly higher outside of MPA but for biomass there is greater difference.
Data mgmt We pretty much just store data in excel spreadsheets, which reside in the individual agencies that collect the data. But we’re currently in the process of developing a database. By the end of this year, will have database.
LL, issues & capacity needs
Biological ‐ Procurement. Not enough dedicated personnel, turnover; ‐ Imp of matching data collection efforts with prioreity mgmt questions ‐ Imp of sampling design adequate smapliong effort ‐ Need to be skilling to change if something isn’t working
Have you used MPA Mgmt Effectiveness
Tools? If so, share experience Haven’t heard this before
Future plans for monitoring & MPA Effectiveness Management Tools
See slide
Questions: ‐ I think there is too much dependence on gov’t agencies and also a cultural revolution happening really fast so young generation not really
connected to the resources and gov’t agencies not being able to do what they are supposed to do. Also we have a weird factor – it’s a regional management council that this is a pseudo gov’t organization (Fisheries Management Council) with different priority objectives. Some of these inter‐agency issues can be dealt with through SE surveys. Guam is very fortunate to have UOG as it’s pretty well engaged – the program that I can rely on graduate students to collect the data. When the initial monitoring work was started, we used the professors from UOG to design the survey.

7
7 RMI Presenters ‐ Henry Muller and Benedict Yamamura (MICS and MIMRA, respectively) Monitoring
status Ecological: RMI total area of all MPAs is about 5,800 sq. kilometers, established both for substance and reserves MPAs located in Majuro Atoll, Arno, Erikup, Likiep, Ailuk, Bokak (no one stays there and it’s a turtle and bird sanctuary)
Monitoring results
Data mgmt Data is managed by two agencies (MIMRA and MICS) and everyone in conservation work has access to this. Data not yet centralized but scattered in different agencies
LL, issues & capacity needs
Consultations are difficult for us because everyone has their own things to do so we need to schedule and follow their time; also engage youth; before we go to the field, we have to brief everyone in the team to ensure consistence and maintain standards of quality for our data collection Big problem: human resources – need more hands; remoteness makes transportation also a big issue for us
Have you used MPA Mgmt Effectiveness Tools? If so, share experience
Recently learned this from Steven Victor but feedback from community has been positive
Future plans for monitoring & MPA Effectiveness Management Tools
Update GIS database Centralize our data Need more time for scheduling Training for more of the CMAC members (partners and community members)
Questions: ‐ When you have these outer islands and they are far away but critical for ecosystems and BD, how are we going to track them? It’s going to be
challenging and expensive so need to figure out a protocol that would more practical and doable to count them. ‐ Do you monitor sites other than those on Majuro? We also covered other islands and our funds come from CMAC ‐ What data is collected on Bikini Atoll? Corals and fish ‐ How do you plan to centralize your database and how will your partners access it? We plan to put it in MIMRA and since there is no server for
it, they have to physically go to MIMRA to get them. ‐ Not a question but may be parking lot issue. Looking through agenda, wanted to make sure that we have a discussion that will touch again on
effectiveness, given the difference between the jurisdictions ‐ what are the common parameters among the jurisdictions, and what areas we may l need to tailor for our own islands.
‐ Are there common parameters of effectiveness? Not on management – but more on the definition of the MC’s “effectively conserved”

8
8 Palau Presenter ‐Shirley Koshiba (PICRC) Monitoring
status Ecological: Continued monitoring the 4 target MPAs in Palau (Ebiil, Ileaklbeluu, Ngemai and Teluleu). Did quarterly surveys of fish and annual surveys of recruits, macro‐inverts and benthos. SE monitoring – developed own survey questions for specific sites/communities (Ngarchelong and Ngiwal) Ngarchelong – household surveys done at two different times SE: MPA effectiveness surveys at several sites, one of them (Ngarchelong) done twice; SEM‐P done in 2010
Monitoring results
Only Teluleu has significantly higher fish density compared to its reference site
Data mgmt Designated one person for data entry; data was stored in Access and Excel in personal computers and PICRC server; used different statistical programs for analysis
LL, issues & capacity needs
Lessons learned are about the community members PICRC worked with. Coral Identification requires intensive training Size estimation for fish Limited experience and knowledge with data entry, storage, and analysis Lacked basic skills with computer use Not certified SCUBA divers Unfamiliar with survey methods Provide long‐term training programs, rather than short‐term due to constant turnover rate
Have you used MPA Mgmt Effectiveness Tools? If so, share experience
Used on 3 sites Useful because helped us to identify areas of focus and priorities Assess different levels of management and document progress
Future plans for monitoring & MPA Effectiveness Management Tools
‐ Ecological – continue with 4 sites, add new sites, ‐ Provide more training for Ecol and SE monitoring; ‐ Need to find funding to carry out monitoring and training programs
Questions: ‐ The high turnover rate – what do you attribute it to? Some went to work in other jobs. This is partly due to PAN Fund coming too slow and the
state governments don’t have enough funds to cover costs on their own. ‐ What are the 3 sites you implemented the Effectiveness Tools? Koror, Tobi & Ngchesar.

Attachment 3: Breakout Group #1 (2010 Monitoring Issues) 2010 Issues:a) b)
Which issues were resolved What were the key factors that led to the resolution of issues and overcoming challenges?
a) b)
Which issues were not resolved?What were key factors that prevented their resolution?
a) What are likely to be the key challenges for 2012?
Groups G 1: CNMI, Guam & RMI G 3: Pohnpei & Yap
G 2: Palau G 4: Chuuk & Kosrae
Group 1 (CNMI, Guam & RMI) Issues resolved Key factors that led to resolution of these issues
‐ Limited capacity – initially in data collection & training needs but now in data analysis
‐ recruitment/retention of trained personnel (CNMI/Guam) ‐ (Partial resolution) ‐ resolved issue of data collection, but now
new issue is data analysis (new training need)
‐ Financial resources ‐ more money available but problem w/ distribution and procurement (so money not going to where it needs to go)
‐ Procurement issues ‐ locally ‐ Lack of donors towards long‐term monitoring protocol (LTMP) ‐ Low priority towards LTMP’s from local funds, due to lack of will
Issues NOT resolved Key factors that prevented their resolution
‐ Geog issues – remote and isolated is. hard to get to and with increased CC impacts not addressed
2012 Challenges 1. Understanding local impacts of climate change (CC) 2. Testing and evaluating adaptation strategies 3. Integrating stronger socioeconomic (SE) monitoring 4. How to shift from ‘% of established MPAs’ to ‘% of effectively conserved
MPAs’ (e.g., # of MPAs % healthy habitat)

Group 2 (Palau) Issues resolved Key factors that led to resolution of these issues
‐ Local capacity ‐ Provided monitoring training on seagrass, inverts, corals, fish & sedimentation
‐ GIS training ‐ Collaboration between agencies/states ‐ SE monitoring training ‐ Marine & terrestrial enforcement training ‐ Protected Area (PA) management planning ‐ Land‐use management planning ‐ PAN incentivized communities ‐ Contributions from NGOs (i.e., PCS); stronger network ‐ Database development
‐ Geographic issues ‐ Increased MPAs in order to be able to monitor a bigger area
‐ Community‐based training/NGOs/outside funding
Issues NOT resolved Key factors that prevented their resolution
‐ Local capacity
‐ Due to economics ‐ Better opportunities or competing personal goals ‐ Local government not giving priority to monitoring (e.g.,
providing basic operational funds) ‐ Qualified human resource pool is limited
2012 Challenges All related to unresolved issues

Group 3 (Pohnpei, Yap)
Issues resolved Key factors that led to resolution of these issues (all partially resolved)
‐ Mgmt plan/strategic mgmt planning and reporting
‐ Showed practitioners how to do the process. But then after collecting data, don’t know how to turn the data into a report. The revised PIMPAC mgmt guide helps you take out what you did and translate it into action.
‐ Most sites have done CAPs. ‐ Just completed CC community adaptation toolkit, data analysis training,
long swim (UOG), and community training in coral reef monitoring ‐ Local capacity ‐ ‐ Limited human
resource ‐ Added government partners and increased number of community
partners
‐ Financial ‐ NOAA Cooperative Agreement is funding many community‐based projects
‐ Enforcement
‐ had a successful enforcement training (Yap having one now); Yap hosted the 2nd Micronesia Enforcement Workshop on Remote locations in June 2011; Pohnpei gov’t established an enforcement department with Fish & Wildlife
‐ Personnel mgmt training
‐ CAP Coach ‐ PIMPAC Mgmt Training ‐ Vulnerability Assessment Local Early Action Program (VA‐LEAP) – CC
adaptation toolkit
Issues NOT resolved Key factors that prevented their resolution
‐ Insufficient funding
‐ Lack of political will
‐ Too many hands in the pot ‐ Pending FSM PAN
‐ Changes of leadership/priorities ‐ Some good leaders ran for office but didn’t make it
2012 Challenges ‐ Geographical isolation – lack of means of transportation ‐ Increased impacts of CC

Group 4 (Chuuk & Kosrae) Issues resolved Key factors that led to resolution of these issues
‐ Training on data mgmt ‐ ‐ Standard protocols for data analysis ‐ ‐ Management planning – learning
exchange depends on availability of funding
‐
Issues NOT resolved Key factors that prevented their resolution
‐ Turnover of trained personnel ‐ ‐ Enforcement ‐ Even when enforcement training is provided,
wrong people go (happened recently) ‐ Donor objectives don’t match local priority
2012 Challenges ‐ Data interpretation ‐ Communication – tailoring data to community level ‐ See how to link all traditional, state and local government laws to work together
to enforce the laws of MPAs

1
Attachment 4a. Breakout Group #2: How to improve indicators and methods.
New groups
G 1: CNMI & Guam G 3: Kosrae and Pohnpei
G 2: Chuuk, Yap & RMI G 4: Palau
Group 1 – Guam and CNMI ‐ Dave In general, between our two programs, each of our jurisdictions covered more or less of the proposed indicators. For CNMI, the methods were pretty much the same. Guam is a bit different in that our program was designed for a different purpose with the understanding that our fisheries program will implement their part, but that program is in hiatus for now. If there will be a tiered approach, with tier 1 having regular monitoring; tier 2 with community that chooses a subset of T‐1 because of limited hr (not substandard); ‐ Tier 1 – programs that are bit further along in development of their capacity (e.g., species richness level) ‐ Tier 2 – newer programs or those that do not having enough people. Can opt to use Catch per Unit Effort (CPUE),
Photo quadrats. With photo quads, basically just need to know how to take photos so this could be one way to do it.
Benthos Tier 1 Tier 2
Species/generic richness X (species)
X (genera)
Substrate ratios ** X X
Coral cover** X X
Recruitment* X
Coral size class X
* = picked up in coral guadrats? ** = # of points for image analysis? 5pts. In photoquadrat Coral size class ‐ this is done using quadrats, so if doing this, don’t need to do a separate recruitment because it’s picked up in coral quadrats, Recruitment – may require a whole another body or a whole another dive; instead of doing a whole new survey, consider taking in recruits in the quads. How many points are we going to use when we analyze? Fish – again a tiered approach (density, size biomass in Tier 1 ) Tier 2 – may not be ideal to collect fish size due to turnover, etc.

2
Fish Tier 1 Tier 2
Density X X
Species X X (groups)
Size/Biomass X
Belt transect method or SPC method or compromise? ‐ Suggestion on exploring the SPC method. We found in Guam that when we start off using both to figure out
which is better for our target fish, SPC tended to do a better job. A lot of fish folks may agree that belt doesn’t capture the transient species which move away. But it still won’t get the sharks, jacks, etc.
‐ Also need to consider incorporating catch/effort data, but for this, we’ll need to learn individual species. If possible, account for local names in data entry.
‐ CNMI uses SPC because we have high variability on the reefs so if you use belt, you won’t catch some species at certain times. With longswim, we may capture this but would need another extra person. SPC does 5 m distance and you get everything from moving species in different water columns. So give‐and‐take. If we could incorporate 400m swim, that would be ideal, but would need another person in the water.
‐ Statistical power of the SPC – every 250 m we have 12 SPCs along that line. About 10 SPC, you are at a point where you can account for the species – so once you reach 10 SPCs, you can have a full picture of that particular species.
‐ Integration of SE data with ecological: Do CPUE (catch per unit effort) – finding a relationship of what we’re seeing on the water and what is happening
Survey logistics – choreography on how best to do it and minimize bias (eg., scaring the fish away); also calibration among observers
Macro invertebrates Tier 1 Tier 2
Density X X
Species X X
Macro‐inverts – Guam only measuring size of tridacna (clams); Similar with fish catch and effort data, can also get data set integrated with in situ data (incorporate catch/effort data) Water quality –
‐ Focus on biological criteria ‐ mostly EPA data (if available and appropriate – turbidity) ‐ In addition to a secchi disc approach, may be we can do a more qualitative approach (e.g., taking photos
during storm events). These are not hard data but provide photo record which can help in explaining quantitative data. So not absolute numbers but can show that it’s clear or not clear.
Site selection – where your sample stations are, how you actually lay out your transect

3
‐ How much effort and how much can we do for this? We need to be realistic – if we design something too big that we can’t implement it, it’s not good. ‐ Since you’re doing both, how does SPC compare against belt? We get better results for the bigger and larger food
fish being captured with the SPC. ‐ Just wondering for a non‐tech person, how it keeps coming up that we’re moving towards a standardized monitoring. What is MC’s expectation on level of detailed information of what they deem as effective for all of us. ‐ I think you guys need to understand that you are the decision makers for the measures – that’s what you’re
tasked to do. So important for folks in this room to feel empowered and determine what can be done realistically. Also the framework of the MC is a tool that is trying to bring resources to the region. As Pete mentioned, it’s about the people – it’s us and this is what it’s all about.
‐ This ties in with what people said about calibration of observers. The power of observers is also dependent on resources to do the calibration and thus need to identify calibration standards.
‐ Could we effectively accomplish the goal of that exercise? I’m a bit confused about what just happened ‐ We’ll make more time for the discussion. ‐ The purpose was to get an assessment of where we are on this but now what we need to do is prioritize what we
have. We have a limited amount of time so should use it to do it quick ‐ need to do a prioritized list for tomorrow morning. Let’s end the discussion here until we have the consolidated list tomorrow.
‐ The presentations seem like a lot but only a few areas are where we disagreed – eg., seacumber size and depth. These we can quickly go over today.
‐ The need to integrate data, and with the MC to include the land‐based sources of pollution, how are you going to integrate this with watershed? So consider finding the linkages of these two areas. Satellite photos may help to make these linkages for the MC.
‐ What’s driving the whole discussion is that are we asking the right questions? And are we using the right methods to answer these questions? Before tomorrow, need to think about really getting at these parameters.
Seacumbers’ design (sample design, etc.) today and more complex tomorrow. ‐ Set a standardized sub‐category (select one/two spp) of sea cucumbers. Is this only relevant to couple of
jurisdictions? ‐ Send out some sort of spreadsheet of what are the most important species and come to a consensus of selection.‐ CNMI doesn’t value sea cucumber so we wouldn’t want it in our monitoring program ‐ Madel – our group went back and forth between what minimum information do we need to collect about any
indicator that will answer any question at the top. So need to think of which question we’re asking about meeting the MC objective as we are thinking of our species.
Size – do we do size or abundance? ‐ size is not an issue 90% of the time. Only those who have too many will encounter problems because can take up so much time to measure hundreds of seacucumbers Going back to Madelsar’s question: Does effectiveness mean the health of the ecosystem health or population of the fish enough? Conclusion: minimum standard for the region, and anything more specific to each jurisdiction will be tackled by that jurisdictions. So make a minimal list of species for the region as a baseline but need to ensure that each species does answer our questions. DEPTH – one depth Just need to realize that if only one depth, we can only speak about that single depth. True but we’re not interested in the whole water column of the MPA – we are interested if the MPA is working, compared to a

4
reference site, because it’s for management. For other studies, we’d need to design another study specific to it and that could be individualized based on each jurisdiction’s specific interests. RECRUITS – do we measure it? Yes or no? – Yes because it’s imp for the ecosystem, but if too difficult, we can combine it with the quadrat ‐ Agree – also Yes, but we have different methods. Which will it be? If we do it with belt transect, it’s the same transect we use for inverts and fish. ‐ If people are using size classes, we need to incorporate those. – 5cm or less is the standard. This goes with Dave’s Tier 1 and Tier 2, etc. To be resolved tomorrow:
‐ Seagrass – in our out? ‐ Water quality – in our out? ‐ Fish method (belt or SPC)? ‐ Design/frequency

5
Group 2 – Yap, Chuuk & RMI ‐ Benedict Idea of putting numbers up is to show how much work would be needed, especially in areas that won’t have as much capacity as others. Each station within a MPA (and its reference site) incorporates 5 (50m) transects.
Island/Jurisdiction # of MPAs
# of stations in each MPA
# of stations surveyed in
MPAs
# of stations surveyed in
Reference sites
Total # of stations
surveyed
Yap 9 2 18 18 36
Chuuk 7 2 14 14 28
RMI 5 2 10 10 20
Given that these islands have very limited capacity, the burden of doing 2 stations in each site (MPA and/or its reference site) is too much. Coral Benthic, Fish and Depth
Island/ Jurisdiction
Benthic Belt transect
Macro invertebrates
B. transect
Coral recruits
B. transect
Coral colony
Fish B. transect
SPC method
# of depth(s)
Yap X X n/a X 6‐1m2
X n/a 2
Chuuk X X n/a n/a X n/a 1
RMI X X n/a n/a n/a X 2
‐ Based on the high number of stations, we suggest reducing the number of stations to 1 per MPA and 1 for
its reference site. We need to think about the feasibility of carrying these monitoring out effectively and reliably, especially when we also need to consider personnel capacity and training in taxonomy.
‐ Yap has begun doing coral colony surveys using quadrat, which captures coral recruits. Jurisdictions need more training on taxanomy and more human resources to get to this level ‐ beyond just counting.
Depth – RMI and Yap uses two; Chuuk uses 1 how many should we all agree to use for the region? Frequency of fish counts – increase sample size and increase power of statistics (e.g., instead of once a year, do twice a year). Should we do sampling only during calm months? Should we also focus only on residential food species? Invertebrates – measured by belt transects. Problem with high spatial variation (you go to one site and find lots, to another site, and find only few). This makes it hard to detect change over time. Should we reduce emphasis of inverts as MC indicator or should we increase sampling sites? Water Quality – this is really for site‐specific needs. These are open‐ended statements. Eg., relying on macroinverts as indicators. We can cover them at a later discussion.

6
Group 3: Kosrae & Pohnpei – Selino and Osamu Photo quadrat for corals and belt transect for fish Corals – not go down to species level but sticking to genus (with photo quadrat)
‐ Planning to include recruitment (e.g., considering 1.0 sq meter point count) ‐ Also plan to include size class of corals; record temperature and bleaching events using YSI
temperature loggers Fish – (Kosrae not doing biomass, but plans to)
‐ Biomass ‐ Belt or long swim for large reef food fish (LRFF) ‐ Include ecological indicators ‐ Belt/SPC ‐ Include 3 herbivorous fish categories ‐ Belt/SPC
Macro inverts – (COTs, clams, trochus) ‐ Belt transect now used (and will stay this way) ‐ Size (not all macro) ‐ Include species/unit area ‐ Frequency ‐ Maximum: 4/year; Minimum: 2/year
Seagrass – (Kosrae not yet doing this but plans to) ‐ Random points; ‐ Include species/unit area ‐ Canopy cover ‐ Percent cover ‐ Need to include this in database so we can share with community ‐ Frequency ‐ Maximum: 4/year; Minimum: 2/year
Sedimentation – plan to do traps ‐ Water quality measured with YSI ‐ Mass (how much load is being dumped into the water) – measured with traps (need to standardize
size of traps) ‐ Frequency of survey: Maximun (monthly); Minimum (quarterly)
Questions: ‐ Is bleaching survey done as part of the photo quadrat? Not really – sometimes. ‐ For climate change bleaching, might need to do a different design for it – not an MPA design

7
Group 4: Palau – Asap Benthos ‐ size class ‐ Optional for jurisdictions (e.g., Palau sees it more as a research question rather than a monitoring question) ‐ Frequency ‐ for sites that are remote and/or have limited capacity, propose every 2 years Fish Longswim ‐ added, but keeping it optional for jurisdictions Depth: 2 (3m & 10m, but optional to allow site specificity); agreed on one depth at last meeting, but now think two depths are needed. Frequency: annually for both MPA & control sites; monitoring period will vary based on geographic locations, wind and other weather events; same site every year Species list: Need to determine how we will develop a list of species that can be used by all. Palau gets its list from its National Marine Species Act and targets functional groups/fish families So for the fish, we kept everything the same, but wanted to have discussion with other jurisdictions on a list of fish to be measured by all. Monitoring – proposed at least once a year, but acknowledge that it will depend on each site (if they want to do more, they do it on their own). Macroinvertebrates Size ‐ Measure diameter (e.g., sea urchin – measure widest part) Species ‐ All sea cucumber species – not only target ones anymore (except for the synaptic sea cucumber (Usekerel a Iechadedaob) because too difficult. Frequency: 1/year, along with fish ‐ For measuring cucumbers, it’s good for biomass, but why are you doing it? Like fish, it’s also a sign of overfishing. Can’t tell overfishing by just counting numbers – also need size‐ like fish. Sometimes seacumbers can take up all morning to survey. Should consider whether to take it out or not because it can be very time‐consuming. Water Quality Turbidity ‐ Looked at MC Terrestrial W.G.’s list, and picked only turbidity Frequency: 1/year

1
Appendix 4b: Ad Hoc Small Working Group Discussion (This group was tasked to continue discussion on marine
indicators and bring recommendations to the big group the following day.)
Plenary discussion on indicators and methods for MC Marine Monitoring Plan
Fish (SPC vs. Belt) Recommendation: Belt transect
• However, OK to do SPC or both and we can evaluate in, say five years. (Normally two SPCs per station)
Belt is more convenient, just inside and outside MPAs. We just started, so we can reassess in five years, etc. Important to evaluate and keep the conversation open - Survey design for fish surveys: As a minimum: Number of representative habitats needed If you only choose one, what are you losing out on? To understand your MPA, one is sufficient Options:
• Follow original protocol • Pohnpei – every habitat and two stations per
habitat • Pick your most dominant habitat (e.g. Nimpal
Channel – you would do channel) Suggestion for bare minimum: One depth, one habitat, but then need to do inside and outside, inclusive of all MPAs Power of comparison over time How do you get error bars as small as possible? This can then free up manpower, resources for monitoring sites outside of MPAs Guam can’t get to 30% with new MPAs – Three levels to consider: site level, MPA island-wide, MC It’s OK, as long as it’s clear what people are most interested in If you want to focus on a specific site, then you need to understand what you need Bare minimum for MC, simple, not a burden, but something you can build on and receive guidance, and still compare sites across jurisdictions Strong selling point for leaders, rate in change over time for fish populations – Deal with observer bias through training, Pete’s example for Nimpal – the methods were enough, not sure if a site is only 60% Good enough to pick roughly same spot for transect – so GPS, depth and direction? Probably 5 50-m transects, photo quadrats, Criteria for hard bottom, soft bottom? Yim and Pete ignore soft bottom – we’re interested in corals
Recruits Recommendations:
• 1st 10m of belt transect, (30 cm x 10 cm) – only corals less than 5 cm
• coral colony size quadrat (only if you are already doing the colony size – genus OK)
• Training to genus for consistency
Seagrass – Options:
• Site-specific, jurisdictional issue? • Let’s ask how many people have
seagrass in their sites? • Come up with recommendations if it’s
relevant • If you don’t have seagrass, don’t worry
about it – • Criteria, • CNMI similar to outer reef – 5 guys score
five data points along 50 m transects • Palau does shorter • Percent cover Halodule • What about fish? Not yet in CNMI, but
want to
• Inverts – 2 x 50m • Fish – 5 x 50 m or SPC • Palau Photo and in situ – will evaluate • Any epiphytic growth methods?- make
note of it Water quality Secchi disc seen more as outreach, but can be powerful with lots of data points Recommendation: Drop from regional But can Measure turbidity if you have the means at each station Filter data we collect through bio-criteria – e.g. this blue green is an indicator of these pollutants Biggest turbidity issues in high islands

2
Plenary discussion on recommendations from Indicators’ Working Group – Facilitated by Trina Corals – no issue Coral recruits - Fish – recommendation: stick to 5x15 belt transect, and if you are doing SPC, continue and we’ll compare methods later. Same with timed swim Survey design – one depth and one habitat; inside and outside and must do all MPAs
‐ These are the minimum; in Palau we’re doing 3 stations and we’ll keep that but for the regional work, 1 station is going to be the min
‐ Roughly same transect each Seagrass
‐ Photoquadrat (will be inserted in the CPCE code) Water quality – site specific so recommend to drop from base regional indicators and up to each jurisdiction - If you choose a seagrass, then what if you miss this habitat in the MPA? If the seagrass is one habitat in the
site, and we go with 1 station, then it might be missed out, but in Palau, Teluleu is all seagrass so we don’t have a choice.
- We also agreed that if there are different habitats, we pick the most dominant - We didn’t discuss time/frequency – is this annual or biannual? Fish is annual, but corals don’t need this frequent intervals – may be once every two years. - What if we do 2x a year for fish to increase sampling? May be benthic – every 2 years ; Fish – every year TIMING was incorporated into the Protocol. - Is there any way we can determine or measure how to see our progress? Is our method giving us the
answers we expected? Need to determine a way and a time to be able to check this. There will be the database so we’ll have that medium
- Suggestion was made to also determine the timeline - At the next meeting do we want to have initial discussion or already talking about trends? Jan 3013 would
be a good check-in point since we said that we’ll have baseline data by end of 2012. Reaching consensus: Fish surveys: obtained (discussion on next steps – eg., taxonomy training) - Survey design: consensus was not immediately reached until further discussion on min # of sites, but since the group felt it would be too difficult to set a minimum number of site, the consensus reached was that it will be up to each jurisdiction.
- Have a question on the requirement on “all MPAs” – some places don’t have monitoring activities yet. So suggestion to use “as many MPAs as possible (or consider additional stations in MPAs that you monitor)
- With this level of scale, will it help the local community or Palau as an individual jurisdiction? No, as this is the minimum set that is important to all of us at both jurisdiction and regional level. However, this can be used to also inform site level, but would need to increase replicates at the site level. if you want more information for the site level, you’d need to do more replicates.
- Need minimum number of sites per jurisdiction? RMI is only monitoring 1 site for now

3
- To make this discussion easier, why don’t you just provide a minimum recommendation that they will aspire to achieve? Too complicated because depends on site. Others agreed.
Why don’t we start small and go from there? - For Palau, the 30% is what’s helping to drive our work because we’re trying to meet it by making greater
effort to focus on getting states with larger sites to join in the PAN and MC. So we’re not talking about numbers of MPAs but percentage.
Coral recruits: consensus reached Size of quadrat ‐ (1st 10mx30cm of belt transect) [the 30cm is because we don’t do size frequency]
‐ Quadrat: 1mx1m ‐ Corals less than 5m ‐ 10 quadrats per station
‐ Coral colony size quadrat (if you already monitoring colony size) ‐ ID to genus level (can provide training for genus for consistency) ‐ Some corals like porites or ___ with diff growth forms to also document if it’s a table, etc. Seagrass: consensus reached How many countries not monitoring seagrasss? RMI and Kosrae. RMI not doing this because no MPA there has seagrass. However, if Kosrae has seagrass in their MPA, need to strive to initiate this. - This is what Dave was saying – if you have several habitats in the MPA and seagrass is one of them, do you need to do it? No – it’s optional or only if it’s the dominant habitat. Do it if you feel it’s important and don’t if you don’t think it’s important. We’ve been referring to seagrass as a habitat but what about seagrass as an indicator? Seagrass is actually a better indicator than corals – they die sooner so give you early warning and they recover fast too. If corals die, they take a long time to recover. Water quality to be dropped at the regional level: consensus reached Timing: consensus reached Fish – annual or bi-annual Corals – annual or bi-ennial (once every two years) Inverts – annual Seagrass – bi-annual (twice a year) (at least once a year) CONSENSUS ON ALL RECOMMENDATIONS REACHED!

1
Attachment 5: Breakout Group #3 (Progress & Future Directions of SE Monitoring) Groups
G 1: Chuuk, Yap & RMI G 3: CNMI and Guam
G 2: Kosrae and Pohnpei G 4: Palau Group 1: Chuuk, Yap and RMI
1. What is current status of SE monitoring in your jurisdiction ‐ All have participated in trainings, mostly SEM‐P ‐ Have conducted SEM‐P assessment in at least 1 MPA site, with assistance from NOAA, MCT and
PIMPAC; have communicated findings back to the community ‐
2. What have been key issues & challenges to conducting and using SE monitoring ‐ Survey development difficult (e.g, translation to local vernacular) ‐ SE monitoring priority shift/focus – “priority shift or focus”, refers to the community’s main
priority, when they ask us for assistance (e.g., to establish MPAs), has been fisheries. So the SE component tends to come later and thus not always the priority. So the best we can do is try to incorporate it into existing ecological monitoring programs.
‐ Limited human resources ‐ in FSM, the ecological monitoring folks are the same people who also do the SE monitoring
‐ Also need to have good relations with community or groups – this makes it more complicated compared to ecological monitoring
‐ Limited funding
3. What is your jurisdiction hoping to accomplish over the next two years in the area of SE monitoring? ‐ Finalize current reports and distribute them ‐ Integrate SE survey results into site management ‐ Seek funding to carry out SE monitoring ‐ Develop SE monitoring plan(s) or find a way to integrate SE monitoring into ecological monitoring
Group 2: Kosrae & Pohnpei ‐ Scotty
1. What is current status of SE monitoring in your jurisdiction ‐ expect to do SEM‐P this year, after Pohnpei
2. What have been key issues & challenges to conducting and using SE monitoring ‐ Lack of man power ‐ Survey design ‐ Analysis ‐ Community cooperation ‐ Expert long‐term

2
3. What is your jurisdiction hoping to accomplish over the next two years in the area of SE monitoring? ‐ SEM‐P Pohnpei in April; follow up SEM‐P in Kosrae
Group 3: CNMI & Guam
1. What is current status of SE monitoring in your jurisdiction CNMI – did SEM‐P surveys but not focused on MPAs ‐ Fishermen’s survey along with this which was focused on understanding traditional knowledge
about fisheries ‐ Economic evaluation ‐ Household fisheries survey in 95 done by Dept of Fish and Wildlife but never saw results – Pete
has the report
Guam – UOG has done an evaluation of reef resources ‐ Resident Micronesian on MPA and what are the issues with that ‐ Pop perceptions for climate change
2. What have been key issues & challenges to conducting and using SE monitoring ‐inter‐agency – problem with working with each other ‐ community cooperation too – we do a lot of surveys but sometimes they don’t want to cooperate or consider them inconvenient ‐ funding (our current funding doesn’t prioritize SE studies) – so personnel and capacity (like Vanessa said, same folks doing both ecol and SE so no time)
3. What is your jurisdiction hoping to accomplish over the next two years in the area of SE monitoring?
‐ Would like to be able to work with other sectors (e.g., Public Health) to do SE surveys, since our grants don’t allow us to do SE. We can find out how much fish is being consumed. Or Dept of Food Stamp – food stamps can be used to buy fish so can use this to determine fish consumption
‐ More people trained in SE – like start an internship program with focus on SE – where Guam has been for several decades with bio monitoring which needs to be synthesized as they’re not standardized so slow. I want to be there with SE for Guam to implement surveys with standard methods where you can see trends the same way you see ecological data. More powerful when you see results that way.

3
Group 4: Palau
1. What is current status of SE monitoring in your jurisdiction ‐ 15 surveys done towards resource mgmt Ngiwal: (2010) ‐ by PICRC Koror – Rock Islands (1998) – by PCS
Helen Reef: (2009) – SEM‐Pasifika training
Koror – Rock Islands [Ngemelis] ‐ (2001) – by Community Conservation Network
Ngardmau: (2010) – by PCS Koror – Rock Islands (2007) ‐ by PICRC
Ngchesar: (2006) – by PICRC Koror – Rock Islands (ongoing)‐ by PICRC
Kayangel – livelihood survey: (2010)
Koror – Building survey
Ngarchelong – Ebiil Conservation Area: (2007) – by PICRC
National ‐ fish subsistence: 2003 by PICRC
Ngarchelong – Ebiil Conservation Area: (2010) ‐ by PICRC
National – Pacific Adaptation to Climate Change focusing on food security: (2011) – by PALARIS, PH, PCC, Bureau of Agriculture, PCAA, and 16 state governments
‐ Many people have done SE surveys, but independent of each other. All prior surveys were done
independently and separately, by different entities and at different times; 1 is currently ongoing ‐ 6 completed with reports and have been utilized into resource management objectives and
activities ‐ Current capacity – we feel we have that capacity available; PICRC has trained 4 states; Madelsar
(PALARIS) has trained 50 enumerators from all the states;SEM‐P training produced at least 5 trainers. So have a pool of people that can help out with SE monitoring in Palau
‐ Some of the surveys did not go through analysis and reporting
2. What have been key issues & challenges to conducting and using SE monitoring ‐ Community too close‐knit biases between respondents and enumerators (e.g., Helen Reef
survey). Sometimes outsiders would make better enumerators. ‐ Cultural faux pas (in Tobi, a brother cannot interview a mother) ‐ ‘Incentivize’ the survey – e.g., provide incentives for tourists if they are informants ‐ SE is not priority, compared to ecological surveys ‐ Lack of awareness and understanding by the communities ‐ Flaws in survey design ‐ Time consuming ‐ Relevancy of objectives and usefulness
3. What is your jurisdiction hoping to accomplish over the next two years in the area of SE monitoring?
‐ Application of survey results to policies and management o Results of the surveys – few were influential in management o Opportunity has not been provided to integrate it into policy (not necessarily useful)
‐ Mainstreaming and integrating SE into PAN sites’ management plans ‐ Strengthen capacity in SE process

Attachment 6: Breakout Group #4 (Regional Collaboration & ME Tools Sites)
Breakout Group #4 (ME Tools & Regional Collaboration): 1. Ideas for at least 2 pilot sites for ME Tools (Liz, asked to consider GEF sites as it requires similar tool)
2. Think about current regional collaboration to see if it’s good or needs some changes; opportunities for future
collaboration – request from TNC, MCT, PICRC to know what you think could be done better or what could be added.
New Groups (again)
G1: Pohnpei & RMI G3: Yap & Kosrae G2: Guam & Palau G4: CNMI & Chuuk
1. Next pilot sites for ME Tools
Island/Jurisdiction Next ME :Pilot Sites Island/Jurisdiction Next ME :Pilot Sites CNMI Managaha & Bird Island Chuuk Onunun & Sapuk Guam Piti & Achong Yap Reey & Nimpal Pohnpei Enipein & Dehpek Palau Ngiwal & Peleliu Kosrae Utwe (BP) & Tafunsak RMI Arno & Namdrik
2. Regional Collaboration
Grp
Current Collaboration
1 No presentation 2 Physical/face‐to‐face meetings very helpful
SPC partnership – very successful CEPCRM partnership – good. Should continue to build and foster partnership with JICA TNC’s work with climate change commended
3 Training on database is good, but not enough – need on‐site database training at each jurisdiction with follow‐up to continue communication.
Socio‐economic monitoring – not enough of this has been done and we still need assistance at local and regional level
4 Need to figure how to assess the Challenge better – beyond fish, and ME Tool and more on integrating the
data. Problems with regional focus on outreach for the Challenge
‐ MC Young Champions’ focus – not sure if Young Champions (YC) in CNMI play a big enough role in marketing the Challenge.
‐ YC needs to be re‐evaluated – they may not be the best marketers for the SC ‐ Work plan for YC from Focal Points may be helpful in ensuring they are effective. ‐ Promotion of data into ‘MY Young Champions’ campaign ‐ we don’t want people to confuse MC with
other initiatives because this is really big and should stand alone ‐ not for others to piggy‐back on it.
Problems with translation of data to leaders

‐ Increase communication between MC Measures Group and MC Steering Committee (SC). Have them hear a summary of what happened in the meeting and not in a 30 page report. This
would help the whole SC to have one message. Also for group to communicate with respective MC Focal Points and keeping that line open so
that they know what’s going on. This would vary between jurisdictions, but it brings up the point of communicating internally.
The Measures Group doesn’t know what the process is for getting decisions from the SC on results of our work to where they should be for the region. There is the expectation that the SC will take what we have and approve it, but not sure if this is what they are supposed to do.
The decision was made at the 2006 MC Planning Meeting that we don’t need to go back to the SC as these are the right people to make decisions regarding measuring effective conservation. As to how much of a priority should be given to any output of our work, this is really up to each jurisdiction. So when we talk about “effective conservation”, it is meant to be a regional decision, but it’s really up to the jurisdictions and the group.
Sometimes work done for MC may need to be formally recognized (e.g., PICRC’s evaluation by Japan). While there is no formal agreement because organizations come and go, this situation can be made formal. MC baselines to be established by end of 2012.
Grp
Future Collaboration
1 Set up standard indicators for monitoring mgmt effectiveness (not just conservation effectiveness) Everyone should do at least one round of the MC marine monitoring protocol, data entered into database and
analyzed. Also present outcomes (how this information has been used to influence decisions) Critique of monitoring protocol – what works, what doesn’t? Better communication between on the ground people and focal points, so they are better able to report the
findings of the monitoring/status of the MC to the leaders Community data
2 GCC – looking at starting a conservation mgmt degree program; capacity building
UOG – finding ways to collaborate resources within the region. One way to tap into their resources (and other research institutions) is to make list of all research needs that you can give them which they can use to get funding to come here. This would be something that MCRO can initiate
MCES taking place in Guam next month (March) and it coincides with UOG’s 60th anniversary so this would be a good time to ask them about this.
Need to incorporate climate change (CC) lens into ongoing work
3 Share resources, including human resources (e.g., scientists, managers & community leaders). This can be done through learning exchanges.
On‐site database training at each jurisdiction with follow‐up to continue communication. Socio‐economic monitoring – need assistance at local and regional level
4 SC to determine a more formal recognition of the Working Group members.
Do learning exchanges (Les) between monitoring groups from all jurisdictions – this can assist other jurisdictions in meeting their capacity needs.
Shared learning in taxonomy/data/database.

1
Attachment 7: Discussions on MPA Management Effectiveness Tool
Strengths and weaknesses of the existing tool Develop next steps and a draft work plan to roll out the MPA ME Tool Workplan for MPA ME Tool in Micronesia – identify potential sites and individuals who will implement the tool
‐ RMI, Chuuk, Yap, Palau (places where this tool has been tried) provided positive feedback on their experiences. Palau
PAN sites are required to do evaluation – this could serve that purpose. The tool is better at addressing management effectiveness, rather than conservation effectiveness. In terms of supporting this tool, we hope that it will be one of the tools in evaluation that is used throughout the region. This afternoon we’ll be talking about collaboration in the future, or what we’d like. And we would like the jurisdictions to help us raise awareness of the tool and implementing new test sites.
‐ Chuuk, Kosrae, Guam and CNMI (all others who have not tried it yet) said that they would like to try out this tool. Guam needs to have a monitoring program and this tool will be helpful to get resource agencies/relevant people at the table and identify what they are doing and what works. A certain level of accountability is needed in order to move forward and this tool would offer a more formal way to get this done, in an objective manner. CNMI echoed Guam in that they, too, have some differences amongst some key agencies so this tool will be a good way to bring people to the table and have a good discussion rather than blaming each other.
‐ So there is a consensus that it’s good to have an evaluation tool. But just need to tweak it a bit more to improve it. Some suggestions that were provided included adding biophysical values; adding a range of options; and inserting a historical timeline for the site so that we can see how long (or what is the average time period) did a site take to go from point A to point B. Another suggestion is to improve design of the tool is to use percentage instead of YES/NO or numbers.
‐ As for time – don’t think we can capture the time element for scoring but may insert a date section on all relevant questions.
‐ Regarding the scoring component, it might lead to the perception of judgment on the community members and MPA managers (e.g., low score = poor manager) so need to find a way to make this really clear throughout the exercise.
‐ In terms of the 75% passing score, to allow the group to go to the next level, there is a tendency to just want to get this score or better, but that is not the main goal here – the MAIN GOAL is to have a standardized way to assess and evaluate how you’re doing in your management effort so that you can better identify ways to adapt and improve the management effort. As for not emphasizing the score, the tool is intended for them to use it internally so if they are doing it by themselves, it might not be seen as a judgment. So we are thinking of how to tweak it in such a way so that during the process, you don’t see your score until the end. This way, you won’t be influenced by the score during the exercise and it might help to reduce bias from respondent(s).
‐ The way the tool is presented is based on the scores, but Wayne saw it not as that, but focused on what can be improved. So not a score to measure management, but a score to measure how well you do adaptive management – how well you adapt. The numbers don’t really matter by themselves, but they are useful in highlighting where there needs to be improvement so we can check those places and figure out ways to improve them.
‐ As most management plans are now being reviewed in Palau, standardizing how we evaluate management is good, but it’s so site‐based (local). How might it be useful at the regional level. Also is there still room to add a
quick gauge to determine progress (e.g., simple answers of effective or not)? To clarify, this tool is not so different from other MPA management evaluation tools (e.g., How is Your MPA Doing). In fact, they are pretty similar in that we all ask similar questions. The only difference is, the MPA ME Tool consists of a progression component, which others don’t have.

2
‐ With the question on funding, since the goal there is to determine if there is funding for the MPA and sustainable financing is the key – so to determine this, may be better to ask if they have access to sustainable financing, instead of asking about source of income (or ask both). Also wondering if this design could be simplified and be more flexible to accommodate various management plans’ goals. Regarding funding, (e.g., funding source and if they are secure for a certain period of time) – there are questions that try to get at that, but asked in a combination of questions rather than through a single question. This may need some tweaking on Table 4 (indicators), as it’s probably this table where we can make the changes to accommodate that – maybe separate the tables or increase number of tables to choose from with what is relevant, what is not, what is missing, etc. We’ll need a separate discussion for this. The wordings of the questions also are not really capturing our reality (e.g., asking about staff when there are only volunteers, etc.) so it didn’t capture that reality. So need to calibrate the criteria to reflect the reality of management (e.g., reflect the ability of community to raise funds for this work). Also need to figure out how to make it shorter but still maintain quality and standardization.
‐ If this tool is intended to help managers do better in adaptive management, indicators that can measure this should be incorporated in the design.
‐ Assessment team membership needs improvement ‐ thus far, has been made up of community members, but may need to also include other stakeholders. Without outsiders, you don’t get the critical eye that is needed. As for SE indicators – the core SE working group may be able to come up with SE indicators for this tool and if this happens, it will be a good way to ensure SE is part of management effort.
‐ The tool seemed to have been useful for Wayne but may suffer from subjectivity and thus may have some weaknesses. How much are we dependent on it to measure the MC? In my general perspective, when you see the health of the resources, it pretty much translates through the society and whether or not they have successful management plans in place. Is it adequate for MC evaluation goals– basically questions of standardized nature (if counting two sites and one has high biodiversity and the other is a dredged channel in airport – not the same. SUBJECTIVITY – may be a situation where it compares to itself rather than against others. So just need to be sure we’re not comparing apples and oranges – that it’s valid so we can still use it but use it for what it’s intended. As a reminder, this is just another piece of the scorecard puzzle and not meant to be the only thing to look at, but it is something that can help us determine how the MPAs are doing.
‐ Need to put some rational on why we’re doing it this way. As with selection of the best method to count fish, there are different ways to do this, but we choose one because we have a rational for it and it needs to be standardized so we can compare different jurisdictions. So need feedback and if it’s not applicable at the regional level, let us know and we may need to have a different one for the region.
‐ Timeline: the final version of this tool is expected to be done by June – but it still won’t be a final product. This is our first attempt at this and we’re learning as we go along. As for inserting the SE indicators, those indicators are not dictated by the tool, but by the management plans so even if the draft is semi‐finalized by June, it’s not too late.
Workplan A) Recommended sites to carry out ME Tools (done in Break Out Group #4)
Island/Jurisdiction Next ME :Pilot Sites Island/Jurisdiction Next ME :Pilot Sites CNMI Managaha & Bird Island Chuuk Onunun & Sapuk Guam Piti & Achong Yap Reey & Nimpal Pohnpei Enipein & Dehpek Palau Ngiwal & Peleliu Kosrae Utwe (BP) & Tafunsak RMI Arno & Namdrik
B) Individuals to work on these are members of these groups from their respective jurisdictions. At least they will be the initial contacts when Steven goes to their jurisdiction.

Fish species Fish functional Fish trophic Fish trophic 2 a b
Acanthurus lineatus Small-bodied acanthurid herbivores herb 0.0412 2.85
Acanthurus blochii Large-bodied acanthurid Detritivores secondary 0.0296 3.030266
Acanthurus dussumieri Large-bodied acanthurid Detritivores secondary 0.0426 2.8683
Acanthurus leucocheilus Small-bodied acanthurid herbivores herb 0.0261 3.024
Acanthurus lineatus Small-bodied acanthurid herbivores herb 0.0412 2.85
Acanthurus mata Small-bodied acanthurid herbivores/planktivores plank 0.0282 3.007953
Acanthurus mauliceps Small-bodied acanthurid herbivores herb 0.0270 2.945
Acanthurus nigoris Small-bodied acanthurid herbivores herb 0.0282 3.007953
Acanthurus nigricans Small-bodied acanthurid herbivores herb 0.0670 2.669
Acanthurus nigricauda Small-bodied acanthurid herbivores herb 0.0261 3.024
Acanthurus nigrofuscus Small-bodied acanthurid herbivores herb 0.0301 3.028367
Acanthurus nigroris Small-bodied acanthurid herbivores herb 0.3007 3.029211
Acanthurus olivaceus Small-bodied acanthurid Detritivores secondary 0.2941 3.039514
Acanthurus pyroferus Small-bodied acanthurid herbivores herb 0.2941 3.039514
Acanthurus triostegus Small-bodied acanthurid herbivores herb 0.0380 2.569683
Acanthurus thompsoni Small-bodied acanthurid planktivores plank 0.2948 3.034901
Acanthurus xanthopterus Large-bodied acanthurid Detritivores secondary 0.0252 3.173706
Aetobatus narinari Ray benthic_inverts secondary 0.0059 3.13
Alectis ciliaris Trevally/Jack piscivores secondary 0.0412 2.85
Anyperodon leucogrammicus Large-bodied grouper piscivores secondary 0.0032 3.328
Aphareus furca Small-bodied snapper piscivores secondary 0.0105 3
Aprion virescens Large-bodied snapper piscivores secondary 0.0271 2.886269
Balistapus undulatus Triggerfish benthic_inverts secondary 0.0058 3.554
Balistoides viridescens Triggerfish benthic_inverts secondary 0.0292 3.018285
Bodianus axillaris Wrasse benthic_inverts secondary 0.2632 2.857143
Caesio caerulaurea Fusilier planktivores plank 0.0221 2.946
Caesio teres Fusilier planktivores plank 0.0195 3.0117
Calotomus carolinus Small-bodied parrotfish herbivores herb 0.2521 3.111388
Calotomus spinidens Small-bodied parrotfish herbivores herb 0.0140 3.15
Carangoides ferdau Trevally/Jack piscivores secondary 0.0314 2.851155
Caranx lugubris Trevally/Jack piscivores secondary 0.0198 3.001
Caranx ignobilis Trevally/Jack piscivores secondary 0.0064 3.216
Caranx melampygus Trevally/Jack piscivores secondary 0.0276 2.917987
Caranx sexfasciatus Trevally/Jack piscivores secondary 0.0318 2.93
Carcharhinus albimarginatus Shark apex apex 0.0031 3.243
Carcharhinus amblyrhynchos Shark apex apex 0.0088 3.05
Carcharhinus melanopterus Shark apex apex 0.0013 3.50776
Cephalopholis argus Large-bodied grouper piscivores secondary 0.0186 2.987
Cephalopholis leopardus Large-bodied grouper piscivores secondary 0.0149 3
Cephalopholis spiloparaea Small-bodied grouper piscivores secondary 0.0164 3.0303
Cephalopholis urodeta Small-bodied grouper piscivores secondary 0.0282 2.817751
Cetoscarus bicolor Large-bodied parrotfish herbivores herb 0.0157 3
Chaetodon auriga Butterfly fish corallivores secondary 0.0322 2.829431
Chaetodon bennetti Butterfly fish corallivores secondary 0.0323 2.885079
Chaetodon citrinellus Butterfly fish corallivores secondary 0.0298 3.001381
Chaetodon lunulatus Butterfly fish corallivores secondary 0.0296 2.9895
Chaetodon mertensii Butterfly fish corallivores secondary 0.0238 3.793382
Chaetodon ornatissimus Butterfly fish corallivores secondary 0.0296 2.9895
Chaetodon oxycephalus Butterfly fish corallivores secondary 0.0296 2.9895
Chaetodon reticulatus Butterfly fish corallivores secondary 0.0296 2.9895
Attachment 8: Monitoring Fish List

Chanos chanos Milkfish benthic_inverts secondary 0.0068 3.025
Cheilinus fasciatus Wrasse benthic_inverts secondary 0.0149 3
Cheilinus trilobatus Wrasse benthic_inverts secondary 0.0260 3.05947
Cheilinus undulatus Cheilinus undulatus benthic_inverts secondary 0.0211 2.959
Chlorurus bleekeri Small-bodied parrotfish herbivores herb 0.0319 2.927
Chlorurus frontalis Large-bodied parrotfish herbivores herb 0.0224 3.0394
Chlorurus japanensis Small-bodied parrotfish herbivores herb 0.0224 3.0394
Chlorurus microrhinos Large-bodied parrotfish herbivores herb 0.0273 2.93
Chlorurus sordidus Small-bodied parrotfish herbivores herb 0.0319 2.927
Choerodon anchorago Orange-dotted tuskfish benthic_inverts secondary 0.0145 3.125
Coris aygula Wrasse benthic_inverts secondary 0.0183 3.488575
Coris gaimard Wrasse benthic_inverts secondary 0.0109 3
Ctenochaetus binotatus Small-bodied acanthurid Detritivores secondary 0.0324 2.874629
Ctenochaetus cyanocheilus Small-bodied acanthurid Detritivores secondary 0.2976 3.039514
Ctenochaetus flavicauda Small-bodied acanthurid Detritivores secondary 0.2976 3.039514
Ctenochaetus striatus Small-bodied acanthurid Detritivores secondary 0.0272 3.2284
Ctenochaetus strigosus Small-bodied acanthurid Detritivores secondary 0.0022 3
Dascyllus aruanus Damselfish herbivores herb 0.0345 2.988875
Diodon hystrix Pufferfish secondary 0.0424 2.618925
Elagatis bipinnulata Large-bodied reef-pelagic piscivores secondary 0.0234 2.24
Epibulus insidiator Wrasse benthic_inverts secondary 0.0262 3.081018
Epinephelus cyanopodus Small-bodied grouper benthic_inverts secondary 0.0135 3.061
Epinephelus fasciatus Small-bodied grouper piscivores secondary 0.0245 3.04066
Epinephelus fuscoguttatus Large-bodied grouper piscivores secondary 0.0244 3.057234
Epinephelus lanceolotus Large-bodied grouper piscivores secondary 0.0173 3
Epinephelus maculatus Large-bodied grouper piscivores secondary 0.0230 3.058796
Epinephelus merra Small-bodied grouper piscivores secondary 0.0244 3.001453
Epinephelus miliaris Small-bodied grouper benthic_inverts/piscivores secondary 0.0255 3
Epinephelus polyphekadion Large-bodied grouper piscivores secondary 0.0211 3.225245
Gerres acinaces Mojarra benthic_inverts secondary 0.0140 2.964
Gerres erythrounus Mojarra benthic_inverts secondary 0.0140 2.964
Gnathodentex aureolineatus Small-bodied emperor benthic_inverts secondary 0.0270 3.062543
Gnathodon speciosus Trevally/Jack benthic_inverts/piscivores secondary 0.0199 2.995
Gomphosus varius Wrasse benthic_inverts secondary 0.0253 2.702688
Gracila albomarginata Large-bodied grouper piscivores secondary 0.0152 3.0063
Gymnosarda unicolor Large-bodied reef-pelagic benthic_inverts/piscivores secondary 0.0105 3.065
Gymnothorax flavimarginatus Eel piscivores secondary 0.0004 3.35
Halichoeres hortulanus Wrasse benthic_inverts secondary 0.2717 2.717391
Halichoeres trimaculatus Wrasse benthic_inverts secondary 0.0269 2.735843
Hemigymnus fasciatus Wrasse benthic_inverts secondary 0.2445 3.174603
Hemigymnus melapterus Wrasse benthic_inverts secondary 0.0280 2.922618
Heteropriacanthus cruentatus Squirrelfish benthic_inverts secondary 0.0152 3
Hipposcarus longiceps Large-bodied parrotfish herbivores herb 0.0222 2.9706
Kyphosus biggibus Rudderfish herbivores herb 0.0275 2.86
Kyphosus cinerascens Rudderfish herbivores herb 0.0129 3.1506
Kyphosus vaigiensis Rudderfish herbivores herb 0.0200 3.037
Kyphosus sp (Kyphosidae) Rudderfish herbivores herb 0.0275 2.86
Lethrinus erythracanthus Large-bodied emperor piscivores secondary 0.0165 3.0434
Lethrinus harak Small-bodied emperor piscivores secondary 0.0262 3.04226
Lethrinus obsoletus Large-bodied emperor piscivores secondary 0.0264 3.010788
Lethrinus olivaceus Large-bodied emperor piscivores secondary 0.0286 2.863844
Lethrinus sp. (Lethrinidae) Small-bodied emperor piscivores secondary 0.0249 3.064758
Lethrinus xanthochilus Large-bodied emperor piscivores secondary 0.0267 2.963903

Lutjanus argentimaculatus Large-bodied snapper benthic_inverts/piscivores secondary 0.0054 3.206
Lutjanus bohar Large-bodied snapper piscivores secondary 0.0248 3.099286
Lutjanus ehrenbergii Small-bodied snapper piscivores secondary 0.0026 3.335
Lutjanus fulvus Small-bodied snapper piscivores secondary 0.0271 2.985217
Lutjanus gibbus Large-bodied snapper piscivores secondary 0.0250 3.147762
Lutjanus kasmira Small-bodied snapper piscivores secondary 0.0165 2.98
Lutjanus monostigma Large-bodied snapper piscivores secondary 0.0270 2.912522
Lutjanus semicinctus Large-bodied snapper piscivores secondary 0.0040 3.428
Macolor macularis Large-bodied snapper benthic_inverts/piscivores secondary 0.0145 3
Macolor niger Large-bodied snapper benthic_inverts/piscivores secondary 0.0145 3
Melichthys niger Triggerfish planktivores plank 0.0058 3.554
Melichthys vidua Triggerfish planktivores plank 0.0058 3.554
Monotaxis grandoculis Large-bodied emperor benthic_inverts secondary 0.0360 2.851
Mulloidichthys flavolineatus Goatfish benthic_inverts secondary 0.0089 3.0602
Mulloidichthys vanicolensis Goatfish benthic_inverts secondary 0.0099 3.015
Myripristis adusta Squirl-Cardinal-Soldier benthic_inverts secondary 0.0249 3.0416
Myripristis amaena Squirl-Cardinal-Soldier benthic_inverts secondary 0.0280 3.261143
Myripristis berndti Squirl-Cardinal-Soldier benthic_inverts secondary 0.0303 3.003364
Myripristis kuntee Squirl-Cardinal-Soldier benthic_inverts secondary 0.0264 3.467647
Myripristis murdjan Squirl-Cardinal-Soldier benthic_inverts secondary 0.0193 3.034
Myripristis sp (Holocentridae) Squirl-Cardinal-Soldier benthic_inverts secondary 0.0303 3.003364
Naso annulatus Naso other planktivores plank 0.0334 2.71537
Naso brevirostris Naso other planktivores plank 0.0602 2.743
Naso hexacanthus Naso other planktivores plank 0.0424 2.854
Naso lituratus Naso lituratus herbivores herb 0.0497 2.839
Naso tuberosus Naso other herbivores herb 0.0580 2.806
Naso unicornis Naso unicornis herbivores herb 0.0266 3.035454
Naso vlamingii Naso other planktivores plank 0.0525 2.843
Nebrius ferrugineus Shark apex apex 0.0210 2.6979
Neoniphon sammara Squirl-Cardinal-Soldier benthic_inverts secondary 0.0289 2.888354
Neoniphon sp (Holocentridae) Squirl-Cardinal-Soldier benthic_inverts secondary 0.0094 3
Oxycheilinus unifasciatus Wrasse benthic_inverts secondary 0.0169 3
Paracirrhites forsteri Hawkfish benthic_inverts/piscivores secondary
Paracirrhites spp. Hawkfish benthic_inverts/piscivores secondary
Parupeneus barberinoides Goatfish benthic_inverts secondary 0.0144 3.1299
Parupeneus barberinus Goatfish benthic_inverts secondary 0.0249 3.122492
Parupeneus trifasciatus Goatfish benthic_inverts secondary 0.0036 3.451
Parupeneus cyclostomus Goatfish benthic_inverts secondary 0.0124 3
Parupeneus insularis Goatfish benthic_inverts secondary 0.0135 3.0671
Parupeneus multifasciatus Goatfish benthic_inverts secondary 0.0246 3.202777
Parupeneus pleurostigma Goatfish benthic_inverts secondary 0.0119 3
Pempheris oualensis Squirl-Cardinal-Soldier benthic_inverts secondary 0.0133 3
Platax teira Batfish omnivores secondary 0.0425 2.975
Plectorhinchus albovittatus Sweetlips omnivores secondary 0.0270 2.8848
Plectorhinchus crysotaenia Sweetlips omnivores secondary 0.0126 3.0786
Plectorhinchus lineatus Sweetlips omnivores secondary 0.0126 3.0786
Plectorhinchus picus Sweetlips omnivores secondary 0.0144 3.03
Plectropomus areolatus Large-bodied grouper piscivores secondary 0.0107 3.0862
Plectropomus laevis Large-bodied grouper piscivores secondary 0.0206 3.230329
Plectropomus leopardus Large-bodied grouper piscivores secondary 0.0233 3.068464
Plectropomus oligacanthus Large-bodied grouper piscivores secondary 0.0107 3.08621
Priacanthus hamrur Squirl-Cardinal-Soldier planktivores plank 0.0300 2.8008
Pseudobalistes flavimarginatus Triggerfish benthic_inverts secondary 0.1297 2.6061

Pterocaesio marri Fusilier planktivores plank 0.0101 3.152
Pterocaesio tile Fusilier planktivores plank 0.0112 3
Pygoplites diacanthus Anglefish benthic_inverts secondary 0.0276 3
Rhinecanthus rectangulus Triggerfish benthic_inverts secondary 0.0355 2.875
Sargocentron caudimaculatum Squirl-Cardinal-Soldier benthic_inverts secondary 0.0232 2.9554
Sargocentron spiniferum Squirl-Cardinal-Soldier benthic_inverts/piscivores secondary 0.0262 3.118811
Scarus altipinnis Large-bodied parrotfish herbivores herb 0.0267 3.029321
Scarus dimidiatus Large-bodied parrotfish herbivores herb 0.0184 3.058
Scarus forsteni Large-bodied parrotfish herbivores herb 0.0186 3.0455
Scarus frenatus Small-bodied parrotfish herbivores herb 0.0279 3.06
Scarus fuscocaudalis Small-bodied parrotfish herbivores herb 0.0186 3.0455
Scarus ghobban Large-bodied parrotfish herbivores herb 0.0233 3.264667
Scarus niger Small-bodied parrotfish herbivores herb 0.0255 3.159957
Scarus oviceps Small-bodied parrotfish herbivores herb 0.0180 3
Scarus psittacus Small-bodied parrotfish herbivores herb 0.0253 3.318709
Scarus rubroviolaceus Large-bodied parrotfish herbivores herb 0.0136 3.109
Scarus schlegeli Small-bodied parrotfish herbivores herb 0.0281 2.969192
Scarus sp Small-bodied parrotfish herbivores herb 0.0254 3.214452
Scarus spinus Small-bodied parrotfish herbivores herb 0.0186 3.0455
Scarus tricolor Small-bodied parrotfish herbivores herb 0.0180 3
Scarus xanthopleura Large-bodied parrotfish herbivores herb 0.0184 3.058
Selar crumenophthalmus Trevally/Jack benthic_inverts secondary 0.0234 3.193776
Siganus argenteus Rabbitfish herbivores herb 0.0250 2.883
Sigaus doliatus Rabbitfish herbivores herb 0.0104 3.2721
Siganus fuscescens Rabbitfish herbivores herb 0.0137 3.0682
Siganus lineatus Rabbitfish herbivores herb 0.0219 2.9983
Siganus puellus Rabbitfish herbivores herb 0.0176 3.028394
Siganus punctatus Rabbitfish herbivores herb 0.0095 3.2761
Siganus randalli Rabbitfish herbivores herb 0.0120 3.011
Siganus vulpinnus Rabbitfish herbivores herb 0.0145 3.12169
Sphyraena qenie Large-bodied reef-pelagic apex apex 0.0056 3
Stegastes fasciolatus Damselfish herbivores herb 0.0478 3.1
Stegostoma varium Shark apex apex 0.0000 0
Sufflamen bursa Triggerfish benthic_inverts secondary 0.0216 3
Sufflamen chrysopterum Triggerfish benthic_inverts secondary 0.0153 3.152
Thalassoma lutescens Wrasse benthic_inverts secondary 0.0240 3.041862
Thalassoma trilobatum Wrasse benthic_inverts secondary 0.0240 3.041862
Trachinotus baillonii Trevally/Jack apex apex 0.0083 3.19723
Triaenodon obesus Shark apex apex 0.0014 3.382
Tuna sp (Scombridae) Large-bodied reef-pelagic apex apex 0.0057 3.34
Moolgarda seheli mullet detritivores/herbivores secondary 0.0372 2.629
Variola louti Large-bodied grouper apex apex 0.0241 3.066253
Zanclus cornutus Butterfly fish corallivores secondary 0.0286 3.369908
Zebrasoma veliferum Small-bodied acanthurid herbivores herb 0.0297 2.944554
Zebrasoma flavescens Small-bodied acanthurid herbivores herb 0.0148 3.16
Related Documents