*(77,1*67$57(':,7+,16,*+7

Welcome message from author
This document is posted to help you gain knowledge. Please leave a comment to let me know what you think about it! Share it to your friends and learn new things together.
Transcript

��������������������� ������

��
Copyright, Trademarks, Patents
The software described in this document is furnished under license, and may be used or copiedonly in accordance with the terms of such license and with the inclusion of the copyright noticeshown on this page. Neither the software, this document, nor any copies thereof may beprovided to or otherwise made available to anyone other than the licensee. Title to andownership of this software remains with Cognex Corporation or its licensor. CognexCorporation assumes no responsibility for the use or reliability of its software on equipment thatis not supplied by Cognex Corporation. Cognex Corporation makes no warranties, eitherexpress or implied, regarding the described software, its merchantability, or its fitness for anyparticular purpose.
The information in this document is subject to change without notice and should not beconstrued as a commitment by Cognex Corporation. Cognex Corporation is not responsible forany errors that may be present in either this document or the associated software.
Copyright © 2000-2001 Cognex Corporation.All Rights Reserved.
This document may not be copied in whole or in part, nor transferred to any other media orlanguage, without the written permission of Cognex Corporation.
Cognex P/N 590-6368
March 2001

���
The hardware and portions of the software described in this document may be covered by oneor more of the following U.S. patents. Other U.S. and foreign patents are pending.
In-Sight Patents pending
Hardware 4,972,359; 5,526,050; 5,657,403; 5,793,899
Vision Tools 5,495,537; 5,548,326; 5,583,954; 5,602,937;5,640,200; 5,717,785; 5,742,037; 5,751,853;5,768,443; 5,796,868; 5,818,443; 5,825,483;5,825,913; 5,845,007; 5,859,466; 5,872,870;5,909,504
The following are registered trademarks of Cognex Corporation:
Cognex
Cognex, Vision for Industry
The following are trademarks of Cognex Corporation:
The Cognex logo
In-Sight
Other product and company names mentioned herein are the trademarks, or registeredtrademarks, of their respective owners.

��
CE Compliance Statement
CE Declaration of Conformity
Manufacturer Cognex CorporationOne Vision DriveNatick, MA 01760 USA
Declares this CE-marked product
Product Number In-Sight 3000
Complies With 73/23/EEC Low Voltage Directive89/336/EEC Electromagnetic Compatibility Directive
Compliance Standards EN 60950:1992 Electrical Safety A1:1993, A2:1993, A3:1995
EN 55022 RF Emissions Information Technology
EN 50082-1 EMC Immunity Standard
European Representative Cognex FranceImmeuble le Patio104 avenue Albert 1er92563 Rueil MalmaisonFrance

�
Table of Contents
Introduction................................................................................................................... xi
Who Should Read This Book? ................................................................................xi
How to Use This Book.............................................................................................xi
For More Information .............................................................................................. xiiPart 1: Using the Interface ............................................................................................ 1Chapter 1: Acquiring a Working Image ....................................................................... 2
Acquiring a Working Image ..................................................................................... 2Step 1 — Start In-Sight ................................................................................... 2Step 2 — Adjust the Camera .......................................................................... 3
Chapter 2: Moving Around the Interface..................................................................... 6
What is the Spreadsheet? ....................................................................................... 6
Navigating the In-Sight Interface ............................................................................. 6Main Menus..................................................................................................... 8Using the Control Pad ................................................................................... 10Using the Keyboard....................................................................................... 12Using the Mouse ........................................................................................... 13Using Interactive Graphics ............................................................................ 13
Chapter 3: Saving & Loading Jobs............................................................................ 15
What is a Job?....................................................................................................... 15Lesson: Saving a Job.................................................................................... 15Lesson: Loading a Job.................................................................................. 16
Chapter 4: Entering Formulas.................................................................................... 17
What is a Formula? ............................................................................................... 17Cell References............................................................................................. 17
The Formula Editor................................................................................................ 18Cell Section Mode ......................................................................................... 20Lesson: Entering Simple Formulas ............................................................... 21Lesson: Entering Formulas with Cell References......................................... 21Lesson: Entering Simple Functions .............................................................. 23Lesson: Editing Formulas.............................................................................. 24
Chapter 5: Working With Blocks................................................................................ 25
What is a Block?.................................................................................................... 25Lesson: Marking a Block............................................................................... 25Lesson: Editing Blocks.................................................................................. 26

��
Chapter 6: Using Property Sheets ............................................................................. 30
What is a Property Sheet? .................................................................................... 30
What is a Structure?.............................................................................................. 31Lesson: Opening A Property Sheet .............................................................. 31Lesson: Changing Parameter Values ........................................................... 31Lesson: Using Interactive Graphics .............................................................. 32Lesson: Inserting Cell References in Values ................................................ 34Lesson: Inserting Formulas in Values........................................................... 34
Part 2: Vision Processing ........................................................................................... 37Chapter 7: Acquiring Images ..................................................................................... 38
How Does the Spreadsheet Update?.................................................................... 38Lesson: Acquiring From Manual Triggers..................................................... 38Lesson: Acquiring from External Triggers..................................................... 39
Chapter 8: Finding Features....................................................................................... 41
Why Do I Need to Find Features?......................................................................... 41
Finding Connected Regions .................................................................................. 42Lesson: Finding Connected Regions Using ExtractBlobs ............................ 42Lesson: Finding Connected Regions Using FindBlobs................................. 45Lesson: Finding Connected Regions Using SortBlobs................................. 47
Finding Edges........................................................................................................ 49Lesson: Finding Edges Using FindLine ........................................................ 50Lesson: Finding Edges Using FindSegment................................................. 53Lesson: Finding Edges Using FindMultiLine................................................. 54Lesson: Finding Edges Using FindCurve ..................................................... 56Lesson: Finding Edges Using FindCircle...................................................... 59
Finding Patterns .................................................................................................... 62Lesson: Finding Patterns Using FindPatterns .............................................. 62
Chapter 9: Using Features to Find Objects .............................................................. 66
Why Combine Features?....................................................................................... 66Lesson: Using PointToLine ........................................................................... 67Lesson: Using LineToLine ............................................................................ 70Lesson: Using PointToPointAngle ................................................................ 73Lesson: Creating a Fixture............................................................................ 75
Chapter 10: Making Measurements........................................................................... 79
What is a Measurement? ...................................................................................... 79Lesson: Counting Pixels ............................................................................... 79Lesson: Counting Features........................................................................... 84Lesson: Measuring Distances....................................................................... 84

���
Chapter 11: Creating Decision Points ....................................................................... 88
What is a Decision Point? ..................................................................................... 88
Converting Measurements into Decision Points ................................................... 88Comparison................................................................................................... 89Logical ........................................................................................................... 89Conditionals .................................................................................................. 89
Decision Point Formula Examples ........................................................................ 89Chapter 12: Communicating Results ........................................................................ 91
Using Discrete Output ........................................................................................... 91Lesson: Configuring Discrete Output Options............................................... 92Lesson: Writing Discrete Outputs ................................................................. 93
Using Serial Output ............................................................................................... 95Lesson: Configuring Serial Output Options................................................... 95Lesson: Writing Serial Outputs ..................................................................... 96
Chapter 13: Making a Run-time Interface.................................................................. 98
What is a Custom View? ....................................................................................... 98Lesson: Understanding Graphics Functions................................................. 99Lesson: Defining a Custom View ................................................................ 102
Chapter 14: Configuring for Startup........................................................................ 105
Lesson: Selecting the Startup Job....................................................................... 105Appendix A: The Profiler .......................................................................................... 106Appendix B: Remote Job Selection......................................................................... 107
Lesson: Initiating a Job Load............................................................................... 107
Lesson: Responding to a Job Load..................................................................... 108Appendix C: Sample Images .................................................................................... 110

����
List of Figures
Figure 1-1. System Menu............................................................................................. 3
Figure 1-2. Unfocused Image in Live Mode................................................................. 4
Figure 1-3. Focused Image Beneath the Transparent Spreadsheet Overlay.............. 5
Figure 2-1. Enter, Edit, and System Menus................................................................. 8
Figure 2-2. In-Sight Interface Control Pad ................................................................. 10
Figure 3-1. Save & Load Dialog................................................................................. 15
Figure 3-2. Save Job Dialog ...................................................................................... 16
Figure 4-1. Formula Editor ......................................................................................... 18
Figure 4-2. Cell Selection Mode................................................................................. 20
Figure 4-3. Simple Arithmetic Formula in the Formula Editor.................................... 21
Figure 4-4. Formula with Cell Reference in Formula Editor....................................... 22
Figure 4-5. Cell Reference Formula in Spreadsheet ................................................. 22
Figure 4-6. Simple Function in Formula Editor .......................................................... 23
Figure 5-1. Edit Menu................................................................................................. 26
Figure 5-2. Hiding Rows............................................................................................. 28
Figure 6-1. Typical Property Sheet ............................................................................ 30
Figure 6-2. Typical Structure...................................................................................... 31
Figure 6-3. Options within the Enter Menu ................................................................ 32
Figure 6-4. Defining a Move Region .......................................................................... 33
Figure 6-5. Inserting Formulas in Values................................................................... 35
Figure 7-1. Triggering Options within the AcquireImage Property Sheet .................. 39
Figure 8-1. Different Types of Features ..................................................................... 41
Figure 8-2. ExtractBlobs Property Sheet ................................................................... 43
Figure 8-3. Defining a Region .................................................................................... 44
Figure 8-4. ExtractBlobs Function Inserted in Spreadsheet ...................................... 45
Figure 8-5. FindBlobs Property Sheet........................................................................ 46
Figure 8-6. FindBlobs Function Inserted in Spreadsheet .......................................... 47
Figure 8-7. SortBlobs Property Sheet ........................................................................ 48
Figure 8-8. SortBlobs Function Inserted in Spreadsheet........................................... 49
Figure 8-9. FindLine Property Sheet.......................................................................... 50
Figure 8-10. Defining a FindLine Region ................................................................... 51

��
Figure 8-11. FindLine Function Inserted in Spreadsheet........................................... 52
Figure 8-12. FindSegment Property Sheet ................................................................ 53
Figure 8-13. FindSegment Function Inserted in Spreadsheet ................................... 54
Figure 8-14. FindMultiLine Property Sheet ................................................................ 55
Figure 8-15. FindMultiLine Function Inserted in Spreadsheet ................................... 56
Figure 8-16. Defining a FindCurve Region ................................................................ 57
Figure 8-17. FindCurve Function Inserted in Spreadsheet........................................ 58
Figure 8-18. FindCircle Property Sheet ..................................................................... 59
Figure 8-19. Defining a FindCircle Region................................................................. 60
Figure 8-20. FindCurve Function Inserted in Spreadsheet........................................ 61
Figure 8-21. FindPatterns Property Sheet ................................................................. 62
Figure 8-22. Defining a Model Region ....................................................................... 63
Figure 8-23. Defining a Find Region .......................................................................... 64
Figure 8-24. FindPatterns Function Inserted in Spreadsheet .................................... 65
Figure 9-1. PointToLine Function............................................................................... 67
Figure 9-2. PointToLine Property Sheet .................................................................... 68
Figure 9-3. PointToLine Function Inserted in Spreadsheet ....................................... 69
Figure 9-4. LineToLine Function ................................................................................ 70
Figure 9-5. LineToLine Property Sheet...................................................................... 71
Figure 9-6. LineToLine Function Inserted in Spreadsheet......................................... 72
Figure 9-7. PointToPointAngle Function .................................................................... 73
Figure 9-8. PointToPointAngle Property Sheet.......................................................... 74
Figure 9-9. PointToPointAngle Function Inserted in Spreadsheet............................. 75
Figure 9-10. Fixture in the Spreadsheet .................................................................... 76
Figure 9-11. PlotCross Property Sheet ...................................................................... 77
Figure 9-12. PlotCross Function Inserted in Spreadsheet......................................... 78
Figure 10-1. ExtractHistogram Property Sheet .......................................................... 80
Figure 10-2. Defining an ExtractHistogram Region ................................................... 81
Figure 10-3. ExtractHistogram Function Inserted in Spreadsheet............................. 82
Figure 10-4. FindMultiLine Function .......................................................................... 85
Figure 10-5. PairEdges Property Sheet ..................................................................... 86
Figure 10-6. PairEdges Function Inserted in Spreadsheet........................................ 87

�
Figure 12-1. Discrete Output Dialog .......................................................................... 92
Figure 12-2. Output Details Dialog............................................................................. 93
Figure 12-3. WriteDiscrete Property Sheet ................................................................ 94
Figure 12-4. Serial Port 1 Dialog................................................................................ 95
Figure 12-5. WriteSerial Property Sheet .................................................................... 97
Figure 13-1. Custom View.......................................................................................... 98
Figure 13-2. Graphics Control Functions................................................................. 100
Figure 13-3. Graphics Display Functions................................................................. 101
Figure 13-4. Configuring a Custom View in the Spreadsheet.................................. 102
Figure 13-5. Custom View Dialog ............................................................................ 103
Figure 13-6. Custom View of the Spreadsheet........................................................ 104
Figure 14-1. Startup Dialog...................................................................................... 105
Figure A-1. In-Sight Profiler ..................................................................................... 106
Figure B-1. Discrete Input Dialog............................................................................. 107
Figure C-2. Discrete Output Dialog.......................................................................... 108
Figure C-3. Discrete Output Details Dialog.............................................................. 109
Figure C-1. Image1A.bmp........................................................................................ 110
Figure C-2. Image1B.bmp........................................................................................ 111
Figure C-3. Image1C.bmp ....................................................................................... 111
Figure C-4. Image2A.bmp........................................................................................ 112
Figure C-5. Image2B.bmp........................................................................................ 112
List of Tables
Table 2-1. In-Sight Interface Navigation Configurations .............................................. 7
Table 2-2. Basic Keyboard Navigation Keystrokes.................................................... 12
Table 2-3. Basic Mouse Navigation Actions .............................................................. 13
Table 2-4. Accessing Interactive Graphics ................................................................ 13

��
IntroductionWelcome to In-Sight™, a compact, stand-alone machine vision sensor for automatedinspection and process control. In-Sight’s innovative, built-in spreadsheet interface greatlysimplifies the task of developing, operating, and maintaining vision applications.
Who Should Read This Book?You should read Getting Started with In-Sight to quickly learn the most important features ofIn-Sight’s spreadsheet-based user interface. It is written primarily for engineers andprogrammers who are configuring In-Sight systems, though novice users will also find it helpful.
Getting Started with In-Sight does not assume an in-depth knowledge of machine vision, but byreading it you will become familiar enough with In-Sight to start creating your own machinevision applications.
This book is not a comprehensive reference to every detail of the interface; nor is it ageneralized tutorial on machine vision. Its goal is to make you comfortable enough with theIn-Sight interface to explore it on your own, and to prepare you for understanding its moreadvanced features.
How to Use This BookGetting Started with In-Sight consists primarily of a series of lessons designed to introduce youto the fundamentals of the In-Sight spreadsheet interface. Some lessons depend on conceptsintroduced in previous lessons, so it is generally best to read them in order, particularly if youare new to machine vision.
To assist you in following along with the lessons, bitmap images of the part used for this book’slessons are included on the CD-ROM that came with your In-Sight (Image1A.bmp,Image1B.bmp, Image1C.bmp, Image2A.bmp, and Image2B.bmp). Alternatively, you can setupthe In-Sight camera to acquire images directly from the images in Appendix C: Sample Images.
NOTE: The screen captures shown and the features described in this book are currentas of version 2.00 of the In-Sight firmware. Visit the In-Sight Online SupportCenter at www.cognex.com/inSight to download updated documentation, ifavailable.

���
For More InformationOther resources available to help you learn about the In-Sight vision sensor and itsspreadsheet interface include:
• The following documents describe how to connect the vision processor, digital camera,control pad, and other components. They also contain specifications, mechanicaldrawings, and other hardware details:
Installing the In-Sight 1000Cognex P/N 590-6346 (English)Cognex 590-6346F (French)Cognex 590-6346J (Japanese)
Installing the In-Sight 3000Cognex P/N 590-6348 (English)Cognex 590-6348F (French)Cognex 590-6348J (Japanese)).
• In-Sight Guide and Reference, an HTML Help file provided on the In-Sight CD-ROM.• In-Sight computer-based tutorials, which are included on CD-ROM with In-Sight Starter
Accessories Kits.• The In-Sight Online Support Center at
http://www.cognex.com/insight/support/support.asp.

1
Part 1: Using the InterfaceThe chapters in this part of the book introduce the basic components of the spreadsheetinterface. You will learn how to acquire an image from the In-Sight camera and how to navigatethe interface.

2
Chapter 1: Acquiring a Working ImageIn this chapter, you will see how to start In-Sight and capture a working image to use in learningthe In-Sight graphic user interface.
Acquiring a Working ImageBefore you can learn how to use the In-Sight interface, you will need to capture a workingimage. The following describes this procedure.
Step 1 — Start In-Sight
To start the In-Sight system:
1. Ensure that the hardware is connected properly as described in your In-Sight installationmanual.
2. For the In-Sight 3000, switch on the VGA monitor, then apply power to the In-Sightprocessor.
3. Ensure that the In-Sight spreadsheet overlay is visible on the VGA monitor. If not, refer toyour In-Sight installation manual.

Chapter 1: Acquiring a Working Image
3
Step 2 — Adjust the Camera
The first time you use the system, you will need to adjust the camera’s focus and aperture toproduce a clear image on your monitor.
NOTE: For specific information on navigating within the In-Sight interface, refer toNavigating the Interface in the In-Sight Guide & Reference contained on yourIn-Sight CD-ROM.
To adjust the camera:
1. Open the System menu (see Figure 1-1).
Figure 1-1. System Menu

Getting Started with In-Sight
4
2. Select Live from the System menu to put the system into live video mode. This willtemporarily remove the semitransparent spreadsheet overlay (see Figure 1-2).
Figure 1-2. Unfocused Image in Live Mode
3. Adjust the camera’s position, focus ring, and lens aperture until you get a clear image onthe monitor.

Chapter 1: Acquiring a Working Image
5
4. Press any key or button to return to the spreadsheet (see Figure 1-3).
Figure 1-3. Focused Image Beneath the Transparent Spreadsheet Overlay
You now have a working image to use as you learn about the In-Sight spreadsheet interface inthe following chapters.

6
Chapter 2: Moving Around the InterfaceIn this chapter, you’ll learn the basics of navigating in the In-Sight interface using the controlpad, a keyboard, or a mouse.
What is the Spreadsheet?The In-Sight graphical user interface (GUI) consists of a semitransparent spreadsheetsuperimposed on a 640x480-pixel video image.
The spreadsheet is a table of cells arranged in 400 rows (0 to 399) and 26 columns (labeled Athrough Z). Individual cells are referred to by column letter and row number: for example, cellC4 is at the intersection of column C and row 4. In most respects, the In-Sight spreadsheetworks much like other spreadsheets you may be familiar with.
You will use the spreadsheet to configure vision applications by inserting expressions calledformulas into its cells (Formulas are discussed in Chapter 4: Entering Formulas). Since thespreadsheet is semitransparent, the image will always be in view.
You configure the spreadsheet one cell at a time. When a cell is highlighted, its formula isdisplayed in the Formula Bar at the top-left corner of the spreadsheet. If you attempt to moveoff the edge of the screen, the spreadsheet will automatically scroll to keep the selected cell inview.
Navigating the In-Sight InterfaceThe In-Sight user interface may be configured using the In-Sight control pad, a keyboard andmouse connected to a Windows® PC, or any combination of the three input devices. Whichinput device(s) you can use depends on the type of In-Sight system you are configuring.

Chapter 2: Moving Around the Interface
7
Table 2-1 lists the methods by which each type of In-Sight Interface can be navigated:
Table 2-1. In-Sight Interface Navigation Configurations
Input Device In-Sight 1000 In-Sight 3000 In-Sight PC Host
Local No Yes Yes1
Control PadNetwork Yes1 Yes2 Yes2
Local No No YesKeyboard
Network Yes3 Yes3 Yes
Local No No YesMouse
Network Yes1 Yes3 Yes1 PC must have a standard, 15-pin game port and joystick driver installed or an available USB port for athird-party control pad.2 From any In-Sight 3000 on the network.3 From any In-Sight PC Host on the network.
The specific actions necessary for navigating the In-Sight interface are context-sensitive, andvary according to the input device that is used.

Getting Started with In-Sight
8
Main Menus
The In-Sight interface has three main menus, as shown in Figure 2-1: System, Enter, and Edit.
Figure 2-1. Enter, Edit, and System Menus
• The System menu contains selections for acquiring live images, saving and loading files,configuring network and serial communications, discrete I/O, user names and logonpermissions, and more. The Settings menu is accessed from the System Menu.
• The Enter menu is used throughout the interface to enter formulas and values intospreadsheet cells and parameters in property sheets.
• The Edit menu provides block-editing operations for spreadsheet cells, disables selectedcells to prevent them from updating, and configures the Custom View of the spreadsheet.The edit menu is also used to access the property sheets for Graphics Controls functionsafter they have been inserted into the spreadsheet.
NOTE: Selections on the menus are context-sensitive. Unavailable selections are grayedout.

Chapter 2: Moving Around the Interface
9
To open the menus from anywhere in the main spreadsheet:
• The System menu
Control Pad Keyboard Mouse
Press the button. Press � or �+� Right-click with mouse pointerover any cell not highlighted.
• The Enter menu
Control Pad Keyboard Mouse
Press and hold the button. Not directly accessible usingthe keyboard. Left-click and hold on any cell.
• The Edit menu
Control Pad Keyboard Mouse
Press the button. Press � or �+� Right-click with mouse pointerover highlighted cell.

Getting Started with In-Sight
10
Using the Control Pad
Unlike a traditional vision system that requires programming from a PC and a keyboard,In-Sight can be configured using only a simple, 10-button control pad (see Figure 2-2).
NOTE: For a comprehensive list of control pad actions by context within the interface,refer to Navigating the Interface in the In-Sight Guide & Reference contained onyour In-Sight CD-ROM.
DirectionButtons
ActionButtons
Shortcut Buttons
Figure 2-2. In-Sight Interface Control Pad
Direction Buttons
The four Direction Buttons are used in many common operations, including interfacenavigation, manipulating graphic regions of interest, incrementing/decrementing numericvalues, and selecting ranges of cells. The exact behavior of the direction buttons is context-sensitive.
The up direction button moves the on-screen highlight up, decreases the size of agraphic region, and increments numeric values. In the spreadsheet, pressing ������holding the button selects an entire column of cells.
The down direction button moves the highlight down, increases the size of a graphicregion, and decrements numeric values.
The left direction button moves the highlight left, decreases the width of a graphicregion, rotates a graphic region counter-clockwise, curves a graphic region up, andselects a digit to increment in a numeric value.
The right direction button moves the highlight right, increases the width of a graphicregion, rotates a graphic region clockwise, curves a graphic region down, and selects adigit to increment in a numeric value. In the spreadsheet, pressing ����������������
button selects an entire row of cells.

Chapter 2: Moving Around the Interface
11
Action Buttons
The four Action Buttons are used to open menus, enter formula and values, and manipulateinteractive graphics.
In the spreadsheet, the up action button opens the System menu. In all other contextsthroughout the interface, the button cancels changes and escapes to the previousmenu or dialog. It works much like pressing the ESC key on a computer keyboard.
The down action button selects the highlighted item and performs an action. The button also opens the Enter menu, but only if it is pressed and held. Otherwise, ifpressed and immediately released the button automatically selects the highlighteditem, or accepts any changes you have just made. Its function is similar to pressingENTER on a computer keyboard.
The left action button accesses various editing shortcuts, including backspace in theformula editor, and zeroing numbers when in numeric edit mode. However, the mostcommon use of the left action button is to access Interactive Graphics mode.
The right action button opens the Edit menu in the spreadsheet and in property sheets,and maximizes numbers when in numeric edit mode.
Shortcut Buttons
The two buttons in the center of the control pad perform two shortcuts:
A The left-center button labeled "A" manually triggers an image acquisition and updatesthe spreadsheet.
B The right-center button labeled "B" switches between the default view and the CustomView of the current spreadsheet job.

Getting Started with In-Sight
12
Using the Keyboard
Table 2-2 shows you the basic keyboard keystrokes needed to navigate within In-Sight.
NOTE: For a comprehensive list of keyboard actions by context within the interface,refer to Navigating the Interface in the In-Sight Guide & Reference contained onyour In-Sight CD-ROM.
Table 2-2. Basic Keyboard Navigation Keystrokes
Keystrokes Action
����Navigate the spreadsheet, menus, and dialogs. Adjust interactivegraphics.
� and
����Selects spreadsheet rows, columns, and cell ranges for block editingoperations.
� Opens the Enter menu, selects highlighted items, and accepts changes.
� Opens the System menu.
� Switches into Interactive Graphics mode.
� Opens the Edit menu.
Manually triggers an image acquire and spreadsheet update.
Switches between the default and the Custom View of the spreadsheet.
Any alphanumericcharacter or symbol.
Inputs values, strings, and formulas.

Chapter 2: Moving Around the Interface
13
Using the Mouse
Table 2-3 shows you the basic mouse actions needed to navigate within In-Sight.
NOTE: For a comprehensive list of mouse actions by context within the interface, referto Navigating the Interface in the In-Sight Guide & Reference contained on yourIn-Sight CD-ROM
Table 2-3. Basic Mouse Navigation Actions
Mouse Action Action
Left-click Selects/opens items throughout the entire interface. Also accepts changes madeto values.
Left-click and hold Opens the Enter menu in the spreadsheet and in property sheets, and adjustsinteractive graphics.
Right-click
In the spreadsheet, opens the Edit menu and the System menu, depending onwhether the right-click action occurs on a selected cell, or outside the selection.Opens the Edit menu in property sheets. Cycles between interactive graphicsmodes.
Right-click and drag Selects spreadsheet rows, columns, and cell ranges for block editing operations.
Using Interactive Graphics
The parameters for many Vision Processing, and other In-Sight functions, can be configured byadjusting an overlay graphic on top of the image. For example, an interactive graphic can beused to easily set the size, position, and rotation for a region of interest, or for training a modelregion. Interactive graphics can be accessed from any cell in the spreadsheet (while instandard or Custom View as permitted by the user’s Access level), or from any parameter valuein a property sheet.
As shown in Table 2-4, the actions necessary for using interactive graphics depends on whichinput device you are using.
Table 2-4. Accessing Interactive Graphics
Control Pad Keyboard Mouse
Press . Or, press and hold to open the Enter menu, thenchoose Graphics.
� Left-click and hold to open theEnter menu, then chooseGraphics.
When you access an interactive graphic, the semitransparent spreadsheet or property sheetoverlay will disappear, and the graphic will be displayed on top of the image. If the highlightedcell or value has an associated graphic, the graphic will appear in red on the image beneath thesemitransparent spreadsheet or property sheet overlay (If a cell or value does not have anassociated graphic, then the default interactive graphics mode will be Zoom).

Getting Started with In-Sight
14
There are 5 types of interactive graphics: regions, circles, crosses, points, and lines. The typeof graphic displayed depends on the type of input required by the cell or value.
NOTE: For a comprehensive list of interactive graphic actions for each input device,refer to the In-Sight Guide & Reference contained on your In-Sight CD-ROM.

15
Chapter 3: Saving & Loading JobsIn this chapter, you will learn how to save and load In-Sight Jobs.
What is a Job?A Job file (*.JOB) is an In-Sight spreadsheet containing formulas and text which performs aspecific set of machine vision tasks. Job file storage is limited to the amount of available flashmemory on the In-Sight 1000 and In-Sight 3000 sensor. File storage is virtually unlimited on anIn-Sight PC Host. The name of the job currently loaded is displayed in the lower-left corner ofthe Save & Load dialog. If the current job has not been saved, it will be "Unnamed."
NOTE: All work entered in the spreadsheet remains in memory as long as the processorhas power or the In-Sight PC Host is open. However, if the processor losespower or you close the In-Sight PC Host, you will lose all unsaved data.Therefore, make sure you save your jobs.
Lesson: Saving a Job
To save a job:
1. From the spreadsheet, open the System menu.2. Select Save & Load to open the Save & Load dialog (see Figure 3-1).
Figure 3-1. Save & Load Dialog

Getting Started with In-Sight
16
3. Highlight < New >, then select Save to open a Text Entry dialog (see Figure 3-2).
Figure 3-2. Save Job Dialog
4. Enter a name for the job using the onscreen keypad.
TIP: If you make a mistake entering your job name, backspace over the last characterentered. If you need to start over, Select Cancel.
5. Select the Save button to accept your changes and return to the Save & Load dialog.6. In the Save & Load dialog, select Close to accept your changes and return to the
spreadsheet.
Lesson: Loading a Job
Loading a job retrieves it from memory or disk storage (In-Sight PC Host). The steps for loadinga job are similar to the steps for saving a job:
1. From the spreadsheet, open the System menu.2. Select Save & Load to open the Save & Load dialog.3. Select the job that you want to load, then select the Load button.4. After you have loaded the job, select Close to return to the spreadsheet.

17
Chapter 4: Entering FormulasIn this chapter, you will learn how to enter formulas into In-Sight spreadsheet cells.
What is a Formula?A formula is a mathematical expression consisting of values and references to values,connected by mathematical operators, and resulting in a new value or set of values. In-Sightconsiders everything you enter into a cell—whether a single constant or a complex vision-processing function—to be a formula. All formulas contained in an In-Sight job spreadsheet areconstructed using the formula editor (see below).
Formulas can return three types of results:
Values Numbers, such as 1.00 or –1.00.
Strings Alphanumeric characters, such as “PASS” or “FAIL.”
Structures A vision-processing function (structures are discussed Chapter 6: UsingProperty Sheets).
Cell References
Formulas can refer to other cells in the spreadsheet by using absolute and relative cellreferences.
Relative cell references point to cells relative to the position of the formula. When copied ormoved to a new location in the spreadsheet, these references automatically adjust to maintainthe same position relative to the formula, as in the following examples:
A5=A3+A4 If this formula is copied to cell B5, it becomes B5=B3+B4.
A5=A3+A4 If this formula is copied to cell A6, it becomes A6=A4+A5.
Absolute cell references point to fixed locations in the spreadsheet, regardless of the formula’slocation. They do not change when the formula is copied or moved. Absolute cell referencesare designated by a dollar sign ($) preceding the cell’s row or column label. By placing thedollar sign appropriately, you can refer to a fixed row, column, or cell, as in the followingexamples:
A5=$A$3+$A$4 If this formula is copied to cell B5, it becomes B5=$A$3+$A$4.
A5=A$3+A$4 If this formula is copied to cell B5, it becomes B5=B$3+B$4.

Getting Started with In-Sight
18
The Formula EditorAs shown in Figure 4-1, In-Sight includes a formula editor that is used to enter formulas intothe spreadsheet. As mentioned earlier, all formulas contained in an In-Sight job spreadsheetare constructed using the formula editor.
NOTE: The formula editor is accessed from the Enter menu.
Formula Bar
Onscreen Keypad
Function Categories
Functions & Function
Subcategories
Context-Sensitive Help
Figure 4-1. Formula Editor
The formula editor is divided into four main sections:
• Formula Bar: The formula bar appears at the top of the formula editor dialog and showsthe formula that is being edited. The formula editor automatically checks the formula forcorrect syntax. If a formula is not valid, the invalid syntax will be highlighted in red; theformula will not be accepted until the syntax error is corrected. A colored cursor indicatesthe current insertion point in the formula, where changes will be made.

Chapter 4: Entering Formulas
19
• Onscreen Keypad: The onscreen keypad occupies the left side of the formula editordialog. In addition to the keys for inserting numeric characters and mathematical operatorsinto formulas, the onscreen keypad provides keys for inserting cell references and text intoa formula, as follows:
Inserts an Absolute cell reference symbol into the formula. Complete the cellreference by manually inserting an alpha character for the Column, and a numericcharacter for the Row, after the ’$’ character (for example, $A1).
Activates Cell Selection mode, for choosing an Absolute cell reference to insert intothe formula.
Activates Cell Selection mode, for choosing a Relative cell reference to insert intothe formula.
Opens the Text Entry dialog for inserting strings of alphanumeric characters andSymbols into the formula.
• Function List: A list of tool categories and subcategories occupies the center and rightsections of the formula editor. As a tool category is highlighted in the center, a list of thatcategory’s functions appears in the right section, organized within subcategories. Thecurrent category and function selections are indicated by a �� �����
• Context Sensitive Help: The bottom part of the formula editor dialog contains context-sensitive help text for quick reference.

Getting Started with In-Sight
20
Cell Section Mode
The most convenient method for inserting absolute and relative cell references into formulas isto use the In-Sight Cell Selection mode. In cell selection mode, cell references are entered byhighlighting and selecting the cells to reference directly in the spreadsheet; the references donot have to be typed in manually.
While in cell selection mode, the display temporarily switches from the property sheet or dialoginto a unique view of the In-Sight spreadsheet. In this view, the spreadsheet is opaque (theimage is not visible beneath the spreadsheet), and a dashed line surrounds the first cell that ishighlighted, as shown in Figure 4-2:
Figure 4-2. Cell Selection Mode
When cells have been highlighted and selected, the display switches back to the property sheetor dialog from which cell selection mode was initiated, and the references for those cells areinserted.
In Figure 4-2, references for cells C7 and D7 will be inserted into the formula contained in cellA11. If more cells were selected than can be used as references at the insertion point of theformula, then only the first cell of the selection, cell C7, will be inserted and the reference to cellD7 will be discarded.

Chapter 4: Entering Formulas
21
Lesson: Entering Simple Formulas
This procedure describes the general procedure for entering simple formulas that do notcontain cell references.
To enter a simple formula into the spreadsheet:
1. Highlight an empty cell where you want to insert the formula.2. Open the formula editor.3. You can enter numbers and basic arithmetic operators (+, -, /, *) with the onscreen
keypad or with the keyboard, if using the In-Sight PC Host, to create a simple formula.Figure 4-3 shows an example of a simple arithmetic formula in the formula editor.
Figure 4-3. Simple Arithmetic Formula in the Formula Editor
4. Once you have entered a formula, select OK to insert the formula into the spreadsheet.
Lesson: Entering Formulas with Cell References
This lesson shows how cell references are included in formulas.
To enter a formula that includes cell references:
1. Highlight an empty cell where you want to insert the formula.2. Open the formula editor.3. Select Absolute Cell Reference or Relative Cell Reference from the onscreen keypad.4. Highlight a cell containing a formula and select that cell to insert the cell reference into
the formula.5. Select a basic math operator from the onscreen keypad to insert it into the formula.

Getting Started with In-Sight
22
6. Repeat step 3, but select a different cell reference to insert in the formula.
Figure 4-4. Formula with Cell Reference in Formula Editor
7. Select OK to insert the formula into the spreadsheet (see Figure 4-5).
Figure 4-5. Cell Reference Formula in Spreadsheet

Chapter 4: Entering Formulas
23
Lesson: Entering Simple Functions
In-Sight includes many standard math, statistic, and trigonometric functions. This lessondescribes the general procedure for entering these functions into a formula.
To enter a simple function:
1. Highlight an empty cell where you want to insert the formula.2. Open the formula editor.3. Select the Mathematics function category.4. Select the Trigonometry subcategory and expand that function list.5. Select the function you want to insert into the Formula Bar.6. Select Absolute Cell Reference or Relative Cell Reference from the onscreen keypad.7. Highlight a cell containing data and select that cell to insert a cell reference into the
formula (see Figure 4-6).
Figure 4-6. Simple Function in Formula Editor
8. Select the button in the formula editor to complete the formula.9. Select OK to enter the formula in the spreadsheet.

Getting Started with In-Sight
24
Lesson: Editing Formulas
After you’ve entered a formula into a spreadsheet cell, you can return to it and edit it asneeded.
To edit a formula string:
1. Highlight the cell containing the formula you want to edit, and open the formula editor.2. Move to the Formula Bar on the top of the formula editor. A text cursor will show the
editing position on the Formula Bar.3. With the text cursor, you are able to move right and left within the formula string as well
as backspace over existing alphanumeric characters and functions.4. When you are finished editing the formula, select OK to return to the spreadsheet.

25
Chapter 5: Working With BlocksIn this chapter, you will learn how to manipulate blocks of cells in a spreadsheet.
What is a Block?A Block is a contiguous, rectangular group of cells in a spreadsheet. You can cut, copy, paste,clear, hide, insert, and remove blocks using functions in the Edit menu.
Lesson: Marking a Block
Before you can copy, cut, hide, or perform other operations on a block of cells, you need tomark the block.
To mark a block of cells:
Control Pad Keyboard Mouse
1. Press and hold the button.
2. Press down ( ���������( ������������������
Press �+� to markcells in rows.
Press �+� to markcells in columns.
1. Right-click and hold on anyhighlighted cell.
2. Drag in any direction.

Getting Started with In-Sight
26
Lesson: Editing Blocks
This lesson describes each of the block-editing functions accessible from the Edit menu, asshown in Figure 5-1.
NOTE: The procedures in this section can be applied to a single cell as well as toblocks of cells.
Figure 5-1. Edit Menu
Copy
Copies a block of cells and stores its formulas in the system’s internal clipboard, leaving theoriginal formulas in place in the spreadsheet.
To copy a block of cells:
1. Mark the block you want to copy, as described in the previous lesson.2. Select Copy from the Edit menu.
Cut
Cuts a block of cells and stores its formulas in the system’s internal clipboard, removing theformulas from the spreadsheet.
To cut a block of cells:
1. Mark the block you want to cut, as described in the previous lesson.2. Select Cut from the Edit menu.

Chapter 5: Working with Blocks
27
Paste
Pastes previously copied formulas contained in the system’s internal clipboard back to thespreadsheet.
To paste a block of cells:
1. Highlight the upper-left cell of the block’s new location.2. Select Paste from the Edit menu.
Clear
Clearing cells permanently deletes their contents. Cleared cells cannot be pasted back into thespreadsheet.
To clear a block of cells:
1. Mark the block of cells you want to clear.2. Select Clear from the Edit menu.
Hide/Unhide Rows & Columns
Hiding rows and columns in the spreadsheet removes them from view. Their data remains inthe spreadsheet, however, and becomes visible again when you unhide them.
NOTE: You cannot select rows and columns at the same time.
To select columns of cells:
Control Pad Keyboard Mouse
Press and hold button.• Press up ( ����������
button to mark currentcolumn.
• Press right ( ����������button to mark additionalcolumns.
• Press �+� to mark
current column.
• Press � to mark adjacentcolumns to the right.
• Left-click on a column labelat the top of thespreadsheet.
• Right-click and hold whiledragging right or left tomark additional columns.
To select a rows of cells:
Control Pad Keyboard Mouse
Press and hold button.• Press up ( ����������
button to mark currentcolumn.
• Press right ( ����������button to mark additionalcolumns.
• Press �+� to mark
current column.
• Press � to mark adjacentcolumns to the right.
• Left-click on a row label tothe left of the spreadsheet.
• Right-click and hold whiledragging up or down tomark additional rows.

Getting Started with In-Sight
28
To hide rows or columns of cells:
1. Select the rows or columns you want to hide, as described above.2. Select Hide Rows or Hide Cols from the Edit menu, as shown in Figure 5-2.
Figure 5-2. Hiding Rows
To unhide rows and columns:
1. Mark, as described above, the rows or columns that fall on both sides of the hidden rowsor columns.
2. Select Unhide Rows or Unhide Cols from the Edit menu.
NOTE: You can find hidden rows and columns by looking for gaps in the row andcolumn label sequence. For example, if column A appears next to column D, thencolumns B and C are hidden.

Chapter 5: Working with Blocks
29
Inserting and Removing Rows
You can also insert rows into, or delete rows from, the spreadsheet.
To insert rows:
1. Mark a block that includes the number of rows that you want to insert. The new rows willbe inserted immediately above the block you mark.
2. Select Insert Rows from the Edit menu.
To remove rows:
1. Mark a block that includes the rows you want to delete.2. Select Remove Rows from the Edit menu.
NOTE: In-Sight cannot insert or delete columns.

30
Chapter 6: Using Property SheetsIn this chapter, you will learn how to use functions by configuring arguments in property sheets.
What is a Property Sheet?A property sheet is a table that allows you to easily configure parameters for a particularIn-Sight function. Whenever a function returns a structure (see next section) or has a largenumber of input parameters, the In-Sight user interface provides a property sheet to simplify thetask of configuring the function. Figure 6-1 shows an example of a typical property sheet.
Figure 6-1. Typical Property Sheet
NOTE: This property sheet contains a Vision Processing function calledExtractHistogram, which is discussed in Chapter 10: Making Measurements. Fornow, ExtractHistogram provides a convenient example of a property sheet.
When opened, the property sheet temporarily replaces the spreadsheet with a table that liststhe default parameters and values. Each row of a property sheet consists of a parametername and a value, or a group of expanded/collapsed parameters and values. Although valuesare usually numbers, references to cells in the spreadsheet, or text strings, they may also berepresented by checkboxes or drop-down lists.

Chapter 6: Using Property Sheets
31
What is a Structure?In-Sight functions that return structures differ from conventional spreadsheet functions. Insteadof returning a single value or text string to a cell, most functions that return structuresautomatically insert an array of additional functions and values into adjacent cells. Figure 6-2shows an example of a typical structure.
Function
Structure Name
Array ofFunctions/Values
Figure 6-2. Typical Structure
NOTE: Structure functions cannot be combined in a single formula with conventionalvalues and operators. When a structure function is inserted in a cell, it must bethe only entity in that cell. The In-Sight formula editor enforces this restriction byactivating and deactivating selections as necessary.
Lesson: Opening A Property Sheet
To see an example of a property sheet:
1. Highlight an empty cell in the spreadsheet and open the formula editor.2. Select the Vision Processing category.3. Select the Histogram subcategory4. Select ExtractHistogram. The ExtractHistogram property sheet will open.5. Select OK. A structure called Hist will appear in the spreadsheet.
Lesson: Changing Parameter Values
Property sheets are initially configured with the default parameter values for the selectedfunction. You can edit these values as necessary to configure the property sheet for yourapplication.
To change the values in a property sheet:
1. Highlight the cell in the spreadsheet containing the Hist structure created in the lastlesson, and open its property sheet.
2. Select the value you want to change.

Getting Started with In-Sight
32
3. Open the Enter menu (see Figure 6-3), which includes the following items:
Number: Inserts a constant value into an edit box, check box, list box, or InteractiveGraphic.
Relative: Switches to Cell Selection mode for selecting a cell from the spreadsheetto use as a relative reference.
Absolute: Switches to Cell Selection mode for selecting a cell from the spreadsheetto use as an absolute reference.
Formula: Activates the formula editor.Graphics: Switches to Interactive Graphics mode for changing the size and position
of the interactive graphic, if available.
Figure 6-3. Options within the Enter Menu
4. Select a menu option (i.e., Number).5. Change the value as needed.6. Select OK to accept your changes, or select Cancel to leave the property sheet
unchanged.
Lesson: Using Interactive Graphics
Some property sheet values are contained in an expandable parameter group. Theseparameter groups are common in structure functions that include a graphical representation,such as an image region.
A region consists of a set of image coordinates that define a contiguous section of the image forprocessing. Since adjusting region coordinates one value at a time would be tedious, property

Chapter 6: Using Property Sheets
33
sheets allow you to adjust most image-related parameter groups as a single InteractiveGraphic.
NOTE: For a comprehensive list of interactive graphic actions for each input device,refer to the In-Sight Guide & Reference contained on your In-Sight CD-ROM.
To use an Interactive Graphic:
1. Highlight the cell in the spreadsheet containing the Hist structure, which was createdearlier.
2. Open the ExtractHistogram property sheet.3. Expand the Region group. Highlight the X parameter value and switch to Interactive
Graphics mode (see Figure 6-4).
Figure 6-4. Defining a Move Region
4. Accept or cancel changes that were made to the interactive graphic. This will return youto the ExtractHistogram property sheet.
5. Select OK to accept your changes, or select Cancel to leave the property sheetunchanged.

Getting Started with In-Sight
34
Lesson: Inserting Cell References in Values
Function parameters can include references to other cells in the spreadsheet.
To insert a cell reference as a function parameter:
1. Highlight a cell in the property sheet where you want to insert a cell reference.2. Open the Enter menu.3. Select Relative or Absolute to Cell Selection mode.4. Select the cell you want to refer to, then accept your selection.
TIP: You can replace multiple function arguments with cell references by marking ablock of cells in the spreadsheet while in Cell Selection mode.
Lesson: Inserting Formulas in Values
Spreadsheet formulas that compute a single value can also be used as parameter values in aproperty sheet.
To use the formula editor to insert a formula:
1. Highlight a row in the property sheet where you want to insert a formula.2. Open the Enter menu, and select Formula to open the formula editor, as shown in
Figure 6-5.
NOTE: You can also activate the formula editor by opening the Edit menu, then selectingFormula. This method is useful for overriding property sheet check boxes, listboxes, and other embedded controls.

Chapter 6: Using Property Sheets
35
3. Use the formula editor to insert your formula directly into the parameter value, as shownin Figure 6-5.
Figure 6-5. Inserting Formulas in Values
4. Select OK to accept your changes, or select Cancel to leave the property sheetunchanged.


37
Part 2: Vision ProcessingIn the previous chapters you learned how to navigate the In-Sight interface. In the followingchapters, you will learn the basic techniques for configuring a vision application in thespreadsheet.

38
Chapter 7: Acquiring ImagesIn this chapter, you’ll learn how to acquire images, set image acquisition parameters, andtrigger processing.
How Does the Spreadsheet Update?Cell dependencies drive spreadsheet updates. For example, in the formula A1 = B1 + C1, cellA1 is said to be dependent on cells B1 and C1. In this case, A1 automatically updateswhenever B1 or C1 changes.
In-Sight dedicates cell A0 to the AcquireImage function. When AcquireImage receives atrigger from any source, it takes a digital image from the camera and assigns it to cell A0. Andbecause the results of a visual inspection are always dependent on the input image in A0, thespreadsheet updates, or runs, whenever the input image changes.
Lesson: Acquiring From Manual Triggers
Manually triggered image acquisition is useful during development and testing. In-Sight has twomanual modes for acquiring images: Live and Single acquire.
Live Mode
Live video mode acquires and displays images in rapid succession while the spreadsheetoverlay is temporarily disabled. This is useful when making camera adjustments.
To initiate Live video mode:
1. Open the System menu.2. Select Live to enter Live mode.3. Press any button to exit live mode and return to the spreadsheet.
NOTE: Any spreadsheet function that depends on the acquired image updatesautomatically when Live mode terminates.
Single Acquire Mode
To manually acquire one image at a time:
Control Pad Keyboard Mouse
Press A button once totrigger single acquisition. Press to trigger single
acquisition.
Not available.
NOTE: Disabling the Manual trigger checkbox in the AcquireImage Property sheet alsodisables the single acquisition trigger from the control pad.

Chapter 7: Acquiring Images
39
Lesson: Acquiring from External Triggers
For In-Sight to run a machine vision application automatically, the system must haveautomatically triggered image acquisitions. This trigger is typically supplied by an externalsignal.
To select an acquisition trigger source:
1. Highlight cell A0 in the spreadsheet.2. Open the AcquireImage property sheet.3. Highlight the value for the Trigger parameter, and open the drop-down list of trigger
sources (see Figure 7-1).
Figure 7-1. Triggering Options within the AcquireImage Property Sheet
Camera Acquires an image upon receiving a pulse to the trigger input located directlyon the camera.
Continuous Acquires images as fast as the camera will allow.External Acquires images on either a native-mode serial command or on the rising
edge applied to a discrete input bit configured as an Acquisition Trigger(In-Sight 3000 only).
Manual Acquires images when pressing the A button on the control pad (In-Sight
3000 only), or on the keyboard (In-Sight PC Host only).
NOTE: All external trigger sources are disabled when the system is Offline. To goOnline, return to the spreadsheet, open the System menu, and check the Onlineoption.

Getting Started with In-Sight
40
Acquisition Parameters
Other parameter values in the AcquireImage function also control important image acquisitionparameters. These parameters include:
Exposure Image exposure time can be set in milliseconds. A smaller number reducesthe blurring of an object in motion. A larger numbers allows more light on theimaging sensor.
Light Power Light power parameters can be set to control the current on up to fourindependent LED light sources (In-Sight 3000 only).
Gain/Offset Analog gain and offset parameters can be set to adjust the voltage of theanalog video signal before it is converted a digital signal.
To adjust any of these parameters go to cell A0 and open the AcquireImage property sheet.Changes will take effect when you accept your changes.

41
Chapter 8: Finding FeaturesIn this chapter, you will learn several techniques for locating individual object features in thefield of view.
Why Do I Need to Find Features?An object can be represented by the location of its coordinates in the image: row, column, andtheta (angle of rotation). But objects are also composed of a variety of individual features. Forexample, an object can include simple features such as holes, curved edges, and straightedges, or more complex features such as irregular shapes or grayscale patterns, as shown inFigure 8-1.
Curved Edge
Hole
Straight Edge
Irregular Shape
Figure 8-1. Different Types of Features
While In-Sight can find and report the position of an object in its entirety, you will generally wantto identify and find the object’s most important features first; finding individual features issometimes easier than finding the object itself.
This approach not only allows you to extract data about individual features, but also enablesyou to efficiently combine those features to locate the object or to evaluate its quality relative toa known specification.

Getting Started with In-Sight
42
This chapter discusses In-Sight’s primary tools for finding these types of features:
• Connected regions (Blobs)• Edges• Patterns
Subsequent chapters describe basic techniques for combining features to find objects, makemeasurements, and create decision points based on those measurements.
Finding Connected RegionsMany object features can be distinguished from their backgrounds according to how bright ordark they appear in the image. These bright or dark features, commonly known as “Blobs,” canbe described by a set of statistical characteristics.
In-Sight provides several functions for extracting and identifying Blob features in an image:
ExtractBlobs Extracts Blobs from an image.FindBlobs Compares extracted Blobs to a reference Blob.SortBlobs Sorts extracted Blobs by coordinates.
Lesson: Finding Connected Regions Using ExtractBlobs
To insert an ExtractBlobs function into the spreadsheet:
1. In column A, select a cell in an empty row that also has an empty row immediately above.2. Open the formula editor.

Chapter 8: Finding Features
43
3. Under Vision Processing, select ExtractBlobs from the Blob subcategory to open theExtractBlobs property sheet (see Figure 8-2).
Figure 8-2. ExtractBlobs Property Sheet

Getting Started with In-Sight
44
4. Expand the Region group. Highlight the X parameter value and switch to InteractiveGraphics mode (see Figure 8-3).
Figure 8-3. Defining a Region
5. Position the region so that it completely encloses the Blobs you want to locate, thenaccept your changes.
6. Complete the remainder of the property sheet.7. Select OK to accept your changes.

Chapter 8: Finding Features
45
The ExtractBlobs function inserts a Blobs structure in the spreadsheet (see Figure 8-4), alongwith the Vision Data Access function GetNFound:
GetNFound Returns the number of Blobs found.
Figure 8-4. ExtractBlobs Function Inserted in Spreadsheet
NOTE: You can configure ExtractBlobs to return more detailed data about each of theBlobs it extracts by entering a value for Number to Sort in the property sheet.
Lesson: Finding Connected Regions Using FindBlobs
To insert a FindBlobs function into the spreadsheet:
1. In the spreadsheet, verify that a Blobs structure containing the ExtractBlobs function ispresent.
2. In column A, select a cell in an empty row that also has one empty row immediatelyabove and below for each Blob you expect to report. For example, if you expect fiveBlobs, you would insert FindBlobs into a cell with one empty row immediately above andfive empty rows immediately below.
3. Open the formula editor.4. Under Vision Processing, select FindBlobs from the Blob subcategory to open the
FindBlobs property sheet.

Getting Started with In-Sight
46
5. Highlight the Blobs parameter value, and switch to Cell Selection mode. Select the cellcontaining the Blobs structure (see Figure 8-5).
Figure 8-5. FindBlobs Property Sheet
NOTE: The cell you select in the spreadsheet will provide the source Blob data for theFindBlobs function.
6. Complete the property sheet by specifying the number of Blobs to find.7. Select OK to accept your changes.

Chapter 8: Finding Features
47
The FindBlobs function inserts a Blobs structure in the spreadsheet (see Figure 8-6), plusseveral Vision Data Access functions that return data describing each Blob found. The mostsignificant of these functions are these:
GetRow Returns the row centroid (Row).GetCol Returns the column centroid (Col).GetAngle Returns the Blob angle (Angle).GetScore Returns the magnitude of the match (Score).
NOTE: Our objective in this lesson is simply to find Blob objects. We are not concernedabout Blob Color, Area, Elongation, Perimeter, or Spread at this point.
Figure 8-6. FindBlobs Function Inserted in Spreadsheet
Lesson: Finding Connected Regions Using SortBlobs
To insert a SortBlobs function into the spreadsheet:
1. In column A, select a cell in an empty row that also has one empty row immediatelyabove and below for each Blob you expect to report. For example, if you expect fiveBlobs, you would insert FindBlobs into a cell with one empty row immediately above andfive empty rows immediately below.
2. Open the formula editor.3. Under Vision Processing, select SortBlobs from the Blob subcategory to open the
SortBlobs property sheet.4. Highlight the Blobs parameter value in row 0, and switch to Cell Selection mode.

Getting Started with In-Sight
48
5. Select the Blobs structure cell containing the ExtractBlobs function (see Figure 8-7).
Figure 8-7. SortBlobs Property Sheet
6. Complete the remainder of the property sheet by specifying how many Blobs to report,and the sorting method.
7. Select OK accept your changes.

Chapter 8: Finding Features
49
8. The SortBlobs function inserts a Blobs structure in the spreadsheet (see Figure 8-8), plusseveral Vision Data Access functions that return data describing the sorted Blobs:
GetRow Returns the row centroid (Row).
GetCol Returns the column centroid (Col).
GetAngle Returns the Blob angle (Angle).
GetScore Returns the magnitude of the match (Score).
Figure 8-8. SortBlobs Function Inserted in Spreadsheet
Finding EdgesEdges are places in the image where the brightness changes abruptly from dark-to-light orlight-to-dark. Edges found by In-Sight are referred to as “line segments,” and can be straight orcurved, or can form a complete circle.
The In-Sight interface provides a variety of functions for locating straight and curved edges:
FindLine Finds a single straight line segment.
FindSegment Finds a pair of straight line segments.
FindMultiLine Finds multiple straight line segments.
FindCurve Finds an arc segment.
FindCircle Finds a complete circular edge.

Getting Started with In-Sight
50
Lesson: Finding Edges Using FindLine
To insert a FindLine function into the spreadsheet:
1. In column A, select a cell in an empty row that also has an empty row immediately above.2. Open the formula editor.3. Under Vision Processing, select FindLine from the Edge subcategory to open the
FindLine property sheet (see Figure 8-9).
Figure 8-9. FindLine Property Sheet
4. Expand the Region group. Highlight the X parameter value and switch to InteractiveGraphics mode.

Chapter 8: Finding Features
51
5. Position the region so that the Y axis is perpendicular to the edge to be located, thenaccept your changes. An example is shown in Figure 8-10.
Figure 8-10. Defining a FindLine Region
NOTE: The FindLine region box has two direction arrows, one initially pointing downand the other pointing right. The arrow pointing down is on the X axis, and thearrow pointing right is on the Y axis. Scanning for straight edges occurs in thedirection indicated by the arrow on the region’s Y axis.
6. Adjust the remaining parameters as necessary.
NOTE: When parameters in the FindLine property sheet refer to black-to-white or white-to-black polarity, they are referring to brightness transitions occurring in thescan direction.
7. Select OK to accept your changes.

Getting Started with In-Sight
52
The FindLine function inserts an Edges structure in the spreadsheet (see Figure 8-11), alongwith several Vision Data Access functions that return data about the edge segment found:
GetRow Returns the starting and ending row coordinates (Row0 and Row1).GetCol Returns the starting and ending column coordinates (Col0 and Col1).GetScore Returns the magnitude of the edge peak (Score).
NOTE: The reported score is positive when the FindLine region is oriented to scan fromdark to bright features, and negative when scanning from bright to dark features.
Figure 8-11. FindLine Function Inserted in Spreadsheet

Chapter 8: Finding Features
53
Lesson: Finding Edges Using FindSegment
The FindSegment function is similar to FindLine, but instead of finding and reporting a singlestraight edge, FindSegment locates a pair of edges and computes the distance between them.
You configure the FindSegment function in the same way as the FindLine function. Figure 8-12gives an example of the FindSegment property sheet.
Figure 8-12. FindSegment Property Sheet

Getting Started with In-Sight
54
The FindSegment function inserts an Edges structure in the spreadsheet (see Figure 8-13),along with two additional Vision Data Access functions:
PairDistance Returns the distance between the two edge segments (Distance).
GetScore Returns the average magnitude of the two edge peaks (Score).
Figure 8-13. FindSegment Function Inserted in Spreadsheet
Lesson: Finding Edges Using FindMultiLine
The FindMultiLine function is also similar to FindLine, but instead locates multiple straightedges. Edges found by FindMultiLine can be sorted into edge pairs, and their statisticscomputed. The lessons that follow discuss functions you can use to pair edges and computeedge pair statistics.

Chapter 8: Finding Features
55
You configure the FindMultiLine function in the same way as the FindLine function. Figure 8-14gives an example of the FindMultiLine property sheet.
Figure 8-14. FindMultiLine Property Sheet

Getting Started with In-Sight
56
The FindMultiLine function inserts an Edges structure in the spreadsheet (see Figure 8-15),along with the Vision Data Access function GetNFound:
GetNFound Returns the number of edges found.
Figure 8-15. FindMultiLine Function Inserted in Spreadsheet
NOTE: Unlike FindLine, FindMultiLine does not automatically place row and columncoordinate access functions into the Edges structure for all straight edges found.If you need to access the coordinates of a specific edge or pair of edges, you canmanually insert the GetRow and GetCol functions into the spreadsheet.
Lesson: Finding Edges Using FindCurve
To insert a FindCurve function into the spreadsheet:
1. In column A, select a cell in an empty row that also has an empty row immediately above.2. Open the formula editor.3. Under Vision Processing, select FindCurve from the Edge subcategory to open the
FindCurve property sheet.4. Expand the Region group. Highlight the X parameter value and switch to Interactive
Graphics mode.5. Cycle through the available Interactive Graphics modes, stopping on the Curved mode.

Chapter 8: Finding Features
57
6. Adjust the region so that its Y axis is concentric with the curved edge to be located (seeFigure 8-16), and accept your changes.
Figure 8-16. Defining a FindCurve Region
NOTE: The FindCurve region box has two direction arrows, one initially pointing downand the other pointing right. The arrow pointing down is on the X axis, and thearrow pointing right is on the Y axis. Scanning for curved edges occurs in thedirection indicated by the arrow on the region’s X axis.
7. Adjust the remaining parameter values as needed.
NOTE: When parameters in the FindCurve property sheet refer to black-to-white orwhite-to-black polarity, they are referring to brightness transitions occurring inthe scan direction.
8. Select OK to accept your changes.

Getting Started with In-Sight
58
The FindCurve function inserts an Edges structure in the spreadsheet (see Figure 8-17), alongwith several Vision Data Access functions that return data about the curved edge that wasfound:
GetRow Returns the center, starting, and ending row coordinates (CentRow,StartRow, and EndRow).
GetCol Returns the center, starting, and ending column coordinates (CentCol,StartCol, and EndCol).
GetRadius Returns the Radius.
GetScore Returns the magnitude of the edge peak (Score).
NOTE: The reported score is positive when the FindCurve region is oriented to scanfrom dark to bright features, and negative when scanning from bright to darkfeatures.
Figure 8-17. FindCurve Function Inserted in Spreadsheet

Chapter 8: Finding Features
59
Lesson: Finding Edges Using FindCircle
The FindCircle function is similar to FindCurve, but instead of finding and reporting an arcsegment, it reports an edge along a complete 360-degree circle (see Figure 8-18).
Figure 8-18. FindCircle Property Sheet

Getting Started with In-Sight
60
You configure a FindCircle function in the same way as other edge finding functions, exceptthat instead of defining a region with Curve and Angle, you define a Torus with an Inner Radiusand Outer Radius (see Figure 8-19).
Figure 8-19. Defining a FindCircle Region

Chapter 8: Finding Features
61
The FindCircle function inserts an Edges structure in the spreadsheet (see Figure 8-20), alongwith several Vision Data Access functions that return data about the circular edge that wasfound:
GetRow Returns the center row coordinate (CentRow).
GetCol Returns the center column coordinate (CentCol).
GetRadius Returns the radius (Radius).
GetScore Returns the magnitude of the edge peak (Score).
NOTE: Scanning for circular edges occurs from the center of the circle outward. Whenparameters in the FindCircle property sheet refer to black-to-white or white-to-black polarity, they are referring to brightness transitions occurring in the scandirection.
Figure 8-20. FindCurve Function Inserted in Spreadsheet

Getting Started with In-Sight
62
Finding PatternsIn-Sight can locate objects and other image features in the field of view by “training” a model ofa pattern, then searching subsequent images for matching patterns. The In-Sight FindPatternsfunction combines model training and pattern matching into a single function.
Lesson: Finding Patterns Using FindPatterns
To insert a FindPatterns function into the spreadsheet:
1. In column A, select a cell in an empty row that also has one empty row immediatelyabove and below for each pattern you expect to report. For example, if you expect to findtwo patterns, you would insert FindPatterns into a cell with one empty row immediatelyabove and two empty rows immediately below.
2. Open the formula editor.3. Under Vision Processing, select FindPatterns from the PatFind subcategory to open
the FindPatterns property sheet (see Figure 8-21).
Figure 8-21. FindPatterns Property Sheet
4. Expand the Model Region group. Highlight the X parameter value and switch toInteractive Graphics mode.

Chapter 8: Finding Features
63
5. Position the region so that it completely encloses the model you intend to train, thenaccept your changes. An example is shown in Figure 8-22.
Figure 8-22. Defining a Model Region
6. Expand the Find Region group. Highlight the X parameter value and switch to InteractiveGraphics mode.

Getting Started with In-Sight
64
7. Position the region so that it completely encloses the section of the image containing thepattern to be located, then accept your changes. An example is shown in Figure 8-23.
Figure 8-23. Defining a Find Region
8. Complete the remainder of the property sheet.
NOTE: You can press the Run button to observe crosses positioned on pattern matchesfound in the image.
9. Select OK to accept your changes.

Chapter 8: Finding Features
65
The FindPatterns function inserts a Patterns structure in the spreadsheet (see Figure 8-24),along with several Vision Data Access functions that return data about the pattern that wasfound:
GetRow Returns the row coordinate (Row).GetCol Returns the column coordinate (Col).GetScale Returns the pattern scale offset (Scale).GetAngle Returns the pattern angle offset (Angle).GetScore Returns the magnitude of the match (Score).
Figure 8-24. FindPatterns Function Inserted in Spreadsheet

66
Chapter 9: Using Features to Find ObjectsIn this chapter, you’ll learn how to use the results of the features found in Chapter 8 to reliablyfind objects.
Why Combine Features?When an object appears in the field of view, its position is never perfectly aligned in theexpected location. In other words, there is always some degree of positional uncertainty. Tocompensate, you will sometimes need to create a fixture using one or more located features.You can then use this fixture to help track the object in the field of view, and to reliably positiontools for subsequent inspections and measurements.
You can create a fixture from any set of coordinates consisting of a row, column, and theta.However, individual features are often impractical sources for fixture coordinates. Consider thefollowing:
By the very nature of the edge algorithm, edge-finding routines such as FindLine can only workover a limited range of rotation.
Not all Connected regions found by ExtractBlobs have well-defined orientations, and so mostBlobs cannot by themselves return the data needed for a fixture. For example, you could notcreate a fixture from a hole, because it has no reliable orientation, and therefore it cannotprovide the theta coordinate that is needed.
The FindPatterns function has the fewest theoretical limitations, but can be limited byperformance requirements. Searches for rotated or scaled patterns within large image regionsdemand significant computational resources, and require a geometrically stable grayscalepattern with a clearly recognizable orientation.
Combining features helps overcome the limitations that all feature-locating functions have intheir ability to report orientation. In-Sight’s flexible spreadsheet environment enables you to useany convenient combination of edge-, pattern-, and Blob-finding functions to establish thelocation and orientation of an object relative to a fixture.
For convenience in combining the results of feature locating functions, In-Sight also suppliesseveral standard geometry functions. The most important of these functions are the following:
• PointToLine• LineToLine• PointToPointAngle
The following lessons show how to use these functions, and the chapter’s final lesson showshow to create a fixture from combined feature results.

Chapter 9: Using Features to Find Objects
67
Lesson: Using PointToLine
As shown in Figure 9-1, the PointToLine function takes two inputs: a point, defined by (Row,Col), and a line segment, defined by (Row0,Col0,Row1,Col1) to create a structure called Dist(short for distance) that returns the coordinates, angle, and distance of a line segment that liesperpendicular to the input line segment, and passes through the input point.
Input Line Segment
Input Point
Figure 9-1. PointToLine Function
To insert a PointToLine function into the spreadsheet:
1. In column A, select a cell in an empty row that also has an empty row immediately above.2. Open the formula editor.

Getting Started with In-Sight
68
3. Under Geometry, select PointToLine from the Measure subcategory to open thePointToLine property sheet (see Figure 9-2).
Figure 9-2. PointToLine Property Sheet
4. Expand the Point parameter group.5. Highlight the X parameter value, and switch to Cell Selection mode.6. Select the spreadsheet cells that contain the row value and column value of the point you
want, and accept your selection.7. Expand the Line parameter group.8. Highlight the X 0 parameter value, and switch to Cell Selection mode.9. Select the spreadsheet cells that contains the row and column values for the starting and
ending points of the line segment, and accept your selection.10. Select OK to accept your changes.

Chapter 9: Using Features to Find Objects
69
The PointToLine function automatically inserts a Dist structure in the spreadsheet (see Figure9-3), along with several Vision Data Access functions that return data about the newly createdline segment between the input point and the input line segment:
GetRow Returns the starting and ending row coordinates (Row0 and Row1).
GetCol Returns the starting and ending column coordinates (Column0 andColumn1).
GetAngle Returns the Angle between the input point and line segment.
GetDistance Returns the Distance between the input point and the line segment.
Figure 9-3. PointToLine Function Inserted in Spreadsheet

Getting Started with In-Sight
70
Lesson: Using LineToLine
The LineToLine function takes as its inputs a pair of line segments defined by (Row0, Col0,Row1, Col1). From these, it creates a Dist structure (see Figure 9-4). The starting and endingpoints of the Dist line segment are the points of intersection with the two input lines.
Input LineSegment 1
Input LineSegment 0
Figure 9-4. LineToLine Function
To insert a LineToLine function into the spreadsheet:
1. In column A, select a cell in an empty row that also has an empty row immediately above.2. Open the formula editor.

Chapter 9: Using Features to Find Objects
71
3. Under Geometry, select LineToLine from the Measurements subcategory to open theLineToLine property sheet (see Figure 9-5).
Figure 9-5. LineToLine Property Sheet
4. Expand the Line 0 parameter group.5. Highlight the X 0 parameter value, and switch to Cell Selection mode.6. Highlight the spreadsheet cells that contain the row and column values for the starting
and ending points of the first line segment, and accept your selection.7. Expand the Line 1 parameter group.8. Highlight the X 1 parameter value, and switch to Cell Selection mode.9. Select the spreadsheet cells that contain the row and column values for the starting and
ending points of the first line segment, and accept your selection.10. Select OK to accept your changes.

Getting Started with In-Sight
72
The LineToLine function inserts a Dist structure in the spreadsheet (see Figure 9-6), along withseveral Vision Data Access functions that return data about newly created line segment:
GetRow Returns the starting and ending row coordinates (Row0 and Row1).
GetCol Returns the starting and ending column coordinates (Column0 andColumn1).
GetAngle Returns the Angle between the two input lines.
GetDistance Returns the Distance between the two lines.
NOTE: The GetDistance function returns a 0 if the two input lines intersect. If the linesare parallel, GetDistance returns a positive value and GetAngle returns a 0.
Figure 9-6. LineToLine Function Inserted in Spreadsheet

Chapter 9: Using Features to Find Objects
73
Lesson: Using PointToPointAngle
One of the more common methods of combining results is to find two features of an object, thenuse the angle between them to define the object’s orientation.
The PointToPointAngle function takes as its inputs two points defined by (Row0,Col0,Row1,Col1), and from these creates a Dist structure that returns the angle of a line segmentthat runs between the two input points (see Figure 9-7).
Input Point 0 Input Point 1
Figure 9-7. PointToPointAngle Function
To insert a PointToPointAngle function into the spreadsheet:
1. In column A, select a cell in an empty row that also has an empty row immediately above.2. Open the formula editor.

Getting Started with In-Sight
74
3. Under Geometry, select PointToPointAngle from the Measurements subcategory toopen the PointToPointAngle property sheet (see Figure 9-8).
Figure 9-8. PointToPointAngle Property Sheet
4. Expand the Point 0 parameter group.5. Highlight the X parameter value, and switch to Cell Selection mode.6. Highlight the spreadsheet cells that contain the row value and an adjacent column value,
and accept your selection.7. Expand the Point 1 parameter group.8. Highlight the X parameter value, and switch to Cell Selection mode.9. Highlight the spreadsheet cells that contain the row value and an adjacent column value,
and accept your selection.10. Select OK in the formula editor, and then select OK again to accept your changes.

Chapter 9: Using Features to Find Objects
75
The PointToPointAngle function inserts a single function into the spreadsheet (see Figure 9-9).
PointToPointAngle Returns the angle between the two input points.
NOTE: The GetAngle function simply returns the angle value to the spreadsheet. Youmay want to add a label for this value in an adjacent cell, as shown in Figure 9-9.
Figure 9-9. PointToPointAngle Function Inserted in Spreadsheet
Lesson: Creating a Fixture
You can create a fixture (defined by row, column, and theta values) from the coordinatelocations of one or more located features. Once you have defined a fixture, subsequentfunctions can refer to it to reliably position their regions within the field of view.
Creating a Fixture
The most common type of fixture uses the average row and column coordinates from twofeatures, and the angle of rotation between them.
To create a fixture:
1. Identify the coordinates in the spreadsheet for the two points you will use for the fixture,and (if necessary) determine the angle of rotation between those points using theGetAngle function.
2. Highlight an empty cell and open the formula editor. Enter a formula that calculates theaverage (mean) row value between the two points.
3. Select OK in the formula editor to accept your changes and return to the spreadsheet.

Getting Started with In-Sight
76
4. Highlight the empty cell adjacent to the row formula. Repeat step 2 to enter an averagecolumn value formula between the two points.
5. Select OK in the formula editor to accept your changes and return to the spreadsheet.6. Highlight the cell adjacent to the column value formula and select Relative from the
Enter menu to enter Cell Selection mode.7. Select the cell that contains the PointToPointAngle formula between the two points.
NOTE: It is generally a good idea to identify fixture coordinates in the spreadsheet byadding a text label to an adjacent empty cell. This makes the fixture coordinateseasier to identify when referencing them from within other functions (see Figure9-10).
Figure 9-10. Fixture in the Spreadsheet

Chapter 9: Using Features to Find Objects
77
Plotting the Fixture
Once you have created a fixture, it is useful to plot its location on the image to make it easy tofind.
To plot a fixture:
1. Highlight an empty cell and open the formula editor.2. Under Graphics, highlight PlotCross from the Image subcategory to open the PlotCross
property sheet (see Figure 9-11).
Figure 9-11. PlotCross Property Sheet
3. In the PlotCross property sheet, expand the Cross parameter group.4. Highlight the Row value and enter the Cell Selection mode.5. Highlight and select the cells containing the row, column, and angle coordinates of the
fixture.6. Configure the rest of the PlotCross property sheet. You can change the size and color of
the cross, and assign a name.7. Select OK to accept your changes and return to the spreadsheet.

Getting Started with In-Sight
78
A cross then appears on top of the image at the fixture coordinate location (see Figure 9-12).Any function that refers to the fixture will position itself in the image relative to this location.
Figure 9-12. PlotCross Function Inserted in Spreadsheet
The following chapter includes an example of how to use a fixture by referencing it from withinanother function.

79
Chapter 10: Making MeasurementsThis chapter will show you how to use In-Sight’s image measurement techniques.
What is a Measurement?Machine vision inspections rely on measurements to yield decisions, where a measurementcan be any useful data derived from the features located on an object.
In the previous lesson, we laid the groundwork for making measurements by describing varioustechniques for locating objects in the field of view. Once you register an object in the image byits coordinates (row, column, and theta), then measurements can be made in specific regionsthat are fixtured relative to the native coordinate system of the object.
NOTE: If the positional uncertainty of the features to measure is sufficiently small or ifthe intended inspection is very general, it may not be necessary to registermeasurements to an object coordinate system using a fixture.
General measurement tasks might return a count of the number of objects in an image, thecoordinates of a single object, or some grayscale statistic across the entire image. In each ofthese examples, creating a fixture is unnecessary.
The In-Sight measurement capabilities are grouped into three categories:
• Counting Pixels• Counting Features• Measuring Distance
The following lessons discuss each category.
Lesson: Counting Pixels
The most common machine vision measurement is a count of the pixels within a region that fallabove or below a specified grayscale threshold level. “Dark” pixels are below the threshold, and“bright” pixels are above the threshold. This simple counting technique is a member of thefamily of image measurements that derive from the grayscale Histogram.
NOTE: Grayscale images contain up to 256 gray levels, where each pixel has agrayscale value between 0 and 255. The Histogram counts the number of pixelsin a region for each gray level. To count the pixels in a region below a specifiedthreshold level, simply sum the Histogram array from zero up to the thresholdlevel.

Getting Started with In-Sight
80
The In-Sight interface supplies a number of functions that allow you to count pixels and makeother useful grayscale measurements. The most important of these functions are:
ExtractHistogram Extract a histogram array from an image region.HistThresh Compute an adaptive threshold level.HistCount Sum a specified section of the histogram array.
Using ExtractHistogram
To insert the ExtractHistogram function into the spreadsheet:
1. Highlight an empty cell in column A.
NOTE: The row you select plus one row above should be empty.
2. Open the formula editor.3. Under Vision Processing, select ExtractHistogram from the Histogram subcategory to
open the ExtractHistogram property sheet.4. If you have a fixture that you want to use to position this histogram measurement,
highlight the fixture parameter group and expand it. Highlight the row parameter valueswitch to Cell Selection mode. Select the cells containing the coordinates (row, column,and theta) that define the fixture. Accept your selection and return to theExtractHistogram property sheet (see Figure 10-1).
Figure 10-1. ExtractHistogram Property Sheet

Chapter 10: Making Measurements
81
5. Expand the Region group. Highlight the X parameter value and switch to InteractiveGraphics mode. Position the region over the section of the image from which to extractthe histogram (see Figure 10-2). Accept your changes to return to the ExtractHistogramproperty sheet.
Figure 10-2. Defining an ExtractHistogram Region
6. Select OK in the property sheet to accept your changes.

Getting Started with In-Sight
82
The ExtractHistogram function is now positioned relative to the fixture point. As the object’slocation and orientation vary, the fixture tracks the object, and the ExtractHistogram functionoperates within the intended region, as shown in Figure 10-3.
Figure 10-3. ExtractHistogram Function Inserted in Spreadsheet
The ExtractHistogram function inserts a Hist structure in the spreadsheet. It also inserts severalrelated functions that return data from the histogram. These include:
HistThresh The binary threshold (Thresh). “Bright” values are above the grayscalethreshold; “dark” values are below the grayscale threshold.
HistContrast The average grayscale of the bright pixels minus the average grayscale ofthe dark pixels (Contrast).
HistCount The count of pixels above and below the threshold (BrightCount andDarkCount, respectively).
HistMean The Average grayscale value of all pixels in the histogram.
NOTE: It is useful to examine the functions created by ExtractHist to help you betterunderstand the use of histogram related functions.

Chapter 10: Making Measurements
83
Using HistThresh
As previously described, the ExtractHistogram function automatically inserts the HistThreshfunction into the spreadsheet. HistThresh sets a reference to the cell containing the Histstructure and the range to compute the threshold. The maximum range is 0 to 255.
To change the threshold range:
1. Highlight an empty cell and open the formula editor.2. Under Vision Processing, select HistThresh from the Histogram subcategory to open
the HistThresh property sheet.3. Use the formula editor to insert a cell reference to an existing Hist structure and set the
last two arguments to 0 and 255, respectively.4. Select OK.
The spreadsheet will now contain a HistThresh function that returns a threshold level.
NOTE: The threshold level returned by HistThresh is computed by finding the thresholdlevel that produces the best match between the original grayscale image and ahypothetical binary image. This technique works quite well over a range of imageconditions but is not suited for every application.
Using HistCount
This function takes as its input a reference to a cell containing an ExtractHistogram functionand a range over which to count.
To insert HistCount into the spreadsheet:
1. Highlight an empty cell and open the formula editor.2. Under Vision Processing, select HistCount from the Histogram subcategory to open
the HistThresh property sheet.3. Use the formula editor to insert a cell reference to an existing histogram structure and set
the last two arguments to specify the range.
NOTE: The range to count is commonly set from zero to the threshold level or from thethreshold level to 255.
4. Select OK.
The spreadsheet will now contain a HistCount function returning a count of the number of pixelsin the histogram array whose grayscale values fall between the specified level.

Getting Started with In-Sight
84
Lesson: Counting Features
Another common machine vision measurement is a count of features found in a specific regionof the image. As described in Chapter 8: Finding Features, In-Sight finds features using theBlob, Edge, and Pattern functions. An additional function, GetNFound, returns the featurecount.
NOTE: For counting purposes, these functions are typically registered to the objectbeing inspected using a fixture. This decreases the processing time necessary tofind the features, and prevents potential confusion with unwanted features.
TIP: When counting Edges and Patterns, be aware that the N2Find parameter in theproperty sheets of the FindMultiLine and FindPatterns functions determines themaximum number of features that can be reported.
To count Blob, Edge, or Pattern features:
1. Highlight an empty cell and open the formula editor.2. Highlight and expand the Edges, Blobs, or Patterns function subcategory under Vision
Data Access.3. Select the GetNFound function in the selected function subcategory. The formula editor
will open again. Highlight the Absolute Cell Reference button and Cell Selection mode.4. Select the cell that refers to the source Edges, Blobs, or Patterns structure.5. Select OK to return to the spreadsheet.
The GetNFound function will insert itself into the spreadsheet and return the number found forthe selected feature.
Lesson: Measuring Distances
Relationships between image features can be an important measurement. Functions under theGeometry heading and Measure subcategory are useful for computing feature-to-featureangles and distances, including:
PointToPoint The distance and angle established by two given points.PointToLine The distance and angle of a line segment that lies perpendicular
to a given line segment and intersects a given point.LineToLine The point of intersection and the angle between two line
segments.PointToPointAngle The angle established by two given points.PointToPointDistance The distance between two points.
Refer to Combining Results from the previous lesson for more information.
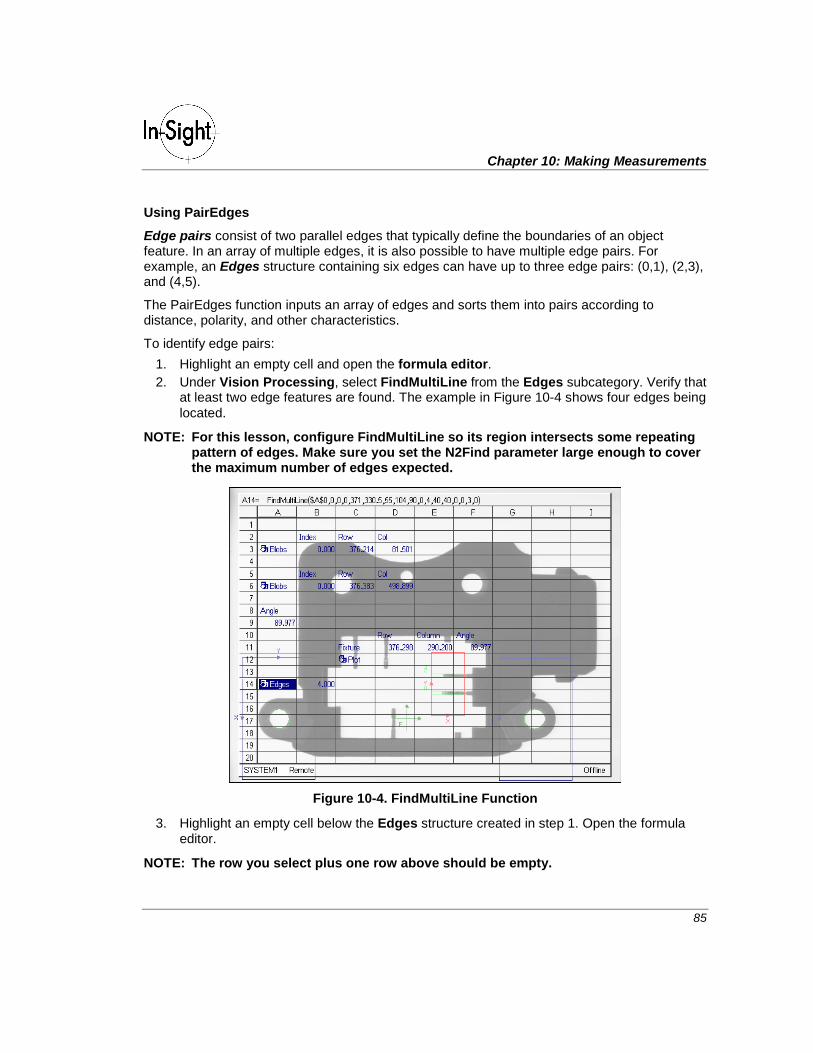
Chapter 10: Making Measurements
85
Using PairEdges
Edge pairs consist of two parallel edges that typically define the boundaries of an objectfeature. In an array of multiple edges, it is also possible to have multiple edge pairs. Forexample, an Edges structure containing six edges can have up to three edge pairs: (0,1), (2,3),and (4,5).
The PairEdges function inputs an array of edges and sorts them into pairs according todistance, polarity, and other characteristics.
To identify edge pairs:
1. Highlight an empty cell and open the formula editor.2. Under Vision Processing, select FindMultiLine from the Edges subcategory. Verify that
at least two edge features are found. The example in Figure 10-4 shows four edges beinglocated.
NOTE: For this lesson, configure FindMultiLine so its region intersects some repeatingpattern of edges. Make sure you set the N2Find parameter large enough to coverthe maximum number of edges expected.
Figure 10-4. FindMultiLine Function
3. Highlight an empty cell below the Edges structure created in step 1. Open the formulaeditor.
NOTE: The row you select plus one row above should be empty.

Getting Started with In-Sight
86
4. Under Vision Processing, select PairEdges from the Edges subcategory and open thePairEdges property sheet (see Figure 10-5).
Figure 10-5. PairEdges Property Sheet
5. Highlight the Edges parameter value and enter Cell Selection mode in the spreadsheet.Select the cell containing the FindMultiLine function and return to the PairEdgesproperty sheet.
6. Specify one or more of the following parameters in the PairEdges property sheet:• The Number of Pairs to find
• The polarity of the First and Second edges of each pair
• The Min and Max distance between the two edges of each pair
• The minimum and maximum number of Intermediate Edges that come between the twoedges of each pair
7. Select OK to return to the spreadsheet.

Chapter 10: Making Measurements
87
The spreadsheet will now contain the PairEdges function (see Figure 10-6), plus severalfunctions that report statistics about the edge pairs found:
NumPairs The number of edge pairs found (GetNFound).
MinDist The shortest distance between the two edges in a pair (PairMinDistance).
MaxDist The farthest distance between the two edges in a pair (PairMaxDistance).
MeanDist The average distance between the two edges in a pair (PairMeanDist).
SDevDist The standard deviation of the distance between two edges in a pair(PairSDevDistance).
Figure 10-6. PairEdges Function Inserted in Spreadsheet

88
Chapter 11: Creating Decision PointsIn this chapter, you will learn several basic techniques for converting measurements intodecisions.
What is a Decision Point?The ultimate goal of any visual inspection is to make some type of decision about the objectthat is inspected: Are the object’s dimensions within tolerance? Does the object appear in theexpected location? Is the object missing a feature? These are the types of inspection decisionsthat In-Sight can make.
But first, it is necessary to convert measurements, such as those discussed in the previouschapter, into decision points. Decision points segment measurements into specific categories.A decision point can be any unambiguous inspection result, such as:
• Yes/No• Good/Bad• Pass/Fail• 1/0• Present/Absent
A decision point might also take the form of a number containing an encoded inspection resultfor the purposes of classification, such as:
• Defect type• Part ID• Quality level
Converting Measurements into Decision PointsCreating measurement-based decisions can be a simple or complex task. At the simplest level,making a decision from a measurement can be based on a simple threshold score thatdetermines the pass or fail status of an object inspection. Alternatively, a more complexdecision point can be based on a logical expression involving multiple measurements designedto select one of several possible quality levels.
The In-Sight interface provides enormous flexibility to create virtually any type of decision pointusing standard spreadsheet operators and expressions. The following includes a description ofsome of those operators.

Chapter 11: Creating Decision Points
89
Comparison
Under the Mathematics heading, the Operators category contains a complete selection ofcomparison operators, including:
> Greater than< Less than= Equal to>= Greater than or equal to<= Less than or equal to
Logical
Under the Mathematics heading, the Logic category contains a selection of logical operators,including:
And Logically ANDs multiple input argumentsOr Logically ORs multiple input argumentsNot Logical inverse of the input argument
Conditionals
Under the Mathematics heading, the Lookup category contains a selection of logic and errorhandling functions that include:
If Returns one of two input argumentsChoose Returns one on N input argumentsCountErr Counts #ERRs over a range of cells
Decision Point Formula ExamplesThe following examples assume that cell A1 contains a measurement. It could be a pixel count,a distance between two points, a blob feature, or some other type of measurement. Also, theexamples assume that cells B1 and C1 contain the decision limits and that cell D1 will store thedecision.
D1 = A1>B1
In this example, we simply compare the contents of the cell A1 to the contents of the cell B1. Ifthe value of A1 is greater than the value of B1 the function returns the value 1; otherwise itreturns 0.
D1 = And(A1>B1,A1<C1)
In this example we use the And function to compare A1 to a range of values that is bounded bythe contents of the cells B1 and C1. If the value of A1 is greater than the value of B1, and lessthan the value of C1, the function returns the value 1; otherwise, the function returns 0.
D1 = If(And(A1>B1,A1<C1),”PASS”,”FAIL”)

Getting Started with In-Sight
90
In this example, the text strings PASS and FAIL are substituted for the values 0 and 1 of theprevious example. If the value of A1 is greater than the value of B1 and less than the value ofC1, the function returns the string PASS; otherwise, the function returns FAIL.
D1 = If(A1<B1,”FAIL”,If(A1<C1,”WARNING”,”PASS”))
This example demonstrates how to nest the If function to determine more than two categories.If A1 is less than B1, it returns FAIL; however, if A1 is less than C1, it returns WARNING, and ifA1 is greater than or equal to C1 it returns PASS.
D1 = Choose((A1>=B1)+(A1>=C1),”FAIL”,”WARNING”,”PASS”))
This example uses the Choose function to achieve the same result as in the previous example.If A1 is less than both B1 and C1, the first argument evaluates to 0 and FAIL is the output. IfA1 is greater than B1 but less than C1, the first argument evaluates to 1 and WARNING is theoutput. If A1 is greater than or equal to both B1 and C1, the first argument evaluates to 2, andPASS is the output.
D1 = IF(CountErr(A1),0,A1>B1)
This example compares the contents of the cell A1 to the contents of cell B1. If the value of A1is greater than the value of B1, and A1 is not #ERR, then the function returns 1; otherwise itreturns 0.
NOTE: This is an important example because it shows how to filter errors from theoutput. Normally, a function that inputs #ERR also outputs #ERR. The CountErrfunction blocks the propagation of #ERR throughout the spreadsheet byreturning a count of all #ERRs within its input range.

91
Chapter 12: Communicating ResultsThis chapter shows you how to configure In-Sight’s discrete and serial outputs to communicateinspection results to external devices.
NOTE: The number of accessible outputs varies between the In-Sight 1000 and In-Sight3000:
System Output Channels
In-Sight 1000 2 built-in on the camera
In-Sight 30002 built-in on the processor
8 additional using optional I/O Expansion Module
Using Discrete OutputOne of the easiest ways to communicate inspection results is to write discrete outputs. You canuse the spreadsheet to assign the results of decisions, such as those discussed in the previouslesson, to individual points of discrete output.

Getting Started with In-Sight
92
Lesson: Configuring Discrete Output Options
The In-Sight interface provides a dialog with several controls to configure discrete output (seeFigure 12-1).
Figure 12-1. Discrete Output Dialog
To configure discrete output options:
1. From anywhere in the spreadsheet, open the System menu.2. Select the Settings menu.3. Select Discrete Output to open the Discrete Output dialog.
NOTE: The default Type for all discrete output bits is Programmed. You can choose adifferent output configuration for a bit from the Type list box; however, if youconfigure a discrete output bit to another Type, that bit can no longer becontrolled from the spreadsheet using the WriteDiscrete function.

Chapter 12: Communicating Results
93
4. Select Details to open the Output Details dialog. This dialog contains three controls (seeFigure 12-2):
Pulse Enable for pulsed output (Delay Count must be 0); disable for steadystate.
Length (ms) Duration of pulse.Delay Count The number of acquisition or tracking pulses to delay the output.
Figure 12-2. Output Details Dialog
Discrete Output port settings are system-wide and are automatically saved when you press OK.
Lesson: Writing Discrete Outputs
Use the WriteDiscrete function to connect individual cell values to the output lines.
To write discrete output data from the spreadsheet:
1. Highlight an empty cell and open the formula editor.

Getting Started with In-Sight
94
2. Under Input/Output, select WriteDiscrete from the Discrete subcategory to open theWriteDiscrete property sheet (see Figure 12-3).
Figure 12-3. WriteDiscrete Property Sheet
3. Select the Start bit parameter and enter the value of the discrete output bit to use.4. Select the Number of bits parameter enter the number of bits that will receive data.5. Select the parameter value and enter Cell Selection mode. Highlight the cell containing a
decision result integer to write to the selected bit(s).6. Select OK to return to the spreadsheet.
NOTE: Discrete output bits will not change their state unless Online is checked in theSystem menu.

Chapter 12: Communicating Results
95
Using Serial Output
Lesson: Configuring Serial Output Options
The In-Sight interface provides a dialog with several additional controls to configure the serialoutput.
To configure serial output options:
1. From anywhere in the spreadsheet, open the System menu.2. Select Settings to open the Settings menu.3. Select Serial Port 1 to open the Serial Port 1 dialog (see Figure 12-4).
Figure 12-4. Serial Port 1 Dialog
4. Select the Mode list box and select Text. Configure the protocol in the Serial Port 1dialog as required.
5. Select OK to accept your changes.
NOTE: The In-Sight serial interface supports four modes of communication between theIn-Sight processor and a remote device:

Getting Started with In-Sight
96
Text Standard ASCII protocol for sending/receiving text strings. To define the inputand output terminator characters, press the Details button to open the TextMode Details dialog.
Native Custom ASCII protocol for controlling In-Sight from any remote serial device.To define the input and output terminator characters, press the Details buttonto open the Native Mode Details dialog.
DeviceNet Protocol for communicating with Allen-Bradley PLC (requires an optional,DeviceNet Interface Module from Cognex). To define the input and output datapackets sizes, press the Details button to open the DeviceNet Details dialog.
Motoman Protocol for communicating with Motoman MRC, MRC-II, and XRC robotcontrollers operating in DCI mode.
Unused Closes the serial port so that no commands or data can be received/sent.
Lesson: Writing Serial Outputs
Another way to communicate inspection results is to write them directly to a serial port. You canuse Stringf, under the Text function category, to convert a value, or a set of values, into textmessages that are written to the serial port.
Note Refer to the In-Sight Guide & Reference contained on your In-Sight CD-ROM formore detailed information on the commands and functions available for serialmode.

Chapter 12: Communicating Results
97
The WriteSerial function transmits text strings.
To write serial output data from the spreadsheet:
1. Highlight an empty cell and open the formula editor.2. Under Input/Output, select WriteSerial from the Serial subcategory to open the
WriteSerial property sheet (see Figure 12-5).
Figure 12-5. WriteSerial Property Sheet
3. Use the property sheet to set the port number and to set a reference to the spreadsheetcell that contains the text string to be transmitted.
4. Select OK to accept your changes.
NOTE: Serial transmission initiated by WriteSerial is suppressed when the system isoffline.

98
Chapter 13: Making a Run-time InterfaceThis chapter will show you how to construct a run-time user interface.
What is a Custom View?The In-Sight spreadsheet is an excellent environment for configuring applications. You maywish, however, to present a more limited, application-specific interface to the operator on theproduction floor. Within In-Sight, this tailor-made interface is called the Custom View.
The Custom View is essentially a dialog with user-definable features. While in the Custom Viewmode, access is restricted to the data displays and controls that you include in the view.Custom views can be password-protected to prevent unauthorized changes. Figure 13-1 showsan example Custom View for a simple application.
Figure 13-1. Custom View

Chapter 13: Making a Run-time Interface
99
The steps to creating a Custom View include:
• Selecting the Graphics functions to include in the view and inserting them into acontiguous range of spreadsheet cells.
• Selecting the range of cells containing the Graphics functions and configuring the CustomView options.
• Setting the access level to use for this Custom View and defining passwords.
The following lessons define these steps in more detail.
Lesson: Understanding Graphics Functions
The first step to creating a Custom View is to select the data displays and graphic controls toinclude in the view. You include Graphics functions in the Custom View to simplify the run-timeuser interface and to limit the display of data to only the most important information.
Graphics functions for Custom View fall into two categories:
Controls Interactive graphics for adjusting job parameters and settingsDisplays Graphics for displaying key status information
NOTE: The Graphics function category includes an additional function subcategorycalled Image. These functions overlay points, lines, crosses, and text on top ofthe image, but they are independent of the Custom View mode.
Graphical Controls
Graphical controls allow operators to adjust application parameters without enteringspreadsheet View. Control functions include:
Button A labeled push button control.CheckBox A labeled check box control.Dialog A labeled dialog box control.EditFloat An edit box control for entering floating-point values.EditInt An edit box control for entering integer values.EditRegion An interactive region control button.EditString An edit box control for entering text strings.Link A labeled link control.ListBox A drop-down list control.MessageBox A "pop-up" message box containing a user-defined text string.Select Executes the Graphics Controls function contained in a spreadsheet cell,
chosen from a variable list of indexed cell references.Wizard A Wizard control.

Getting Started with In-Sight
100
To insert a control into the spreadsheet:
1. Highlight an empty cell and open the formula editor.2. Under Graphics, select the desired function from the Controls subcategory to open the
property sheet for the selected control.3. Configure the control as necessary, and select OK to insert the control into the
spreadsheet (see Figure 13-2).
Figure 13-2. Graphics Control Functions
NOTE: In spreadsheet mode, you can “link” controls to generate events or to change thebehavior or properties of other functions. For example, you can create a buttonthat will reset the values accumulated in other cells by having those cellsreference the button. When the button is pressed it returns a ‘1’; any cells withformulas that depend on the state of the button will be affected.
For a comprehensive review of controls, refer to the In-Sight Guide and Reference located onthe CD-ROM.
Graphical Displays
You will want to show only the most useful information in Custom View. For instance, if yourapplication finds a blob and you would like the custom view to display one of the blob’s row andcolumn coordinates, simply include the cells containing the GetRow and GetCol function in thecells of the Custom View region.
In addition to the standard formulas, you can use special display functions to format data forvisual verification. These Graphics functions are contained in the Displays subcategory andinclude the following functions (see Figure 13-3):

Chapter 13: Making a Run-time Interface
101
Chart A strip chart that can be inserted into the spreadsheet to graphically display thevalue of a cell over multiple events.
ColorLabel A text cell with programmable foreground and background colors.
MultiStatus Displays up to 16 status lights within a single cell, indicating bit values.
Status A status light that displays in red, yellow, or green depending on the currentvalue.
Figure 13-3. Graphics Display Functions

Getting Started with In-Sight
102
Lesson: Defining a Custom View
Making a Custom View dialog is a matter of creating an interface in an unused region of thespreadsheet and then defining that region to be the Custom View.
To configure the Custom View:
1. Choose an empty area of the spreadsheet to contain the displays and controls that willappear in the Custom View. Insert the desired Displays and Controls functions into thisarea of the spreadsheet, as described in the previous lesson (see Figure 13-4).
Figure 13-4. Configuring a Custom View in the Spreadsheet
2. Open the Edit menu.

Chapter 13: Making a Run-time Interface
103
3. Select Custom View to open the Custom View dialog (see Figure 13-5).
Figure 13-5. Custom View Dialog
4. Configure the Custom View dialog using one or more of the following selections:
Position & Size Enters Interactive Graphics mode for repositioning and resizing theCustom View overlay.
NOTE: The size of the Custom View overlay is limited to the total size of the cell rangechosen using Select Cells.
Select Cells Enters Cell Selection mode to select the cells to include in the CustomView.
Center Centers the Custom View overlay. This overrides the location set byPosition & Size.
Size To Fit Sizes the Custom View overlay for the cell range chosen using SelectCells.
Image Enables/disables the Image display, the image Graphics, and thespreadsheet Overlay.
Graphics Enables/disables the display overlay graphics (generated by functions inthe spreadsheet) on top of the image.
Overlay Enables/disables the display of the Custom View overlay
if When this checkbox is enabled, the enabled display elements will refreshonly when the cell referenced by Absolute contains a non-zero value.When the value in the cell referenced by Absolute is zero, then the Image,

Getting Started with In-Sight
104
Graphics, and Custom View Overlay in the display will not be refreshed,even if their respective checkboxes are turned ON.
Absolute Creates the cell reference that controls the conditional screen refreshenabled by if. The cell reference specified by Absolute is enabled onlywhen if is checked.
5. Select OK to accept your changes.
To test your Custom View configuration, check Custom View mode in the Custom View dialogand select OK. An example of Custom View is shown in Figure 13-6.
Figure 13-6. Custom View of the Spreadsheet

105
Chapter 14: Configuring for StartupThis chapter shows you how to configure your system to start a job automatically on power-up.
Lesson: Selecting the Startup JobOnce you’ve configured the job for your application, you may want to install it as the default jobto load on power-up.
To load a job automatically on power-up:
1. Open the System menu.
2. Open the Settings menu, and select Startup to open the Startup dialog (see Figure14-1).
Figure 14-1. Startup Dialog
3. Select the job that you want to load automatically on power-up.4. You can also configure the Online/Offline mode from the Startup dialog.
Note When Online is selected, the selected job starts in the Online mode instead of thedefault Offline mode. When the system is Offline, the spreadsheet program willnot respond to any external events, including discrete and serial inputs.
5. Select OK to accept your changes.
In-Sight automatically saves all changes to the startup configuration. The next time you powerup the In-Sight processor or open the In-Sight PC Host, the selected job will automatically beloaded.

106
Appendix A: The ProfilerThe Profiler dialog displays execution times and dependencies for all of the cells in the currentjob spreadsheet that contain formulas and data (and excluding cells containing only text). Thisinformation is most useful while trying to improve spreadsheet performance, because thefunctions that take the most time to execute can be easily identified for possible optimization.The Profiler dialog is also helpful when trying to identify the formulas and functions that arecausing errors in a spreadsheet.
NOTE: Execution times for identical jobs on an In-Sight 1000, In-Sight 3000, and In-SightPC Host will vary according to the processing capabilities of the respectivesystems.
NOTE: The Profiler dialog is not accessible in Online mode, or when the current user islogged in with a Protected or Locked level of Access.
To open the Profiler:
1. Open the System menu.2. Select Profiler to open the Profiler dialog (see Figure A-1).
Figure A-1. In-Sight Profiler
Note Refer to the In-Sight Guide & Reference contained on your In-Sight CD-ROM formore detailed information on the In-Sight Profiler.

107
Appendix B: Remote Job SelectionIn some applications, it is necessary to select a new job by remote control. In-Sight makes thispossible by allowing you to configure discrete input and output lines for the purpose of jobselection (In-Sight 3000 sensors only).
Note You must have physical I/O connections to the In-Sight 3000 processor asdescribed in Installing the In-Sight 3000 before following the proceduresdescribed below.
Lesson: Initiating a Job LoadTo configure the discrete input port to support job selection:
1. Open the System menu.2. Select Settings to open the Settings menu.3. Select Discrete Input to open the Discrete Input dialog (see Figure B-1).
Figure B-1. Discrete Input Dialog
4. Identify an input Line to configure. Lines 0 through 7 designate the inputs on the I/OExpansion Module (Cognex P/N CIO-2350-00), and lines 8 and 9 designate the built-ininputs on the In-Sight 3000 processor.
5. Select Job Load Switch from the Type list box.6. Identify one or more unused bits to serve as the job identification number. Select Job ID
Number from the Type list box.

Getting Started with In-Sight
108
Note In order to use the Job ID Number feature, the job to be loaded must be savedwith a numerical prefix (0-511). The Job ID Number is constructed by combiningthe job ID number bits in order from least significant to most significant. Forexample: two job ID number bits will allow you to select a job with a numericprefix of 0 to 3; three job ID number bits allow job selection with a numeric prefixof 0 to 7; and four job ID number bits allow job selection with a numeric prefix of0 to 15.
7. Select OK to accept your selection.
The system is now configured to load the job given by the job ID number bits whenever the bitassociated with the job load switch is pulsed.
Lesson: Responding to a Job LoadTo configure the discrete output port to respond to a job load:
1. Open the System menu.2. Select Settings to open the Settings menu.3. Select Discrete Output to open the Discrete Output dialog (see Figure C-2).
Figure C-2. Discrete Output Dialog
4. Identify an unused output Line to configure.5. Select Job Load OK for Type.

Appendix B: Remote Job Selection
109
6. Select Details for the selected output line and open the Discrete Output Details dialog tochange the length of the pulse, if needed (see Figure C-3).
Figure C-3. Discrete Output Details Dialog
7. Select OK to accept your selection and close the Details dialog.
8. Select OK again to accept your selection.
The system is now configured to signal that the job has been successfully loaded.

110
Appendix C: Sample ImagesThe images printed below are included to assist you in following along with the lessons in thisbook.
To use these images, setup the camera as described in Chapter 1: Acquiring a Working Image.If you are using a 16-mm lens, the lens should be positioned approximately 10- to 11-inches(250- to 275-millimeters) above the page.
Note These images are included on the CD-ROM that ships with each In-Sight system(Image1A.bmp, Image1B.bmp, Image1C.bmp, Image2A.bmp, and Image2B.bmp).
Figure C-1. Image1A.bmp

Appendix C: Sample Images
111
Figure C-2. Image1B.bmp
Figure C-3. Image1C.bmp

Getting Started with In-Sight
112
Figure C-4. Image2A.bmp
Figure C-5. Image2B.bmp

Index
113
Index
A
Absolute Cell Reference............................................................................................................. 17Acquiring an Image....................................................................................................................... 2Acquiring Images........................................................................................................................ 38Acquisition Parameters............................................................................................................... 40
B
Blocks ......................................................................................................................................... 25
C
CE Compliance Statement ........................................................................................................... ivCell References .......................................................................................................................... 17
Absolute .................................................................................................................................. 17Relative ................................................................................................................................... 17
Cell Section Mode....................................................................................................................... 20Clear ........................................................................................................................................... 27Combining Features ................................................................................................................... 66Communicating Results.............................................................................................................. 91Connected Regions .................................................................................................................... 42Context Sensitive Help ............................................................................................................... 19Control Pad................................................................................................................................. 10
Action Buttons......................................................................................................................... 11Direction Buttons..................................................................................................................... 10Shortcut Buttons...................................................................................................................... 11
Converting Measurements into Decision Points......................................................................... 88Copy ........................................................................................................................................... 26Creating Decision Points ............................................................................................................ 88Custom View............................................................................................................................... 98Cut .............................................................................................................................................. 26
D
Decision Point Formula Examples.............................................................................................. 89Decision Points ........................................................................................................................... 88Dialogs
Save & Load............................................................................................................................ 15Save Job ................................................................................................................................. 16
Discrete Output........................................................................................................................... 91

Getting Started with In-Sight
114
E
Edges.......................................................................................................................................... 49Editing Blocks ............................................................................................................................. 26
Clear........................................................................................................................................ 27Copy........................................................................................................................................ 26Cut........................................................................................................................................... 26Paste ....................................................................................................................................... 27
Editing Formulas......................................................................................................................... 24Entering Formulas ...................................................................................................................... 17
F
Features...................................................................................................................................... 41Finding Edges............................................................................................................................. 49Finding Features......................................................................................................................... 41Finding Patterns ......................................................................................................................... 62Formula....................................................................................................................................... 17Formula Bar................................................................................................................................ 18Formula Editor ............................................................................................................................ 18Function List ............................................................................................................................... 19
G
Graphical Controls...................................................................................................................... 99Graphical Displays.................................................................................................................... 100
H
Hide/Unhide Rows & Columns ................................................................................................... 27
I
Inserting and Removing Rows ................................................................................................... 29Interactive Graphics.................................................................................................................... 13
J
Job.............................................................................................................................................. 15Job Load................................................................................................................................... 107
Initiating................................................................................................................................. 107Responding........................................................................................................................... 108
K
Keyboard .................................................................................................................................... 12
L
Live Mode ................................................................................................................................... 38Loading a Job ............................................................................................................................. 16

Index
115
M
Marking a Block .......................................................................................................................... 25Measurements ............................................................................................................................ 79Mouse ......................................................................................................................................... 13Moving Around the Interface ........................................................................................................ 6
N
Navigating..................................................................................................................................... 6Navigating Menus......................................................................................................................... 8Navigation
Control Pad ............................................................................................................................. 10Keyboard................................................................................................................................. 12Mouse ..................................................................................................................................... 13
O
Onscreen Keypad....................................................................................................................... 19
P
Paste........................................................................................................................................... 27Patterns ...................................................................................................................................... 62Property Sheets .......................................................................................................................... 30
R
Relative Cell Reference.............................................................................................................. 17Remote Job Selection .............................................................................................................. 107Run-time Interface ...................................................................................................................... 98
S
Sample Images......................................................................................................................... 110Saving & Loading Jobs............................................................................................................... 15Saving a Job............................................................................................................................... 15Serial Output............................................................................................................................... 95Single Acquire Mode .................................................................................................................. 38Spreadsheet ................................................................................................................................. 6Spreadsheet Update................................................................................................................... 38Starting In-Sight ............................................................................................................................ 2Startup Configuration................................................................................................................ 105Startup Job ............................................................................................................................... 105Structure ..................................................................................................................................... 31
T
The Profiler ............................................................................................................................... 106
U
Using Features to Find Objects .................................................................................................. 66


www.cognex.com/insight/P/N 590-6368
March 2001
Related Documents


![COGNEX in-Sight Product Guide[1]](https://static.cupdf.com/doc/110x72/577cdbac1a28ab9e78a8c578/cognex-in-sight-product-guide1.jpg)


