Copyright © Cengage Learning. All rights reserved.

Copyright © Cengage Learning. All rights reserved.
Dec 25, 2015
Welcome message from author
This document is posted to help you gain knowledge. Please leave a comment to let me know what you think about it! Share it to your friends and learn new things together.
Transcript

Copyright © Cengage Learning. All rights reserved.

Copyright © Cengage Learning. All rights reserved.
Functions Represented by Graphs
SECTION 1.4

3
Learning Objectives
1 Graph functions on the rectangular coordinate system
2 Find a function’s practical domain and practical range values from its graph
3 Determine the vertical intercept (initial value) and horizontal intercepts of a function from a graph and interpret their real-world meanings
4
Graphs of Functions

5
Graphs of Functions
When given the equation of a function, we can generate a table of values and then plot the corresponding points on the rectangular (Cartesian) coordinate system.
On the graph, y is frequently used in place of the function notation f (x). That is, y = f (x). Then the horizontal axis shows the value of the independent variable, x, and the vertical axis shows the value of the dependent variable, y.
Once we have drawn a sufficient number of points to determine the basic shape of the graph, we typically connect the points with a smooth curve.

6
Example 2 – Determining Input and Output Values from a Graph
The graph in Figure 1.16 is a function f (x) with labeledpoints A, B, C, D, E, and F; input values g, h, j, k, m, and n, and output values a, b, c, d, and e.
a. Evaluate f (h).
b. Evaluate f (n).
c. Evaluate f (0).
d. Solve f (x) = d for x.
Figure 1.16

7
Example 2 – Determining Input and Output Values from a Graph
Evaluate f (h)

8
Example 2 – Determining Input and Output Values from a Graph
Evaluate f (h)To evaluate f (h) means to find an output value for the input value h. In other words, we need to find a y-value for the x-value h.
We locate h on the horizontal axis, go up to the function graph f, and then over to find the output value of b.
Therefore, b is the answer, written in function notation as f (h) = b or as the ordered pair (h, b). (Note that B is not the answer because B is simply the name of the point and not the output value of the point.)

9
Example 2 – Determining Input and Output Values from a Graph
Evaluate f (n)
10
Example 2 – Determining Input and Output Values from a Graph
Evaluate f (n)
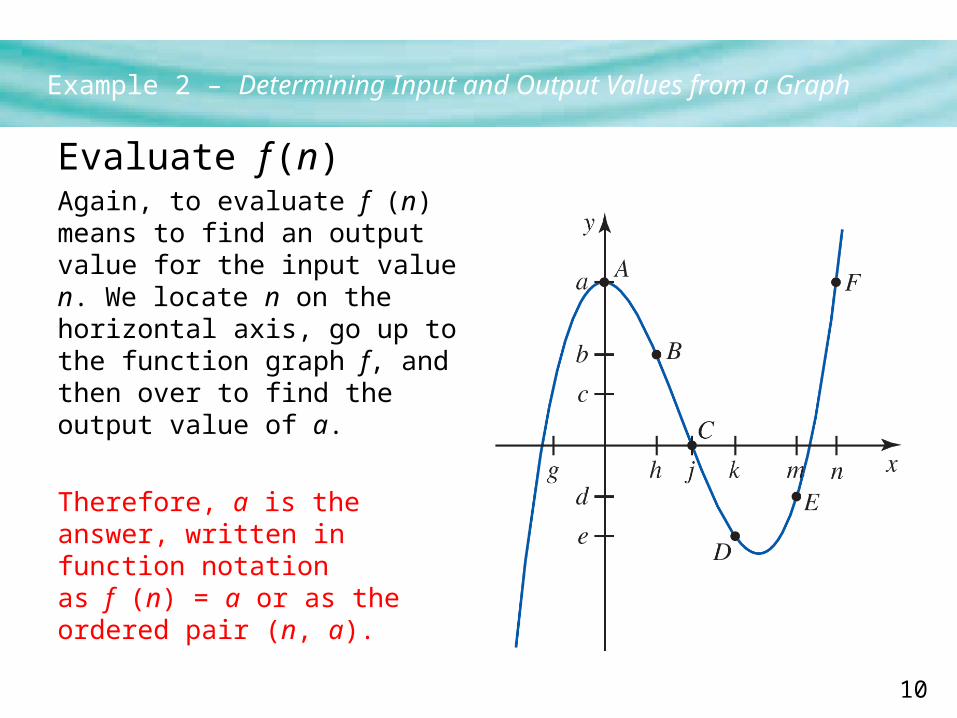
Again, to evaluate f (n) means to find an output value for the input value n. We locate n on the horizontal axis, go up to the function graph f, and then over to find the output value of a.
Therefore, a is the answer, written in function notation as f (n) = a or as the ordered pair (n, a).

11
Example 2 – Determining Input and Output Values from a Graph
Evaluate f (0)

12
Example 2 – Determining Input and Output Values from a Graph
Evaluate f (0)
To evaluate f (0), we locate 0 on the horizontal axis, go up to the function graph f, and encounter the output value a.
Therefore, a is the answer, written in function notation as f (0) = a or as the ordered pair (0, a).

13
Example 2 – Determining Input and Output Values from a Graph
Solve f (x) = d for x

14
Example 2 – Determining Input and Output Values from a Graph
Solve f (x) = d for x
This problem is different from parts (a)–(c). To “solve f (x) = d for x” means that we know the output is d and we are to find the input value for x.
To do this, we locate d on the vertical axis, go over to the function graph f to the point labeled E, and then up to the horizontal axis. When we do this we see that we are near the value m so our estimate is m.

15
Example 2 – Determining Input and Output Values from a Graph
Solve f (x) = d for x
We can write the solution in function notation as f (m) = d or as the ordered pair (m, d).
We also observe that f (x) = d for an unlabeled value of x between j and k and an unlabeled value of x to the left of g.

16
Domain and Range

17
Domain and Range
When considering the graph of a function, we need to consider what values are reasonable for the input and output.

18
Domain and Range
The concepts of domain and range address this issue.
(One way to keep the terms straight is to observe that the terms input, independent variable, and domain all contain the word in.)

19
Domain and Range
When a value from the domain is substituted for the independent variable and the corresponding output is evaluated, the result is a value of the dependent variable.

20
Example 3 – Determining Practical Domain and Range
Determine (a) the practical domain and (b) the practical range for the head circumference of a boy who is in the 50th percentile as shown in Figure 1.17.

21
Example 3 – Determining Practical Domain and Range

22
Example 3 – Determining Practical Domain and Range
Use the child’s age as the independent variable, t, and the head circumference as the dependent variable, H.
Solution:
a. The practical domain for the head circumference function is 0 t 36 because the graph goes from age 0 months to 36 months in the horizontal direction.
b. We find the curve on the graph marked with the 50. This is the graph representing the 50th percentile. The practical range for the function is 36 H 49.6 because the head circumference ranges from 36 cm at birth to 49.6 cm at age 36 months.
cont’d

23
Interpreting Graphs in Context

24
Interpreting Graphs in Context
When we use a graph to model a real-world situation, it is important to keep track of the independent and dependent variables, and to understand the contextual meaning of the coordinates of a point.
25
Interpreting Graphs in Context
For example, the graphs of functions often intersect the vertical and horizontal axes at what we call the vertical and horizontal intercepts. A vertical intercept may also be referred to as the initial value.
We investigate this in the next example.

26
Example 4 – Interpreting the Real-World Meaning of a Graph
The graph in Figure 1.18 is a mathematical model of the temperature of an oven over time. The independent variable is time in minutes and the dependent variable is temperature in degrees Fahrenheit (F). Describe what the graph indicates and include an explanation of any intercepts.
Figure 1.18

27
Example 4 – Interpreting the Real-World Meaning of a Graph
The vertical intercept (where the graph intersects the vertical axis) shows that the oven started at approximately 75 (room temperature). We represent this by the ordered pair (0, 75).

28
Example 4 – Interpreting the Real-World Meaning of a Graph
This vertical intercept may also be described as the initial value because at time 0 minutes (when we started keeping time) the initial oven temperature was 75.

29
Example 4 – Interpreting the Real-World Meaning of a Graph
The oven then heated up slightly past 350. The oven then repeatedly cooled off a few degrees and heated up a few degrees above 350, possibly trying to maintain a temperature of 350.

30
Example 4 – Solution
Near the 30-minute mark the oven may have been turned off, because it began to cool off. The graph does not cross the horizontal axis so there is no horizontal intercept.
A horizontal intercept would show us the time in minutes when the oven temperature was 0, and it is reasonable to assume that the oven temperature would never reach that low (unless it was in a landfill in the Arctic).
cont’d
Related Documents