Copyright © Cengage Learning. All rights reserved. Chapter 4 Financial Reporting and Analysis

Copyright © Cengage Learning. All rights reserved. Chapter 4 Financial Reporting and Analysis.
Dec 28, 2015
Welcome message from author
This document is posted to help you gain knowledge. Please leave a comment to let me know what you think about it! Share it to your friends and learn new things together.
Transcript

Copyright © Cengage Learning. All rights reserved.
Chapter 4
Financial Reporting and Analysis

Copyright © Cengage Learning. All rights reserved. 4-2
Foundations of Financial Accounting
• Objective 1– Describe the objectives of financial reporting and identify
the qualitative characteristics, conventions, and ethical considerations of accounting information.

Copyright © Cengage Learning. All rights reserved. 4-3
Objectives of Financial Reporting
To provide financial information about the reporting entity that is useful to present and potential equity investors, lenders, and other
creditors in making decisions in their capacity as capital providers.
==================================
Information that is decision-useful to capital providers may also be useful to other users of financial reporting who are not capital providers.

Copyright © Cengage Learning. All rights reserved. 4-4
Objectives of Financial Reporting
To be useful for decision making, information about financial reporting, which includes financial statements but is not limited to them, must be able to:
Assess cash flow prospects.Capital providers and other users need information to help make judgments about the entity’s ability to general cash flows.
Assess stewardship.Capital providers and others need information about the entity’s resources (assets), claims against them (liabilities and stockholders’ equity) and changes in these resources and claims as impacted by transactions (earnings and cash flows) and other economic events.

Copyright © Cengage Learning. All rights reserved. 4-5
Financial Statements
Balance sheet
Income statement
Statement of retained earnings
Statement of cash flows• These are important output of the accounting
system, but not the only output.– Management’s explanations and other information,
including underlying assumptions and significant uncertainties about methods and estimates used in the financial reports, constitute important components of financial reporting by an entity.

Copyright © Cengage Learning. All rights reserved. 4-6
Financial Statements (cont’d)
• Because of a potential conflict of interest between managers, who prepare the statements, and investors or creditors, who invest in or lend money to the business, financial statements are audited by outside accountants to ensure their reliability.
Copyright © Cengage Learning. All rights reserved. 4-7
Qualitative Characteristics
• In practice, accounting information…• Is neither simple nor precise
• Rarely satisfies all criteria
• Often results from approximate measures
• Based on rules and conventions rather than exact amounts

Copyright © Cengage Learning. All rights reserved. 4-8
Qualitative Characteristics
• The goal of generating accounting information is to provide data to different users for different needs.
• How this goal is achieved provides interest and controversy in accounting.
• To facilitate interpretation, the FASB has developed qualitative characteristics of accounting information.
• The most important or fundamental qualitative characteristics are relevance and faithful representation.

Copyright © Cengage Learning. All rights reserved. 4-9
Relevance
• Relevance means that the information has a direct bearing on a decision.
• To be relevant, information must have:– Predictive value,
– Confirmative value, or
– Both.
• Predictive value means that it will help capital provider decisions about the future.
• Confirmative value means that it will provide information to determine if expectations have been met.
Copyright © Cengage Learning. All rights reserved. 4-10
Faithful Representation
• Faithful representation means that the financial reporting must be a reliable depiction of what an entity purports to represent.
• To be faithful, information must be– Complete (or all necessary information needed for a
reliable decision),
– Neutral (or free from bias), and
– Free from material error (or meets a minimum level of accuracy, without distorting what the information depicts).

Copyright © Cengage Learning. All rights reserved.
Qualitative Characteristics that Complement Information Quality
• Comparability: The quality that enables users to identify similarities and differences between two sets of economic phenomena.
• Verifiability: The quality that helps assure users that information faithfully represents what it purports to depict.
• Timeliness: The quality that enables the user to receive information in time to influence a decision.
• Understandability: The quality that enables users to comprehend the meaning of the information they receive.
4-11

Copyright © Cengage Learning. All rights reserved. 4-12
Accounting Conventions
• Objective 2– Define and describe the conventions of consistency, full
disclosure, materiality, conservatism, and cost-benefit.

Copyright © Cengage Learning. All rights reserved. 4-13
Accounting Conventions
• Since financial statement are based largely on estimates, the application of accounting rules for recognition and allocation are critical.
• To deal with these constraints, five conventions help in the preparation and interpretation of financial statements. They are:
1. Consistency,
2. Materiality,
3. Conservatism,
4. Full Disclosure, and
5. Cost-Benefit.

Copyright © Cengage Learning. All rights reserved. 4-14
Consistency
• Means constantly applying policies or principles• Once an accounting procedure is adopted by a
company, it must remain in use from one period to another, unless users are informed of a change.– Users can assume that no arbitrary changes in accounting
measures and procedures have taken place when interpreting financial statements.

Copyright © Cengage Learning. All rights reserved. 4-15
Consistency (cont’d)
• Changes in accounting measures and procedures may become necessary.– Example:
• A method of accounting for inventory may be changed because it is believed that the new method improves the matching of revenues and costs.
• Generally accepted accounting principles require that changes and their dollar effects be described in the notes to the financial statements.

Copyright © Cengage Learning. All rights reserved. 4-16
Full Disclosure
• Requires that financial statements and their notes present all information relevant to users– Financial statements should offer explanations needed to
keep them from being misleading
• Many disclosures are required by the SEC and other official bodies
• Other disclosures are based the judgment of management and the company accountants– If too much information is disclosed, the notes impede
rather than help understanding
Copyright © Cengage Learning. All rights reserved. 4-17
Examples of Required Disclosures• Changes of accounting practices• Amount of depreciation expense on income
statement• Amount of accumulated depreciation on the balance
sheet• Accounting procedures used in preparing financial
statements• Important terms of the company’s debt• Commitments and contingencies• Important events taking place after the date of the
statements

Copyright © Cengage Learning. All rights reserved. 4-18
Materiality
• Refers to the importance of an item or event– If an item is relevant to the decisions a user of financial
statements makes, it is material
• Is normally determined by relating an item’s dollar value to an element of the financial statements– Some accountants believe an item that is 5% or more of
net income is relevant
• Depends on the nature of the item– The discovery of a bribe or theft, no matter what the
amount involved, is considered material

Copyright © Cengage Learning. All rights reserved. 4-19
Conservatism
• Means that when there is uncertainty about which accounting procedure to use, the one that is least likely to overstate assets and income should be used– Should be used only when uncertainty exists
– If used incorrectly, leads to incorrect and misleading financial statements
• A common application is use of the lower-of-cost-or-market method of accounting for inventories– If market value > cost, use cost
– If market value < cost, use market value

Copyright © Cengage Learning. All rights reserved. 4-20
Cost-Benefit
• Holds that the benefits of providing accounting information should exceed the costs of providing it– Information must meet minimum levels of reliance and
reliability to be useful
– Beyond that, the FASB and SEC, who require information, and the accountant, who provides information, must judge the costs and benefits in each case

Copyright © Cengage Learning. All rights reserved. 4-21
Costs and Benefits
• Costs– Fall at first on the preparers of financial statements
– Ultimately are passed on to society in the form of prices
• Benefits– Reaped by both the preparers and users of financial
statements
– Ultimately are passed on to society in the form of social benefits from more efficient allocation of resources

Copyright © Cengage Learning. All rights reserved. 4-22
Classified Balance Sheet
• Objective 3– Identify and describe the basic components of a classified
balance sheet.

Copyright © Cengage Learning. All rights reserved. 4-23
• Most companies use similar subdivisions, but subdivisions usually depend upon the type of business
ASSETS LIABILITIES STOCKHOLDERS’ EQUITY Current assets Current liabilities Contributed capital Investments Long-term liabilities Retained earnings Property, plant, and equipment Intangible assets
Classified Balance Sheet• Assets, liabilities, and stockholders’ equity sections
are subdivided into useful categories.
Copyright © Cengage Learning. All rights reserved. 4-24
Current Assets
• Cash and other assets that are reasonably expected to be converted to cash, sold, or consumed within one year
• Or within the normal operating cycle of thebusiness, whichever is longer

Copyright © Cengage Learning. All rights reserved. 4-25
Normal Operating Cycle
• The average time needed to go from cash to cash– Spend cash to buy merchandise inventory
– Sell inventory on account
– Collect cash
• The normal operating cycle is usually less than one year

Copyright © Cengage Learning. All rights reserved. 4-26
Examples of Current Assets
• Cash• Temporary investments• Accounts receivable• Inventory• Prepaid expenses

Copyright © Cengage Learning. All rights reserved. 4-27
Investments
1. Assets
2. Usually long-term,
3. Not used in the normal operation of the business
4. Management does not plan to convert to cash within the next year

Copyright © Cengage Learning. All rights reserved. 4-28
Types of Investments
• Securities held for investment• Long-term notes receivable• Land held for future use• Plant or equipment not used in the business• Special funds established to
– Pay off debt
– Purchase a building
• Large permanent investments in another company– For the purpose of controlling that company

Copyright © Cengage Learning. All rights reserved. 4-29
Property, Plant, and Equipment
• Includes long-term asset used in the continuing operation of the business.
• These assets represent a place to operate (land and buildings)
• Equipment to produce, sell, deliver, andservice the company’s goods

Copyright © Cengage Learning. All rights reserved. 4-30
Property, Plant, and Equipment
• Also called– Operating assets
– Fixed assets
– Tangible assets
– Long-lived assets
– Plant assets
• The costs of these assets are depreciated– Spread over the periods they benefit
• Past depreciation is recorded in the Accumulated Depreciation accounts

Copyright © Cengage Learning. All rights reserved. 4-31
Intangible Assets
• Long-term assets that have no physical substance• But have a value based on rights or privileges
that belong to their owner.
• These assets are recorded at cost. • The cost is spread over the expected life of the right
or privilege.

Copyright © Cengage Learning. All rights reserved. 4-32
Examples of Intangible Assets
• Patents• Copyrights• Goodwill• Franchises• Trademarks

Copyright © Cengage Learning. All rights reserved. 4-33
Liabilities
Divided into two categories based on when they fall due
•Current liabilities•Long-term liabilities

Copyright © Cengage Learning. All rights reserved. 4-34
Current Liabilities
• Obligations that must be satisfied within one year or within the normal operating cycle, whichever is longer
• Typically paid from current assets or by incurring new short-term liabilities
• Examples: Notes payable, accounts payable, current portion of long-term debt, salaries and wages payable, taxes payable, customer advances (unearned revenues)

Copyright © Cengage Learning. All rights reserved. 4-35
Long-Term Liabilities
• Debts of the business that fall due more than one year in the future or beyond the normal operating cycle, which will be paid out of noncurrent assets
• Examples: Mortgages payable, long-term notes, bonds payable, employee pension obligations, and long-term lease liabilities

Copyright © Cengage Learning. All rights reserved. 4-36
Deferred Income Taxes
• Are often disclosed as a separate category in the long-term liability section of the balance sheet of publicly held corporations
• Are the result of different rules that apply for measuring income taxes for tax purposes and for financial reporting purposes– Amount is the cumulative annual difference between
income taxes payable to governments and income tax expense reported on the income statement

Copyright © Cengage Learning. All rights reserved. 4-37
Stockholders’ Equity
• Made up of two components on the balance sheet: – Contributed or paid-in capital
– Retained Earnings
• Generally, contributed capital is shown as two amounts: – Par value of the issued stock
– Amounts paid in, or contributed, in excess of the par value per share

Copyright © Cengage Learning. All rights reserved. 4-38
Forms of the Income Statement
• Objective 4– Describe the features of multistep and single-step
classified income statements.

Copyright © Cengage Learning. All rights reserved. 4-39
Notice that the multistep income statement for a service company and a merchandising or manufacturing company both include three
of the same steps.
Step
Service Company Merchandising or Manufacturing
Company 1 Income from operations Gross margin 2 Income before income taxes Income from operations 3 Net income Income before income taxes 4 Net income
Multistep Income Statements
Presented in a series of steps, or subtotals, to arrive at net income

Copyright © Cengage Learning. All rights reserved. 4-40
Step
Service Company Merchandising or Manufacturing
Company 1 Income from operations Gross margin 2 Income before income taxes Income from operations 3 Net income Income before income taxes 4 Net income
Gross Margin = Net Sales – Cost of Goods Sold
Multistep Income Statements
• Merchandising companies buy and sell products• Manufacturing companies make and sell products• Both require an additional step in the multistep
income statement for the cost of the goods that are sold– Service companies only have operating costs – they do not
sell a physical product

Copyright © Cengage Learning. All rights reserved.
Components of Multistep Income Statements for Service and Merchandising or Manufacturing Companies

Copyright © Cengage Learning. All rights reserved. 4-42
Discounts - Allowances and Returns Sales - Sales Gross SalesNet
Net Sales
• Gross sales equal the total cash sales and total credit sales during a given accounting period– Follows the revenue recognition rule
– Revenue is recognized even though cash may not be collected until the following accounting period
• Amount of sales and trends in net sales over time are used to analyze a company’s progress

Copyright © Cengage Learning. All rights reserved. 4-43
Cost of Goods Sold
• The amount paid for merchandise sold, or the cost to manufacture products that were sold, during an accounting period
• Also called cost of sales

Copyright © Cengage Learning. All rights reserved. 4-44
SalesNet
Margin Gross Margin Gross of Percentage
• Both are useful in planning business operations
Gross Margin
• Difference between net sales and cost of goods sold • Management is interested in both the
– Amount of gross margin
– Percentage of gross margin

Copyright © Cengage Learning. All rights reserved. 4-45
Operating Expenses
• Expenses, other than cost of goods sold,that are incurred in running a business
• These expenses are grouped into categories– Selling expenses
– General and administrative expenses
– Other revenues and expenses

Copyright © Cengage Learning. All rights reserved. 4-46
Types of Selling Expenses• Cost of storing goods• Cost of preparing goods for sale• Advertising and promoting sales• Delivering goods to the buyer
– Called freight out expense
• General occupancy expenses (may be allocated among selling expenses and general and administrative expenses)– Rent expense– Utilities expense– Insurance expense

Copyright © Cengage Learning. All rights reserved. 4-47
General and Administrative Costs
• General office expenses– Accounting
– Personnel
– Credit and collections
– Expenses that apply to overall operations
• General occupancy expenses (may be allocated among general and administrative expenses and selling expenses)– Rent expense
– Utilities expense
– Insurance expense

Copyright © Cengage Learning. All rights reserved.Copyright © Houghton Mifflin Company. All rights reserved. 4-48
Income from Operations
• Difference between gross margin and operating expenses
• Also called operating income • Represents income from a company’s main business

Copyright © Cengage Learning. All rights reserved. 4-49
Other Revenues and Expenses
• Not part of a company’s operating activities
• Includes– Revenues or expenses from investments
• Dividends and interest
– Interest and other expenses from borrowing
– Any other revenue or expense not related to the company’s normal business operations

Copyright © Cengage Learning. All rights reserved. 4-50
Taxes Income Before Income
Expenses and RevenuesOther -
Operations from Income
Income Before Income Taxes
The amount a company has earned from all activities
– operating and nonoperating – before taxes

Copyright © Cengage Learning. All rights reserved. 4-51
IncomeNet Taxes Income- Taxes Income Before Income
Net Income
• Amount that remains of the gross margin after operating expenses are deducted, other revenues and expenses are added or deducted, and income taxes are deducted
• It is the final figure, or “bottom line,” of the income statement
Copyright © Cengage Learning. All rights reserved. 4-52
Net Income (cont’d)
• Is an important performance measure– Represents the amount of business earnings that accrue to
stockholders
– Is the amount transferred to retained earnings from all income generating activities during the year
– Often used to determine whether a business has been operating successfully

Copyright © Cengage Learning. All rights reserved. 4-53
gOutstandinStock Common of Shares ofNumber
IncomeNet Shareper Earnings
Performance measure shown on the income statement
Earnings per Share
• Useful in assessing a company’s– Profit earning success– Earnings in relation to the market price of its stock

Copyright © Cengage Learning. All rights reserved. 4-54
Dell Income Statement

Copyright © Cengage Learning. All rights reserved. 4-55
Single-Step Income Statement
• A condensed income statement that arrives at net income in a single step
• First section includes major categories of revenues• Second section includes major categories of
expenses• Total Revenues – Total Expenses = Income Before
Income Taxes

Copyright © Cengage Learning. All rights reserved.
Single-Step Income Statement
Notice that income taxes are shown as a separate step, as in the multistep
form.
RevenuesNet sales $1,248,624 Interest income 5,600Total revenues $1,254,224
Costs and expensesCost of goods sold $815,040 Selling expenses 219,120General and administrative 138,016Interest expense 10,524Total costs and expenses 1,182,700
Income before income taxes $71,524 Income taxes 13,524
Net income $58,000
Earnings per share $2.90
Income StatementFor the Year Ended December 31, 2010
Cruz Corporation

Copyright © Cengage Learning. All rights reserved. 4-57
Using Classified Financial Statements
• Objective 5– Use classified financial statements to evaluate liquidity
and profitability.
Copyright © Cengage Learning. All rights reserved. 4-58
Using Classified Financial Statements
• Information in financial statements may be used to evaluate two important goals of management– Maintaining adequate liquidity
– Achieving satisfactory profitability

Copyright © Cengage Learning. All rights reserved. 4-59
Evaluation of Liquidity
• Liquidity means having enough money on hand to pay bills when they become due and to cover unexpected needs for cash
• Two measures of liquidity:– Working capital
– Current ratio

Copyright © Cengage Learning. All rights reserved. 4-60
sLiabilitieCurrent Total - AssetsCurrent Total Capital Working
Current assets. Assets that will be converted to cash or used up within one year or one operating cycle, whichever is longerCurrent liabilities. Debts that must be paid or obligations that must be performed within one year or one operating cycle, whichever is longer
Working Capital
The amount by which total current assets exceed total current liabilities

Copyright © Cengage Learning. All rights reserved. 4-61
Current assets $467,424 Current liabilities – 170,732 Working capital $ 296,692
Working Capital (cont’d)
•Working capital is used to buy inventory, obtain credit, and finance expanded sales.
•Lack of working capital can lead to a company's failure.
•Working capital for Cruz Corporation:

Copyright © Cengage Learning. All rights reserved. 4-62
sLiabilitieCurrent
AssetsCurrent RatioCurrent
The ratio of current assets to current liabilities
Current Ratio
• Is closely related to working capital• Believed by many to be a good indicator of a
company’s ability to– Pay its bills– Repay outstanding debt

Copyright © Cengage Learning. All rights reserved. 4-63
Evaluation of Profitability
• Profitability means the ability to earn a satisfactory income.
• Common profitability measures: – Profit margin
– Asset turnover
– Return on assets
– Debt to equity ratio
– Return on equity

Copyright © Cengage Learning. All rights reserved. 4-64
SalesNet
IncomeNet Margin Profit
Profit margin for Cruz Corporation:
$1,248,624
$58,000 Margin Profit (4.6%) .046
This means that on each dollar of net sales, Cruz Corporation made 4.6 cents.
Profit Margin
Shows the percentage of each sales dollar that results in net income.

Copyright © Cengage Learning. All rights reserved. 4-65
Assets Total Average
SalesNet Turnover Asset
• Shows how many dollars of sales were generated by each dollar of assets
• A high asset turnover means a company uses its assets productively
Shows a meaningful relationship between an income statement figure and a balance sheet figure
Asset Turnover
Measures how efficiently assets are used to produce sales

Copyright © Cengage Learning. All rights reserved. 4-66
2 $594,480) ($635,664
$1,248,624 Turnover Asset
Assets Total Average
SalesNet Turnover Asset
Average total assets is computed by adding total assets at the beginning of the year to total assets at the end of the year and dividing by 2.
times2.0 $615,072
$1,248,624
This means that Cruz produces $2.00 in sales for each $1.00 invested in average total assets
Asset Turnover (cont’d)
Asset turnover for Cruz Corporation:

Copyright © Cengage Learning. All rights reserved. 4-67
Assets Total Average
IncomeNet Assetson Return
Return on Assets
Measures how efficiently a companyuses its assets to produce income

Copyright © Cengage Learning. All rights reserved. 4-68
Indicates how efficiently the company is using all
its assets
Indicates income-generating
strength of a firm’s resources
Assets Total Ave.
IncomeNet
Assets Total Ave.
SalesNet
SalesNet
IncomeNet
Assetson Return Turnover Asset Margin Profit
• Return on assets overcomes the limitations of profit margin and asset turnover ratios
– Profit margin does not consider the assets necessary to produce income– Asset turnover ratio does not take into account the amount of net income produced
Return on Assets (cont’d)
Combines profit margin and asset turnover

Copyright © Cengage Learning. All rights reserved. 4-69
Return on assets for Cruz Corporation:
2 $594,480) ($635,664
$58,000 Assetson Return
9.4%or .094 $615,072
$58,000
This means that for each dollar invested by stockholders, Cruz’s assets generate 9.4 cents of net income
Assets Total Average
IncomeNet Assetson Return
Assetson Return Turnover Asset Margin Profit
*9.2% times2.0 4.6% *Difference due to rounding
Return on Assets (cont’d)

Copyright © Cengage Learning. All rights reserved. 4-70
Equity rs'Stockholde
sLiabilitie Total Equity Debt to
• A company with a high debt to equity ratio is at risk in poor economic times because it must continue to repay creditors
• A company with a low debt to equity ratio is safer because stockholders do not have to be repaid and dividends can be deferred
Debt to Equity Ratio
Shows the proportion of the company’s assets that is financed by creditors in comparison to that financed
by stockholders

Copyright © Cengage Learning. All rights reserved. 4-71
Represent assets financed by investors
Represent assets financed by creditors
614.$393,732
$241,932
Equity rs'Stockholde
sLiabilitie Total Equity Debt to
Debt to Equity (cont’d)
•The assets of a company are financed by: Creditors (creating liabilities) Investors (creating stockholders’ equity)
•A debt to equity ratio of 1.0 means that half the company’s assets are financed by creditors and half are financed by investors.
Copyright © Cengage Learning. All rights reserved. 4-72
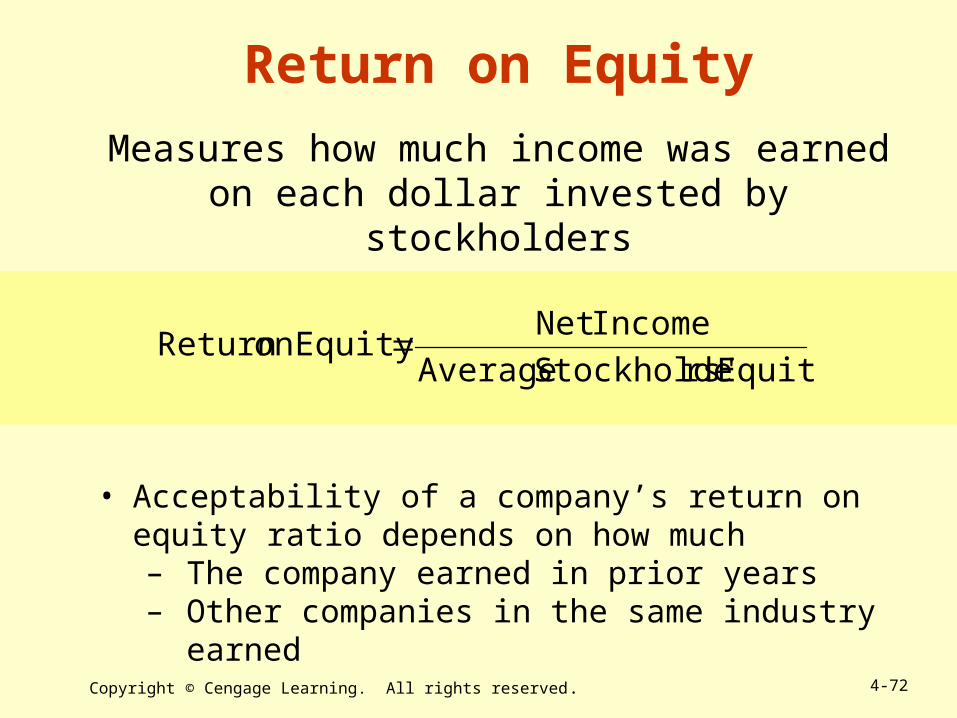
Equity rs'Stockholde Average
IncomeNet Equity on Return
• Acceptability of a company’s return on equity ratio depends on how much– The company earned in prior years– Other companies in the same industry earned
Return on Equity
Measures how much income was earned on each dollar invested by stockholders

Copyright © Cengage Learning. All rights reserved. 4-73
Equity rs'Stockholde Average
IncomeNet Equity on Return
2 $402,212) ($393,732
$58,000
14.6%or .146
$397,972
$58,000
Average stockholders’ equity is computed by adding total stockholders’ equity at the beginning of the year to total stockholders’ equity at the end of the year and dividing by 2.
This means that Cruz earned 14.6 cents for every dollar invested by stockholders
Return on Equity (cont’d)
Return on equity for Cruz Corporation:

Copyright © Cengage Learning. All rights reserved. 4-74
Stop & Review
Q. Which is the more important goal, liquidity or profitability? Explain your answer.
A. The goals of liquidity and profitability are equally important. Both must be met if a company is to survive.

Copyright © Cengage Learning. All rights reserved. 4-75
Chapter Review
1. Describe the objectives of financial reporting and identify the qualitative characteristics, conventions, and ethical considerations of accounting information.
2. Define and describe the conventions of consistency, full disclosure, materiality, conservatism, and cost-benefit.
3. Identify and describe the basic components of a classified balance sheet.

Copyright © Cengage Learning. All rights reserved. 4-76
Chapter Review (cont’d)
4. Describe the features of multistep and single-step classified income statements.
5. Use classified financial statements to evaluate liquidity and profitability.
Related Documents