Copyright (c) Bani Malli ck 1 Stat 651 Lecture 5

Copyright (c) Bani Mallick1 Stat 651 Lecture 5. Copyright (c) Bani Mallick2 Topics in Lecture #5 Confidence intervals for a population mean when the.
Dec 19, 2015
Welcome message from author
This document is posted to help you gain knowledge. Please leave a comment to let me know what you think about it! Share it to your friends and learn new things together.
Transcript

Copyright (c) Bani Mallick 1
Stat 651
Lecture 5
Copyright (c) Bani Mallick 2
Topics in Lecture #5 Confidence intervals for a population
mean when the population standard deviation is known.
Properties of confidence intervals: what things make them longer and shorter.
Sample size calculation for a population mean when the population standard deviation is known : a simple illustration of a method.

Copyright (c) Bani Mallick 3
Book Sections Covered in Lecture #5
Chapter 5.1
Chapter 5.2
Chapter 5.3

Copyright (c) Bani Mallick 4
Lecture 4 Review: Pr(X < c) for Normal Populations
Compute the z-score
Look up value in Table 1
c-μz=
σ
Copyright (c) Bani Mallick 5
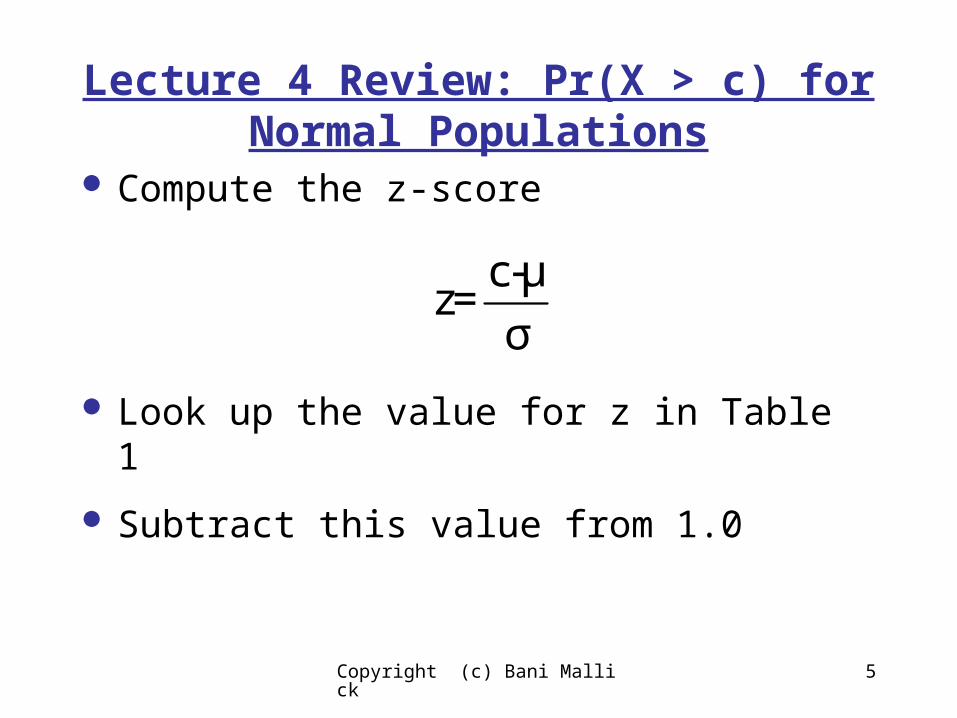
Lecture 4 Review: Pr(X > c) for Normal Populations
Compute the z-score
Look up the value for z in Table 1
Subtract this value from 1.0
c-μz=
σ

Copyright (c) Bani Mallick 6
Lecture 4 Review: Inference
The sample mean is a random variable
Its own “population” mean is
It’s standard deviation is
Note how the standard deviation of the sample mean becomes smaller as the sample size becomes larger
More data = more precision!!!!!
σ/ n
Copyright (c) Bani Mallick 7
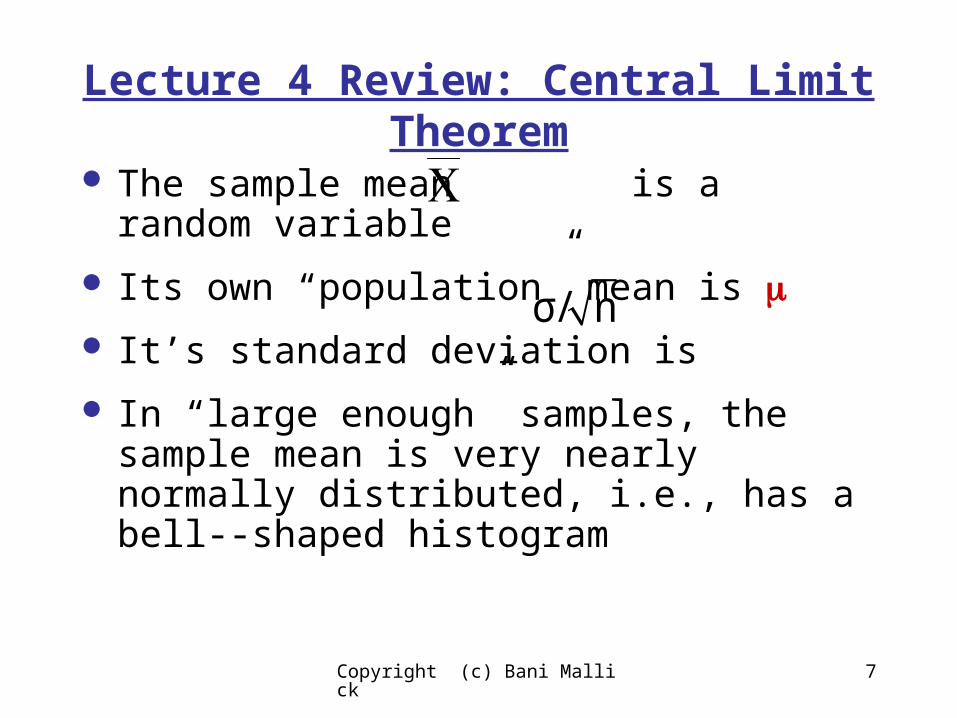
Lecture 4 Review: Central Limit Theorem
The sample mean is a random variable
Its own “population” mean is
It’s standard deviation is
In “large enough” samples, the sample mean is very nearly normally distributed, i.e., has a bell--shaped histogram
σ/ n

Copyright (c) Bani Mallick 8
Confidence Interval for a Population Mean
A considerable part of basic statistics is to make inferences about the population mean
It is impossible to know the value of exactly.
This is a key factoid: why do I say this with such certainty?

Copyright (c) Bani Mallick 9
Confidence Interval for a Population Mean
A considerable part of basic statistics is to make inferences about the population mean
It is impossible to know the value of exactly.
Because (almost) every sample will give you a unique sample mean, and that sample mean will not equal the population mean.

Copyright (c) Bani Mallick 10
Confidence Interval for a Population Mean
What we can do is to construct an interval of possible values for the population mean .
The interval is determined by how much “confidence” we want in saying that the population mean is in the interval.
The interval is always of the formfactor confidence

Copyright (c) Bani Mallick 11
Confidence Interval for a Population Mean
The confidence factor is determined by how much confidence we want in concluding that the population mean is actually in the interval
Which interval has higher confidence of including the population mean?
-100 to -50 OR
-150 to 0
factor confidence

Copyright (c) Bani Mallick 12
Confidence Interval for a Population Mean: Formal
Method The first method assumes that the
population standard deviation is known.
Suppose we want to be 95% confident that our interval includes the population mean , i.e., the probability is 95% that the population mean is in the interval.
Here is the interval:
n96.1 to
n96.1
Copyright (c) Bani Mallick 13
WOMEN’S INTERVIEW SURVEY OF HEALTH (WISH)
computed the reported mean caloric intake at the start of the study, and the mean reported caloric intake at the end
My random variable X was the change (difference)
My hypothesis is that the population mean of X is < 0. In other words, I think women report less calories the more they are asked about their diet (Hawthorne Effect).

Copyright (c) Bani Mallick 14
WISH: Change in Caloric Intake
271N =
Change in mean Energ
2000
1000
0
-1000
-2000
-3000
217239
208
247
Does it look like a big change?Note that the
scale of the box plotis -3000 to 2000

Copyright (c) Bani Mallick 15
WISH
The sample size is n = 271
The sample mean change = -180
I am going to pretend that the population standard deviation is = 600.
n96.1 to
n96.1
Copyright (c) Bani Mallick 16
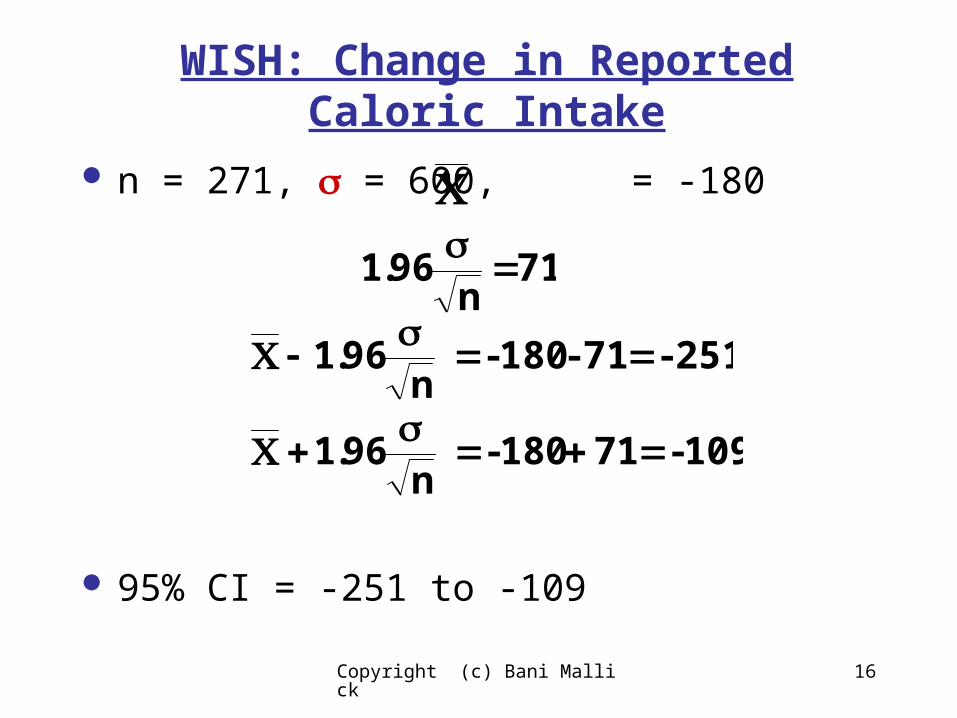
WISH: Change in Reported Caloric Intake
n = 271, = 600, = -180
95% CI = -251 to -109
71 n
96.1
251- 71 - 180- n
96.1
109- 71 180- n
96.1

Copyright (c) Bani Mallick 17
Review
= 600, n = 271, = -180
Then, with 95% probability, true population mean change is in the interval from -251 to -109
The chance is 95% that the population mean change is between 251 and 109 calories lower
Is there a Hawthorne effect?

Copyright (c) Bani Mallick 18
Confidence Intervals
You can construct a confidence interval for the population mean with any level of confidence.
Generally, people report the 95% CI, but sometimes they report the 90% and 99% confidence intervals.
This is easy to do via a formula, and even easier to do via SPSS.

Copyright (c) Bani Mallick 19
Confidence Interval for a Population Mean when is
Known Want 90%, 95% and 99% chance of
interval including .
90%
95%
99%
n645.1 to
n645.1
n96.1 to
n96.1
n58.2 to
n58.2
Copyright (c) Bani Mallick 20
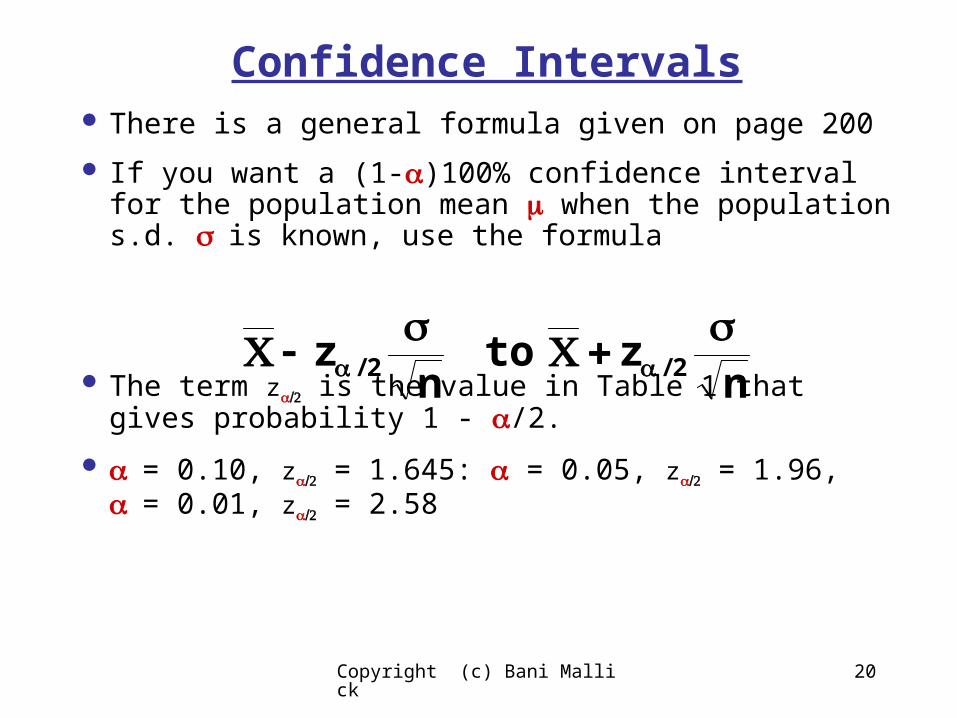
Confidence Intervals There is a general formula given on page 200
If you want a (1-)100% confidence interval for the population mean when the population s.d. is known, use the formula
The term z is the value in Table 1 that gives probability 1 - /2.
= 0.10, z = 1.645: = 0.05, z = 1.96, = 0.01, z = 2.58
nz to
nz 2/2/

Copyright (c) Bani Mallick 21
WISH
The sample size is n = 271
The sample mean change = -180
I am going to pretend that the population standard deviation is = 600.
I want a 99% confidence interval: z = 2.58
n58.2 to
n58.2

Copyright (c) Bani Mallick 22
WISH: Change in Reported Caloric Intake
n = 271, = 600, = -180
99% CI = -274 to -86
94 n
58.2
274- 94 - 180- n
58.2
86- 94 180- n
58.2

Copyright (c) Bani Mallick 23
WISH: Change in Reported Caloric Intake
99% CI = -274 to -86
The chance is 99% that the population mean change in reported caloric intake is between 274 and 86 calories
The chance is less than 1% that there is no change in the population mean.
Copyright (c) Bani Mallick 24
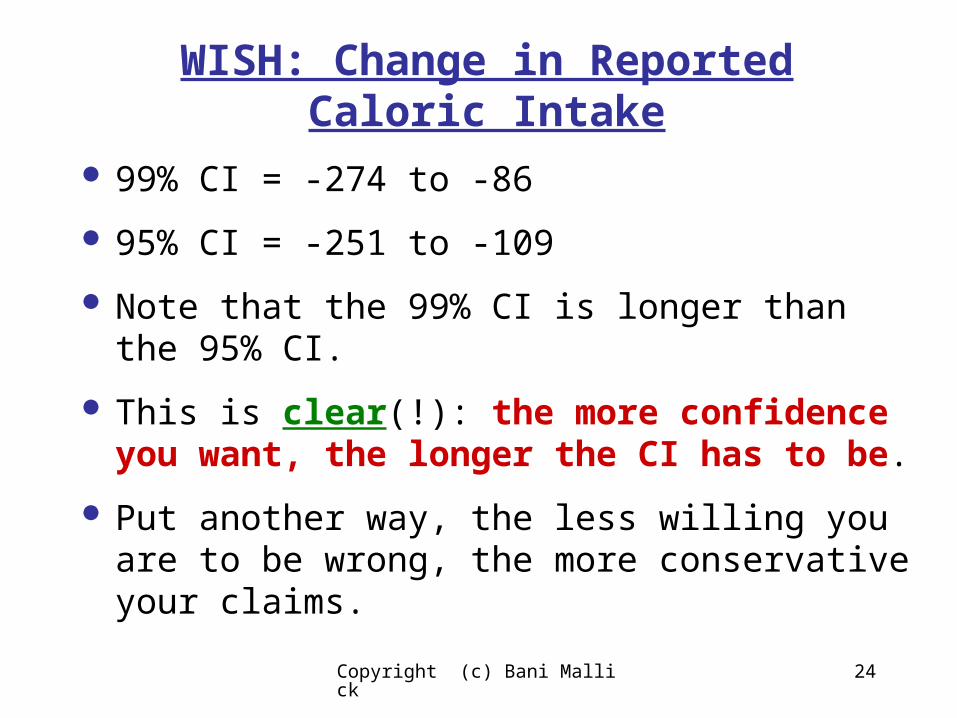
WISH: Change in Reported Caloric Intake
99% CI = -274 to -86
95% CI = -251 to -109
Note that the 99% CI is longer than the 95% CI.
This is clear(!): the more confidence you want, the longer the CI has to be.
Put another way, the less willing you are to be wrong, the more conservative your claims.
Copyright (c) Bani Mallick 25
Effect of Sample Size
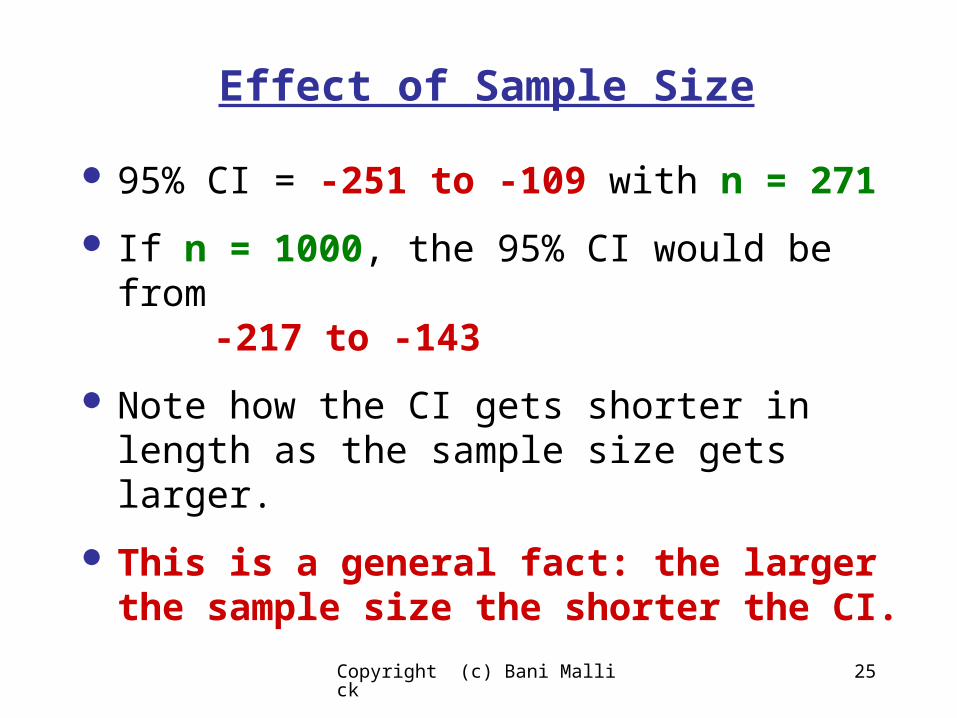
95% CI = -251 to -109 with n = 271
If n = 1000, the 95% CI would be from -217 to -143
Note how the CI gets shorter in length as the sample size gets larger.
This is a general fact: the larger the sample size the shorter the CI.

Copyright (c) Bani Mallick 26
Effect of Population Standard Deviation
95% CI = -251 to -109 with = 600
If = 2000, the 95% CI would be from -418 to +58
Note how the CI gets longer in length as the population standard deviation gets larger.
This is a general fact: the larger the population standard deviation the longer the CI.

Copyright (c) Bani Mallick 27
Using SPSS to Construct CI
SPSS actually assumes that the population standard deviation is unknown: we will consider this case later.
Its default is a 95% CI
You can easily change to any level of confidence
SPSS demo using Wish Data

Copyright (c) Bani Mallick 28
Sample Size Determination
In general, this is a relatively complex issue, depending very heavily on the experiment.
I will show you a simple calculation in the special case that the population standard deviation is known.
Of course, is not known in practice, and more complex methods are required, but this will give you a feel for the process.

Copyright (c) Bani Mallick 29
Sample Size Determination
The usual answer to “what sample size should I take” is “what can you afford”.
Remember, more precision with larger sample sizes
Less precision with smaller sample sizes
Copyright (c) Bani Mallick 30
Sample Size Determination
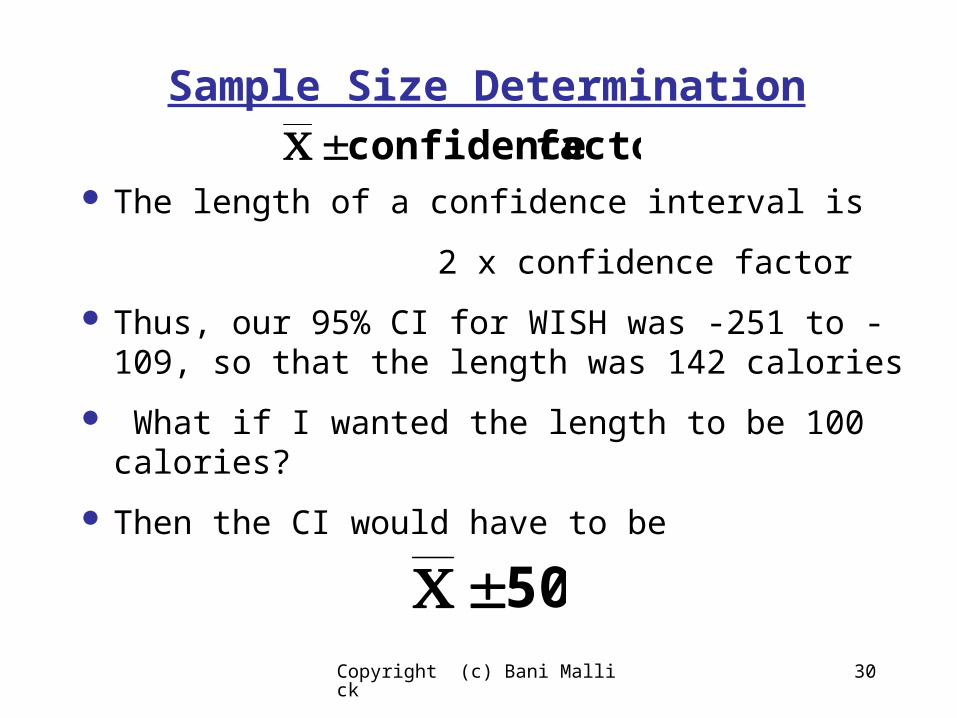
The length of a confidence interval is
2 x confidence factor
Thus, our 95% CI for WISH was -251 to -109, so that the length was 142 calories
What if I wanted the length to be 100 calories?
Then the CI would have to be
factor confidence
50

Copyright (c) Bani Mallick 31
Sample Size Determination
The length of the CI is
If I want the length of a confidence interval to be
2 x E
then I have to set
Now I do some algebra
nz factor confidence 2/
nz2 2/
nz2E2 2/

Copyright (c) Bani Mallick 32
Sample Size Determination
I want the length of a confidence interval to be
2 x E
then the sample size I need is 2
2/ Ezn
Copyright (c) Bani Mallick 33
Sample Size Determination
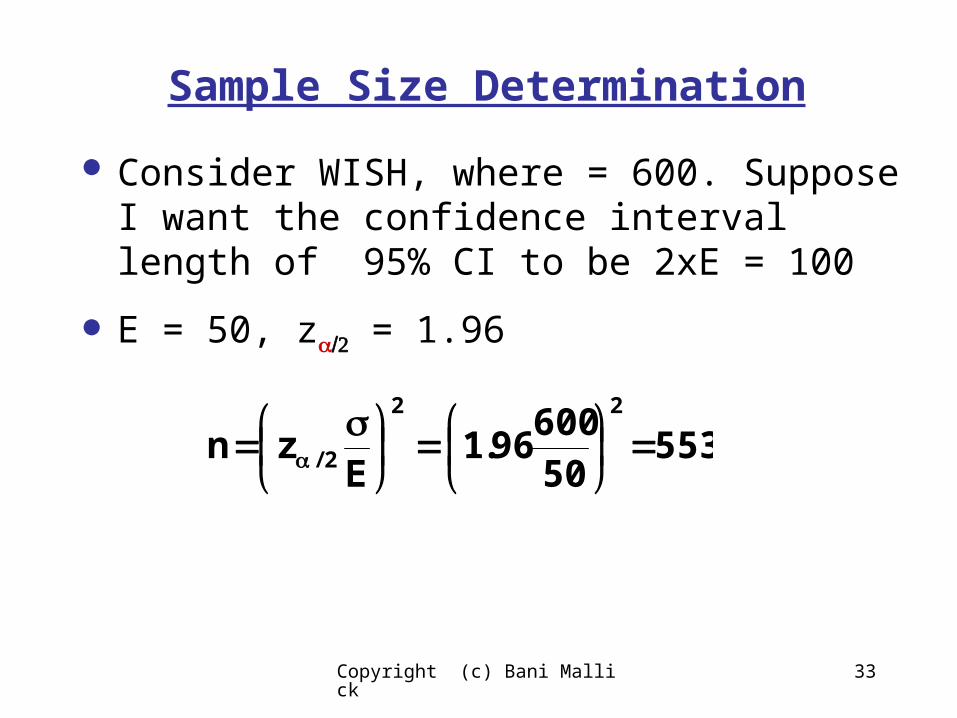
Consider WISH, where = 600. Suppose I want the confidence interval length of 95% CI to be 2xE = 100
E = 50, z = 1.96
55350
60096.1
Ezn
22
2/

Copyright (c) Bani Mallick 34
Sample Size Determination
Consider WISH, where = 600. Suppose I want the confidence interval length of 95% CI to be 2xE = 60
E = 30, z = 1.96
1,53730
60096.1
Ezn
22
2/

Copyright (c) Bani Mallick 35
Sample Size Determination
95% confidence
Length = 100, E = 50, n = 553
Length = 60, E = 30, n = 1,557
General fact: the more precise you want to be (shorter CI), the larger the sample size you will need.

Copyright (c) Bani Mallick 36
Sample Size Determination
General fact: the larger the population standard deviation, the larger the sample size you will need to have a CI of length 2xE
Copyright (c) Bani Mallick 37
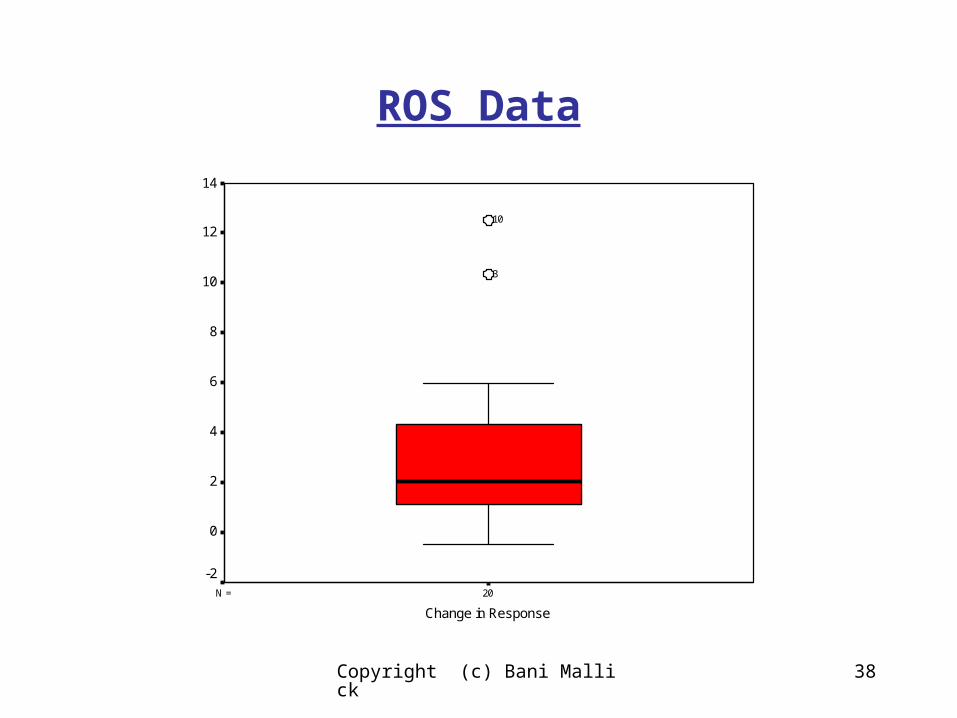
Reactiver Oxygen Species (ROS) Data
Rats fed with Fish oil enhanced diets
Response is the change in ROS for an animal when the cells are exposed to butyrate
Copyright (c) Bani Mallick 38
ROS Data
20N =
Change in Response
14
12
10
8
6
4
2
0
-2
3
10

Copyright (c) Bani Mallick 39
ROS Data Sample mean = 3.21
Sample size is n = 20
Pretend = 3.33
Then = 0.74
95% interval for population mean change is
[3.21 - 0.74 * 1.96, 3.21 + 0.74 * 1.96] = [1.76, 4.66]:
Does butyrate increase ROS? How certain are we?
n

Copyright (c) Bani Mallick 40
ROS Data = 3.33, n = 20
95% interval for population mean change is
[1.76, 4.66]
The length of the CI is 2xE = 2.90
What sample size would I need to make the length of the CI = 1.00? Here 2xE = 1.00, E = 0.50, and 170
50.0
33.396.1
Ezn
22
2/
Related Documents