Copyright by Yang Zhao, 2012

Welcome message from author
This document is posted to help you gain knowledge. Please leave a comment to let me know what you think about it! Share it to your friends and learn new things together.
Transcript

Copyright by Yang Zhao, 2012

HIGH TEMPERATURE AGING STUDY ON LONG-TERM AGED
ALLOY 617 AND ALLOY 230
BY
YANG ZHAO
THESIS
Submitted in partial fulfillment of requirements for the degree of Master of Science in Nuclear, Plasma and Radiological Engineering
in the Graduate College of the University of Illinois at Urbana-Champaign, 2012
Urbana, Illinois
Master’s Committee:
Professor James F. Stubbins, Adviser
Associate Professor Brent J. Heuser
ii
Abstract Alloy 617 and Alloy 230 are lead structural materials for next generation nuclear power
plant (NGNP). Both alloys possess good corrosion resistance and exceptional high-
temperature strength. In order to gain a better understanding of the high-temperature
degradation process of these materials, long-term (up to 10000 hours) aging experiments
have been carried out to investigate the microstructural evolution and mechanical
property development for both alloys.
In the present study, focus is placed on the alloys aged for 10000 hours. Tensile and
hardness tests were conducted. EDS coupled SEM and EBSD techniques were applied to
reveal microstuctural characters of both alloys. Tensile tests were performed at strain rate
of 10-3/s and in temperature range from room temperature to 1000oC. The Portevin-
LeChatelier effect was observed and strain-rate sensitivities were studied. The tensile
tests at room temperature show that both alloys softened significantly after aging at
1000ºC for 10000 hours, and the strength of both alloys was improved when aging at
900ºC. However, both long-term aged alloys, especially Alloy 230, exhibit high strength
at high temperature. Carbide particle (mainly M23C6 and M6C) growth is known to be a
dominant microstructual feature during long-term aging at elevated temperatures. The
evolution of the carbide structure is also the major contributor to dislocation pile-up
enhancement, dynamic recrystallization (DRX) area fraction increase and fracture
mechanisms change, which in turn influence mechanical properties.

iii
Acknowledgements Support and help from many people make it possible for completion of this thesis work.
I would like to express my appreciation to my advisor and department head, Dr. James
F. Stubbins, for his guidance and support throughout the Master’s program. I would like
to thank Dr. Brent J. Heuser for his kindness and patience in reviewing this thesis as the
second reader.
I would like to give my special thank to Dr. Kun Mo at China Nuclear Power
Technology Research Institute for long-term aging experiment and generously sharing his
ideas about microstructual analysis.
I am grateful to Dr. Hsiao-Ming Tung and Dr. Xiang Chen at University of Illinois, for
their contribution and revelatory discussion on specimen preparation and instruments
introduction.
I wish to thank Senior Research Scientist, Gavin Horn, at Mechanical Engineering
Department in University of Illinois, for his kindness assistance on tensile instruments
and maintenance. I would like to thank Center for Microanalsis of Materials in Frederick
Seitz Material Research Laboratory for allowing me to use state-of-the-art scanning
electron microscopy.
I also would like to express my appreciation to my family and my girl friend. Without
their kind help and emotional support, the completion of the thesis work would be
impossible.
The work was supported by US Department of Energy under grants DE-FC07-
07ID14819 and DOE NEUP 09-516. Test materials were provided by Haynes
International, Inc.

iv
Table of Contents Chapter 1 Introduction ..................................................................................1
1.1 Generation IV International Forum (GIF) …………………………… 1
1.2 Very High Temperature Reactor (VHTR) …………………………… 3
1.3 Alloy 617 and Alloy 230 …………………………………………….. 5
1.4 Literature Review ……………………………………………………. 6
Chapter 2 Overview of Mechanical Properties and Microstructure
Characters ……………………………………………………………………... 10 2.1 Microstructure Overview ……………………………………………. 10
2.2 Mechanical Tests …………………………………………………….. 16
2.2.1 Tensile response in the lower temperature region (Room
temperature to 700oC) …………………………………………….. 20
2.2.2 Tensile response in the higher temperature region (800oC
to 1000oC) ………………………………………………………… 25
2.2.3 Strain rate sensitivity analysis ……………………………. …32 Chapter 3 Aging Effect on Alloys ……………………………….... 38
3.1 Overview ……………………………………………………………. 38
3.1.1 Microstructural Characteristics …………………………….. 38
3.1.2 Mechanical Properties ………………………………………. 42
3.2 Microstructure Evolution over Aging Period ………………………... 46
3.2.1 Particle Growth ……………………………………………... 46
3.2.2 Dynamic recrystallization (DRX) …………………………... 53
3.3 Mechanical Properties over Aging Period …………………………... 54
3.4 Discussion …………………………………………………………… 59
Chapter 4 Conclusions …………………………………………….. 72
List of References …………………………………………………………….. 75

1
Chapter 1 – Introduction 1.1 Generation IV International Forum (GIF)
Growing word’s population and increasing striving for better quality of life pose demand
for energy supplies that are clean and highly efficient. Now they are in total over 440
commercial nuclear power plant in 30 countries that contribute 14% of the world’s
electricity, which is 377,000 MWe of total capacity [1]. The importance of reducing
greenhouse gas emission is recognized, which drives the nuclear energy growth around
the world. However, several challenges for future utilize large-scale nuclear energy still
exist: sustainable use of nuclear energy fuel sources, proper nuclear waste disposal, and
reduce the risk of nuclear weapons proliferation [2].
To develop nuclear energy and deal with these challenges, thirteen members (Argentina,
Brazil, Canada, China, Euratom, France, Japan, Korea, Russia, South Africa, Switzerland,
United Kingdom and United States) joined together to form Generation IV International
Forum (GIF) [3]. Six nuclear systems were selected for future Generation IV reactor
concepts: Gas-Cooled Fast Reactor System (GFR), Lead-Cooled Fast Reactor System
(LFR), Molten Salt Reactor (MSR), Sodium-Cooled Fast Reactor System (SFR),
Supercritical-Water-Cooled Reactor System (SCWR) and Very-High-Temperature
Reactor System (VHTR). These six nuclear systems all have significant different features
and technical requirements. The Gas-Cooled Fast Reactor (GFR) system features a fast-
neutron spectrum and closed fuel cycle for uranium and actinides conversion. The
reference GIF reactor is 600-MWth, helium-cooled system with 850oC output

2
temperature. The Lead-Cooled Faster Reactor (LFR) system features a fast-neutron
spectrum and closed fuel cycle. Several options are proposed for LFR design: battery
system of 50-150 MWe, modular type system of 300-400 MWe, and a plant design rated
at 1200 MWe.
Table 1.1 Overview of Generation IV reactor systems [2]
System Neutron
Spectrum
Coolant Temperature
(oC)
Fuel Cycle Output
power level
(MWe)
VHTR Thermal Helium 900-1000* Open 250-300
SFR Fast Sodium 550 Closed 30-150,
300-1500,
1000-2000
SCWR Thermal/Fast Water 510-625 Open/Closed 300-700,
1000-1500
GFR Fast Helium 850 Closed 1200
LFR Fast Lead 480-800 Closed 20-180,
300-1200,
600-1000
MSR Fast/Thermal Fluoride
Salts
700-800 Closed 1000
* Temperature range was changed to 760oC~950oC
Molten Salt Reactor (MSR) system features an epithermal to thermal neutron spectrum
and a closed fuel cycle for utilizing plutonium and minor actinides. Sodium-Cooled
Faster Reactor (SFR) System applies a fast-neutron spectrum and a closed fuel cycle.
Two designs are proposed: intermediate size (150 to 500 MWe) reactor that utilizes
uranium-plutonium-minor-actinide-zirconium metal alloy fuel, and medium to large (500

3
to 1500 MWe) reactor with mixed uranium-plutonium oxide fuel. Supercritical-Water-
Cooled Reactor (SCWR) system applies two different fuel cycles: open cycle coupled
with thermal neutron spectrum and closed cycle with fast neutron spectrum. The
reference SCWR operates above the thermodynamic critical point of water (22.1 MPa,
374oC), which has a 1700-MWe power level, output temperature of 550oC and operating
pressure of 25 MPa, and thermal efficiency approximately 44%.
The Very High Temperature Reactor (VHTR) system uses a thermal neutron spectrum
and a once-through uranium cycle. This system is developed for high temperature
application, especially for highly efficient electricity generation (~90% output power)
and hydrogen production (~10% output power) [4]. A detailed description of the VHTR
will be discussed in the next session. Table 1.1 summarizes the major parameters of
Generation IV systems.
1.2 Very High Temperature Reactor (VHTR)
The Very High Temperature Reactor (VHTR) is an appealing GEN-IV system due to its
potential for very efficient energy generation. Development of this advanced nuclear
reactor concept is under consideration in US and China. The VHTR is a graphite-
moderated, helium-cooled reactor with dual capacities of high-efficiency electricity
production and hydrogen generation. The Very High Temperature Reactor was developed
to produce massive amounts of hydrogen in order to satisfy the demands for alternatives
to fossil fuels because of global warming concerns. The intended output temperature of
helium is up to 950oC [5], which enables the hydrogen production by the thermochemical

4
sulfur-iodine cycle. Fig. 1.1 shows the VHTR design coupled with hydrogen production
plant.
High temperature alloys must be designed and developed to take advantage of benefits of
the VHTR. The operating atmosphere in the reactor system is a great challenge for
structural components, especially the intermediate heat exchanger (IHX). These
components are required to withstand high temperatures, high pressures (up to 7 MPa)
and an aggressive atmosphere for a design life of 60 years [5]. Fig 1.2 shows the
schematic of IHX and configurations parameters of VHTR system.
Fig 1.1 Schematic VHTR Design [2]

5
Fig 1.2 NGNP configuration as proposed by Westinghouse [6]
1.3 Alloy 617 and Alloy 230
INCONEL® Alloy 617 (UNS N06617/W.Nr. 2.4663a) is a solid-solution strengthened,
nickel-chromium-cobalt-molybdenum alloy with an exceptional combination of high-
temperature strength and oxidation resistance [7]. Alloy 617 was chosen as one of the top
priority candidate materials for applications in the temperature range from 760oC to
1,000oC. In 1970’s, a large amount of data on Alloy 617 have been generated for a
variety of applications: gas turbines, chemical manufacture, and power generation
structures. In the mid-1980s, a draft code case was developed for Alloy 617 applications
for the High-Temperature Gas-Cooled Reactor, which covered temperature up to 950oC.
Unfortunately, the code case was dropped due to the termination of the HTGR program.
Since then, more applicable data has been generated in Germany since then. Because the
original VHTR application design required materials that would withstand temperatures
as high as 1000oC and toleration of the working conditions for more than 60 years, Alloy
617 has now regained a great deal of attention [8].

6
HAYNES® 230 Alloy is a solid-solution strengthened nickel-chromium-tungsten alloy,
and displays good elevated temperature strength and environment resistance. HAYNES
230 Alloy can be utilized at temperatures as high as 2100oF (1150oC) for continuous
service [9]. It is a relatively newly developed alloy that is applicable for gas turbine and
heat exchanger application and is also considered to be a candidate material for the IHX
of the VHTR. Compared to Alloy 617, a sufficient amount of experimental data on
material performance for Alloy 230 is not available.
1.4 Literature Review
The Very high Temperature Reactor (VHTR) system is an extension of the previous High
Temperature Gas-Cooled Reactor (HTGR). One of the popular designs of the HTGR
family is Gas-Turbine-Modular Helium Reactor (GT-MHR), which is being developed
by Russia for disposition of weapons-grade Plutonium and initially comes from the U.S.
DOE/General Atomics (GA) concept [10]. Table 1.2 summarized the comparison of the
VHTR and the GT-MHR.
The timeline of Very High Temperature Reactor development originally started from the
late 1970’s. Arbeitsgemeinschaft Versuchsreaktor (AVR) was the first experimental
pebble bed reactor. Based on this design, a commercial reference pebble bed was
developed, the Thorium High-Temperature Reactor (THTR). The only reactor that is still
in operation in High Temperature Gas-Cooled Reactor family is the High-Temperature
Test Reactor (HTTR) in Japan [11]. Table 1.3 shows the design characteristics of VHTRs
that have been built and operated.

7
Table 1.2 Partial design parameters of VHTR and GT-MHR [10]
Conditions and Feature GT-MHR VHTR
Power Output
(MW(t))
600 600
Coolant
Pressure (MPa)
Helium
7.12
Helium
7.12
Moderator Graphite Graphite
Plant Design Life 60 60
Core outlet temperature
(oC)
850 1000*
IHX NA Compact heat exchanger
* Temperature range was changed to 760oC~950oC
Table 1.3 Design parameters of VHTR that have been operated [11]
Dragon AVR Peach
Bottom
Ft. St.
Vrain
THTR-
300
HTTR
Country of
Origin
OECD/Britain Germany U.S. U.S. Germany Japan
Thermal
Power
(MWt)
21.5 46 115 842 750 30
Maximum
Core Outlet
Temp (oC)
750 950 725 775 750 950
Reactor
Type
Sleeve Pebble Sleeve Block Pebble Prism
Date of
Operation
1964-1975 1966 1967 1979-
1989
1985 1997

8
Similar to the GT-MHR, the VHTR has more severe high-temperature environments for
materials. Creep, fatigue, corrosion and aging damage of structural materials are
inevitable. Since the objective of the thesis is the long-term aging research on both alloys,
the literature review will mainly focus on aging effects. Mankins et al. [12] published a
paper on aging effects of Alloy 617 in the temperature range of 649-1093oC with aging
time up to 1000 h. The author evaluated microstructrual properties of Alloy 617 with
creep specimens because of the close approximation of long-term exposure to heat in the
real operation conditions. The study showed that the major precipitates presented in the
alloy were M23C6 after long-term aging. Two other carbide precipitate phases, MC and
M6C, were not identified. The gamma prime phase Ni3Al was found to be stable after
specimen exposure to 760oC, providing some strengthening in the temperature range
from 649 to 760oC. At higher temperatures where gamma prime disolves, discrete M23C6
precipitates strengthening is the major strengthening mechanism. Kimball et al. [13]
extended the aging time to 8000h in the absence of applied stress in the temperature
range from 593 to 816oC. A number of discrete carbide particles M23C6 (rich in Cr and/or
Mo) were found in intragranular region. After 8000 h aging, the distribution of grain
boundary carbides was continuous with increased size. Kirchhofer et al. [14] published a
paper that provided Time-Temperature-Transformation (TTT) diagram for Alloy 617.
The aging temperature ranged from 500oC to 1000oC for times from 0.5 h to 1000 h
producing a total of 70 aging conditions. Another group of materials were obtained after
10,000-30,000 h at 900oC. Bruch et al. [15] examined the tensile properties of several
solution-treated alloys including alloy 617 in the temperature range from 20 to 1000oC.
The research showed the dependence between strength parameters and strain rate at

9
relatively higher temperature (>700oC), and related strain rates to maximum stress by
Norton creep equation.
Alloy 230 is considered as a potential candidate material for the VHTR IHX. However,
available data for aging effect study are limited. Kim et al. [16] studied high temperature
aging effects on Alloy 617 an Alloy 230 in an impure helium atmosphere. Specimens
were aged at 1000oC in the impure helium containing CO, CO2, CH4 and H2O for 500 h.
The authors reported a steep increase in room temperature ductility and extensive carbide
growth was observed below the carbide-free zone. Chatterjee et al. [17] evaluated creep
behavior and microstructual details of Alloy 230. The formation of Ni2 (Cr, W) and
precipitation of Ni3W3C and Cr23C6 influences the mobility of dislocation. They also
noticed that dislocation glide, subgrain formation and recrystallization made the creep
deformation unstable. Gosse et al. [18] measured Chromium activity in Alloy 617, Alloy
230, and model alloys. The authors reported chromium activity in Alloy 230 was higher
than in Alloy 617 and model alloys. The paper also gave new insight in the surface
kinetics of both alloys though HTMS results.
Kun Mo et al. [19] in our research group led the high temperature (900oC and 1000oC)
aging study on Alloy 617 and Alloy 230 up to 3000 h. Fine coherent M23C6 precipitates
nucleated and coalesced on high angle grain boundaries as the aging time expending. One
of the most important features of the long-termed aged alloys is the coarsening of
intrinsic carbides. Further research on long-term aging (10,000 h) effects in Alloy 617
and Alloy 230 will be presented in the thesis.

10
Chapter 2 – Overview of Mechanical Properties
and Microstructure Characters An overview of the mechanical properties and the microstructure of Alloy 617 and Alloy
230 is presented in this chapter. The materials in this study were aged for 10,000 hours at
900oC and 1000oC. This divides these materials in four groups: two materials at two
aging temperatures. The mechanical properties were evaluated by tensile test at 10-3/s
strain rate from room temperature up to 1000oC. Strain-rate sensitivity analysis was
conducted to properly predict the long-term flow stress. Microstructural examination
covers untested and tensile tested specimens to reveal the deformation and fracture
mechanisms. Scanning Electron Microscope (SEM) and Electron Backscatter Diffraction
(EBSD) results were evaluated and analyzed.
2.1 Microstructure Overview
The original Alloy 617 was provided by Haynes international, Inc. in 1 inch plate, which
was hot worked and solution heated at 1177oC for 37 min. (Heat Number: 861758808).
The original Alloy 230 used for aging was also supplied by Haynes international, Inc. in
1.5 inch plate with hot work and solution heat processing at 1191oC for 3 hours (heat
Number: 830587801). Then these materials were aged in VULCANTM 3-350 furnaces at
900oC and 1000oC for 10,000 hours, respectively. The microstructural analysis was
conducted with a 7000F SEM coupled with EBSD applications and Energy Dispersive X-
ray Spectroscopy (EDS). The SEM specimens were polished down to 0.05 micron with
SiC abrasive paper and alumina solutions, and etched for ~3.5 min using a 10 ml HNO3,

11
15ml HCl and 10 ml CH3CO2H mixture solution. The EBSD specimens were polished
down to 0.05 micron and followed with vibratory polishing to 0.02 micron. The chemical
composition of both alloys is shown in Table 2.1
Table 2.1 Chemical Composition (Weight %) [7, 9]
Elements Alloy 617 Alloy 230
Ni 44.5 min 57.0 as balance
Cr 20.0-24.0 20.0-24.0
Co 10.0-15.0 5.0 max
Mo 8.0-10.0 1.0-3.0
Al 0.8-1.5 0.2-0.5
C 0.05-0.15 0.05-0.15
Fe 3.0 max 3.0 max
Mn 1.0 max 0.3-1.0
Si 1.0 max 0.25-0.75
S 0.015 max 0.015 max
Ti 0.6 max 0.1 max
Cu 0.5 max 0.5 max
B 0.006 max 0.015 max
P 0.03 max
La 0.05 max
W 13.0-15.0
Alloy 617 is rich in Chromium, Cobalt, and Molybdenum, and Alloy 230 is rich in
Chromium, Cobalt and Tungsten. These notable elements have some notable effects in
Nickel-based superalloys both in mechanical properties and microstructral features. Table
2.2 summarizes the effect of these elements.

12
Table 2.2 Effects of notable elements in superalloys [20]
Elements Effects on Nickel Based Superalloys
Cr • Improves hot corrosion and oxidation resistance
• M23C6 and M7C3 carbide precipitation
• Moderate solid-solution hardening
• Moderate increase in γ’ volume fraction
• Promotes tcp phases
Mo • High solid-solution hardening
• Moderate increase in γ’ volume fraction
• M6C and MC carbide formation
• Promote tcp phases (σ, μ)
W • High solid-solution hardening
• Moderate increase in γ’ volume fraction
• M6C carbide formation
• Promote tcp phases (σ, μ)
Co • Raises γ solidus temperature
• Moderate increase in γ’ volume fraction (some alloys)
• Raises γ’ solves temperature
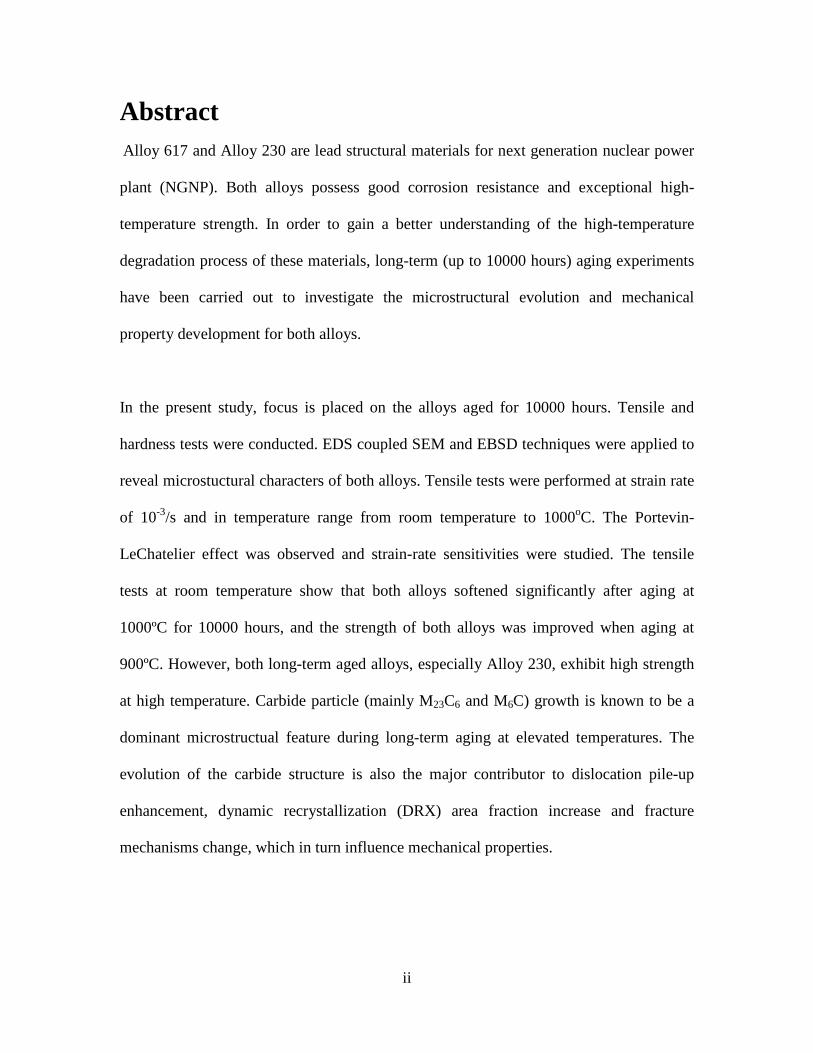
Alloy 617 and Alloy 230 are polycrystalline, as shown in the figures below, grains and
intrinsic particles were observed clearly. The major intrinsic particles in Alloy 617 are Cr
rich M23C6, Mo rich M6C, and Ti(C, N), and those in Alloy 230 are Cr rich M23C6 and W
rich M6C carbides. [21] Fig 2.1 and Fig 2.2 show the microstructures of Alloy 617 and
Alloy 230 at different aging temperatures. Inclusion particles in Alloy 617 are not evenly
distributed compared to Alloy 230, and they agglomerate and form “clouds.” Smaller
grains are located in the inclusion rich area, and larger grains are found in inclusion free
area. This duplex grain size distribution is due to Zener pinning. Zener pinning denotes
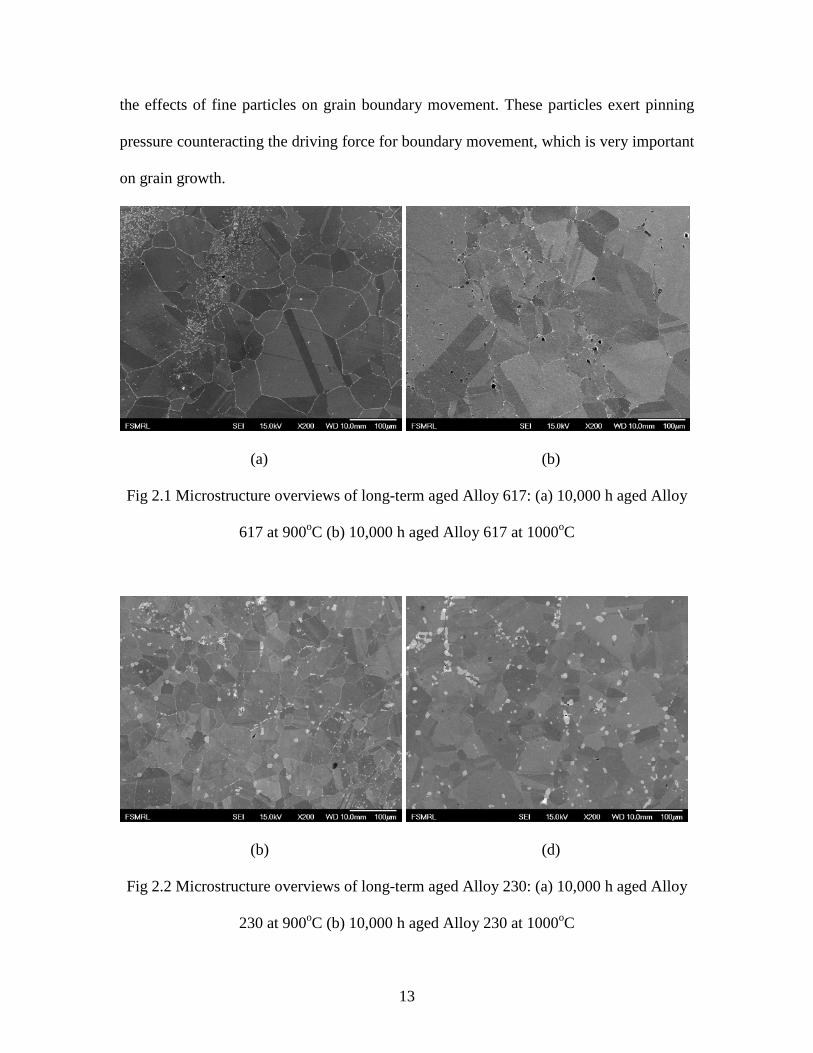
13
the effects of fine particles on grain boundary movement. These particles exert pinning
pressure counteracting the driving force for boundary movement, which is very important
on grain growth.
(a) (b)
Fig 2.1 Microstructure overviews of long-term aged Alloy 617: (a) 10,000 h aged Alloy
617 at 900oC (b) 10,000 h aged Alloy 617 at 1000oC
(b) (d)
Fig 2.2 Microstructure overviews of long-term aged Alloy 230: (a) 10,000 h aged Alloy
230 at 900oC (b) 10,000 h aged Alloy 230 at 1000oC

14
Distributions and geometry of intrinsic particles that are formed at the grain boundaries
vary with different aging temperature. Fig 2.3 and Fig 2.4 show grain particles along the
grain boundaries.
(a) (b)
Fig 2.3 Intergranular particles in Alloy 617: (a) 10,000 h aged Alloy 617 at 900oC (b)
10,000 h aged Alloy 617 at 900oC
(a) (b)
Fig 2.4 Intergranular particles in Alloy 230: (a) 10,000 h aged Alloy 617 at 900oC (b)
10,000 h aged Alloy 617 at 900oC

15
Intergranular particles in the as-received alloys are thin film precipitates. In contrast, the
distributions of intergranular particles for long-term aged alloys are different: at lower
aging temperature (900oC), most of the particles are connected and form band-like
clusters; when the aging temperature is higher (1000oC), the coarsening of intergranular
particles is obvious and spacing is larger. Particles coarsening during the aging periods
will be evaluated and discussed in next chapter.
An overview EBSD analysis is presented in the Fig 2.5 and Fig 2.6. ~58% and ~60% of
the grain boundaries are twin boundaries (Coincidence Site Lattice (CSL) Σ3 grain
boundaries) for 900oC and 1000oC long-term aged Alloy 617, and 54% and 57% of the
grain boundaries are twin boundaries for 900oC and 1000oC long-term aged Alloy 230.
The twin boundary fractions are slightly higher than as-received alloys.
(a) (b)
Fig 2.5 CSL boundary analysis of Alloy 617: (a) 10,000 h aged Alloy 617 at 900oC (b)
10,000 h aged Alloy 617 at 1000oC

16
(a) (b)
Fig 2.6 CSL boundary analysis of Alloy 230: (a) 10,000 h aged Alloy 230 at 900oC (b)
10,000 h aged Alloy 230 at 1000oC
2.2 Mechanical Tests
The tensile test specimen configurations and test results are presented in this section.
These tensile tests were conducted at strain rate ~10-3/s using an INSTRON 131servo-
hydraulic test system equipped with a high temperature furnace at Advanced Materials
Testing and Evaluating Laboratory (AMTEL). The temperature ranges form room
temperature (RT) to 1000oC and was maintained for ~40 min to gain relatively smoothly
distributed temperature zone in the furnace. The maximum overshoot of temperature was
10oC and the variation around temperature set point was less than 2oC.
In order to mimic the real working conditions of these structural materials in an IHX
(requires the thickness of tested materials to be in the range from 0.2 to 2mm) [22], the
size and geometry are chosen with comparable dimensions. Tensile tests of these alloys
using specimens with the same dimensions have been used in previous research [19].

17
This specimen design is also convenient for conducting sufficient tests with limited
amounts of material. These tensile specimens were cut in long-transverse direction in the
rolling plane. (Fig 2.7)
(a)
(b)
Fig 2.7 Tensile specimens: (a) Geometry and dimension (b) Sampling direction
The results of tensile tests are summarized and labeled in Fig 2.8 and Fig 2.9. Both long-
term aged Alloy 617 and Alloy 230 show similar mechanical properties feature changes
at elevated temperature. At room temperature, both alloys have high strength that can
withstand high stresses during tensile loading. The stresses experience a moderate
decrease when the temperature reaches 200oC. A slight change in tensile strength is found

18
in the temperature range of 200oC to 700oC. When temperature is increased up to 800oC,
a significant weakening of strain hardening can be seen, and little if any strain hardening
phenomena are observed from the strain-stress curve at 900oC and 1000oC.
(a)
(b)
Fig 2.8 Strain-stress curves for Alloy 617: (a) 10,000 h aged Alloy 617 at 900oC (b)
10,000 h aged Alloy 617 at 1000oC

19
(a)
(b)
Fig 2.9 Strain-stress curves for Alloy 230: (a) 10,000 h aged Alloy 230 at 900oC (b)
10,000 h aged Alloy 230 at 1000oC
Since there are significant differences between the lower temperature region (< 800oC)
and the higher temperature region (>800oC), the fracture and deformation mechanisms

20
should be evaluate separately. Fig 2.10 presents the yield stress (Y.S.) and ultimate
tensile stress (U.T.S.) at different temperatures for long term-aged Alloy 617 and Alloy
230. A steep decrease of U.T.S. was observed at temperatures greater than 700oC.
Fig 2.10 Yield Stress (Y.S.) and Ultimate Tensile Stress (U.T.S.) of Long-term aged
Alloy 617 and Alloy 230
2.2.1 Tensile response in the lower temperature region (Room
temperature to 700oC)
The fracture mechanisms for tensile tests conducted at temperatures below 800oC were
carefully investigated. Cavities initiate because particles do not deform, and therefore
force the matrix around the particles to deform more than average. This, in turn produces
a higher stress near the particles. When the stress is large enough, the matrix-particle
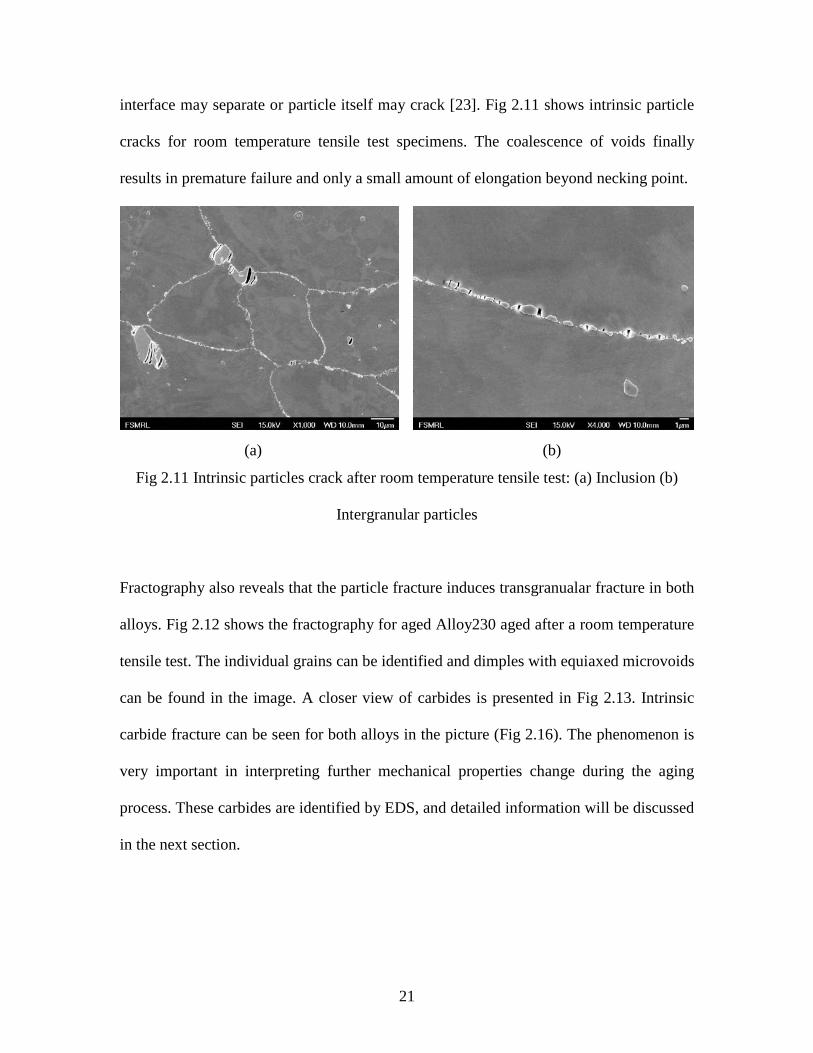
21
interface may separate or particle itself may crack [23]. Fig 2.11 shows intrinsic particle
cracks for room temperature tensile test specimens. The coalescence of voids finally
results in premature failure and only a small amount of elongation beyond necking point.
(a) (b)
Fig 2.11 Intrinsic particles crack after room temperature tensile test: (a) Inclusion (b)
Intergranular particles
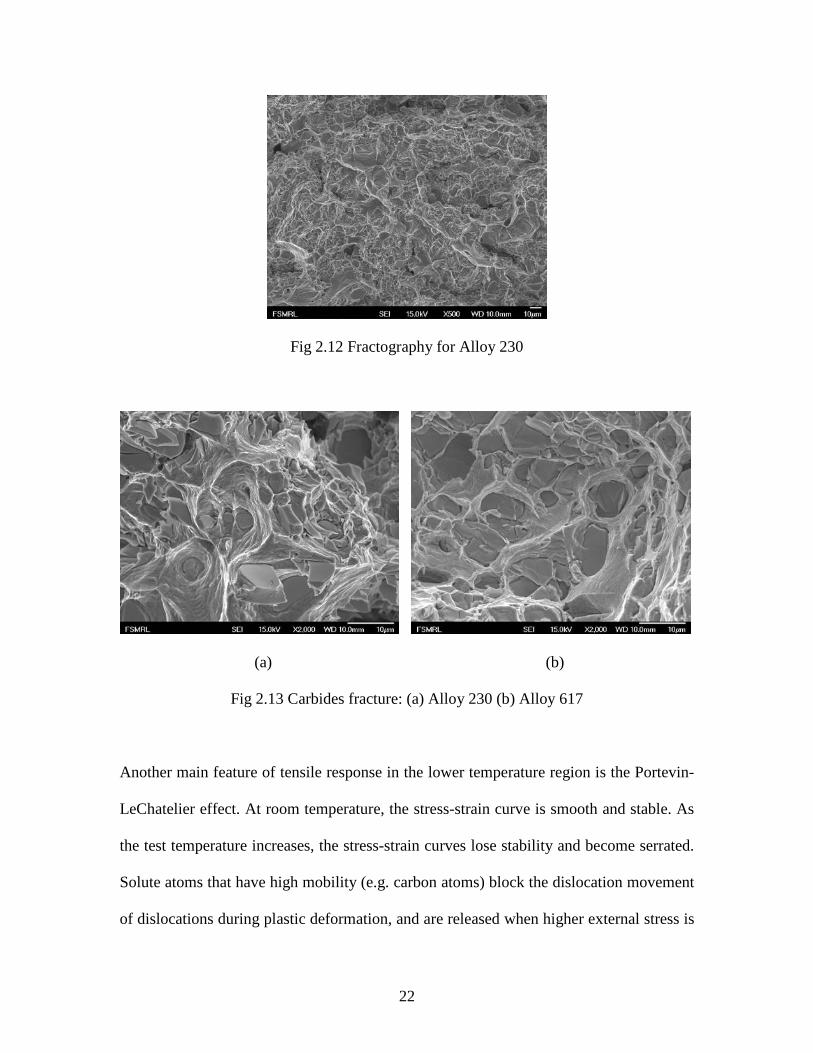
Fractography also reveals that the particle fracture induces transgranualar fracture in both
alloys. Fig 2.12 shows the fractography for aged Alloy230 aged after a room temperature
tensile test. The individual grains can be identified and dimples with equiaxed microvoids
can be found in the image. A closer view of carbides is presented in Fig 2.13. Intrinsic
carbide fracture can be seen for both alloys in the picture (Fig 2.16). The phenomenon is
very important in interpreting further mechanical properties change during the aging
process. These carbides are identified by EDS, and detailed information will be discussed
in the next section.
22
Fig 2.12 Fractography for Alloy 230
(a) (b)
Fig 2.13 Carbides fracture: (a) Alloy 230 (b) Alloy 617
Another main feature of tensile response in the lower temperature region is the Portevin-
LeChatelier effect. At room temperature, the stress-strain curve is smooth and stable. As
the test temperature increases, the stress-strain curves lose stability and become serrated.
Solute atoms that have high mobility (e.g. carbon atoms) block the dislocation movement
of dislocations during plastic deformation, and are released when higher external stress is

23
applied. The “impede and release” process repeats and shows up as the serrated behavior
in the strain-stress curves. Since the process occurs as a function of temperature and
strain rate during external loading, this phenomenon is called dynamic strain aging.
(a)
(b)
Fig 2.14 Portevin-LeChatelier effect: (a) 10,000 h aged Alloy 617 at 900oC (b) 10,000 h
aged Alloy 617 at 1000oC

24
(a)
(b)
Fig 2.15 Portevin-LeChatelier effect: (a) 10,000 h aged Alloy 230 at 900oC (b) 10,000 h
aged Alloy 230 at 1000oC
Fig. 2.14 and Fig. 2.15 show the Portevin-LeChatelier effect on both alloys. The
amplitude of serration is increasing due to the higher atom diffusible ability at elevating
temperature. Table 2.3 shows the amplitude of serration in these curves.

25
Table 2.3 Amplitude of stress oscillations (MPa)
Temperature (oC) 300 400 500 600
Alloy 617 (900oC aged) 14 15 16 18
Alloy 617 (1000oC aged) 11 13 15 16
Alloy 230 (900oC aged) 11 13 16 19
Alloy 230 (1000oC aged) 12 16 17 20
2.2.2 Tensile response in the higher temperature region (800oC to
1000oC)
(a) (b)
Fig 2.16 Fracture Mechanisms at 900oC: (a) Round cavities in grains and cracks at grain
boundaries (b) Cracks at inclusion particles
The analysis in higher temperature region is more complex than the lower temperature
region since additional fracture mechanisms and loss of strain hardening are involved.
For both long-term aged Alloy 617 and Alloy 230, 800oC could be considered as
“equicohesive temperature”, above which dislocation movement will not be impeded by
grain boundaries. [24] At temperature higher or equal to 800oC, the particle pinning

26
mechanism is not efficient in since most of the dislocations with enhanced mobility are
able to bypass the particles by dislocation creep. [25] In addition, the process of dynamic
recrystallization releases stress at intrinsic particles. Fig 2.16 shows cavities in long-term
aged specimens: round cavities are observed in grains and at intergranular particles in
Alloy 617, and cavities concentrated at inclusion particles in Alloy 230.
Dynamic recrystallization (DRX) is another mechanism observed during high
temperature plastic deformation. EBSD analysis was applied to differentiate
recrystallized grains and original grains. DRX is defined as the recrystallizaion that take
place during high-temperature deformation. Two board classes of DRX can be classified
based on whether the process involves nucleation or not. The first one is discontinuous
dynamic recrystallization (DDRX), or simply referred to as “dynamic recrystallization.”
This process involves nucleation and growth of new grains. The second one is the
continuous recreystallizaion (CDRX), which does not involve nucleation and results from
migration of grain boundaries [26]. It is well known that DDRX always happens in low
to medium stacking fault energy materials (e.g. nickel based alloys). In this case,
dynamic recovery is not efficient in recovering local stress concentrations so that high
local gradients of dislocation density drive large grain boundary immigration. In contrast
to DDRX, high stacking fault energy materials always undergoes the CDRX process.
Since the dynamic recovery is efficient, the driving force to produce large dislocation
density gradients is weak. In this case, then the dislocations tend to form subgrain
boundaries (misorientation angle <15o), and some of the dislocation wall continuously

27
transformed to high angle boundaries (misorientation angle >15o) [27]. The main features
of CDRX and DDRX are summarized in Table 2.4
Table 2.4 Main Features of CDRX and DDRX [28]
CDRX DDRX
Generation Occurs by transformation of sub grain
or low-angle boundaries into grain or
high-angle boundaries
Occurs by local cycles involving
strain hardening, then nucleate
and form new grains
Dynamic
recovery
Strong (dislocation rearrangement or
annihilation)
Weak
Dislocation Homogeneous Inhomogeneous
Grain
boundary
Rate of migration is low Rate of migration is high
Temperature dramatically influences the activation of DRX and subsequent grain growth.
Higher temperatures will enhance thermal fluctuation that results in a higher probability
of successful activation. Grain growth occurs by migration of grain boundaries, and the
diffusion rate is enhanced with elevated temperature. Fig 2.17 and Fig 2.18 show
representative the EBSD images at different temperatures and DRX grain area fractions
over a scanned area for 1000oC long term aged Alloy 617 (near fracture surface),
respectively.

28
(a)
(b)
Fig 2.17 EBSD image of 1000oC long term aged Alloy 617 at different study
temperatures: (a) 800oC (b) 900oC (c) 1000oC

29
(c)
Fig 2.17 (cont.)
Fig 2.18 DRX area fraction of 1000oC long term aged Alloy 617 at different study
temperatures
DRX initiates at grain boundaries where high densities of dislocations are available. The
deformed or original grains are decorated with small recrystallized grains in a necklace-

30
like distribution at 800oC. As the hold time or temperature increases, the small
recrystallized grains grow and consume the original large grains through a process of
grain boundary migration. Since the newly generated recrystallized grains are randomly
oriented, the texture of deformed specimens will change. The texture analysis was
performed using EBSD techniques. Fig 2.19 shows the chamber configuration. It should
be noted that the direction marked “RD” should be transverse direction since the tensile
axis is parallel to the “rolling direction” marked in the holder.
Pole figures show a statistic summary of the grain orientation in a specific area, and it
reflects the texture change due to the DRX. Fig 2.20 shows the pole figures of the 1000oC
long-term aged Alloy 617 after corresponding tensile loading. For the 800oC tensile test,
the recrystallized area is limited to regions along the grain boundaries which only
contribute about ~6.5% area fraction. The duplex texture of the tested specimen is
<111>+<001>. When the temperature is higher, the material will lose the as-rolled
texture and exhibit a more homogeneous orientation distribution. Similar phenomena are
also found in Alloy 230.
Fig 2.19 Chamber configuration

31
(a)
(b)
(c)
Fig 2.20 Pole figures for 1000oC long term aged alloy 617 after tensile tests at (a) 800oC
(b) 900oC (c) 1000oC

32
2.2.3 Strain rate sensitivity analysis
Strain rate has a significant influence on the value of the flow stress measured in tensile
tests. For most metallic materials, the magnitude of flow stress is proportional to the
strain rate. The strain rate dependent flow stress phenomenon is also affected by
temperature. In other words, flow stress is more sensitive to strain rate at higher
temperature in most cases. A parameter that describes and evaluates the strain rate effects
is the strain rate sensitivity. Alloys 617 and 230 are proposed for use as structural
materials that work at high temperature, so knowledge of the strain rate sensitivity is
essential.
The strain rate sensitivity is evaluated by the parameter m , which is related to strain rate,
ε , in the following way.
( )mt Cσ ε= (3-1)
The strain rate is defined as /td dtε ε= in the unit of s-1, where tε is true strain. The
engineering strain-engineering stress curve if found directly from the tensile test results,
the relationship between true strain ( tε )-true stress ( tσ ) and engineering strain ( eε )-
engineering stress ( eσ ) and be described as:
(1 )t e eσ σ ε= + (3-2)
ln(1 )t eε ε= + (3-3)
/(1 ) 1
e et
e e
d dtε εεε ε
= =+ +
(3-4)
Based on Eq. (3-1), the strain rate sensitivity, m , can be determined by:

33
m
a a
b b
σ εσ ε
=
(3-5)
Where aσ and bσ are the measured flow stresses during tensile testing at true strain rate
aε and bε , respectively. Then m can be obtained by:
log
log
a
b
a
b
m
σσεε
=
(3-6)
In the previous study conducted by Kun Mo [25], the strain rate sensitivity was obtained
from a single strain rate tensile test with different strain rate. The true strain rate is
approximated by:
/1 1
e et e
e e
d dtε εε εε ε
= = ≈+ +
(3-7)
The relationship is valid when the corresponding engineering strain is small. Then tε can
be replaced by eε when the value is taken from the value of the stress at 0.2% yield point
( 0.002eε = ), as was done in that study. A better method to get the value of m is
developed in this study. It is based on a triple strain rate tensile test technique. During the
test, the strain rate jump is completed in a very short time so that at the jump point, the
local strain is taken as constant. Then we can replace the true strain rates in Eq. (3-6) by
engineering strain rate, which is very convenient to setup and measure in the tensile test
system.
Sufficient data were obtained to get strain rate sensitivity by conducting triple strain rates
tensile tests at 0.001s-1, 0.005s-1 and 0.01s-1. Fig 2.21 shows the stress-strain diagrams for

34
long-term aged Alloy 617 and Alloy 230 at 900oC and 1000oC. Three “steps” were
observed in the diagram due to the sudden strain rate jump at a specific point. The value
of m is determined by measuring the slope of log( )ε - log( )σ curves. Fig 2.21 shows that
plastic flow reaches steady state at a constant flow stress in each strain rate region.
(a) (b)
(c) (d)
Fig 2.21 Triple strain rate tensile test results: (a) 10,000 h aged Alloy 617 at 900oC (b)
10,000 h aged Alloy 617 at 1000oC (c) 10,000 h aged Alloy 230 at 900oC (d) 10,000 h
aged Alloy 230 at 1000oC

35
(a) (b)
(c) (d)
Fig 2.22 Linear fits of the triple strain rate tensile test results: (a) 10,000 h aged Alloy
617 at 900oC (b) 10,000 h aged Alloy 617 at 1000oC (c) 10,000 h aged Alloy 230 at
900oC (d) 10,000 h aged Alloy 230 at 1000oC
At high temperature, dislocations mobility is typically high so that they are able to climb
over particles at sufficiently large applied stresses. This can result in a stable plastic flow
stress. Fig 2.22 presents the linear fit results of slope and the strain rate sensitivities
which are also summarized in Table 2.5. The values of the strain rate sensitivity of long-
term aged Alloy 617 are closed to those of long-term aged Alloy 230. A high strain rate

36
sensitivity value means that a small decrease in the strain rate will lead to a large
reduction in strength which is the case for both alloys.
Table 2.5 Summary of strain rate sensitivity analysis
Material 900oC 1000oC
10,000 h aged Alloy 617 at 900oC 0.20 0.20
10,000 h aged Alloy 617 at 1000oC 0.19 0.23
10,000 h aged Alloy 230 at 900oC 0.21 0.20
10,000 h aged Alloy 230 at 1000oC 0.21 0.23
The strain rate sensitivity was found to be approximately constant value for wide range of
strain rates. Therefore it is possible to predict the long-term loading response from short-
term material properties based on strain-rate sensitivity. The strain rate for one year
operation of VHTR is ~ 10 13 10 s− −× , and decreases to ~ 11 13 10 s− −× , and ~ 12 15 10 s− −× for
60 years operation [25]. The estimated constant flow stress and ASME allowable stress
for Alloy 617 is summarized in Table 2.6. The strain rate sensitivity data is retrieved
from Idaho National Laboratory report [6]. It shows that at the 900oC operating
temperature, the strength for Alloy 617 for a one year operation period Alloy 617 is still
within the ASME allowable stresses. However, after a longer operation period, the alloy
is not able to withstand the allowable stress that it will rupture within the service life. The
flow stress for 1000oC operation for Alloy 617 is still within the allowable stress region.
Table 2.6 Estimated flow stress and ASME allowable stress for as-received Alloy 617
Temperature (oC) 1 Year
(MPa)
10 Years
(MPa)
60 Years
(MPa)
ASME allowable
stress (MPa) [25]
900 (m=0.17) 13.7 9.3 6.8 ~12.3
1000 (m=0.18) 14.6 9.6 7.0 ~4.8

37
Table 2.7 Estimated flow stress for 10,000 h aged Alloy 617 and Alloy 230
Temperature (oC) 1 Year
(MPa)
10 Years
(Mpa)
60 Years
(MPa)
ASME allowable
stress (MPa) [25]
Alloy 230-900
(m=0.20)
13.7 8.6 6.0 ~12.3
Alloy 617-1000
(m=0.23)
14.6 8.1 5.3 ~4.8
Alloy 230-900
(m=0.21)
10.4 6.4 4.4 ~10.2
Alloy 230-1000
(m=0.23)
1.3 0.8 0.51 ~2.6
After long-term aging, the strain rate sensitivities show a moderate increase. Table 2.7
summarized the estimated flow stresses for 10,000 h aged Alloy 617 and Alloy 230. The
conditions are much more severe for long-term aged materials, especially for Alloy 230.
The results suggest that the current ASME allowable stress for both alloys is not
applicable for long term and high temperature design.

38
Chapter 3 – Aging Effect on Alloys 3.1 Overview
Aging studies can provide essential information to predict material behavior for
applications at high temperature, and long operation periods. During the aging process,
microstructural evolution (e.g. grain growth, precipitates coarsening) will dramatically
affect the materials’ properties. For nickel-based superalloys, the major feature of
microstructural evolution during long-term aging is the precipitation and coarsening
process of secondary phases. Since both alloys are candidate materials for IHX and
related practical data are not sufficient for engineering application, long-term aging
experiments at 900oC and 1000oC were conducted (up to 10,000 h) to evaluate their
mechanical and microstructure properties.
3.1.1 Microstructural Characteristics
High temperature aging of metallic materials often causes microstructural evolution,
which is mainly characterized by phase transformation, precipitate development, and
crystallite growth [25]. Phase transformation will fundamentally change the material
properties, which can be evaluated by phase diagram.
The nucleation and growth of second particles is the dominant microstructural feature in
the thermal aging process. Solution treatment is required in initial alloying processing,
and the alloy only contains a single phase. There are insufficient levels of distribution of
the heterogeneous elements (e.g. Cr) at low temperature for major second phase

39
development. At higher temperature, significant thermal diffusivity of solute leads to
second phase particle precipitation at grain boundaries or within grains. This happens
over a wide range of temperatures. After the alloy is aged at high temperature, the
supersaturated elements begin to diffuse and form clusters. Fine second phase particles
nucleate within the grains and at respective grain boundaries. At the same time, the larger
particles grow at expense of smaller particles. When the equilibrium condition is
achieved, the nucleation process is completed. This process is named as Oswald ripening.
The growth of the larger second phase particles at the expense of the smaller ones
reduces the total amount of interfacial area between phases in order to decrease the total
free energy. This is the driving force of Oswald ripening or carbides coarsening. During
heat treatments, four types of particles were found in Alloy 617 and Alloy 230 in
previous studies: M6C, M23C6, Ti (N, C) and 'γ (Ni3Al) [19, 29].
M6C carbides have a complex cubic structures (fcc) and form in a temperature region of
815oC to 980oC. The lattice parameter of M6C carbides is 1.085-1.175 nm. They tend to
be rich in refractory elements (e.g. Fe, Mo, Co, W) depending on material composition.
The formation of M6C carbides requires high Mo or W content in nickel based
superalloys (6 to 8 atomic percent). The M6C carbides in Alloy 617 are rich in Mo and
those in Alloy 230 are rich in W. M23C6 carbides are formed in the lower temperature
regime of 760oC to 980oC compared to M6C carbides with moderate to high Cr content.
The lattice parameter of M23C6 carbides is 1.150-1.070 nm. The phase also displays a
complex cubic structure (fcc) [20]. M23C6 carbides are found to be rich in Cr, the rest of

40
the composition of M can be made up of different metallic atoms (e.g. Ni, Fe, Mn, Mo,
W). [25]
M6C and M23C6 are the major particles found in the present study. Both types of carbides
can impede grain boundary sliding (Zener pining) and increase the rupture strength of
materials. On the other hand, they have negative effects on material performance that
initiate premature failures by particle decohesion or particle fracture. These particles can
withstand temperature up to 1000oC. Related research results on Alloy 617 are presented
in Fig 3.1 and Fig 3.2. Transformation and reaction also exist between M6C and M23C6
according to the following chemical equation:
'6 23 6''
M
MM C M C→← (3-1)
Where M’ and M’’ are substitute elements. For Alloy 617, M’ is Cr, and M’’ is Mo. [25]
Since M6C and M23C6 are formed during heat treatment and have good thermal stability
at high temperature, research on their behavior during long-term aging is essential for
IHX applications.
'γ (Ni3Al) precipitate is an important strengthening phase in nickel based superalloys. It
is the third most common feature of the aged materials. Its yield strength increases with
temperature up to 800oC [20]. Similarly, the small amount of Ti (N, C) also has an
negligible effects on mechanical properties. Ti (N, C) can be detected in Alloy 617, and it
is hardly ever found in Alloy 230 due to even lower fraction of Ti. However, both Alloys
617 and 230 are solid solution strengthening alloys (not employing 'γ strengthening),

41
and only very small amounts of 'γ were reported in aging studies of Alloy 617 [5]. Also
'γ has never been found in both alloys at temperature higher than 900oC.
Fig 3.1 Content of Precipitates in Alloy 617calculated by THERMOCALC® (1.24% Al)
[29]
(a) (b)
Fig 3.2 TTT diagram for Alloy 617 (a) constructed based on previous results (b)
modification made by Wu et al. [30]

42
3.1.2 Mechanical Properties
Microstructure development during aging will change the mechanical properties of both
alloys. It is important to know that the ability of a metal to plastic deform depends on the
mobility of dislocations, and greater mechanical forces are required to continue plastic
deformation due to the strengthening methods that impede dislocation motion. Five
fundamental strengthening mechanisms contribute to overall strength of alloys: grain
boundary hardening τHP (“HP” denotes Hall-Petch relationship), strain hardening τsh,
dislocation cutting τcut, dislocation looping τloop, and solution hardening τsss. The overall
strength τtot of alloys can be described by equation as [25]
0tot HP sh sss loop cutτ τ τ τ τ τ τ= + + + + + (3-2)
Where τ0 denotes intrinsic strength of material
The grain size (or average grain diameter) in polycrystalline materials has a great effect
on mechanical properties. Since two adjacent grains have two different orientations and
atomic disorder exists within grain boundaries, the dislocation that passes though the
grains have to change directions and overcome the resistance from discontinuous slip
planes. Therefore, grain boundary strengthening comes from the barrier effect to the
movement of glide dislocations. From the work of Petch and Hall, the yield strength of a
polycrystalline material can be given by
1/2ys i yk dσ σ −= + (3-3)
Where, σys = yield strength
σi = overall resistance of lattice to dislocation movement

43
ky = “locking parameter” that measures relative hardening contribution of grain
boundaries
d = grain size
Even though much following research indicates that grain boundary-induced dislocation
pileups may not be directly related to yield strength described above, a model that
consider the grain boundaries as dislocation source by Li [31] still has a similar form:
i Gbσ σ α ρ= + (3-4)
Where, σ = yield strength
σi =overall resistance of lattice to dislocation movement, α constant
G= shear modulus, b the Burgers vector, and ρ the average dislocation density.
Note that ρ is inversely proportional to grain size, equations (3-4) and (3-3) are
equivalent.
Stain hardening (also known as work hardening or cold working) describes an increase in
the number of dislocation-dislocation interaction which reduces dislocation mobility, and
sufficient stress has to be applied to continue deform process. Research on strain
hardening behavior of single crystals showed three distinct regions in the shear stress
strain curve: Stage I (easy glide region), Stage II (linear hardening region), and Stage III
(parabolic region) which closely resembles strain stress response of polycrystal form
material [32]. Stacking fault energy is important to the onset of Stage III. Stage III would
occur sooner with higher stacking fault energy since cross-slip would be activated at a
lower stress. Therefore, a low stacking fault energy material requires a larger stress to

44
combine partial dislocations and cross-slip. The effects of strain hardening may be
removed by annealing heat treatment.
Solid solution strengthening is a strengthening mechanism where adding atoms of
different elements to base material lattice increases the dislocation flow stress. The
reason alloys are stronger than pure metals is that impurity atoms in the solid solution
impose lattice strains on the surrounding host atoms. Substitutional solid solution and
interstitial solid solution are the two major types of solid solution strengthening. The
solid solution elements can generate symmetrical or asymmetrical stress fields: when the
stress field is symmetrical, the solute atom interacts with edge dislocation; Otherwise in
the asymmetrical stress field instance, the solute atom interacts strongly with both edge
and screw dislocations. The magnitude of strengthening caused by asymmetrical stress
field is much greater. The strengthening contribution to yield strength can be given by:
3/2 1/2
700G cετ = (3-5)
Where, τ = stress required for dislocation cutting though
ε= the misfit strain (proportional to difference in lattice parameter of the two
phases)
c= the solute concentration (expressed as atomic fraction)
For nickel based alloys, the solid solution often generates symmetrical stress fields [33].
Solid-solution hardening also indirectly decreases the stacking fault energy in the crystal
lattice, which enhance the inhibition of dislocation cross slip. [20]
45
Second phase particles start to nucleate and grow when the solute concentration exceeds
the solubility limits. The precipitation of particles in the matrix increases the difficulty of
dislocation movement. Two typical strengthening mechanisms are based on dislocation-
particle interaction: dislocation cutting and dislocation looping. Some small and highly
coherent particles are deformable and dislocation can cut though them under sufficiently
high stress. The dislocation cutting mechanism is related to elastic interaction between
them:
3/2 1/2( / )CG fr bτ ε= (3-6)
Where, τ = stress required for dislocation cutting though
ε= the misfit strain
r = the particle radius
f = the volume fraction of second phase precipitates
G =the shear modulus, and b the Burgers vector.
If the misfit strain (or average particle separation) is large above a critical value, the
dislocation cutting mechanism is not applicable, and dislocations will loop around
individual particles instead. It requires a larger stress to keep the movement and this
dislocation particle interaction is also referred as Orowan looping. The stress that
necessary for dislocation looping can be described by:
2Gb
L rτ =
− (3-7)
Where, τ = stress required for dislocation cutting though
G = the shear modulus
b = the Burgers vector
L = the distance between pinning points

46
r = the particle radius
Fig 3.3 Aging effect summary [32]
The combined effect of these complex strengthening mechanisms is responsible for
mechanical property changes during the material aging process. In the early stages of the
aging process, the precipitation of second phase particles weakens the solid solution
strengthening, but it is compensated by enhanced precipitation impeding dislocation
movement. This results in an increasing in hardening with time. With further aging,
interparticle spacing becomes wider and particle sizes increases, and often the dislocation
interactions change from particle cutting to looping. Therefore the alloy strength is
weaken with further aging time. The overall aging effect is summarized in the Fig 3.3.
3.2 Microstructure Evolution over Aging Period
3.2.1 Particle Growth
The dominant feature of long-term aged material microstructures is the precipitation,
growth and diffusion of second phase particles. Most of the fine precipitates that are
found within matrix in the as-received material diffuse and precipitate in the grain

47
boundaries. Both alloys experienced similar change of carbides: after 900oC aging, the
intergranular particles in the bright band-like shape, and coarsening at the expense of fine
precipitates within the grain matrix; after 1000oC aging, the intergranular precipitates
coalesce to form the bigger dark particles. The coarsening mechanism is revealed by EDS
analysis. Fig 3.4 and Fig 3.5 show the EDS spectra of intrinsic particles in Alloys 617
and 230 respectively. Previous research indicates that Cr-rich carbides are M23C6 (dark),
Mo-rich and W-rich carbides are M6C (bright). [25, 30]
(a) (b)
Fig 3.4 SEM spectra recorded from (a) Cr-rich carbides (M23C6) in Alloy 617 (b) Mo-rich
carbides (M6C) in Alloy 617
(a) (b)
Fig 3.5 SEM spectra recorded from (a) Cr-rich carbides (M23C6) in Alloy 230 (b) W-rich
carbides (M6C) in Alloy 230
48
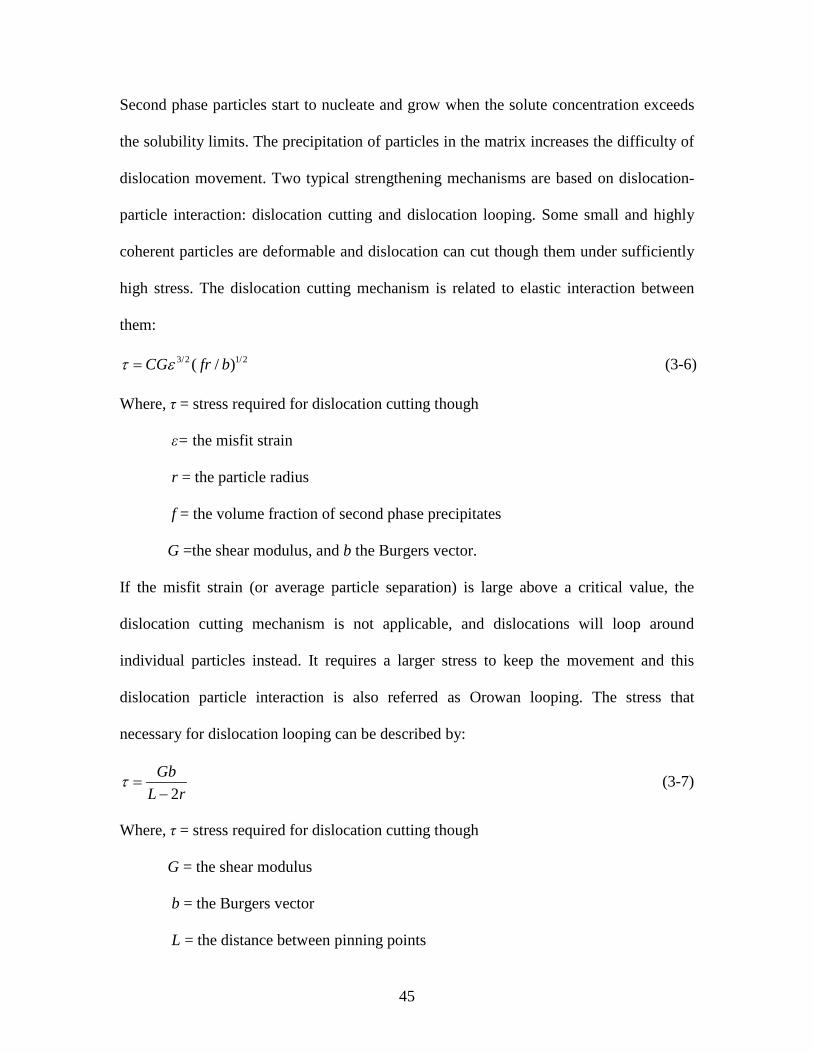
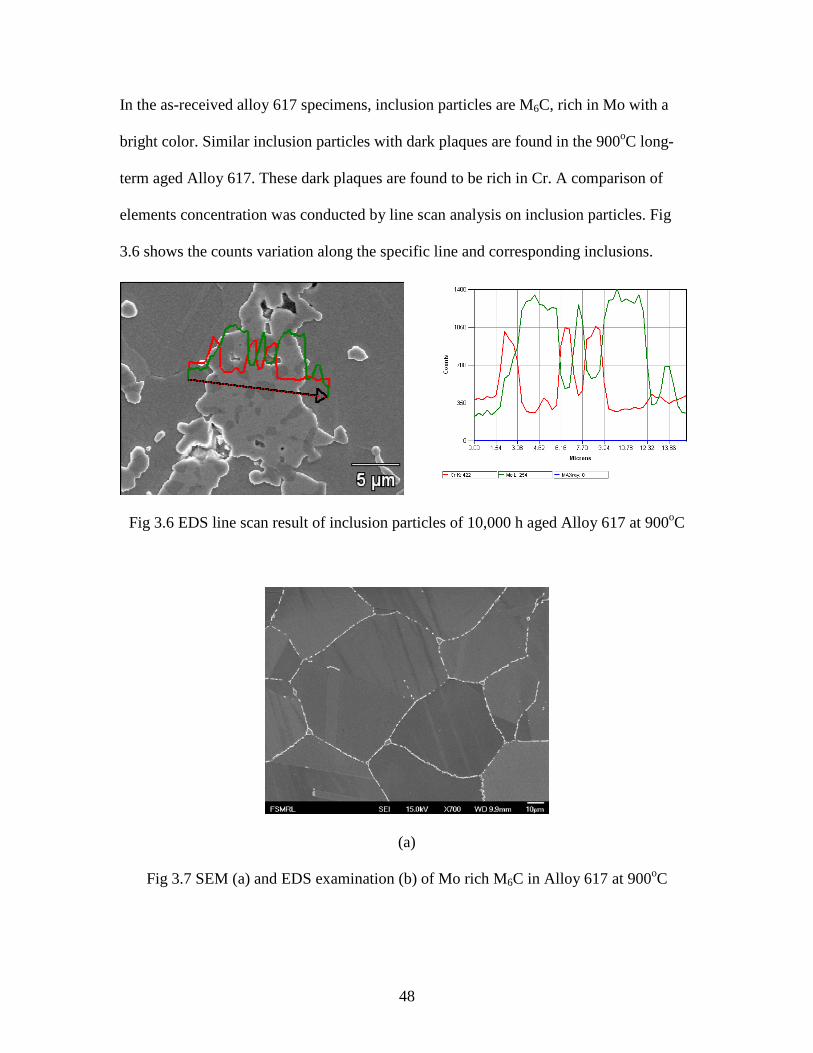
In the as-received alloy 617 specimens, inclusion particles are M6C, rich in Mo with a
bright color. Similar inclusion particles with dark plaques are found in the 900oC long-
term aged Alloy 617. These dark plaques are found to be rich in Cr. A comparison of
elements concentration was conducted by line scan analysis on inclusion particles. Fig
3.6 shows the counts variation along the specific line and corresponding inclusions.
Fig 3.6 EDS line scan result of inclusion particles of 10,000 h aged Alloy 617 at 900oC
(a)
Fig 3.7 SEM (a) and EDS examination (b) of Mo rich M6C in Alloy 617 at 900oC

49
(b)
Fig 3.7 (cont.)
Compared to dark plaques, the bright parts of inclusions have higher intensities in Mo
and lower in Cr. Similar examination was conducted on inclusion particles in 1000oC
aged Alloy 617. Bright Mo rich particles were seldom observed in the specimens. The big
inclusion particles are rich in Cr. Since M6C has a higher thermal stability than M23C6 at
temperature up to 1000oC and Mo/W intensities are high in EDS spectra, phase
transformation is unlikely to take place during high temperature aging. The explanation
of this phenomenon is that M23C6 carbides diffuse and mixed with M6C carbides. Due to
the higher diffusion coefficient and weight percents, the formation of M23C6 carbides
with high Cr concentration is preferable. Compared to W, Mo still has some diffusive
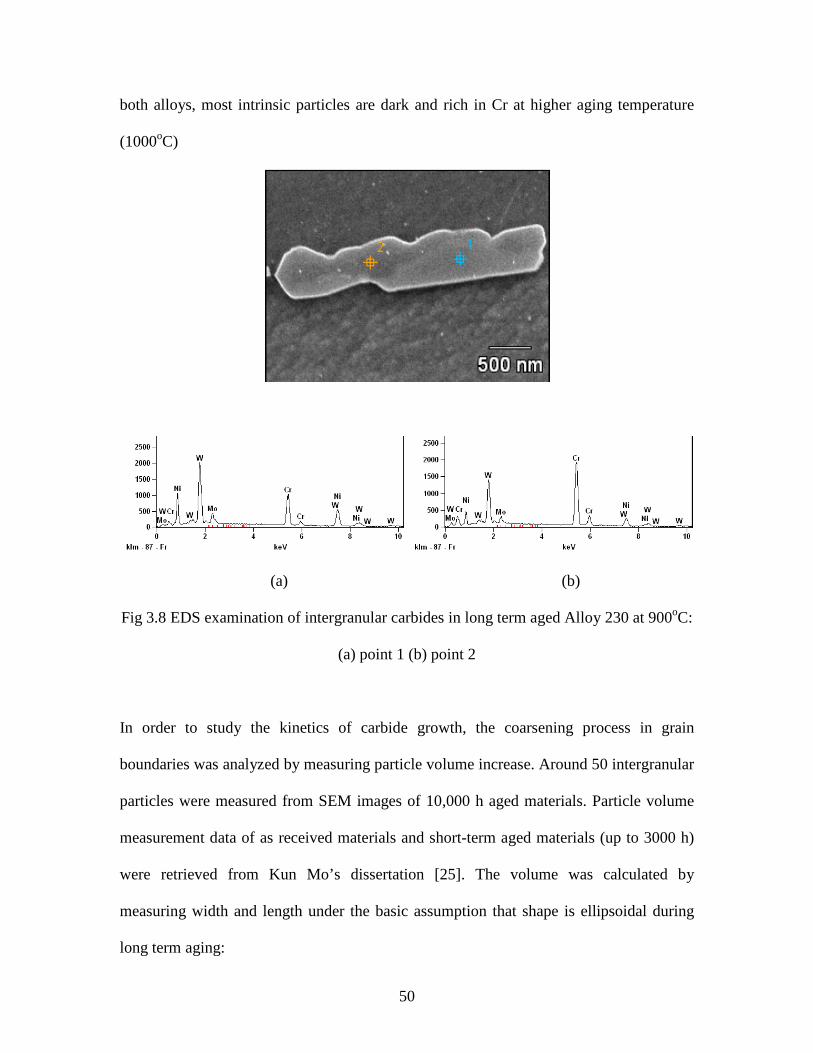
ability and Mo rich M6C coarsening was observed in triple junction point in long term
aged Alloy 617 at 900oC. Fig 3.7 shows the EDS spectra and SEM examination of Mo
rich M6C carbides in corresponding Alloys. Similar coarsening phenomena were
observed in some W rich M6C carbides at grain boundaries, and most of carbides are
partial Cr rich and partial W rich for long term aged Alloy 230 at 900oC (Fig 3.8). For
50
both alloys, most intrinsic particles are dark and rich in Cr at higher aging temperature
(1000oC)
(a) (b)
Fig 3.8 EDS examination of intergranular carbides in long term aged Alloy 230 at 900oC:
(a) point 1 (b) point 2
In order to study the kinetics of carbide growth, the coarsening process in grain
boundaries was analyzed by measuring particle volume increase. Around 50 intergranular
particles were measured from SEM images of 10,000 h aged materials. Particle volume
measurement data of as received materials and short-term aged materials (up to 3000 h)
were retrieved from Kun Mo’s dissertation [25]. The volume was calculated by
measuring width and length under the basic assumption that shape is ellipsoidal during
long term aging:

51
24( )3
V t r h= (3-8)
Where, V = volume of second phase particles
r = radius of ellipsoid particles
h = height of ellipsoid particles
Fig 3.9 shows the measurement of carbides width and length.
(a) (b)
Fig 3.9 Intergranular Dimension of both alloys: (a) Length (b) Width
Then the volume development for the particle can be fitted by Avrami equation [25]:
1 exp( )nY Kt= − − (3-9)
Where, Y = the particle volume fraction, t denotes time, K and n are fitting constant. Y
can be expressed as:

52
( )
mat
V tYV
= (3-10)
Where, Vmat is the volume of matured second phase particles. The intergranular particles
were assumed fully developed after aging for 10,000 hours and little additional volume
will be obtained at longer aging time. Therefore, it is reasonable assume V (10,000 h) to
be equal to Vmat. Fig 3.10 presents fit curves for time dependent intergranular particle
volume growth for Alloy 230.
Fig 3.10 Fitting curve and measured data for particle volume in Alloy 230 at 1000oC
Table 3.1 Interpretation of values of n
n Mechanism [34]
900oC aged Alloy 617 0.65 Thickening of large plates
(n≈0.5)
1000oC aged Alloy 617 2.06 All shapes growing from small dimensions,
decreasing nucleation rate
(1.5<n<2.5)
900oC aged Alloy 230 1.59
1000oC aged Alloy 230 1.99
Table 3.1 summarizes the possible mechanism of particle development of both alloys at
different aging conditions. The “Thickening of large plates” means a dominant

53
coarsening process, and “All shapes growing from small dimensions, decreasing
nucleation rate” indicates a mixed process of particle coarsening and nucleation [34].
3.2.2 Dynamic Recrystallizaion (DRX)
For materials with difference aging hours, the DRX area at specific study temperature is
different. Fig 3.11 shows the EBSD results of Alloy 617 of different materials after
900oC tensile test. Longer aging times will result in a higher percentage of DRX area
fraction. The DRX in as received alloys can hardly be observed while it is significant in
long-term aged specimens. It is also clear that the DRX fractions of 1000oC aged alloys
are higher than that of 900oC aged alloys.
(a)
Fig 3.11 EBSD results of aged Alloy 617 after 900oC tensile test: (a) as received Alloy
617 (b) 900oC aged at 3000 h (c) 1000oC aged at 3000 h (d) 900oC aged at 10,000 h (e)
1000oC aged at 10,000 h

54
(b) (c)
(d) (e)
Fig 3.11 (cont.)
3.3 MECHANICAL PROPERTIES OVER AGING PERIOD
Tensile and hardness tests were conducted for both 10,000 hour aged alloys. The results
were summarized along with the data of as-received condition to 3000 hour aging
condition by Kun Mo [25] to investigate mechanical properties development as a fuction
of the aging time. The tensile tests were performed at a strain rate 10-3/s same

55
experimental settings given in Chapter 2. The hardness tests were measured using a
Wilson® Rockwell® Model 523 hardness tester.
The hardness tests were conducted in all plane directions in order to reflect the overall
properties. Then the reported hardness was calculated by averaging the measurement
results. The results are presented in Fig 3.12. Both alloys experienced similar trends
during aging: the hardness peaks (~94 HRB) were achieved at 10 hours, and then the
hardness decreases moderately with aging time. At 900oC, Alloy 230 maintains a longer
hardening plateau with only a slight decrease over the aging time. In contrast to 1000oC
aging condition, the hardness of both alloys at 900oC aging has a significant increase at
10,000 hours aging time.
(a) (b)
Fig 3.12 Hardness over aging time: (a) Alloy 617 (b) Alloy 230
Tensile test results over the same aging times are shown in Fig 3.13 and Fig 3.14 for the
strength (Y.S.) and ultimate tensile strength (U.T.S.) for Alloy 617 and Alloy 230,
respectively. The results, especially the trends in the ultimate tensile strength, agree well
with the hardness test results: the materials experienced a short term strengthening and a

56
long term softening. For the 10,000 hours aged Alloys 617 and 230 at 900oC, the ultimate
tensile strength shows a moderate increase. At 900oC, both alloys have higher yield
strengths and ultimate tensile strengths for a longer hardening time than those aged at
1000oC, but as aging time increases, the two converge to similar values.
(a) (b)
Fig 3.13 Tensile Properties for Alloy 617: (a) Y.S. (b) U.T.S.
(a) (b)
Fig 3.14 Tensile Properties for Alloy 230: (a) Y.S. (b) U.T.S.

57
(a) (b)
Fig 3.15 Tensile Properties comparison for Alloy 617
(a) (b)
Fig 3.16 Tensile Properties comparison for Alloy 230
In addition to mechanical properties at room temperature, it is also important to
investigate the aging effect on tensile properties at high temperatures, especially in the
region of 800oC to 1000oC for IHX application. Fig 3.15 and Fig 3.16 show the
comparison of as-received and 10,000 hours aged Alloy 617 and Alloy 230. The yield
stress and tensile stress are found to be higher than as-received materials in some regions,

58
and softening regions are also observed. The Y.S. and U.T.S. changes after 10,000 hours
aging can be quantified by:
. .( , 0) . .( , 10,000 ). .. .( , 0)change
Y S T t Y S T t hY SY S T t
= − ==
= (3-11)
. . .( , 0) . . .( , 10,000 ). . .. . .( , 0)change
U T S T t U T S T t hU T SU T S T t= − =
==
(3-12)
Where, T is tensile test corresponding temperature, t is the aging time.
The calculation results were summarized in Table 3.2 and Table 3.3 for Alloy 617 and
Alloy 230, respectively. The negative values indicate a hardening effect, and the positive
values mean a softening effect. Compared to as-received specimens, 900oC aged Alloy
617 shows moderate increase in U.T.S, and both 900oC and 1000oC aged Alloy 230
exhibit significant hardening effects at high temperature regions (900oC and 1000oC).
Table 3.2 Tensile properties comparison (%) of Alloy 617
Temperature
(oC)
Alloy 617
aged at 900oC
(Y.S. change)
Alloy 617 aged
at 1000oC
(Y.S. change)
Alloy 617 aged
at 900oC
(U.T.S. change)
Alloy 617 aged
at 1000oC
(U.T.S. change)
RT 11.4 17.8 2.8 6.8
200 21.1 26.6 -0.2 2.7
300 4.2 14.8 -0.2 4.3
400 13.4 25.5 -3.0 0.7
500 17.3 31.0 -4.2 3.2
600 9.7 19.4 -5.5 -0.1
700 3.3 15.2 -7.3 0.2
800 21.4 29.4 -8.0 -7.4
900 0.2 -7.6 -12.1 -9.0
1000 0.8 13.1 -2.4 7.8

59
Table 3.3 Tensile properties comparison (%) of Alloy 230
Temperature
(oC)
Alloy 230
aged at 900oC
(Y.S. change)
Alloy 230 aged
at 1000oC
(Y.S. change)
Alloy 230 aged
at 900oC
(U.T.S. change)
Alloy 230 aged
at 1000oC
(U.T.S. change)
RT -7.7 -5.0 -1.6 1.5
200 8.0 9.0 2.1 -0.1
300 11.2 14.9 10.5 3.3
400 1.8 2.5 1.2 2.0
500 10.1 15.9 -1.3 3.1
600 13.9 17.7 0.5 -0.1
700 4.6 15.8 -7.8 -3.6
800 5.6 11.3 -9.4 -7.2
900 -17.7 -17.5 -20.3 -18.3
1000 -31.8 -25.1 -40.7 -31.1
3.4 Discussion
The mechanical properties and microstructual characteristics of long term aged Alloy 617
and Alloy 230 were investigated in the previous section. Compared to theoretical analysis
of material strength change during aging time (Fig 3.3), two peaks were observed in
hardness verses aging time diagrams for 900oC aged alloys (Fig 3.13(b) and Fig 3.14 (b)).
Similar phenomena were also found in U.T.S. diagram. As introduced in Section 3.1.2,
the strengthening development involves five strengthening mechanisms: grain boundary
strengthening, precipitates strengthening (includes particle cutting and particle looping),
strain hardening, and solid solution strengthening. According to the microstructure
analysis, the grain size and dislocation density do not change significantly during the
aging period, then the grain boundary strengthening and strain hardening parts can be

60
dropped from the strengthening equation. Therefore, the overall strength can be further
analyzed based on the solid solution strengthening and precipitates strengthening.
Kun Mo’s dissertation reveals the mechanism that generates the fist strength peak during
the aging period [25]. During the early stages of aging, both Alloy 617 and Alloy 230
precipitate a large number of fine second phase particles within the matrix, which leads to
major precipitate strengthening. However, the precipitation process is accomplished at
the expense of other solute elements in the matrix, and it result in a loss of solid solution
strengthening. Since precipitate strengthening is more efficient and effective than solid
solution strengthening, the former is sufficient to compensate the latter. This short term
aging strengthening phenomenon can be observed in the hardness and tensile results.
However, with the extended aging times, the volume of intergranular particle continues
increase at the expense of the fine matrix precipitates. The spatial space (L) between
particles decreases and diminishes the precipitate strengthening (see Eq. 3-7). This
process leads to an overall strength decrease and the hardness and tensile results show a
long term softening. It is notable that the short-term hardening was not significant for
both alloys aged at 1000oC. Since higher diffusion rates of the solute elements is active at
1000oC, the age hardening process is completed quickly, which can be hardly seen in the
diagram. For Alloy 230, a longer age hardening period was observed. It results from
slower precipitate growth in Alloy 230 compared to Alloy 617. The process is controlled
by solute element W which has a lower diffusivity compared to Mo in Alloy 617.

61
During the age-softening period, another peak was observed for both alloys aged at
900oC. A similar phenomenon was found in Nb-contaning microalloyed steel during
aging at 525oC where the second peak resulted from further precipitation of α phase [35].
After carefully examination, no further fine second phase particle nucleation was found
in either Alloy 617 or Alloy 230, and theoretically the further precipitation is not likely
according to other studies as indicated in Fig 3.2. The previous section shows that the
fracture of both alloys at room temperature tensile tests is triggered by intrinsic particle
cracking. The grain boundary particles can have an important influence on mechanical
properties. The formation of carbide cracks is believed to be associated with slip to
twinning location pile-ups [36]. The voids formed by this process join up by coalescence
and result in failure. Similar phenomena were also observed in mild steel by Brindley
[37], who claimed that the initiation of ductile facture was intitiated by cracking of grain
boundary carbides and inclusions. The EDS spectra and corresponding SEM images (Fig
3.17 and Fig 3.18) show the grain boundary particle and inclusion particle crack in the
fracture surface.
(a)
Fig 3.17 EDS spectra of carbides in fracture surface for Alloy 230 aged at 1000oC:
(a) Inclusion particle (b) Intergranular particle

62
(b)
Fig 3.17 (cont.)
Fig 3.18 EDS spectra of intergranular carbides (point 1 and point 2) in fracture surface
for Alloy 617 aged at 1000oC
The strengthening mechanisms result from the effect of impeding dislocation movement.
The intergranular particles can be treated as barriers to dislocation. However, the size and
shape of these particles have important influence on the dislocation pile-up effect. The
effect of small particles to hinder dislocation movement is limited. Fig 3.19 shows the
grain boundary particle cracks in Alloy 230 aged at 900oC for 3000 h and 10,000 h,
respectively. For 900oC aged Alloy 230, the intergranular particles are relatively small
and no cracks can be observed at 3000 h. At 10,000 h, these particles experience
coarsening process that small particles coalescence into bigger ones. The bigger particles
are elongated along the grain boundaries, and therefore become more efficient barrier for

63
dislocation movement. More dislocations will be pile-up against these particles so that
higher back stress is required for further plastic flow. Second phase particles in matrix are
almost disappear so that solid solution strengthening and precipitate strengthening
(dislocation looping) are weak. The “strengthening” effect of intergranular particles is
sufficient to cover the loss of them. This explains why hardness and U.T.S. are higher at
10,000 h than that at 3000 h.
(a)
Fig 3.19 Grain boundary particles crack: (a) 3000 h aged Alloy 230 at 900oC (b) 10,000 h
aged Alloy 230 at 900oC

64
(b)
Fig 3.19 (cont.)
(a)
Fig 3.20 Grain boundary particles crack: (a) 3000 h aged Alloy 230 at 1000oC (b) 10,000
h aged Alloy 230 at 1000oC

65
(b)
Fig 3.20 (cont.)
A more comprehensive strength change can be observed in the 1000oC aged Alloy 230
from 1000 h to 10,000 h. Fig 3.20 shows grain boundary particles crack for 1000oC at
3000 h and 10,000 h respectively. In this stage (3000 h~10,000 h), grain boundary
precipitate coarsening process depletes small particles on the grain boundary rather than
those in matrix, since most of fine precipitates were almost completely consumed. Big
inclusions also coarsen during long term aging at expense of grain boundary carbides and
exhibit higher Cr peak in the EDS spectra (Fig 3.8). Therefore, the volumes of individual
intergranular carbide increase, and the carbide spacings are larger with decreasing amunts
of carbides. Therefore, the number of effective barrier carbides decreased. This leads to a
strength decrease of the alloys at 10,000 h when compared to 3000 h. The second
hardness peak was observed in the 900oC aged and 1000oC aged Alloy 230 and 900oC

66
aged Alloy 617, but not in 1000oC aged Alloy 617. This may be result from different
particle development mechanisms in Alloy 617 (see Table 3.1)
Another change that takes place during long term aging is the change in area fraction of
DRX. The change is summarized in Table 3.3 for Alloy 617 at 900oC tensile tests. Since
a critical dislocation density is essential for the initiation of DRX, the local high
dislocation density can be achieved by large deformation (e.g. tensile tests). The
preferred site for DRX nucleation is high dislocation density area (e.g. grain boundaries
and inclusion rich areas) in both alloys. Tian et al. [37] studied DRX in hot deformed
Nimonic 80a alloys. Small coherent carbides within the grains significantly modified the
distribution of dislocations during hot deformation by dislocation-particle interaction, and
therefore influenced the DRX process. In long-term aged Alloys 617 and 230, since the
number and volume of inclusion particles will not change during aging process, the
redistribution and coarsening of carbides are responsible for those changes in both alloys.
The as-received Alloy 617 is mainly hardened by precipitation strengthening. These
small precipitates act as obstacles to dislocation movement, which makes the distribution
of dislocations more homogeneous. This reduces the possibility of local high dislocation
densities. Compared to long term aged specimens, the DRX process in as-received
specimens is not significant. In contrast, during the period of high temperature aging, the
fine precipitates in matrix are dissolved and diffuse to the grain boundaries. Dislocations
move easily to grain boundaries in absence of those obstacles. Besides, the intergranular
particles also form effective barriers to dislocation pile-ups as DRX nucleation sites. For
these reasons, DRX in long-term aged specimens is active whereas it is not observed in

67
starting materials. It is clear from the table that 10,000 h aged specimens contain the
largest DRX area fraction. The DRX area factions in Alloy 230 with different aging times
but at the same temperature have only slight different (19% for 900oC and 20.3% for
1000oC) due to the appearance of large inclusion, which makes the contribution from
grain boundary particles relatively small.
Table 3.4 Area fraction of dynamic recrystallization of Alloy617 at 900oC tensile test
Aging temperature As received (%) 3000 h aged (%) 10,000 aged (%)
900oC 0.782 22.5 55.9
1000oC 0.782 24.7 35.9
The DRX process has an important effect on mechanical properties. The fracture
initiation mechanisms during hot working are summarized in Gandhi’s work [38]. The
three strain rate dependent mechanisms are ductile cavity initiation, wedge crack
initiation and creep cavity initiation. When an alloy is deformed at high strain rates, the
ductility is low and the fracture results from cavity initiation around hard second phase
particles. The mechanism is called ductile cavity initiation. At medium strain rates, grain
boundary sliding takes place. If the sliding displacement is not accommodated, wedge
type cracks can initiate at grain triple points. When the strain rate is much lower strain
rates, the wedge crack mechanism is replaced by creep cavitation. In this case, round
cavities are initiated on grain boundaries normal to the maximum principle stress
direction.

68
Ductile cavity initiation is usually observed in low temperature tensile specimens. At
elevated temperatures, the local stress around hard particles can be relaxed by diffusion
and power law creep processes. A critical strain rate is required since lower strain rate
does not generate sufficient stress concentration to compensate relaxation effects. The
critical strain rate dε is given by:
32
2118(1 )(1 2 )
5( )6
bd
f DGkT p
υυ υ δπε
υ
− − + Ω=
− (3-13)
Where, G = Shear modulus
v= Poisson’s ratio
D = the boundary diffusion coefficient
δ = boundary thickness
fv= volume fraction of inclusions or hard particles
p= the particle size
k = the Boltzmann constant
T = Temperature
Hot working maps provide useful information on fracture mechanisms change for
specimens at different aging time. Fig 3.21 shows a “safe hot working zone” for pure
nickel [38]. The arrows in the figure show the boundary movement during hot working.
The driving force of the boundaries movement comes from DRX. The ductile cavity
initiation boundary moves upward because of the relaxation of stress concentration
around these second phase particles. The wedge crack initiation boundary movement
results from grain refinement by DRX. The region between these boundaries is the
adiabatic heating and oxidation region. The main fracture mechanism in this region is

69
found to be round cavity formation within grains. The rapid DRX process will prevent
the cavities from growing and linking with each other.
Fig 3.21 Safe hot working zone for nickel [38]
The fracture mechanism change in Alloy 617 and Alloy 230 can be interpreted in a
similar way. Fig 3.22 shows the fracture mechanisms for as-received and 10,000 h aged
Alloy 617 at 1000oC. It is clear that the crack mechanism in as-received Alloy 617 is
wedge-type cracks in triple-point junctions. In contrast, the fracture initiation in 10,000 h
aged Alloy 617 shows round cavities within grains and at grain boundary particles. For
long term aged Alloy 617, the DRX process is active, and thus the area representing
wedge crack initiation in hot work map will shrink. The fracture mechanism will move
into the adiabatic heating region. DRX also suppresses fracture initiation by isolating the
voids, and therefore preventing cracks from growing and linking to each other. Cracks in
Alloy 230 are shown in Fig 3.21. The average particle size of Alloy 230 is much larger

70
than Alloy 617 due to the appearance of big inclusions. According to Eq. 3-12, the
critical strain rate dε is inversely proportional to the cube of particle size p. Therefore,
the critical strain rate dε is lower and fracture mechanism is close to the ductile cavity
initiation region.
(a)
(b)
Fig 3.22 Fracture mechanisms of Alloy617 at 900oC: (a) as-received (b) 10,000 h aged

71
Fig 3.23 Cracks in Alloy 230 at 900oC
Since fracture initiation of both alloys resulted from grain boundary sliding, the
coarsening of intergranular particle contributes to tensile properties strengthening at high
temperature. These particles can slow down sliding rates and bigger particles are found to
be more efficient than small particles with same volume fraction [39]. Higher stresses are
required to keep constant strain rate. Therefore, the combined effect of void isolation by
DRX and intergranular particle pinning are very likely to contribute to tensile properties
improvement at high temperature.

72
Chapter 4 – Conclusions
Material research is essential for the development of the Very High Temperature Reactor
(VHTR). Long term operation (~60 years) at high temperature (760~950oC) poses a great
challenge for the candidate materials Alloy 617 and Alloy 230. Long term aging studies
on these materials are critical for the design and operation of the VHTR. The research
work presented in this thesis mainly evaluates mechanical properties and microstructural
features of long-term aged (10,000 h) Alloy 617 and Alloy 230 at two different aging
temperatures (900oC and 1000oC). Tensile tests and hardness tests were conducted, and
the tested specimens were further analyzed by EDS coupled SEM and EBSD techniques.
The experimental results and microstructure characterization lead to the following
conclusions:
1. Microstructure Overview:
a) 10,000 h aged Alloy 617/Alloy 230 at 900oC: significant intergranular carbides
coarsening was observed. Intergranular carbides are elongated along grain
boundaries with small distance between each other. Most intergranular carbides
were Cr-rich, and Cr-rich dark plaques were also observed in Mo-rich (Alloy
617) / W-rich (Alloy 230) inclusions. No phase changes are expected and these
plaques result from Cr-rich carbide precipitation.
b) 10,000 h aged Alloy 617/Alloy 230 at 1000oC: significant intergranular carbides
coarsening were observed. The sizes and space between them are larger than for
the 900oC aged specimens. Most interguanular and inclusion carbides were Cr-
rich, which indicates higher Cr diffusion and precipitate rate at this temperature.

73
2. Mechanical Properties: For 10,000 h aged specimens, little changes in strain rate
sensitivities and Portevin-LeChatelier effects were observed compared to as-received
materials. For 900oC, aged Alloy 617 and Alloy 230, the hardness and tensile
properties are higher than those of 3000h aged alloys at room temperature. In contrast,
1000oC aged specimens for 10,000 h show worse properties than 3000 h aged
specimens. At high temperature, both alloys (especially Alloy 230) exhibit better
tensile properties than as-received specimens.
3. Aging effect on mechanical properties:
a) Room temperature: the mechanical properties changes are related to grain and
intergranular particle sizes and distributions. From SEM images of tested
specimens, the fracture initiation mechanism is second phase particle cracking.
For 10,000 h aged alloys at 900oC, the band-like shape and small intervals make
intergranular particles more effective barriers for dislocation movement than
those of 3000 h aged alloy; In contrast, the spacing increase in intergranular
carbides in the 10,000 h aged alloys at 1000oC results in a decrease of numbers
of efficient barriers, which is insufficient to compensate for the precipitate
strengthening loss. Therefore, the measured mechanical properties deteriorated.
b) High temperature (900oC~1000oC): Fine precipitates in matrix act as obstacles to
dislocation movement that result in a more homogeneous dislocation distribution.
After 10,000 h aging, most precipitates in the matrix have dissolved. This
increases the possibility of high local dislocation densities which, in turn,

74
enhances the dynamic recrystallization (DRX) process. The large area fraction of
DRX suppresses fracture initiation by isolating voids and preventing crack
growing. This process and large intergranular particles prevent wedge crack
initiation and also impedes grain sliding. Due to the presence of many large
inclusions in Alloy 230, the critical stain rate for ductile cavity initiation is lower
than for Alloy 617 and that these particles still can effectively hinder dislocation
movement at high temperature. Intergranular particles coarsening also will
effectively slow down the grain boundary sliding rate. Cavity isolation by DRX
and particle blocking grain boundary sliding are likely reasons for mechanical
properties improvement at higher temperature for long term aged alloys.

75
List of References [1] Nuclear Power in the World Today, http://www.world-nuclear.org/info/inf01.html, [referred March. 2012] [2] GEN IV International Forum, GIF R&D Outlook for Generation IV Nuclear Energy Systems, August 21, 2009 [3] Preparing Today for Tomorrow’s Energy Needs, http://www.gen-4.org/, [referred March. 2012] [4] U.S. DOE Nuclear Energy Research Advisory Committee and Generation IV international Forum, “A Technology Roadmap for Generation IV Nuclear Energy Systems,” December, 2009 [5] W. Ren, R. Swindeman, “A Review on Current Statues of Alloy 617 and Alloy 230 for Gen IV Nuclear Reactor Internals and Heat Exchangers,” Journal of Pressure Vessel Technology, Transactions of ASME, vol. 131, no. 4, pp. 0440021-04400215, 1998 [6] J. K. Wright, R. N. Wright (INL), T.-L. Sham (ORNL) “Next Generation Nuclear Plant Steam Generator and Intermediate Heat Exchanger Materials Research and Development Plan,” Idaho National Laboratory Plan, Project No. 23747, Document ID PLN-2804, 2010 [7] Special Metals Corporation, Inc. “INCONEL alloy 617,” Publication No. SMC-029, 2005 [8] Ren W., Swindeman R. W., “Development of A Controlled Material Specification for Alloy 617 for Nuclear Applications,” Oak Ridge national Laboratory, 2005 [9] HAYNES International, Inc. “HAYNES 230 Alloy,” Publication No. H-3060D, 2009 [10] G. Baccaglini, S. Ball, T. Burchell, B. Corwin, T. Fewell, M. LaBar, P. MacDonald, P. Rittenhouse, E. Shaber, F. Southworth, R. Vollman, “Very High Temperature Reactor (VHTR), Survey of Materials Research and Development Needs to Support Early Deployment,” Generation IV nuclear energy systems, INEEL/EXT-03-00141, 2003 [11] Wright N. R., “Summary of Studies of Aging and Environmental Effects on Inconel 617 and Haynes 230,” Idaho National Laboratory, INL/EXT-06-11750, 2006 [12] W. L. Markins, W. J. Hosier, “Microstructure and Phase Stability of INCONEL Alloy 617,” Metall. Trans., vol. 5, pp. 2579-2590, 1974 [13] G. F. Kimball, G. Y. Lai, G. H. Reynolds, “Effects of Thermal Aging on Microstructural and Mechanical Properties of a Commercial Ni-Cr-Co-Mo Alloy (Inconel 617),” Metall. Trans. A, vol. 7A, pp. 1951-1952, 1976

76
[14] H. Kirchhofer, F. Schubert, H. Nickel, “Precipitation Behavior of Ni-Cr-22Fe-18Mo (HASTELLOY X) and Ni-Cr-2Co-12Mo (INCONEL 617) after Isothermal Aging,” Nuclear Technology. vol. 66, pp. 139-148, 1984 [15] U. Bruch, D. Schumacher, P. Ennis, E. Heesen, “Tensile and Impact Properties of Candidate Alloys for High-Temperature Gas-Cooled Reactor Applications,” Nuclear Technology. vol. 66, pp. 357-362, 1984 [16] D. Kim, I. Sah, D. Kim, W. S. Ryu, C. Jang, “High Temperature Oxidation Behavior of Alloy 617 and Haynes 230 in Impurity-Controlled Helium Environments,” Oxidation of Metals. vol. 75, no. 1-2, pp. 103-119, 2011 [17] S. Chatterjee, A. K. Roy, “Mechanism of Creep Deformation of Alloy 230 Based on Microstructral Analysis,” Materials Science and Engineering A. vol. 527, no. 29-30, pp. 7893-7900, 2010 [18] S. Gosse, T. Alpettaz, S. Chatain, C. Gueneau, “Chromium Activity Measurements in Nickel Based Alloys for Very High Temperature Reactors: Inconel 617, Haynes 230, and Model Alloys,” Journal of Engineering for Gas Turbines and Power. vol. 131, no. 6, 2009 [19] K. Mo, G. Lovicu, H. Tung, X. Chen, J. F. Stubbins, “High Temperature Aging and Corrosion Study on Alloy 617 and Alloy 230,” Journal of Engineering of Gas Turbines and Power. vol. 133, no. 5, 2011 [20] B. Geddes, H. Leon, X. Huang, (2010). Superalloys: Alloying and Performance. Materials Park, Ohio: ASM International. [21] W. L. Mankins, J. C. Hosier, T. H. Bassford, “Microstructure and Phase Stability of INCONLE 617,” Metallurgical Transactions. vol. 5, pp. 2579-2590, 2009 [22] W. R. Corwin, T. D. Burchell, C. E. Duty, Y. Katoh, J. W. Klett, T. E. McGreevy, R. K. Nanstad, W. Ren, P. L. Rittenhouse, L. L. Snead, R. W. Swindeman, D. F. Wilson, “Next Generation Nuclear Plant Materials Research and Development Program Plan,” (Revision 3), INL/EXT-06-11701, 2006 [23] R. Raj, “Development of Processing Map for Use in Warm-Forming and Hot-forming Process,” Metallurgical Transactions A, vol. 12A, pp. 1089-1097, 1981 [24] G. E. Dieter, (1988). Mechanical Metallurgy (3rd ed.), Columbus, Ohio: McGraw-Hill. [25] K. Mo, Microstructural Evolution and Mechanical Behavior In Nickel Based Alloys for Very high Temperature Reactor. Dissertation, University of Illinois at Urbana-Champaign, 2011

77
[26] M. S. A. Karunaratne, R.C. Reed, “Interdiffusion of the platinum-group metals in nickel at elevated temperatures,” Acta Materialia, vol. 51, pp. 2905-2919, 2003 [27] F. Montheillet, J. -P. Thomas, “Dynamic Recrystallization of Low Stacking Fault Energy Metals,” Metallic Materials with High Structural Efficiency, pp. 357-368, 2004 [28] F. Montheillet, “Moving Grain Boundaries during Hot Deformation of Metals: Dynamic Recrystallization,” Moving Interfaces in Crystalline Solids, pp. 203-256, 2004 [29] W. Ren, R. W. Swindeman, “A Review Paper on Aging Effects in Alloy 617 for Gen IV Nuclear Reactor Application,” Journal of Pressure Vessel Technology, vol. 131, 2009 [30] Q. Wu, H. Song, R. W. Swindman, J. P. Shingledecker, V. K. Vasudevan, “Microstructure of Long-Term Aged IN617 Ni-Base Superalloy,” Metallurgical and Materials Transactions A, vol. 39A, pp. 2569-2585, 2008 [31] J. C. M. Li, “Petch Relation and Grain Boundary Sources,” Transactions of the Metallurgical Society of AIME, vol. 227, pp. 239-247, 1963 [32] R. W. Hertzberg, (1996). Deformation and Fracture Mechanics of Engineerign Materials (4th ed.), Hoboken, New Jersey: John Wiley & Sons [33] M. A. Meyer, K. K. Chawla, (2008). Mechanical Behavior of Materials, New York: Cambridge University Press [34] J. W. Christian, (1975). The Theory of Transformations in Metal and Alloys – Part I: Equilibrium and General Kinetic Theory. Pergamon Press. [35] S. Q. Yuan, H.B. Wu, C.J. Shang, X.L. He, “Formation of two hardening peaks in Nb-containing microalloyed steel during aging,” Transaction of Material and Heat Treatment, vol. 26, pp. 69-73, 2005 [36] T. C. Lindley, G. Oates, C.E. Richards, “A Critical Appraisal of Carbide Cracking Mechanisms in Ferride/Carbide Aggregates,” Acta Metallurgica, vol. 18, pp. 1127-1136, 1970 [37] B. Tian, C. Lind, O. Paris, “Influence of Cr23C6 carbides on dynamic recrystallization in hot deformed Nimonic 80a alloys,” Materials and Engineering, vol. A358, pp. 44-51, 2003 [38] C. Gandhi, “On Fracture Initiation Mechanisms and Dynamic Recrystallization during Hot Deformation of Pure Nickel,” Metallurgical Transactions A, vol. 13A, pp. 1233-1238, 1982

78
[39] R. Raj, M. F. Ashby, “On Grain Boundary Sliding and Diffusional Creep,” Metallurgical Transactions, vol. 2, pp. 1113-1127, 1971
Related Documents