Copyright by Chen Na 2005

Welcome message from author
This document is posted to help you gain knowledge. Please leave a comment to let me know what you think about it! Share it to your friends and learn new things together.
Transcript

Copyright
by
Chen Na
2005
The Dissertation Committee for Chen Na
certifies that this is the approved version of the following dissertation:
IEEE 802.11 Wireless LAN Traffic Analysis:
A Cross-layer Approach
Committee:
Theodore S. Rappaport, Supervisor
James C. Browne
Gustavo de Veciana
Jeffrey G. Andrews
Sanjay Shakkottai
Harrick M. Vin
IEEE 802.11 Wireless LAN Traffic Analysis:
A Cross-layer Approach
by
Chen Na, M.S.E.E., B.S.E.E.
Dissertation
Presented to the Faculty of the Graduate School of
The University of Texas at Austin
in Partial Fulfillment
of the Requirements
for the Degree of
Doctor of Philosophy
The University of Texas at Austin
May 2005
This dissertation is dedicated to my wife, Xuejiao Liu, and my parents,
Yuxiu Lei and Xinbang Na

Acknowledgments
I am deeply indebted to my supervisor, Prof. Theodore S. Rappaport, for
his encouragement, advice, mentoring, and research support throughout my
doctoral studies. I also truly appreciate his patience and tolerance during my
numerous trials and errors and his guidance keeping me on the right track.
This dissertation is part of the research carried out through his vision.
I am also sincerely grateful to my committee members, Dr. Gustavo de
Veciana, Dr. Jeffrey G. Andrews, Dr. James C. Browne, Dr. Harrick M. Vin,
and Dr. Sanjay Shakkottai for their help and input regarding the dissertation.
I would also like to thank Prof. William C. Bard for his support during the
network measurement campaigns.
I am fortunate to have the opportunity to be part of the Wireless Net-
working and Communications Group (WNCG) working with a group energetic
and talented colleagues. I would like to especially thank Jeremy K. Chen and
Huihui Wang for sharing research ideas. Thanks also go to WNCG industrial
affiliates for supporting our research.
During the course of this work, I was supported in part by Schlotzsky’s
v
Inc. under research contract UTA 03-390, and grant from the National Science
Foundation ACI-0305644. Wireless Valley Communication, Inc., donated the
LANFielder and LANPlanner software tools.
Finally, it is impossible for me to finish my Ph.D. study without sup-
port and encouragement from my wife and my parents. This dissertation is
dedicated to them.
Chen Na
The University of Texas at Austin
May 2005
vi

IEEE 802.11 Wireless LAN Traffic Analysis:
A Cross-layer Approach
Publication No.
Chen Na, Ph.D.
The University of Texas at Austin, 2005
Supervisor: Theodore S. Rappaport
The deployment of broadband wireless data networks, e.g., wireless local area
networks (WLANs) [29], experienced tremendous growth in the last several
years, and this trend is continuously gaining momentum. In fact, WLAN is
becoming an indispensable component of the modern telecommunication in-
frastructure. Despite this optimistic outlook, however, little is known about
the impact of the wireless channel on the characteristics of WLAN traffic.
This dissertation characterizes the correlation structures of WLAN channel
with traffic statistics from a cross-layer point of view, and provides new mea-
surement methodologies and statistical models for WLAN networks.
Currently WLAN standards are designed within the paradigm of the
layered network architecture. For example, the architecture of IEEE 802.11
vii

is almost identical to the Ethernet. However, wireless networks are funda-
mentally different from their wired peers due to the shift of transmission me-
dia from cables to over-the-air radio waves. This transition exposes wireless
systems to the influence of radio propagation, and more importantly, to the
temporal and spacial fluctuations of the radio channel that can actually be
propagated up to upper layers. However, the current WLAN architecture iso-
lates network layers, and largely ignores this impact. Therefore, we believe
that a cross-layer based approach is necessary to understand and reflect this
underlying impact of the channel to the upper layers of the network, especially
in relation to WLAN traffic behavior.
Measurement is one of the fundamental tools used to quantify radio
propagation. As part of this dissertation, a complete framework for a mea-
surement methodology, including hardware, software, and measurement proce-
dures, is established. Characteristics of the propagation channel are estimated
from measurement data, and the channel knowledge is applied to the upper
layers for more realistic and accurate modeling.
In WLAN environments, knowledge of the traffic characteristics is es-
sential for proper network provisioning, and for improving the performance
of the IEEE 802.11 standard and network devices, e.g., to design improved
MAC schemes, or to build better buffer scheduling algorithms with channel
knowledge, etc. Built upon extensive WLAN traffic traces, this dissertation
work presents cross-layer models for WLAN throughput predictions, traffic
statistics, and link layer characteristics.
viii
The main goal of this dissertation work is to experiment with and de-
velop new methods for identifying channel characteristics. Thereby utilizing
this knowledge, we show how to predict and improve WLAN performance.
Within the framework of the developed cross-layer measurement methodol-
ogy, we conducted extensive measurements in different physical environments
and different settings such as office buildings and stores, and (1) show that
the impact of the propagation channel can be quantified by using simple large
scale channel metric (throughput over longer period of time), and (2) also
present the existence of a Doppler effect within today’s WLAN packet traffic
at sub-second time scales. We also show the real-world WLAN usage pattern
from our measurement results. From this data, we conclude that the key issues
to study WLAN networks include accurate site-specific propagation channel
modeling and real-time autonomous traffic control.
ix

Contents
Acknowledgments v
Abstract vii
Contents x
List of Tables xiv
List of Figures xvi
Chapter 1 Introduction 1
1.1 Objectives . . . . . . . . . . . . . . . . . . . . . . . . . . . . . 1
1.2 Organization . . . . . . . . . . . . . . . . . . . . . . . . . . . 4
1.3 Contributions . . . . . . . . . . . . . . . . . . . . . . . . . . . 5
Chapter 2 WLAN Traffic Statistics: Large Scale Behavior 7
2.1 Introduction . . . . . . . . . . . . . . . . . . . . . . . . . . . . 7
2.2 Literature Background . . . . . . . . . . . . . . . . . . . . . . 10
2.3 Measurement Setup . . . . . . . . . . . . . . . . . . . . . . . . 12
x
2.3.1 Description of Measurement Sites . . . . . . . . . . . . 12
2.3.2 Measurement Site WLAN Infrastructure . . . . . . . . 14
2.3.3 Measurement Hardware/Software Tools . . . . . . . . . 14
2.3.4 Considerations in Designing Measurement Procedures . 17
2.3.5 Traffic Measurement Procedure . . . . . . . . . . . . . 21
2.3.6 Throughput Measurement Procedure . . . . . . . . . . 22
2.3.7 Definitions . . . . . . . . . . . . . . . . . . . . . . . . . 23
2.4 Measured Hotspot Traffic Statistics . . . . . . . . . . . . . . . 23
2.4.1 Traffic Time-series . . . . . . . . . . . . . . . . . . . . 23
2.4.2 Packet Size Distribution . . . . . . . . . . . . . . . . . 26
2.4.3 Typical Applications Used by Hotspot Users . . . . . . 28
2.4.4 Changes of Network Usage Patterns . . . . . . . . . . . 30
2.5 Achievable Throughput Measurements . . . . . . . . . . . . . 32
2.5.1 Empirical IEEE 802.11b Throughput Models . . . . . . 32
2.5.2 Curve-fitting Algorithm . . . . . . . . . . . . . . . . . 34
2.5.3 Measurement Results and Fit Curves . . . . . . . . . . 35
2.5.4 A Summary of Measured Data Trends . . . . . . . . . 36
2.5.5 To Model Other Applications . . . . . . . . . . . . . . 41
2.6 Conclusion . . . . . . . . . . . . . . . . . . . . . . . . . . . . . 42
Chapter 3 WLAN Traffic Statistics:
Sub-second Time Scale Behavior 44
3.1 Introduction . . . . . . . . . . . . . . . . . . . . . . . . . . . . 44
xi

3.2 Spectrum Analysis and Wavelets . . . . . . . . . . . . . . . . 47
3.2.1 Classic Spectrum Estimation . . . . . . . . . . . . . . . 47
3.2.2 Wavelet Transforms and Wavelet Spectrum . . . . . . . 52
3.2.3 A Brief Introduction of Wavelets . . . . . . . . . . . . 53
3.2.4 Scaling Analysis of Network Traffic Using Wavelets . . 55
3.3 Measurement Setup in a Campus Building . . . . . . . . . . . 57
3.3.1 Description of Measurement Sites . . . . . . . . . . . . 57
3.4 Scaling Analysis of ENS 802.11b Traffic . . . . . . . . . . . . . 60
3.4.1 802.11b Traffic Traces Pre-processing . . . . . . . . . . 60
3.4.2 Burstiness of WLAN Traffic at Sub-second Scales . . . 61
3.5 Conclusions . . . . . . . . . . . . . . . . . . . . . . . . . . . . 63
Chapter 4 Channel Characteristics:
Sub-second Time Scales 64
4.1 Introduction . . . . . . . . . . . . . . . . . . . . . . . . . . . . 64
4.2 Correlation Structure of Wideband Channel . . . . . . . . . . 69
4.3 Effects of Doppler Shifts on Packet Traffic . . . . . . . . . . . 71
4.3.1 Description of the Measurement Environment . . . . . 71
4.3.2 The Impact of SNR to WLAN Traffic Structure . . . . 73
4.3.3 WLAN Traffic Characteristics at Small Scales . . . . . 75
4.4 A Systematic View of Traffic, the MAC, and the Channel . . . 76
4.4.1 Interactions Between Traffic Study and Wireless Channel 76
xii
4.4.2 Interactions Between the Channel and the IEEE 802.11
MAC . . . . . . . . . . . . . . . . . . . . . . . . . . . . 77
4.4.3 Examples . . . . . . . . . . . . . . . . . . . . . . . . . 78
4.5 Conclusion . . . . . . . . . . . . . . . . . . . . . . . . . . . . . 82
Chapter 5 Measurement Tools and Procedures 83
5.1 Introduction . . . . . . . . . . . . . . . . . . . . . . . . . . . . 83
5.2 Common Practices and Tools Used in LAN/WAN Environments 84
5.2.1 Common Practices . . . . . . . . . . . . . . . . . . . . 85
5.2.2 Traffic Capturing in LAN Environments . . . . . . . . 87
5.2.3 Tools for Traffic Data Interpretation and Analysis . . . 89
5.3 WLAN Packet Traffic Measurement in the Literature . . . . . 89
5.3.1 TCP and UDP Performance over a Wireless LAN . . . 89
5.3.2 Measure Performance of the IEEE 802.11 LAN . . . . 92
5.3.3 Measured Performance of 802.11a at 5 GHz . . . . . . 92
5.4 Measurement Methodology . . . . . . . . . . . . . . . . . . . . 93
Chapter 6 Conclusions 97
6.1 Summary . . . . . . . . . . . . . . . . . . . . . . . . . . . . . 97
6.2 Future work . . . . . . . . . . . . . . . . . . . . . . . . . . . . 99
Bibliography 102
Vita 113
xiii

List of Tables
2.1 Throughput Measurement Tools . . . . . . . . . . . . . . . . . 16
2.2 Total traffic volume from 10:00 a.m., June 30, 2003 to 10:00
a.m., July 7, 2003 in the Lamar restaurant . . . . . . . . . . . 26
2.3 IP traffic distributions from 10:00 a.m., June 30, 2003 to 10:00
a.m., July 7, 2003 in the Lamar restaurant . . . . . . . . . . . 29
2.4 Parameters of the piecewise models. (’C’ and ’O’ stand for
Cisco and ORiNOCO cards, respectively. ’Gua’, ’Par’, ’Nor’,
and ’All’ stand for the Guadalupe, Parmer, Northcross, and all
three restaurants, respectively.) . . . . . . . . . . . . . . . . . 39
2.5 Parameters of the exponential models. (’C’ and ’O’ stand for
Cisco and ORiNOCO cards, respectively. ’Gua’, ’Par’, ’Nor’,
and ’All’ stand for the Guadalupe, Parmer, Northcross, and all
three restaurants, respectively.) . . . . . . . . . . . . . . . . . 40
xiv
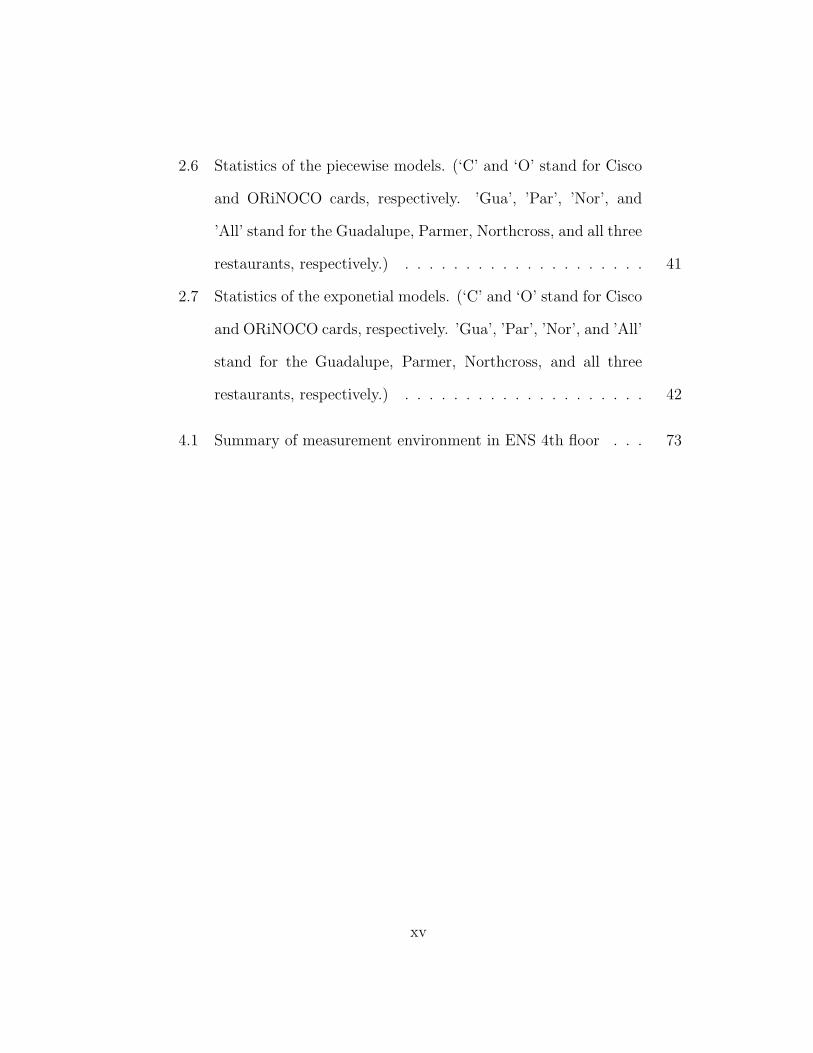
2.6 Statistics of the piecewise models. (‘C’ and ‘O’ stand for Cisco
and ORiNOCO cards, respectively. ’Gua’, ’Par’, ’Nor’, and
’All’ stand for the Guadalupe, Parmer, Northcross, and all three
restaurants, respectively.) . . . . . . . . . . . . . . . . . . . . 41
2.7 Statistics of the exponetial models. (‘C’ and ‘O’ stand for Cisco
and ORiNOCO cards, respectively. ’Gua’, ’Par’, ’Nor’, and ’All’
stand for the Guadalupe, Parmer, Northcross, and all three
restaurants, respectively.) . . . . . . . . . . . . . . . . . . . . 42
4.1 Summary of measurement environment in ENS 4th floor . . . 73
xv

List of Figures
2.1 The typical network structure in Schlotzsky’s restaurants during
measurement periods . . . . . . . . . . . . . . . . . . . . . . . 14
2.2 Weekly traffic (10:00 a.m., June 30, 2003 to 10:00 a.m., July 7,
2003) from the Lamar restaurant . . . . . . . . . . . . . . . . 24
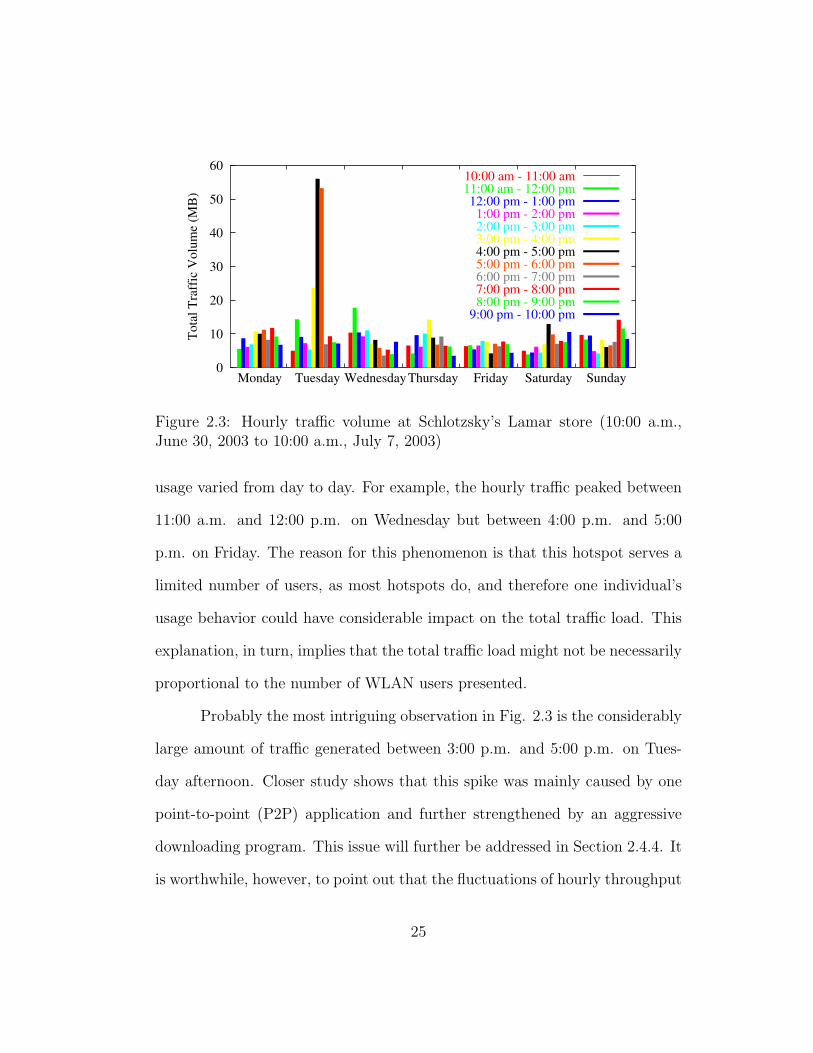
2.3 Hourly traffic volume at Schlotzsky’s Lamar store (10:00 a.m.,
June 30, 2003 to 10:00 a.m., July 7, 2003) . . . . . . . . . . . 25
2.4 Packet size and traffic volume distributions at Schlotzsky’s Lamar
restaurant: Inbound direction . . . . . . . . . . . . . . . . . . 27
2.5 Packet size and traffic volume distributions at Schlotzsky’s Lamar
restaurant: Outbound direction . . . . . . . . . . . . . . . . . 27
2.6 Traffic distributions by major applications from 10:00 a.m., June
30, 2003 to 10:00 a.m., July 7, 2003 in the Lamar Restaurant
(The unidentified category includes all the protocols that could
not be identified by the port mapping procedure with knowledge
of commonly seen ports) . . . . . . . . . . . . . . . . . . . . . 30
xvi
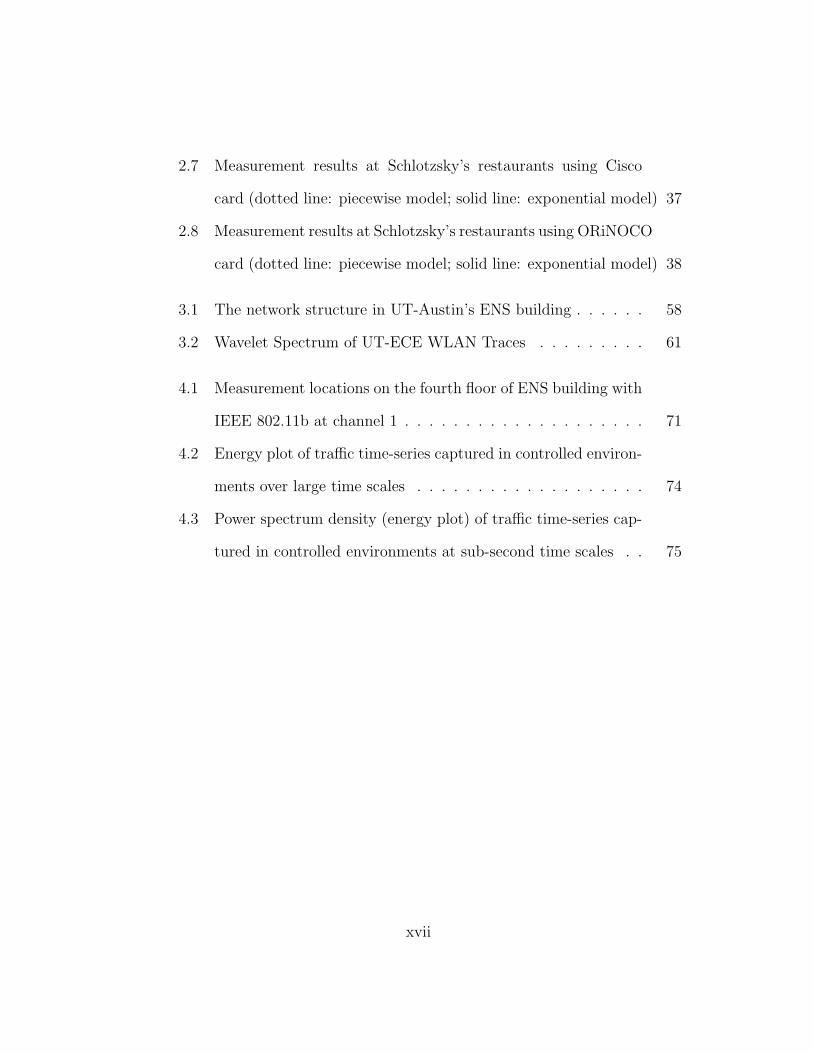
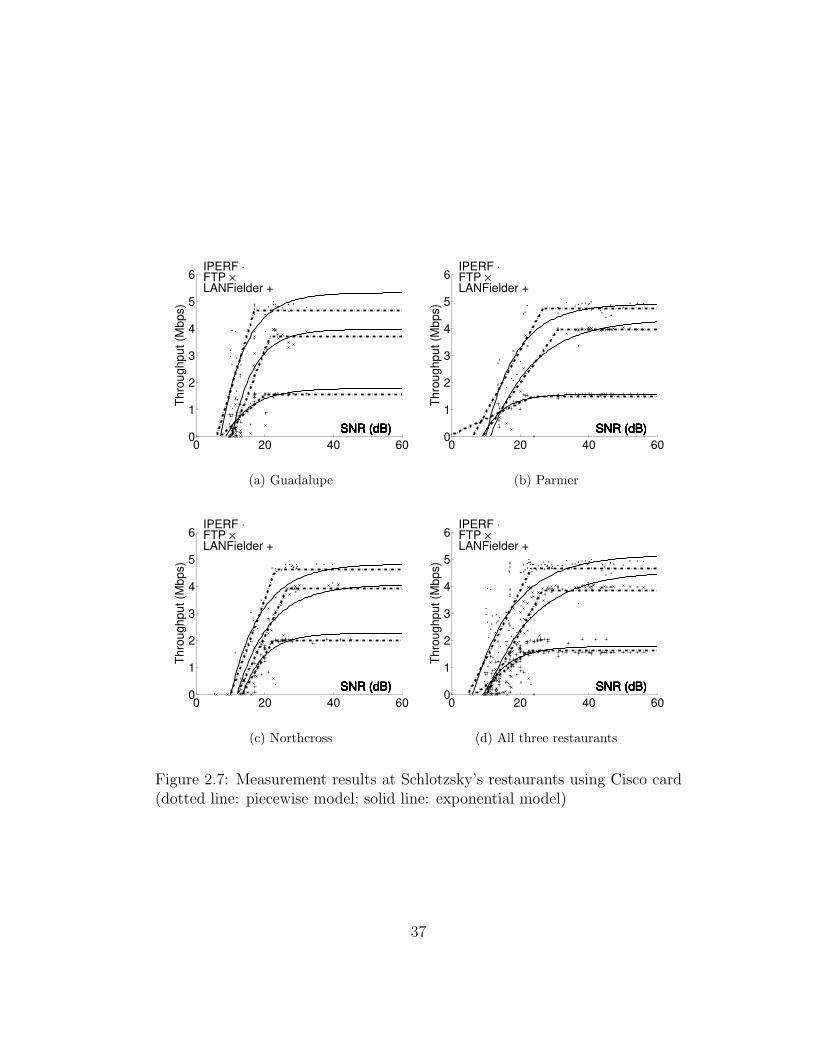
2.7 Measurement results at Schlotzsky’s restaurants using Cisco
card (dotted line: piecewise model; solid line: exponential model) 37
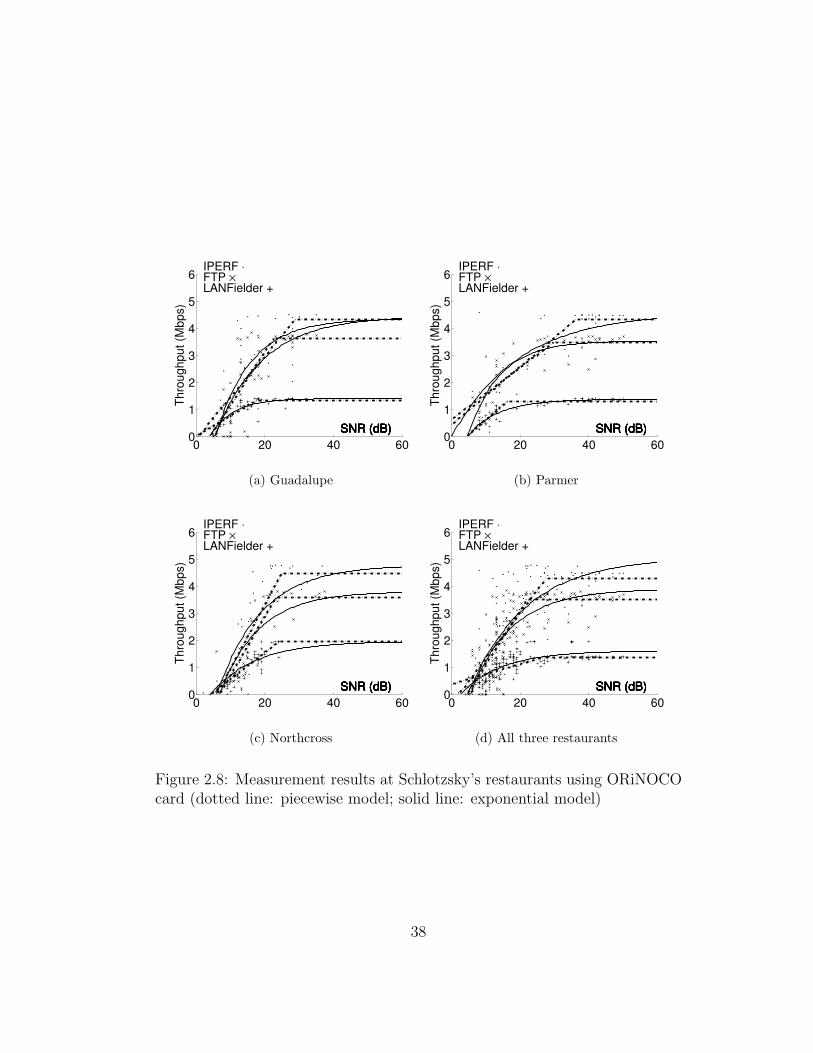
2.8 Measurement results at Schlotzsky’s restaurants using ORiNOCO
card (dotted line: piecewise model; solid line: exponential model) 38
3.1 The network structure in UT-Austin’s ENS building . . . . . . 58
3.2 Wavelet Spectrum of UT-ECE WLAN Traces . . . . . . . . . 61
4.1 Measurement locations on the fourth floor of ENS building with
IEEE 802.11b at channel 1 . . . . . . . . . . . . . . . . . . . . 71
4.2 Energy plot of traffic time-series captured in controlled environ-
ments over large time scales . . . . . . . . . . . . . . . . . . . 74
4.3 Power spectrum density (energy plot) of traffic time-series cap-
tured in controlled environments at sub-second time scales . . 75
xvii
Chapter 1
Introduction
1.1 Objectives
There has been intense interest in the worldwide deployment of wireless local
area networks (WLANs) during the past few years. WLANs that provide
high-speed data services to the general public are becoming popular at public
sites such as university campuses, hotels, business buildings, and restaurants.
Moreover, WLAN technology will start to play an incrementally critical role in
the home networking arena. Along with WLAN deployment, the WLAN user
base is also expected to expand dramatically. Therefore, it is evident that
WLAN will be an important component in next generation communication
infrastructure.
Despite this phenomenal growth and optimistic outlook, however, there
are surprisingly few research works that address the issues appearing in the
1

the deployment and design of WLANs, in particular, from the WLAN packet
traffic point of view. This dissertation work takes a cross-layer point of view
and provides characterizations of WLAN traffic across a broad spectrum, from
the data link layer up to the application layer, and from millisecond observation
intervals up to weekly timescales.
The complexity of modeling and analyzing WLAN traffic originates
from the unique position of WLAN, which combines characteristics of both
cellular communications and computer networks. Compared to cellular sys-
tems, WLANs support higher data-rate packet traffic in a random-access fash-
ion, therefore packets are more often delayed or corrupted. Compared to
the Ethernet, however, WLANs operate over radio environments and have
to propagate through radio propagation channels with abundant fading and
interference. Therefore, while WLAN technology gains ground by providing
broadband connections and tether-less convenience to end users at low cost, it
remains a difficult task to thoroughly model WLAN traffic characteristics and
therefore reliably predict WLAN performance.
The fundamental difference between wired networks and wireless net-
works is the radio transmission media. Therefore, it is essential to study the
channel for understanding the modeling issues which appear at higher layers
in WLAN traffic studies. Historically, measurement has been an extremely
valuable tool to quantify and model propagation characteristics of the radio
media. This approach has been proved to be effective and productive [50].
Even though WLAN is different from most previous wireless systems, espe-
2

cially regarding the media access control (MAC) mechanism, the fundamental
radio propagation laws still hold and continues to influence WLAN packet
transmission. Thus, channel measurements are necessary to model WLAN
environments.
In WLAN environments, knowledge of the traffic characteristics is es-
sential for proper network provisioning, and for improving the performance
of the IEEE 802.11 standard and network devices, e.g., to design improved
MAC schemes, or to build better buffer scheduling algorithms with channel
knowledge, etc. Built upon extensive WLAN traffic traces, this dissertation
work presents cross-layer models for WLAN throughput predictions and traffic
statistics.
On the other hand, it is well-known that channel state information, if
available, can be intelligently exploited to improve system performance [7, 38].
By utilizing actual traffic to estimate channel parameters, not only could we
reduce the overhead involved in some algorithms, but also yield better site-
specific channel estimation. This dissertation work also suggests that WLAN
traffic can be used to intelligently estimate radio channel by revealing rela-
tionship between the Doppler shifts to the correlation variations at the link
layer.
3
1.2 Organization
This dissertation is organized in 6 chapters. The structure of this dissertation is
as follows. Chapter 1 provides an overview of the objectives and organizations
of this dissertation work, and outlines the main contributions.
Chapter 2 presents measurement results, i.e., (1) typical traffic statis-
tics, and (2) application-level throughput prediction models, of real-world
WLANs. The measured traffic statistics and throughput prediction models
can benefit and guide future WLAN deployment.
Chapter 3 details the analysis of captured WLAN packet traffic and
presents the sub-second scale characteristics of WLAN traffic. The resulting
traffic correlation structure differs from existing wired traffic results, which
inspires subsequent study in Chapter 4.
Chapter 4 demonstrates that the correlation structure of IEEE 802.11b
channel is influenced by Doppler shifts, especially when the SNR level is at
the critical level. The time scales of such influence in typical 802.11b networks
are located at the sub-second regime. This chapter shows the promising out-
look of better channel predictions and time scale correlations for IEEE 802.11
networks with adequate site-specific knowledge.
Chapter 5 presents the measurement methodologies used throughout
this work, including choices of hardware and software tools, and procedures to
conduct measurements in different environments.
Finally, Chapter 6 reviews the contributions of the dissertation and
4

suggests directions for future research.
1.3 Contributions
The contributions of the dissertation work are as follows:
1. We develop a suite of cross-layer measurement methodologies that take
into account the requirement of conducting measurements of channel and
the upper network layers simultaneously (Chapter 5). The measurement
frame work was thoroughly verified through our extensive measurement
campaigns (Chapter 2, 3, and 4).
2. Two application layer throughput models are established through mea-
surements and are verified through blind tests (Chapter 2. The models
capture the channel characteristics by measuring the average signal-to-
noise ratio (SNR), which quantifies the large-scale fading characteristics
of radio channels. Blind test results show that both models are very ac-
curate in quantifying achievable throughput with measured or predicted
SNR values, and can be used in conjunction with channel prediction tools
to predict network performance prior to WLAN deployment (Chapter 2).
3. Hotspot traffic statistics are measured at three commercial hotspots. To
the best of our knowledge, this is the first published work on hotspot
traffic statistics in the literature. This result provides insights into the
required provisioning for PWLANs and autonomous control approaches
5

for future broadband wireless access and real-time wireless voice/video
services (Chapter 2).
4. We conducted extensive measurements in different environments under
various settings, and show that the impact of the propagation channel
can be quantified not only at large scales (throughput over longer peri-
ods of time), but also over small sub-second time scales. The impact of
the channel on WLAN packet traffic at sub-second time scales is identi-
fied and modeled, and is attributed mostly to Doppler shifts caused by
relative movements during radio propagation. This result complements
out previous results, i.e., that application level throughput correlates to
SNR over larger time scales. More importantly, this result may lead to
link-layer channel models that consider the physical characteristics of
the channel, such as Doppler shifts and multipath propagation (Chapter
3 and 4).
Publications that resulted from this dissertation include [46, 42, 45, 43,
44].
6
Chapter 2
WLAN Traffic Statistics: Large
Scale Behavior
2.1 Introduction
Application-level performance perceived by users dictates the user experience.
For WLAN users, even though the highest transmission rate specified in IEEE
802.11b is 11 Mbps, the throughput perceived by users, i.e., the amount of
data transmitted from transmitting applications to receiving applications in
a certain period, is significantly lower than this specified transmission rate in
practice. Besides factors such as the MAC mechanism, hostile radio channels
play key roles in inducing the performance loss. Temporal and spatial radio
channel variations [50] are caused by the site-specific physical environment
which degrades WLAN transmission performance and hence the throughput
7

perceived by end users.
This chapter presents measurement results on two critical aspects that
are important in deploying and provisioning WLANs: (1) typical traffic statis-
tics, and (2) application-level throughput performance as experienced by an
end user. As part of this dissertation, traffic statistics and coverage/throughput
models were developed using data measured from real-world hotspots in the
summer of 2003 [46, 42, 14]. The traffic measurement campaign involved
over 14,400 minutes of hotspot traffic and 15,983,748 packets measured at two
Schlotzsky’s restaurants. The throughput measurement campaign included
measurements at 33 locations in and around three Schlotzsky’s restaurants,
with a total of 792 different throughput and signal-to-noise ratio (SNR) mea-
surements. This measurement campaign gave insight into user behavior and
traffic models at actual hotspots, and provided a baseline of performance mod-
eling.
Our traffic study showed that:
• As of the summer of 2003, most WLAN traffic loads are highly asymmet-
ric, with much higher inbound traffic (from the Internet to the WLAN).
The ratio of outbound to inbound traffic load measured was found to be
about 1:5 on average and 1:6 during busy hours.
• Traffic volume is dominated by the presence of a small number of users,
e.g., users downloading large files or using peer-to-peer (P2P) applica-
tions.
8

• The majority of the users use “traditional” Internet services. For exam-
ple, web browsing and newsgroup reading were the two most frequently
used protocols observed from this measurement campaign.
• The most commonly visited Internet sites include web-based email ser-
vices, on-line auction services, on-line gaming sites, and Usenet news
reading.
Our throughput measurement results showed that:
• WLAN performance varies with many factors, such as user locations,
building layouts, and surrounding environments outside of the building.
• The application-level throughput in an IEEE 802.11b network is closely
correlated with the perceived SNR, as measured by the client. Further-
more, empirical models were established to model application through-
put to provide accurate throughput predictions for new environments.
This chapter is organized as follows. In section 2.3, we explain the tools
and procedures used in this measurement campaign. Section 2.4 presents
obtained hotspot traffic statistics in two restaurants. Section 2.5 shows the
measurement results of single-user throughput data in three restaurants. Also,
two empirical models are presented that accurately model application-level
throughput with SNR in IEEE 802.11b WLANs. In section 2.6, we conclude
this chapter. The work documented in this chapter was funded by Schlotzsky’s
Deli and the National Science Fundation, and also supported the M.S. thesis
of Jeremy K. Chen.
9

2.2 Literature Background
Kotz and Essien [39] reported their measurement results that spanned 3 months
on the Dartmouth college campus in 2001. These results are helpful in provi-
sioning WLANs, as they provided typical number of users, typical session time
per user, and user behaviors. The measurement data presented in [39] may be
used to estimate future system capacity requests, or to calibrate user activity
distribution parameters. For example, [39] reported that network backup and
file sharing applications produced almost 30 percent of the traffic on the net-
work. Also, measurement data in [39] confirmed the need for better roaming
support in WLAN. However, [39] did not address the coverage and throughput
performance of various applications on WLANs. Moreover, the traffic statis-
tics were more relevant to WLANs deployed in university campuses, and not
typical of a restaurant chain in an urban setting.
Tang and Baker [57] measured the WLAN traffic in the building of the
Stanford Computer Science Department during the 1999 fall quarter. Their
results represent the traffic statistics of typical university buildings occupied
by computer science professionals with commonly seen applications in 1999.
In [57], the authors observed a ratio of 1:3 between outbound and inbound
traffic, while our 2003 results show a ratio of 1:5. In addition, [57] reported
that 70% of packets were smaller than 200 bytes, while we observed 60% of
the packets are smaller than 200 bytes. However, [57] presented several similar
findings to our results, e.g., HTTP remains to be the most popular protocol.
10

Balachandran et. al. [4] examined 195 IEEE 802.11b users during an
ACM meeting in an auditorium at U.C. San Diego in August 2001. In [4],
traffic load could be correlated to the conference schedule, which is similar
to the results presented here. However, [4] did not delve into the impact of
traffic statistics on WLAN performance, which is an important objective in
this dissertation work.
Balazinska and Castro [5] studied user mobility patterns in a large cor-
porate environment. They relied on periodical queries from access points
(APs) to collect network statistics, which is different from the packet-by-packet
measurement methodology used in this study. However, the work in [5] corrob-
orates our finding that WLAN traffic load is influenced more by the aggressive
users than the number of users in the network.
In summary, the above literature shows that the perceived application-
level throughput by individual WLAN users is profoundly influenced by radio
frequency (RF) propagation, as well as the type of applications used by the
user community. However, most of the past research works have focused on in-
dividual layers, e.g., the application layer, the MAC layer or the physical layer,
and have ignored the interactions among layers. To the best of our knowledge,
Henty and Rappaport [27] first systematically studied the correlation between
application-level throughput and physical layer propagation properties in the
IEEE 802.11b environment.
Work in [27] presents the WLAN measurement results in an engineering
building at Virginia Tech. The authors conducted a series of measurements
11
at various locations in the building with one and two laptop computers. The
measurement data were used to derive empirical models that represents the
correlation between throughput and signal-to-noise ratio. The work in [27] re-
lated signal-to-noise ratio to throughput and yielded throughput models based
on intuitive, simple, yet accurate empirical modeling. The work presented in
this chapter expands on [27] for realistic WLAN environments with a vast
number of measurement points and diversified applications.
2.3 Measurement Setup
In this section, we describe the network structures, configurations of hardware
platforms, and software utilities used in this measurement campaign.
2.3.1 Description of Measurement Sites
Schlotzsky’s deli provides free Internet service in and around the premises of
their restaurants using IEEE 802.11b equipment. Four Schlotzsky’s restau-
rants in Austin, Texas were chosen as measurement sites. These sites are
named Guadalupe, Parmer, Northcross, and Lamar. Each of the four restau-
rants is a stand-alone structure with a parking lot, and each, except Parmer,
is located in an urban area in downtown Austin.
The Lamar restaurant is located at a busy intersection and near a
recreation area. It has the highest WLAN traffic load among the four mea-
surement sites.
12

The Guadalupe restaurant is located three blocks away from a large
dormitory building near the University of Texas at Austin and hence accom-
modates more college-aged customers.
The Parmer restaurant has a large number of customers from the
high-tech industry, as it is very close to several offices of Dell Computer Cor-
poration and Samsung Austin Semiconductor.
The Northcross restaurant is located in a shopping mall area. It is
the smallest among the four restaurant sites and sees the lowest WLAN traffic
load.
Several desk-mounted Apple iMac computers are also conveniently pro-
vided for customers in each restaurant, and while they are desk-mounted, they
are also wirelessly connected to the WLAN network. In addition, users may
bring in or use in the parking lot their own IEEE 802.11b enabled equipment
at anytime for use with the WLAN.
Among the four restaurants, average traffic volume is highest at the
Lamar restaurant and is lowest at the Northcross measurement site. For ex-
ample, the average hourly bi-directional throughput during busy hours was
about 10 MB at the Lamar restaurant, but the Northcross measurement site
experienced less than 2.4 MB. Thus, these two sites may represent two dis-
parate, yet representative, hotspots. Therefore, Lamar and Northcross were
the selected sites for detailed traffic statistics studies, while the Guadalupe,
Parmer, and Northcross restaurants were used as throughput measurement
sites.
13

Apple iMac
Apple iMac
Apple iMac
Dell C640 Compaq N600c
Measurement Platform
CN−3000 AP Internet Router
Hub DS−104
T1 Link
Figure 2.1: The typical network structure in Schlotzsky’s restaurants duringmeasurement periods
2.3.2 Measurement Site WLAN Infrastructure
Each of the four restaurants is equipped with a Colubris Networks CN-3000
AP, which connects to the Internet via a T1 link. Fig. 2.1 shows the WLAN
structure of a typical measurement site. The CN-3000 AP is IEEE 802.11b
compliant with a built-in antenna. However, one or more external antennas
may be attached to the AP. All CN-3000 APs are configured such that no RTS
(request to send) and CTS (clear to send) [30] handshake packets is exchanged
prior to data transmission at the MAC layer to reduce traffic overhead.
2.3.3 Measurement Hardware/Software Tools
This section describes hardware and software tools used in the Schlotzsky’s
measurement campaign.
14

Measurement Hardware
In this measurement campaign, one Compaq Evo N600c laptop computer was
connected together with the CN-3000 AP to a Netgear DS-104 Ethernet hub,
as shown in Fig. 2.1. This laptop computer served as both an application
server for the throughput measurements and a packet sniffer in the traffic
capturing processes.
During throughput measurements, a Dell Latitude C640 laptop com-
puter was configured as a client machine. Two different IEEE 802.11b PCM-
CIA wireless network interface cards (NICs), the Cisco Aironet 350 and ORiNOCO
Gold, were used equally with the Dell client laptop during measurements. Be-
cause of different algorithms and design choices made internally by each ven-
dor, the main objective of using NICs from two representative vendors was to
identify and aggregate the performance difference between two different NICs,
as would be seen in most WLANs with walk-in traffic.
Traffic Capturing Environment
During the traffic capturing process, the program tcpdump 3.7.2 was run on
the Compaq laptop, which was installed with the Debian Linux 3.0 operating
system (OS) to capture WLAN traffic. Because the CN-3000 AP, the Internet
router, and this sniffing computer were all connected to the same hub, as
shown in Fig. 2.1, any packet sent to and from the WLAN was captured and
saved by tcpdump for processing.
15
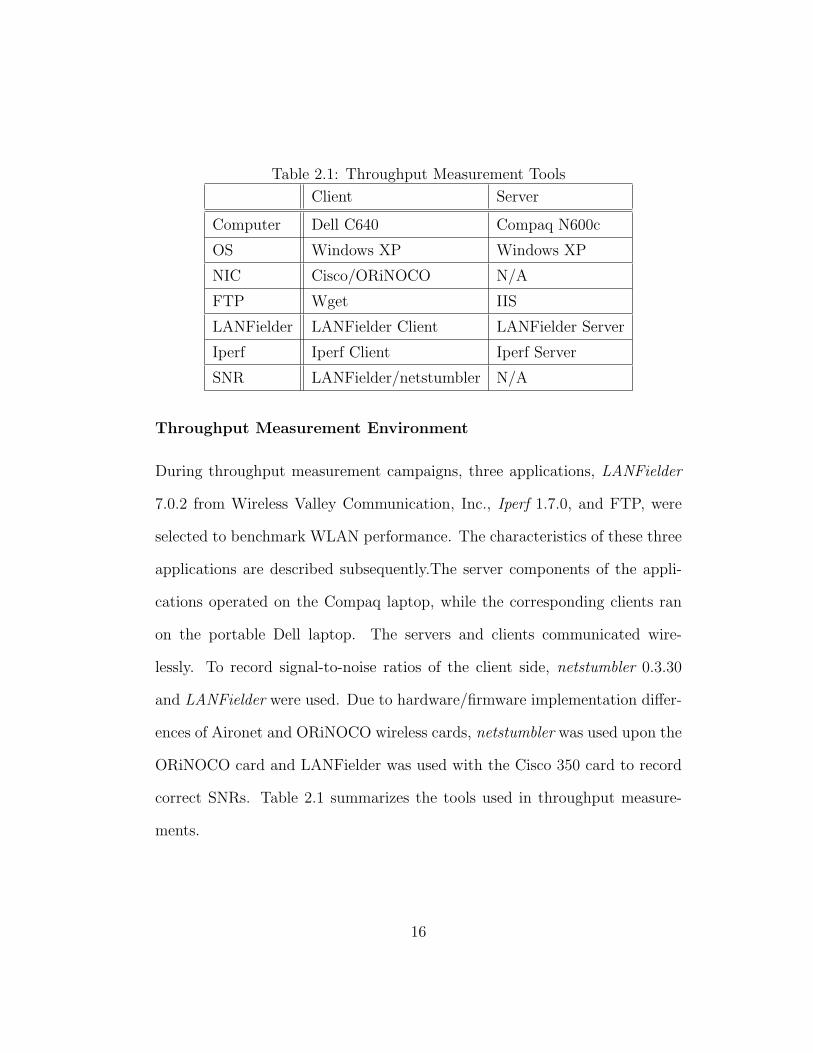
Table 2.1: Throughput Measurement Tools
Client Server
Computer Dell C640 Compaq N600c
OS Windows XP Windows XP
NIC Cisco/ORiNOCO N/A
FTP Wget IIS
LANFielder LANFielder Client LANFielder Server
Iperf Iperf Client Iperf Server
SNR LANFielder/netstumbler N/A
Throughput Measurement Environment
During throughput measurement campaigns, three applications, LANFielder
7.0.2 from Wireless Valley Communication, Inc., Iperf 1.7.0, and FTP, were
selected to benchmark WLAN performance. The characteristics of these three
applications are described subsequently.The server components of the appli-
cations operated on the Compaq laptop, while the corresponding clients ran
on the portable Dell laptop. The servers and clients communicated wire-
lessly. To record signal-to-noise ratios of the client side, netstumbler 0.3.30
and LANFielder were used. Due to hardware/firmware implementation differ-
ences of Aironet and ORiNOCO wireless cards, netstumbler was used upon the
ORiNOCO card and LANFielder was used with the Cisco 350 card to record
correct SNRs. Table 2.1 summarizes the tools used in throughput measure-
ments.
16

2.3.4 Considerations in Designing Measurement Proce-
dures
Two seperated measurements were conducted in Schlotzsky’s measurement
campaign. The first measurement was to quantify the actually hotspot traffic
statistics while the other was to evaluate the correlation between the channel
and application layer throughput. Several experimental design considerations
were made to ensure different applications provided realistic hotspot traffic
measurements, throughput measurements, and performance metrics represen-
tative of WLANs.
Traffic Capturing
A key consideration in measuring traffic statistics was to ensure very little
artificial traffic would be generated by measurement systems. Two specific
measures were taken to guarantee this criterion. First, tcpdump was launched
in a non-intrusive manner such that no packet would be generated by tcpdump.
Second, integrity checking processes1 were conducted during 1:00 to 1:15 a.m.
each day during the seven-day measurement campaign when the network ex-
perienced virtually no user traffic. In fact, only a low overhead remote shell
was opened during the late-night integrity check operation. Hence, any artifi-
cially generated traffic could be eliminated off-line by identifying timestamps
and protocols.
1Integrity checks are required to ensure measurement software and hardware are func-tioning properly.
17
As designed, the AP handled all internal traffic between users and
shielded the sniffing computer from logging traffic between users in the restau-
rant. However, because most users were strangers to one another, and used
the public Apple iMac computers or their own laptops, the likelihood of such
internal communications was thought to be very rare.
Throughput Measurement Considerations
SNR at each mobile client was chosen as the primary metric to measure radio
channel conditions. IEEE 802.11b WLAN is designed to transmit wide-band
modulated digital symbols over RF channels [30]. Hence, 802.11b symbols
shall experience frequency-selective fading, which implies little fluctuations of
received signal strength at the receiver side [50] for each symbol transmission.
Therefore, the major difference between two distinct transmissions is the re-
ceived SNR levels. Thus, SNR is one of the most important parameters, if
not the most important one, to characterize RF channel conditions in IEEE
802.11b WLANs.
It is well known that interference as specified by the signal-to-interference
(SIR) ratio, is the primary limiting factor for attaining high throughput in cel-
lular wireless communication systems, and [27] considered throughput models
based on SIR as well as SNR. However, the work presented in this chapter fo-
cuses on studying the achievable throughput of a typical WLAN environment,
which, in most cases, is a single “cell” covered by a “base station”, i.e., the
AP, with limited coverage area. The CSMA/CA mechanism in IEEE 802.11 is
18

designed to mitigate interference through carrier sensing, and it is especially
effective within the WLAN setting. Thus, while SIR is a factor in cellular reuse
schemes, the CSMA/CA multiple access technique used in the IEEE 802.11
networks avoids any substantial SIR in a WLAN setting. Moreover, as de-
scribed subsequently, the throughput measurement procedure was performed
in the absence of other interfering wireless systems, e.g., other 802.11b AP or
Bluetooth devices. Therefore, SIR is not considered in this dissertation work.
Several environmental factors may affect throughput measurement re-
sults. For example, wireless channels vary as objects in the vicinity of transmis-
sion, such as customers, vehicles, etc. move throughout the premises, thereby
creating multipath and Doppler effects [50]. To keep interference from people
and vehicles around measurement sites at a minimum, throughput measure-
ments were conducted late at night or early in the morning, outside normal
business hours.
For each of the three restaurants studied, eleven locations were chosen
in and around the restaurant to measure SNR and throughput values. The
eleven locations represent common points from which wireless users connect to
the WLAN service. Moreover, these locations yielded a wide range of received
signal levels. At each location, both the Cisco and the ORiNOCO NICs were
used with three different applications for throughput measurements. Each
measured data set was recorded by sending ten seconds of data using each
of the three applications, and each data set consisted of three averaged mea-
surement values: received signal strength intensity (RSSI), noise level, and
19

application throughput. Furthermore, throughput measurements were made
with the client laptop positioned successively toward the four cardinal direc-
tions: north, east, south, and west. In total, 264 data sets were measured
at each restaurant, with each data set being decided by a combination of 11
locations, 2 NICs, 3 applications, and 4 directions.
Descriptions of Applications Used in Throughput Measurement
Each of the three applications, LANFielder, Iperf, and wget, operates differ-
ently. LANFielder repeatedly sends a single packet back and forth between the
server and the client, and reports throughput as the ratio of successfully re-
ceived packet size to time length. Iperf tunes the optimal TCP sliding-window
size, which determines the amount of data that exist in the network, and then
reports throughput as the maximum TCP bandwidth. Wget, as a standard
FTP client, reports throughput as the rate at which a file is retrieved from an
FTP server. On the other hand, both Iperf and Wget report application-level
throughput using the TCP protocol. However, Iperf reports throughput values
by using optimal TCP sliding-window sizes estimated by Iperf, and Wget, as
a a standard FTP client, reports throughput values using the default TCP
implementation provided by operating systems.
We expected that the three applications would yield very different
throughput values due to their operational distinctions. LANFielder works
similar to the real-time applications/protocols such as Voice of IP (VoIP),
which wget represents typical web browsing or file downloading activities. Iperf
20

should report the highest throughput among the three tools because it tries to
benchmark the maximum available bandwidth. FTP protocol also utilizes the
TCP sliding-window mechanism to send successive packets, and is primarily
one-way transmission. Hence, throughput that FTP reports should be higher
than that of LANFielder as LANFielder does not pipeline transmissions.
LANFielder supports three transport protocols: TCP, TCP Flood, and
UDP, and has a wide range of acknowledgment options, which is useful for em-
ulating a vast array of possible applications, such as real-time video or audio.
Because both Iperf and wget use TCP, we selected UDP and a two-way trans-
mission of the original packets to diversify the choice of applications and to
allow LANFielder to emulate a heart-beat or repeater application. Moreover,
in this work, the packet size in LANFielder was set to be the maximum, 1472
bytes UDP payload data, in order to experience the widest range of measured
throughput variations due to channel conditions (e.g., we used the longest
transmission time) and lowest protocol overhead.
Iperf and wget were used in the default manner. To accelerate the FTP
file transfer process, the FTP server shared two files with sizes 300 KB and 3
MB. The smaller file and the larger one were selected in low and high SNR
conditions, respectively. The two file sizes were chosen empirically for the
downloading process to finish in approximately ten seconds.
2.3.5 Traffic Measurement Procedure
Hotspot traffic was captured as follows:
21

• The CN-3000 AP and the sniffer laptop were connected to the common
hub (see Fig. 2.1).
• Tcpdump was initiated on the sniffer laptop to record the first 68 bytes
of each packet to and from the WLAN.
• At 1:00 a.m. every day during the week of measurement, the traffic
trace file on the sniffer laptop computer was remotely inspected to ensure
integrity.
• After finishing one week of continuous measurements, the sniffer laptop
and the hub were removed from the restaurant.
2.3.6 Throughput Measurement Procedure
The throughput and SNR measurement procedure is as follows:
• The Compaq server was connected to the CN-3000 AP via a hub.
• Three non-conflicting software packages, LANFielder, Iperf, and FTP
Server, were started on the server laptop one at a time.
• The client computer was booted with Aironet 350 or ORiNOCO cards.
• The corresponding client software, LANFielder, Iperf, and wget, were
executed on the client laptop to measure WLAN throughput.
• SNR values were recorded by LANFielder/netstumbler.
22

2.3.7 Definitions
Before we present the measurement results, several definitions are necessary.
Inbound traffic: traffic sent from the Internet to the AP.
Outbound traffic: traffic sent to the Internet by the AP.
Busy hours: the period during which more than 90% of the daily traffic
is generated. In this measurement campaign, the hours from 10:00 a.m.
to 10:00 p.m. were calibrated as the busy hours.
Signal-to-noise ratio (SNR): The perceived SNR by WLAN clients.
2.4 Measured Hotspot Traffic Statistics
During this traffic measurement campaign, the Lamar restaurant offered the
largest user base and traffic load. Hence, a one-week traffic trace from 10:00
a.m., June 30, 2003 to 10:00 a.m., July 7, 2003 at the Lamar restaurant is
presented in this section to illustrate the traffic statistics of a popular WLAN.
The trace captured 6,000,957 outbound and 7,223,654 inbound packets.
2.4.1 Traffic Time-series
Fig. 2.2 is a one-week time-series plot of the captured WLAN traffic at the
Lamar restaurant.
23

00.20.40.60.8
11.21.41.6
06/3000:00
07/0100:00
07/0200:00
07/0300:00
07/0400:00
07/0500:00
07/0600:00
07/0700:00
Thr
ough
put (
Mb/
s)
DateTime
Up to 4.5 Mb/s InboundOutbound
Figure 2.2: Weekly traffic (10:00 a.m., June 30, 2003 to 10:00 a.m., July 7,2003) from the Lamar restaurant
As observed from this figure, the traffic load followed the store business
hours closely, which are 7:00 a.m. - 10:00 p.m. Monday through Thursday,
7:00 a.m. - 11:00 p.m. Friday, 8:00 a.m. - 11:00 p.m. Saturday, and 8:00 a.m. -
10:00 p.m. Sunday. Traffic load increased rapidly when the restaurant opened
and dropped dramatically when the store closed. Throughput spikes shown
in Fig. 2.2 represent periods of high throughput demand. The continuous
traffic load during business hours suggests that this WLAN service did attract
customers to visit the restaurant.
An hourly time-series plot is shown in Fig. 2.3. Because there was
little overnight traffic, as presented in Fig. 2.2, this plot only presents traffic
during the busy hours. Fig. 2.3 shows that the distribution of hourly network
24
0
10
20
30
40
50
60
Tot
al T
raff
ic V
olum
e (M
B)
Monday Tuesday WednesdayThursday Friday Saturday Sunday
10:00 am - 11:00 am11:00 am - 12:00 pm12:00 pm - 1:00 pm1:00 pm - 2:00 pm2:00 pm - 3:00 pm3:00 pm - 4:00 pm4:00 pm - 5:00 pm5:00 pm - 6:00 pm6:00 pm - 7:00 pm7:00 pm - 8:00 pm8:00 pm - 9:00 pm
9:00 pm - 10:00 pm
Figure 2.3: Hourly traffic volume at Schlotzsky’s Lamar store (10:00 a.m.,June 30, 2003 to 10:00 a.m., July 7, 2003)
usage varied from day to day. For example, the hourly traffic peaked between
11:00 a.m. and 12:00 p.m. on Wednesday but between 4:00 p.m. and 5:00
p.m. on Friday. The reason for this phenomenon is that this hotspot serves a
limited number of users, as most hotspots do, and therefore one individual’s
usage behavior could have considerable impact on the total traffic load. This
explanation, in turn, implies that the total traffic load might not be necessarily
proportional to the number of WLAN users presented.
Probably the most intriguing observation in Fig. 2.3 is the considerably
large amount of traffic generated between 3:00 p.m. and 5:00 p.m. on Tues-
day afternoon. Closer study shows that this spike was mainly caused by one
point-to-point (P2P) application and further strengthened by an aggressive
downloading program. This issue will further be addressed in Section 2.4.4. It
is worthwhile, however, to point out that the fluctuations of hourly throughput
25
during busy hours were relatively small, except for this anomalous period on
Tuesday afternoon.
2.4.2 Packet Size Distribution
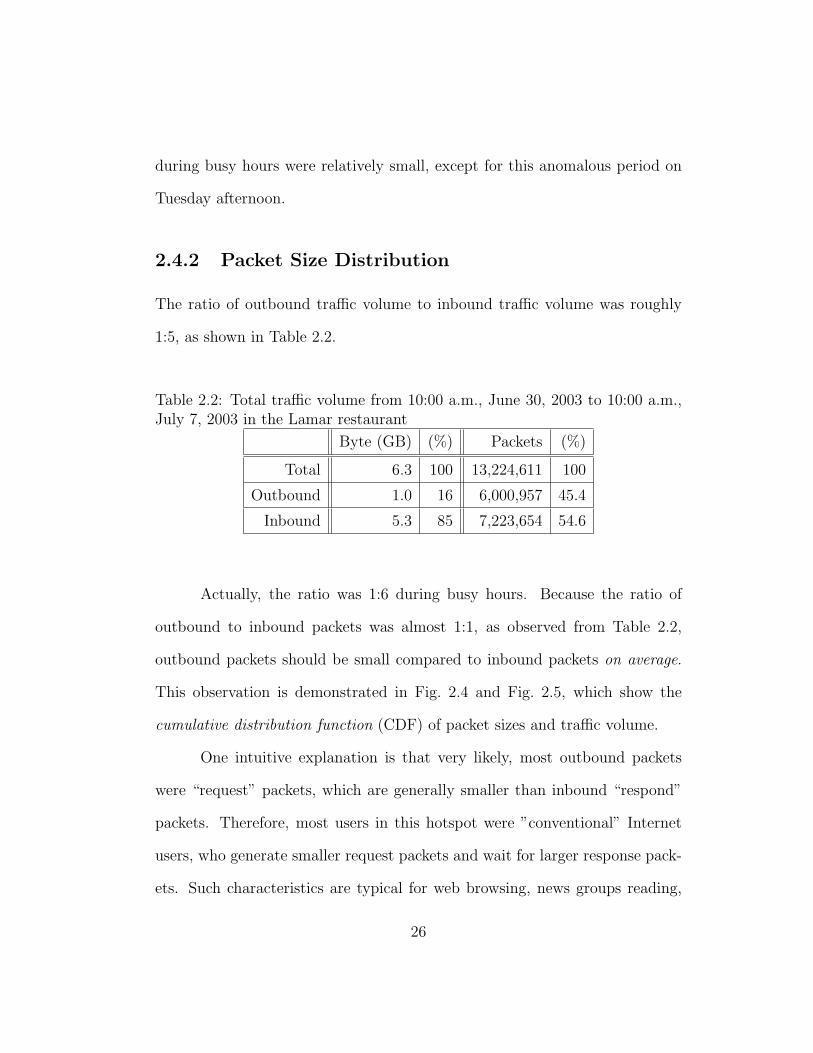
The ratio of outbound traffic volume to inbound traffic volume was roughly
1:5, as shown in Table 2.2.
Table 2.2: Total traffic volume from 10:00 a.m., June 30, 2003 to 10:00 a.m.,July 7, 2003 in the Lamar restaurant
Byte (GB) (%) Packets (%)
Total 6.3 100 13,224,611 100
Outbound 1.0 16 6,000,957 45.4
Inbound 5.3 85 7,223,654 54.6
Actually, the ratio was 1:6 during busy hours. Because the ratio of
outbound to inbound packets was almost 1:1, as observed from Table 2.2,
outbound packets should be small compared to inbound packets on average.
This observation is demonstrated in Fig. 2.4 and Fig. 2.5, which show the
cumulative distribution function (CDF) of packet sizes and traffic volume.
One intuitive explanation is that very likely, most outbound packets
were “request” packets, which are generally smaller than inbound “respond”
packets. Therefore, most users in this hotspot were ”conventional” Internet
users, who generate smaller request packets and wait for larger response pack-
ets. Such characteristics are typical for web browsing, news groups reading,
26

0
0.2
0.4
0.6
0.8
1
0 300 600 900 1200 1500
CD
F
Packet Size (bytes)
PacketsVolume
Figure 2.4: Packet size and traffic volume distributions at Schlotzsky’s Lamarrestaurant: Inbound direction
0
0.2
0.4
0.6
0.8
1
0 300 600 900 1200 1500
CD
F
Packet Size (bytes)
PacketsVolume
Figure 2.5: Packet size and traffic volume distributions at Schlotzsky’s Lamarrestaurant: Outbound direction
27

and email services.
Observe Fig. 2.4 and Fig. 2.5, small packets (smaller than 100 bytes),
and large packets (larger than 1470 bytes) dominate traffic over the measured
WLAN. Eighty percent of outbound packets were smaller than 100 bytes, and
inbound packets were for the most part smaller than 100 bytes or larger than
1470 bytes.
The measured inbound and outbound packet size distributions, as shown
in Fig. 2.4 and Fig. 2.5, suggest several possible optimization procedures. For
example, APs installed in WLAN areas should be optimized to send small
packets and large packets on downlink. This procedure is obvious because
these two groups account for approximately 40% each of the total number of
downlink packets. On the other hand, APs should be optimized for receiving
small packets because 80% of uplink packets are smaller than 100 bytes, ac-
cording to Fig. 2.5. Similarly, because most packets originating from WLAN
clients are small, WLAN client devices should be optimized to send small pack-
ets. On the other hand, WLAN access points can benifit from balanced design
because small packets and large packets each accounts for 40% of traffic.
2.4.3 Typical Applications Used by Hotspot Users
Table 2.3 presents the distribution of TCP/UDP traffic load by users of the
WLAN in the Lamar resaturant.
The small amount of measured UDP traffic almost completely elim-
inated the likelihood of the presence of real-time video/audio applications.
28
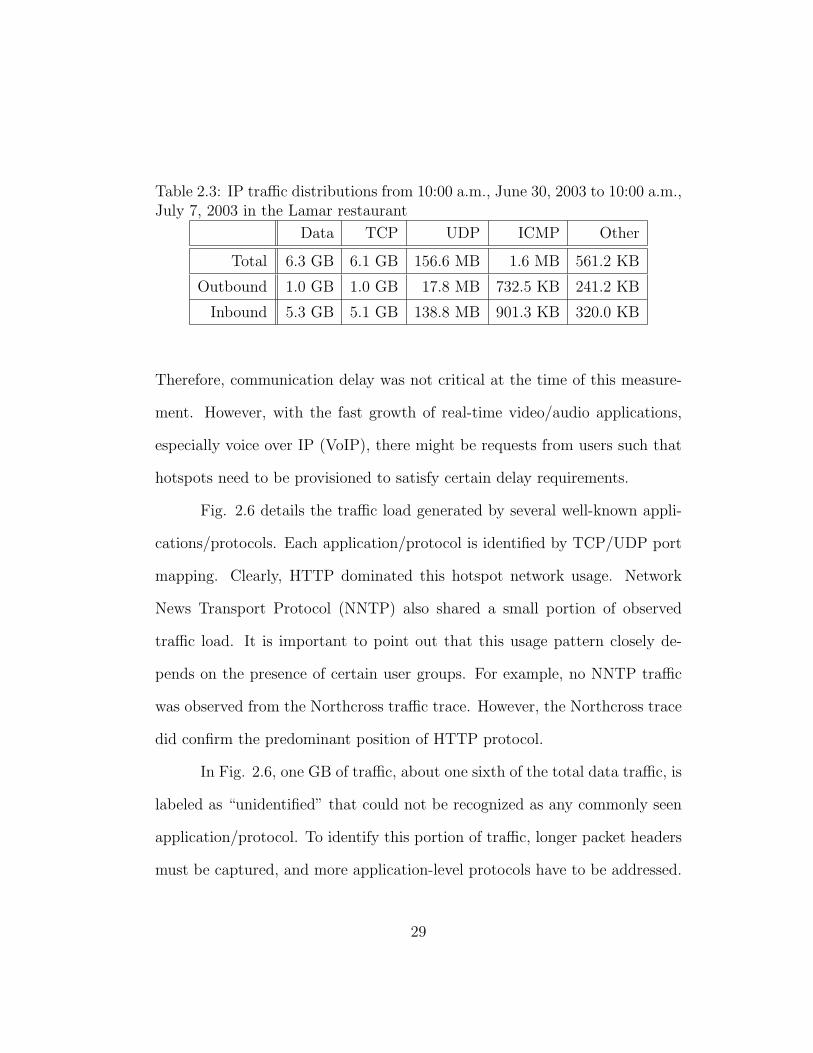
Table 2.3: IP traffic distributions from 10:00 a.m., June 30, 2003 to 10:00 a.m.,July 7, 2003 in the Lamar restaurant
Data TCP UDP ICMP Other
Total 6.3 GB 6.1 GB 156.6 MB 1.6 MB 561.2 KB
Outbound 1.0 GB 1.0 GB 17.8 MB 732.5 KB 241.2 KB
Inbound 5.3 GB 5.1 GB 138.8 MB 901.3 KB 320.0 KB
Therefore, communication delay was not critical at the time of this measure-
ment. However, with the fast growth of real-time video/audio applications,
especially voice over IP (VoIP), there might be requests from users such that
hotspots need to be provisioned to satisfy certain delay requirements.
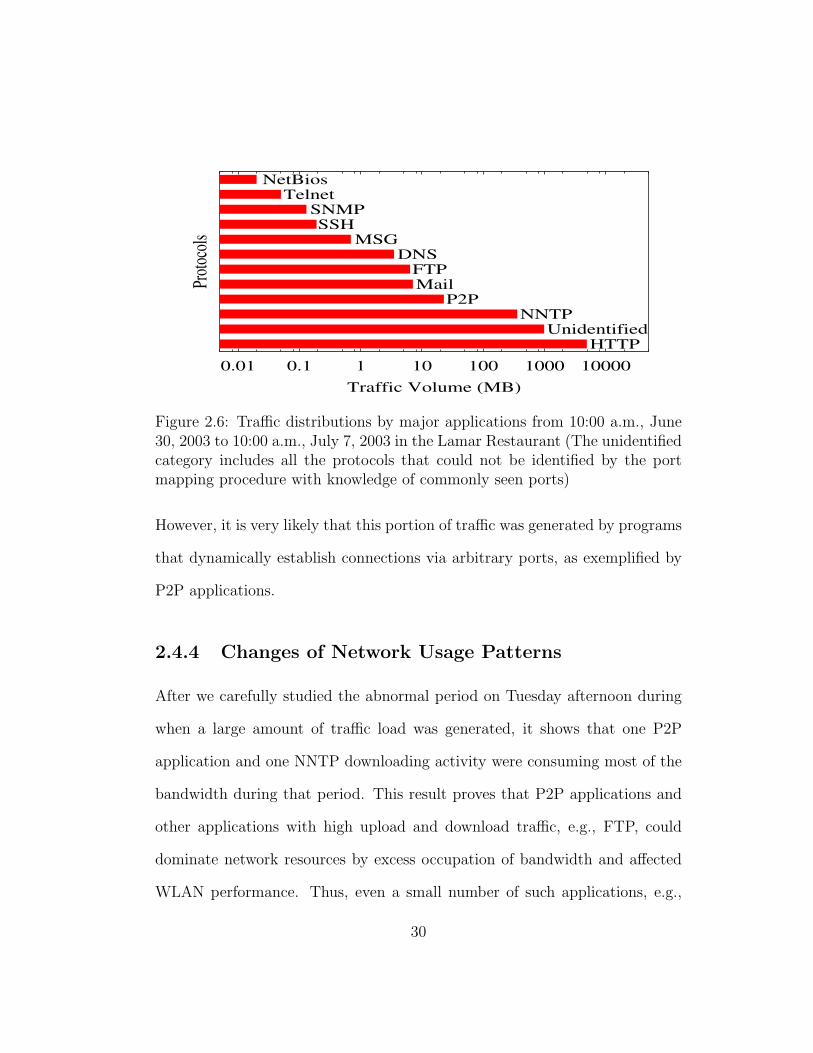
Fig. 2.6 details the traffic load generated by several well-known appli-
cations/protocols. Each application/protocol is identified by TCP/UDP port
mapping. Clearly, HTTP dominated this hotspot network usage. Network
News Transport Protocol (NNTP) also shared a small portion of observed
traffic load. It is important to point out that this usage pattern closely de-
pends on the presence of certain user groups. For example, no NNTP traffic
was observed from the Northcross traffic trace. However, the Northcross trace
did confirm the predominant position of HTTP protocol.
In Fig. 2.6, one GB of traffic, about one sixth of the total data traffic, is
labeled as “unidentified” that could not be recognized as any commonly seen
application/protocol. To identify this portion of traffic, longer packet headers
must be captured, and more application-level protocols have to be addressed.
29
0.01 0.1 1 10 100 1000 10000
Proto
cols
Traffic Volume (MB)
HTTPUnidentified
NNTPP2P
MailFTP
DNSMSG
SSHSNMP
TelnetNetBios
Figure 2.6: Traffic distributions by major applications from 10:00 a.m., June30, 2003 to 10:00 a.m., July 7, 2003 in the Lamar Restaurant (The unidentifiedcategory includes all the protocols that could not be identified by the portmapping procedure with knowledge of commonly seen ports)
However, it is very likely that this portion of traffic was generated by programs
that dynamically establish connections via arbitrary ports, as exemplified by
P2P applications.
2.4.4 Changes of Network Usage Patterns
After we carefully studied the abnormal period on Tuesday afternoon during
when a large amount of traffic load was generated, it shows that one P2P
application and one NNTP downloading activity were consuming most of the
bandwidth during that period. This result proves that P2P applications and
other applications with high upload and download traffic, e.g., FTP, could
dominate network resources by excess occupation of bandwidth and affected
WLAN performance. Thus, even a small number of such applications, e.g.,
30
one or two, may overwhelm the hotspot over a period of time. Therefore, it is
important to have an autonomous control mechanism that adapts to WLAN
dynamics and allocates resources fairly.
Interestingly enough, among the top sites with high inbound or out-
bound traffic volume, a non-trivial portion of them were not registered for
commercial use. Our traffic trace data show that the emerging mechanisms
that dynamically support direct communications between any two comput-
ers on the Internet, e.g., P2P protocols, played important roles in generating
traffic among these computers. Besides this portion of unregistered sites, web-
based email, on-line auction, on-line gaming, and NNTP news reading sites
were among the mostly visited Internet places by users from this hotspot.
We believe it is important to realize that the Internet is gradually
changing. First, more applications are moving away from the traditional
client/server architecture, in which a small amount of centralized servers serve
a large amount of clients. Nowadays, service models are more distributed.
Any computer connected to the Internet could easily provide services, e.g.,
file sharing, to the others. Second, more real-time applications will appear,
which request lower delay and/or higher throughput. WLANs, as convenient
extensions of the Internet, inevitably will experience both changes. Therefore,
WLAN traffic statistics will definitely change accordingly. Further, distinct
from wired networks, in which the communication media are relatively reli-
able and almost static, WLAN operates on less reliable RF channels that are
inherently shared and time varying [50, 34]. Hence, WLAN traffic statistics
31
would further be affected by the RF transmission characteristics. This influ-
ence needs to be addressed as well. So, WLAN traffic statistics will continue
being an interesting topic to study.
2.5 Achievable Throughput Measurements
This section focuses on the relationship between application-level throughput
and signal-to-noise ratio (SNR) in IEEE 802.11b based WLANs. A WLAN
user experiences different levels of SNR and throughput as he or she moves
from place to place.
2.5.1 Empirical IEEE 802.11b Throughput Models
The empirical model in [52] can predict SNR at a WLAN receiver based on
site-specific information, such as building layouts, obstacles, and antenna char-
acteristics. Similar models have been widely used in the cellular industry for
propagation predictions. However, in order to predict throughput, a model to
map SNR to throughput is needed.
In [27], Henty used a single software tool LANFielder to obtain SNR
and throughput. He was the first to establish an SNR-throughput mapping
model. A general trend of the measured data is that throughput increases as
SNR increases. The measured data also shows that throughput reaches some
saturation level when SNR goes beyond a critical threshold. Henty proposed
two reasonable models, exponential and piecewise models, to fit the measured
32

data. Two such models, exponential and piecewise models, were proposed in
[27].
The piecewise model is:
T =
Tmax , SNR > SNRc
Ap × (SNR− SNR0) , SNR ≤ SNRc
(2.1)
The two lines of (2.1) intersect at SNRc, which can be obtained using
(2.2).
SNRc =TmaxAp
+ SNR0 (2.2)
The exponential model could be expressed as:
T = Tmax(1− e−Ae×(SNR−SNR0)
)(2.3)
T is throughput. Tmax, SNR0, SNRc, and Ap/Ae are constants that are vendor
and application specific. Tmax is the throughput saturation level which results
from the SNR going beyond the critical threshold SNRc. SNR0 is the SNR
where throughput is zero. In the piecewise model of (2.1), Ap is the slope of
the line when SNR ≤ SNRc. In the exponential model of (2.3), Ae describes
the rate at which the throughput reaches saturation. In ideal, i.e., high SNR,
circumstances, Tmax is the throughput that the WLAN system will provide.
In circumstances in which SNR is low, SNRc, SNR0, and Ap/Ae are used to
predict throughput. Models (2.1) and (2.3) both have three constants2, which
can be determined by applying minimum mean square error (MMSE) curve-
fitting algorithm on measured data, as introduced in the following subsection.
2There are four constants in the piecewise model, but one of them is linearly dependenton the other three.
33
2.5.2 Curve-fitting Algorithm
This subsection describes the algorithm used in this chapter to fit (2.1) and
(2.3) to 792 measurements. First, the algorithm is performed over the 264
measurements from each of the three restaurants. Second, all 792 measure-
ments are fed into the curve-fitting algorithm. The algorithm takes inputs
from an array of SNR and throughput measurements, and outputs three pa-
rameters, Tmax, SNRc, and SNR0 for the piecewise model of (2.1), and Tmax,
Ae, and SNR0 for the exponential model of (2.3). The steps to calculate the
three parameters are different in each case, as explained below.
Piecewise
A wireless link with strong SNR should be highly reliable. The measured
data show that the throughput values measured at strong SNR are high with
little fluctuation. Thus, we averaged the strongest 15% of all measurements3
to determine the saturation level Tmax. Over the lower 85% of the measured
data, we ran a MATLAB function polyfit. This function uses a line to fit data
using MMSE and reports the slope Ap and the x-intercept SNR0. Finally,
SNRc can be obtained using (2.2).
3 Fifteen percent was chosen so that a statistically obvious decline of throughput existsbetween the higher 15% and the lower 85% of data, as quantified by the variation coefficient.Variation coefficient, ranging from 0 to 1, is a widely-used statistical figure to gauge thefluctuation degree of a data set, and is defined as Sx/x, where Sx is the standard deviationof a set of throughput, and x its mean. An upper bracket of more than 15% produces avariation coefficient rapidly exceeding 0.1, and thus indicates a throughput drop.
34

Exponential
The MATLAB function nlinfit estimates the coefficients of a nonlinear function
using MMSE; therefore it is suitable for fitting the exponential model. We ran
nlinfit to determine the three parameters Tmax, Ae, and SNR0. Occasionally,
nlinfit makes SNR0 a large negative number (e.g. −10 ∼ −15). Such a
negative value violates the intuition that throughput is small when SNR is
below zero. In the case that nlinfit generates SNR0 ≤ −5 (The number ’-
5’ was chosen by trial and error), the parameter SNR0 should be set as the
value obtained from the piecewise model. Then, Tmax and Ae are determined
by nlinfit based on the fixed SNR0.
2.5.3 Measurement Results and Fit Curves
The work in this section builds upon early results from [27] and includes stud-
ies that are much more extensive in nature. The throughput-measurement
software programs, Iperf, wget, and LANFielder, constitute a diverse collec-
tion of applications, serving as measurement tools and application types to
explore user traffic characteristics, thus providing a better understanding of
network performance. Though models proposed in [27] were only based on
data from LANFielder, we found it to be extendable to Iperf and FTP. This
extension is a major contribution of this section.
Fig. 2.7 and 2.8 show the measured data from the Guadalupe, Parmer,
and Northcross restaurants with piecewise and exponential curve-fitting, where
35
Cisco and ORiNOCO cards are used respectively in the two figures. In each
figure, part (d) puts together the measurement data of all three restaurants.
Table 2.6 and Table 2.7 show the statistics of the two models shown in
(2.1) and (2.3), whereas Table 2.4 and Table 2.5 show their parameters. Both
models were evaluated by mean error µ, standard deviation σ, and correlation
coefficient R. Both models produce curves with correlation coefficients over
80% in two restaurants and over 70% in the other, which indicates the high
integrity of the curve-fitting algorithm.
As can be seen from Fig. 2.7 and Fig. 2.8, the spatially-averaged data
have stronger correlations than the un-averaged data. That is because spatial
averaging is essentially a low-pass filter and eliminates deviated data points.
Therefore, This technique may be used to estimate throughput before deploy-
ment.
2.5.4 A Summary of Measured Data Trends
The data analysis fits (2.1) and (2.3) to model the measured data, as well as the
error between measurements and the model. Below are several measurement-
based observations that summarize throughput studies for IEEE 802.11b sys-
tems.
Saturation Level Tmax of (2.1) and (2.3)
In most cases, the Cisco card has a higher saturation level Tmax than the
ORiNOCO card. This hardware-specific characteristic may be caused by the
36
0 20 40 600
1
2
3
4
5
6
SNR (dB)
Thro
ughp
ut (M
bps)
SNR (dB)SNR (dB)SNR (dB)
IPERF ⋅
SNR (dB)
FTP ×
SNR (dB)
LANFielder +
(a) Guadalupe
0 20 40 600
1
2
3
4
5
6
SNR (dB)Th
roug
hput
(Mbp
s)SNR (dB)SNR (dB)SNR (dB)
IPERF ⋅
SNR (dB)
FTP ×
SNR (dB)
LANFielder +
(b) Parmer
0 20 40 600
1
2
3
4
5
6
SNR (dB)
Thro
ughp
ut (M
bps)
SNR (dB)SNR (dB)SNR (dB)
IPERF ⋅
SNR (dB)
FTP ×
SNR (dB)
LANFielder +
(c) Northcross
0 20 40 600
1
2
3
4
5
6
SNR (dB)
Thro
ughp
ut (M
bps)
SNR (dB)SNR (dB)SNR (dB)
IPERF ⋅
SNR (dB)
FTP ×
SNR (dB)
LANFielder +
(d) All three restaurants
Figure 2.7: Measurement results at Schlotzsky’s restaurants using Cisco card(dotted line: piecewise model; solid line: exponential model)
37
0 20 40 600
1
2
3
4
5
6
SNR (dB)
Thro
ughp
ut (M
bps)
SNR (dB)SNR (dB)SNR (dB)
IPERF ⋅
SNR (dB)
FTP ×
SNR (dB)
LANFielder +
(a) Guadalupe
0 20 40 600
1
2
3
4
5
6
SNR (dB)Th
roug
hput
(Mbp
s)SNR (dB)SNR (dB)SNR (dB)
IPERF ⋅
SNR (dB)
FTP ×
SNR (dB)
LANFielder +
(b) Parmer
0 20 40 600
1
2
3
4
5
6
SNR (dB)
Thro
ughp
ut (M
bps)
SNR (dB)SNR (dB)SNR (dB)
IPERF ⋅
SNR (dB)
FTP ×
SNR (dB)
LANFielder +
(c) Northcross
0 20 40 600
1
2
3
4
5
6
SNR (dB)
Thro
ughp
ut (M
bps)
SNR (dB)SNR (dB)SNR (dB)
IPERF ⋅
SNR (dB)
FTP ×
SNR (dB)
LANFielder +
(d) All three restaurants
Figure 2.8: Measurement results at Schlotzsky’s restaurants using ORiNOCOcard (dotted line: piecewise model; solid line: exponential model)
38

Table 2.4: Parameters of the piecewise models. (’C’ and ’O’ stand for Ciscoand ORiNOCO cards, respectively. ’Gua’, ’Par’, ’Nor’, and ’All’ stand for theGuadalupe, Parmer, Northcross, and all three restaurants, respectively.)
Tmax (Mbps) SNRc (dB) SNR0 (dB)C O C O C O
Iperf Gua 4.67 4.33 17.0 29.0 5.92 0.523Par 4.73 4.32 26.6 36.2 6.16 -4.02Nor 4.61 4.48 23.1 24.9 9.99 6.00All 4.66 4.27 23.2 27.4 4.75 2.13
FTP Gua 3.69 3.64 21.5 22.6 10.3 4.06Par 3.96 3.46 31.2 29.6 8.86 -6.61Nor 3.92 3.58 26.6 23.2 12.0 6.79All 3.84 3.50 26.4 21.9 10.2 4.46
LANFielder Gua 1.55 1.35 20.0 17.7 6.93 -0.13Par 1.49 1.29 24.0 16.1 -0.9 4.43Nor 1.99 1.94 22.5 24.0 13.3 4.25All 1.61 1.37 22.6 26.7 6.84 -10.1
different designs of the two cards. However, the ORiNOCO card did per-
form well in environments with low SNR. One can not conclude Cisco cards
outperform ORiNOCO cards based on Tmax value alone.
Tmax is also application-specific because each application uses differ-
ent protocols (such as FTP, TCP, and UDP). However, Tmax may not be
site-specific because Table 2.4 shows similar Tmax values at several distinct
measuring sites. This observation partially proves that SNR is an important
factor to characterize channel conditions for IEEE 802.11b WLAN systems,
regardless of location.
39
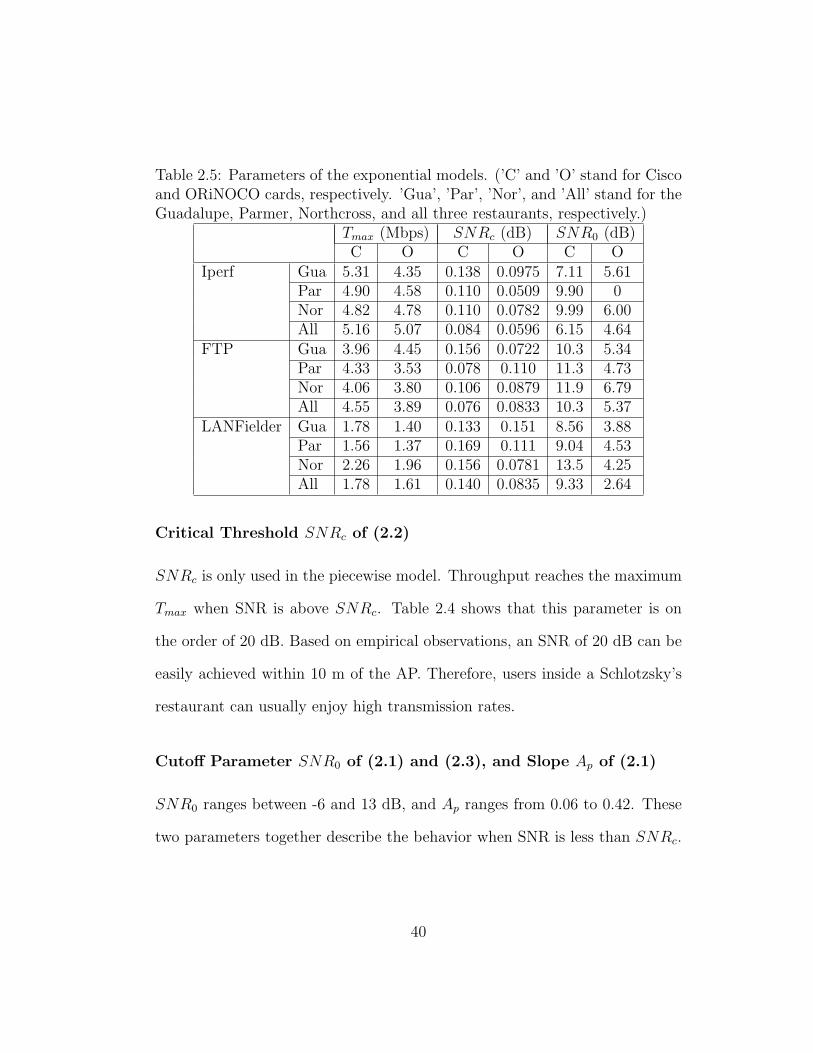
Table 2.5: Parameters of the exponential models. (’C’ and ’O’ stand for Ciscoand ORiNOCO cards, respectively. ’Gua’, ’Par’, ’Nor’, and ’All’ stand for theGuadalupe, Parmer, Northcross, and all three restaurants, respectively.)
Tmax (Mbps) SNRc (dB) SNR0 (dB)C O C O C O
Iperf Gua 5.31 4.35 0.138 0.0975 7.11 5.61Par 4.90 4.58 0.110 0.0509 9.90 0Nor 4.82 4.78 0.110 0.0782 9.99 6.00All 5.16 5.07 0.084 0.0596 6.15 4.64
FTP Gua 3.96 4.45 0.156 0.0722 10.3 5.34Par 4.33 3.53 0.078 0.110 11.3 4.73Nor 4.06 3.80 0.106 0.0879 11.9 6.79All 4.55 3.89 0.076 0.0833 10.3 5.37
LANFielder Gua 1.78 1.40 0.133 0.151 8.56 3.88Par 1.56 1.37 0.169 0.111 9.04 4.53Nor 2.26 1.96 0.156 0.0781 13.5 4.25All 1.78 1.61 0.140 0.0835 9.33 2.64
Critical Threshold SNRc of (2.2)
SNRc is only used in the piecewise model. Throughput reaches the maximum
Tmax when SNR is above SNRc. Table 2.4 shows that this parameter is on
the order of 20 dB. Based on empirical observations, an SNR of 20 dB can be
easily achieved within 10 m of the AP. Therefore, users inside a Schlotzsky’s
restaurant can usually enjoy high transmission rates.
Cutoff Parameter SNR0 of (2.1) and (2.3), and Slope Ap of (2.1)
SNR0 ranges between -6 and 13 dB, and Ap ranges from 0.06 to 0.42. These
two parameters together describe the behavior when SNR is less than SNRc.
40
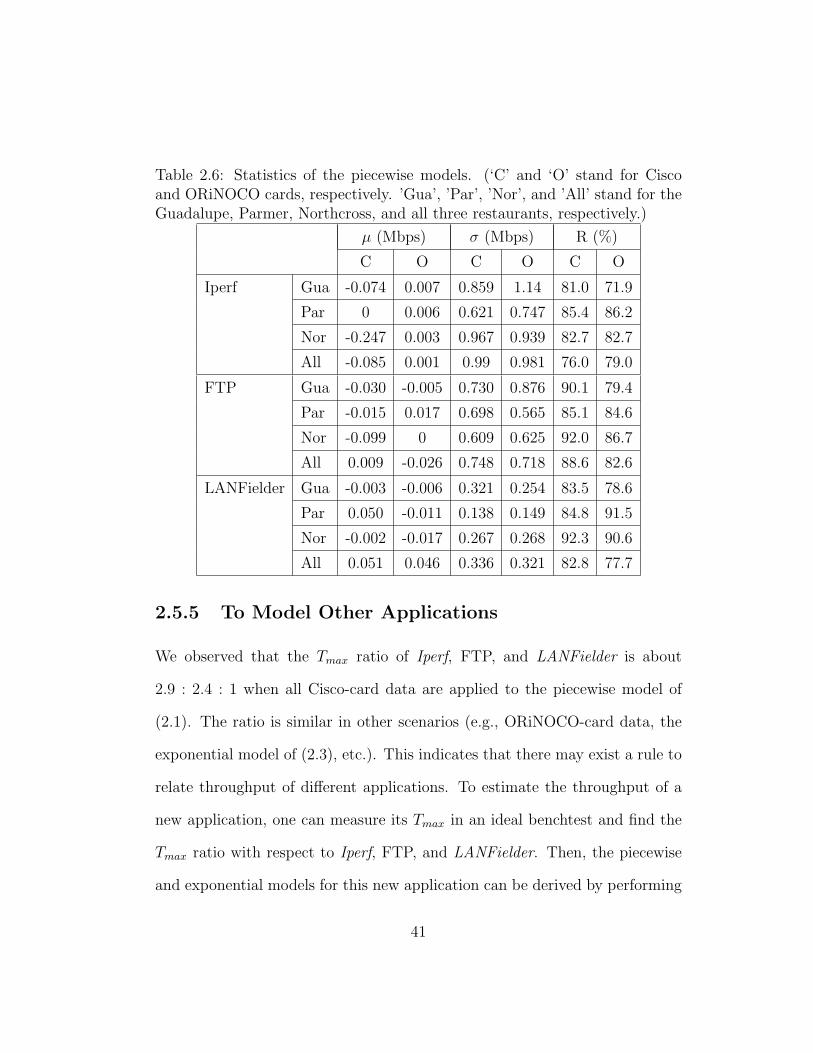
Table 2.6: Statistics of the piecewise models. (‘C’ and ‘O’ stand for Ciscoand ORiNOCO cards, respectively. ’Gua’, ’Par’, ’Nor’, and ’All’ stand for theGuadalupe, Parmer, Northcross, and all three restaurants, respectively.)
µ (Mbps) σ (Mbps) R (%)
C O C O C O
Iperf Gua -0.074 0.007 0.859 1.14 81.0 71.9
Par 0 0.006 0.621 0.747 85.4 86.2
Nor -0.247 0.003 0.967 0.939 82.7 82.7
All -0.085 0.001 0.99 0.981 76.0 79.0
FTP Gua -0.030 -0.005 0.730 0.876 90.1 79.4
Par -0.015 0.017 0.698 0.565 85.1 84.6
Nor -0.099 0 0.609 0.625 92.0 86.7
All 0.009 -0.026 0.748 0.718 88.6 82.6
LANFielder Gua -0.003 -0.006 0.321 0.254 83.5 78.6
Par 0.050 -0.011 0.138 0.149 84.8 91.5
Nor -0.002 -0.017 0.267 0.268 92.3 90.6
All 0.051 0.046 0.336 0.321 82.8 77.7
2.5.5 To Model Other Applications
We observed that the Tmax ratio of Iperf, FTP, and LANFielder is about
2.9 : 2.4 : 1 when all Cisco-card data are applied to the piecewise model of
(2.1). The ratio is similar in other scenarios (e.g., ORiNOCO-card data, the
exponential model of (2.3), etc.). This indicates that there may exist a rule to
relate throughput of different applications. To estimate the throughput of a
new application, one can measure its Tmax in an ideal benchtest and find the
Tmax ratio with respect to Iperf, FTP, and LANFielder. Then, the piecewise
and exponential models for this new application can be derived by performing
41

Table 2.7: Statistics of the exponetial models. (‘C’ and ‘O’ stand for Ciscoand ORiNOCO cards, respectively. ’Gua’, ’Par’, ’Nor’, and ’All’ stand for theGuadalupe, Parmer, Northcross, and all three restaurants, respectively.)
µ (Mbps) σ (Mbps) R (%)
C O C O C O
Iperf Gua 0 0 0.847 1.06 81.5 76.3
Par 0 -0.045 0.633 0.817 84.8 85.0
Nor 0.02 -0.015 1.05 1.08 78.8 76.7
All 0 0 0.998 0.984 75.4 78.9
FTP Gua -0.1 0 0.795 0.870 88.2 79.8
Par 0 0 0.720 0.521 84.0 87.0
Nor 0.06 0.041 0.891 0.742 82.9 81.3
All 0 0 0.793 0.747 87.1 81.0
LANFielder Gua 0 0 0.325 0.247 83.0 79.9
Par 0 0 0.141 0.124 84.0 94.2
Nor 0 0.029 0.306 0.352 89.7 83.0
All 0 0 0.364 0.295 78.9 79.2
extrapolations or interpolations on the known results of the three software
tools. The obtained equations can serve as approximate throughput models
of the new application, and could be further verified by measurements.
2.6 Conclusion
In this chapter, measured WLAN traffic statistics and IEEE 802.11b through-
put prediction models are reported. The measurement campaign was con-
ducted on an operational IEEE 802.11b WLAN supported by Schlotzsky’s
42
Inc., in Austin, Texas in the summer of 2003. Out measurements showed that:
1. The measured WLAN traffic was highly asymmetric with high inbound
traffic, with a ratio of about 1 to 5.
2. On the network usage side, although file downloading and P2P appli-
cations sometimes generated high network demands, the majority of
WLAN users used HTTP protocol. However, real-time autonomous con-
trol of networks is necessary with growing usage of P2P applications.
3. Inbound packets and outbound packets sizes distributed very differently,
which is a result of the dominating usage of HTTP protocol.
4. Measurement data also showed that throughputs of IEEE 802.11b net-
works are well modeled by SNR. Two empirical models given by (2.1)
and (2.3) were derived from extensive field measurement data, and are
presented here as well. Both models are easy to formulate and provide
accurate throughput predictions.
We believe that the four measured WLANs presented here are repre-
sentative of modern hotspots, and that the traffic statistics and throughput
prediction models presented here could be applied to similar environments
and further extended for future WLANs. The throughput prediction mod-
els showed that a key to future WLAN deployment may be to use accurate
site-specific propagation algorithms for design
43

Chapter 3
WLAN Traffic Statistics:
Sub-second Time Scale Behavior
3.1 Introduction
The terminology “network traffic” has different meanings in different contexts.
For example, at the network layer and higher layers, traffic is often synony-
mous with throughput; at the link layer, traffic is typically mapped to link
layer packet flows. In spite of these various definitions, network traffic can be
represented by a random process which depends upon the end users, appli-
cations, protocols, and channels and generally presents an extremely complex
statistical structure.
Since the landmark paper [40] detailing the statistical characteristics of
Ethernet traffic, self-similarity (SS) and long-range dependency (LRD) have
44
been widely accepted in the literature to describe traffic statistical properties
over large time scales (above 1 second). SS/LRD shows that network traffic is
correlated over extended time of periods ranging up to several hours.
Despite the seemingly ubiquitous existence of SS/LRD observed in LAN
[40], WLAN [49], and WWW [15] traffic, a complete framework that is capable
of systematically estimating, verifying and demonstrating the significance of
SS/LRD from measured traffic traces has not been established [1], mostly
due to the lack of physical modeling [15, 64]. The lack of such a framework
[1] results in much debate about estimation and detection of LRD [35], and
about queueing performance with SS/LRD traffic [19, 26]. Nonetheless, the
concerned time scale of network traffic is well-established from measurements
[40], which ranges from several seconds up to several hours.
It has been shown that network traffic exhibits more complex statistical
structure at small time scales (generally are observation intervals of less than
1 second, sometimes called sub-second time scales). Feldmann et al. [20, 22]
first reported the small scale effects and suggested that network traffic might
possess a multifractal correlation structure at this small scale range from WAN
traffic traces. The multifractal structure was subsequently confirmed in [51].
The significance of this structure to network performance was investigated in
[18]. More recent work, however, argues that as traffic load increases, network
traffic is fairly uncorrelated or even Poisson-like at small scales [12, 67, 36].
Nonetheless, it is clear that the small scale correlation structure of network
traffic is vastly different from that at large scales.
45
Empirical studies [21] show that the transition from large scale to small
scale scaling in network traffic happens around the round trip time (RTT) of
TCP protocol. Because TCP can account for more than 90% of network traffic
load, as shown in Fig. 4 of [46], the characteristics of TCP are very likely to
dominates the factors affecting traffic structures. It is well known that TCP is
a close-loop protocol in which acknowledge packets are exchanged. Figueiredo
et al. [23] shows that TCP does not change traffic correlation structure below
one RTT period simply because the feedback delay is at least one RTT, and
therefore TCP sessions do not react to network changes below this time scale.
Recent traffic measurements [54] show that current TCP RTT on the Internet
is around the sub-second area. Therefore, it is reasonable to assume that
network traffic may be modeled using “small scale” scaling over the sub-second
observation interval.
In the process of modeling and analyzing network traffic, various math-
ematical tools have been developed. During the past several year, however,
wavelet based multi-resolution analysis (MRA) has become one of the most
popular and reliable tools in detecting and analyzing scaling effects at both
large and small time scales because wavelets are capable of “zooming” in on
both the time and frequency domain and revealing interesting characteristics
in the data. Abry and Veitch [3, 59] first used the wavelet spectrum to detect
SS/LRD in large scales. Recently, Zhang [67] and Jiang [33] proposed us-
ing wavelet spectrum to measure burstiness of network traffic at small scales.
Another compelling feature of wavelets is that the wavelet spectrum shares a
46

natural tie with power spectral density (PSD). In fact, the wavelet spectrum
could be used to estimate PSD [2], which also happens to be one of the central
elements in areas such as channel modeling. Therefore, because of the rich
literature of wavelets in network traffic research, and because of the direct
physical meaning associated between wavelet spectrum and PSD, we adopt
wavelet spectrum as the analyzing tool in this research.
[20], is decided by the well-known self-similar scaling law. The goal of
this chapter is to verify the WLAN traffic large scale properties, and more
importantly, to identify sub-second scale characteristics of WLAN traffic. The
chapter is organized as follows. Section 3.2 introduces background of mathe-
matical tools, especially wavelet analysis, and the relationship between wavelet-
based spectrum analysis and classic power spectrum density. Section 3.3
describes the measurement setup. Section 3.4 presents wavelet-based IEEE
802.11b traffic analysis results in small time scales.
3.2 Spectrum Analysis and Wavelets
This section describes spectrum analysis and wavelet transforms, and their
applications in traffic and channel characterizations.
3.2.1 Classic Spectrum Estimation
Autocorrelation in the time domain or power spectral density in the frequency
domain, reveal second-order statistics of random processes, and play impor-
47

tant roles in analyzing and modeling physical phenomena, e.g., communication
system analysis and radio signal processing. Therefore, efficient and accurate
estimation of second-order statistics is extremely important in practice Clas-
sical estimation approaches of second-order statistics include:
1. Time domain estimation
2. Frequency domain estimation
3. Parametric model based estimation
The last approach, the parametric estimation approach, generally assumes
system models in prior and estimates model coefficients using system identi-
fication techniques. For our network traffic and wireless channel applications,
however, it is desirable to fully understand traffic and channel properties both
in time and frequency domains. Therefore, the first two approaches are chosen
in this research. In the following discussion, we also assume that the random
processes (time series) involved are wide-sense stationary (WSS) processes.
Time Domain Estimation
Blackman and Tukey [11] proposed time domain spectrum estimation. This
classical approach estimates power spectrum and cross-spectrum via the Fourier
transformation of autocorrelation and cross-correlation functions, respectively.
Although several variations of the method have been proposed, the basic idea,
especially in regards to the bias and convergence of estimations, remains the
same.
48

Let Cx(τ) and Cxy(τ), τ ∈ {−T,−T + 1, . . . , 0, . . . , T − 1, T}, be the
estimated second-order auto and cross moments of a discrete time series x(t)
and y(t). By the definition of power spectrum density, the estimated spectra
of the time series of interest are:
Sx(ω) =T∑
τ=−T
Cx(τ) ejωτ (3.1)
Sxy(ω) =T∑
τ=−T
Cxy(τ) ejωτ (3.2)
where Sx and Sxy are the estimated power spectrum and cross power spectrum
of the time series.
Now assume that the true autocorrelation and cross-correlation of the
time series are Cx(τ) and Cxy(τ). Given a windowing function w(τ):
w(τ) =
1,−T ≤ τ ≤ T
0, otherwise
(3.3)
The estimated spectra can be rewritten as:
Sx(ω) =∞∑
τ=−∞
w(τ)Cx(τ) ejωτ (3.4)
Sxy(ω) =∞∑
τ=−∞
w(τ)Cxy(τ) ejωτ (3.5)
Clearly in the frequency domain, the estimated power spectrum is given by
multiply the actual power spectrum by the transfer function of the windowing
49
function:
Sx(ω) = W (ω) ∗ Sx(ω) (3.6)
Sxy(ω) = W (ω) ∗ Sxy(ω) (3.7)
where Sx(ω) and Sxy(ω) are the true power spectrum and cross power spectrum
of the time sequences, and W (ω) is the Fourier transform of the windowing
function w(τ). This expression reveals the bias due to the convolution opera-
tion of the estimated spectrum.
In practice, there are only limit number of samples in the discrete time
series. Therefore, only a limited number of samples can be used to estimate the
correlation. Let M denote the number of different sequences used to estimate
Cx and Cxy. Clearly, the length of the correlation period T depends on the
value of M as well. Naidu [47] shows that the quality of the time domain
spectrum estimators, i.e., the mean and the variance of the estimators, is
determined by M and T :
E[Sx(ω)] =M−1∑k=0
W (2πk
M)Sx(ω −
2πk
M) (3.8)
E[Sxy(ω)] =M−1∑k=0
W (2πk
M)Sxy(ω −
2πk
M) (3.9)
and the variances:
Var[Sx(ω)] =M−1∑k=0
W 2(2πk
M)S2
x(ω −2πk
M) (3.10)
Var[Sxy(ω)] =M−1∑k=0
W 2(2πk
M)S2
xy(ω −2πk
M) (3.11)
50
In the ideal case, the estimation is unbiased if the windowing function has
infinite length. If both the true spectrum of the time series and the spectrum
of the windowing function are smooth, however, the spectrum estimation can
still be high quality. For example, let us assume Sx(ω) and Sxy(ω) are two flat
functions, and let us further suppose W (2πkM
) = 1M, k ∈ {0, . . . ,M − 1}. Given
limited number of samples, the variances are [47]:
VarSx(ω) =T
MS2x(ω) (3.12)
VarSxy(ω) =T
MS2xy(ω) (3.13)
Clearly, the variances are inversely proportional to the value of M , the number
of sequences to calculate the ensemble averages, and proportional to the length
of the windowing function. Hence, there is always a trade-off in choosing M
and T in practice to use the time domain spectrum estimation efficiently.
Frequency Domain Estimation
Welch [62] contributed a framework of frequency domain estimation, and sub-
sequently, frequency domain estimation methods became very popular because
of the discovery of fast Fourier transform (FFT). In the frequency domain, the
power spectrum and cross spectrum are estimated by [62]:
Sx(k) = limT→∞
1
TE[X(k)X∗(k)] (3.14)
Sxy(k) = limT→∞
1
TE[X(k)Y ∗(k)] (3.15)
where X(k) represents the Fourier transform of the time series x(t). Similar
to windowing operation in the time domain approach, The mean and variance
51

of the estimated power spectrum can be represented by [47]
E[Sx(2πk
T)] =
1
2π
∫ π
−πSx(
2πk
N− ω)
W 2(ω)
Ndω (3.16)
E[Sxy(2πk
T)] =
1
2π
∫ π
−πSxy(
2πk
N− ω)
W 2(ω)
Ndω (3.17)
and for the variance:
Var[Sx(2πk
T)] ≈ 1
2π
∫ π
−π
S2x(ω)
M
W 4(2πkN− ω)
N2dω (3.18)
Var[Sxy(2πk
T)] ≈ 1
2π
∫ π
−π
S2xy(ω)
M
W 4(2πkN− ω)
N2dω (3.19)
Welch [62] showed that frequency domain estimations are capable of achieving
similar results as the time domain approach. However, since the discovery
of the Fast Fourier Transform, the frequency domain approach became more
popular.
3.2.2 Wavelet Transforms and Wavelet Spectrum
In wavelet domain, the wavelet spectrum is the metric to analyze the cor-
relation structure of time series [41]. Similar to the Fourier transform that
decomposes signals into weighted sums of sinusoid basis functions, the wavelet
transform dissects signals into combinations of “little waves”, i.e., wavelets
[16]. By dilating and shifting the wavelet, wavelet transforms can localize the
analyzed signal both at time and frequency domains, which is often a much
desired feature. Moreover, with properly selected wavelets, wavelet trans-
forms are very effective in eliminating deterministic trend that often occurs
52

in network traffic traces [2]. Because of the desirable properties of wavelets,
the wavelet transform and wavelet spectrum have become the most widely
used tool in network traffic literature [1]. Therefore, it is advantageous to
use wavelets analyzing WLAN traffic using in order to compare with previous
traffic study results.
3.2.3 A Brief Introduction of Wavelets
Let a real-valued function ψ(t) ∈ L2(t), i.e., ||ψ||2 =∫ +∞−∞ |ψ(t)|2 dt < ∞, be
the analyzing wavelet that satisfies the admissibility condition
Cψ = 2π
∫ +∞
−∞
|Ψ(ω)|2
ω<∞ (3.20)
where Ψ(ω) is the Fourier transform of ψ(t). From the admissibility condition,
it is obvious that∫ +∞−∞ ψ(t) = 0, and therefore, ψ(t) oscillates, i.e., that ψ(t) is
a little wave, or wavelet. Consider the function family generated by dilating
and shifting of the wavelet ψ(t):
ψa,b(t) = |a|−1/2ψ
(t− b
a
)(3.21)
ψa,b(t), a, b ∈ R are defined such that their energy is constant for all. Moreover,
from properties of the Fourier transform,
Ψ(ω) =a√|a|e−jωbΨ(ω) (3.22)
The continuous wavelet transform for a finite energy signal f(t) ∈ L2(t) is now
defined as:
Wa,b =
∫ +∞
−∞f(t)ψa,b dt (3.23)
53
and f(t) may be reconstructed by:
f(t) = C−1ψ
∫ +∞
−∞
∫ +∞
−∞Wa,b ψa,b(t) da db (3.24)
One intuitive way to relate the wavelet transform to the Fourier transform is
to assume that the wavelet φ(t) and its Fourier transform Ψ(ω) have finite
central moments t and ω,
t =1
||ψ||2
∫ +∞
−∞t|ψ(t)|2 dt (3.25)
ω =1
||Ψ||2
∫ +∞
−∞ω|Ψ(ω)|2 dω (3.26)
Therefore, by shifting and dilating, the wavelet coefficients Wa,b mostly repre-
sent information about signal f(t) at time instant at+ b and frequency ω/a.
The variance of the wavelet coefficients indexed by the scale parameter
b is defined as wavelet spectrum Ia:
Ia = E[|Wa,b|2
]∀b (3.27)
It has been shown [41] that the wavelet spectrum uniquely characterizes the
second-order statistics, e.g., auto-covariance function (ACF) in the time do-
main or power spectral density (PSD) in the frequency domain, of stationary
or long-memory random processes at different scales in the way that the clas-
sic Fourier analysis does at different frequencies. Moreover, as illustrated in
(3.25) and (3.26), the corresponding relationship between dilation scales and
frequencies are clearly identified and intuitive from an engineering point of
54

view. In fact, Abry and Veitch [3] shows that the wavelet spectrum defined in
(3.27) is a useful PSD estimator, and this estimator has been widely used in
network traffic study since 1998.
It is worth noting that the wavelet spectral estimator still suffers from a
convolutional bias due to the wavelet windowing effect, similar to the windowed
spectrum estimators in time domain or frequency domain. However, because
of the localization properties of the wavelet ψ(t) in both time and frequency
domains, the intuition brought forth by wavelets analysis is far more helpful
in understanding the signals or time series under study.
3.2.4 Scaling Analysis of Network Traffic Using Wavelets
The notations used in this section follow the definitions used in [3].
A random process that fully captures characteristics of network traffic
traces needs to be defined in continuous time as a general random process
Xt, t ∈ R+. A discrete version of the general traffic Wδ,n, n ∈ Z+ is also
defined and δn is the digitizing granularity. Similar processes can be defined
on the packet level. For example, if the random process Pt, t ∈ R+ is defined as
the frame arrival process, the corresponding discrete packet counting process
can be defined as Cδ,n.
The above defined processes are correlated but by no means equivalent.
They present different aspects of the captured traffic. For example, the paper
[3] shows that the discretized processes preserve statistic properties of original
processes over time scales beyond the aggregation unit δ. Therefore, it is
55

adequate to conduct analysis on the discrete processes so long as the time
granularity δ chosen to be smaller than the time scales.
Large Time Scale Scaling: SS/LRD
Recently pioneered by Leland et. al. [40], researchers have started to study the
statistical characteristics of network traffic, e.g., Ethernet, Internet backbone,
and web server traffic. Leland, Taqqu, Willinger and Wilson showed [40] that
aggregated Ethernet traffic is self-similar at different time scales. We now give
a brief introduction to the so called self-similar property.
Let x = (x(t) : t = 0, 1, . . .) be a discrete wide-sense stationary stochas-
tic process with constant mean µ = E[x] and finite variance σ2 = E[(x− µ)2].
Let r(k), k = 0, 1, 2, . . . be its autocorrelation function:
r(k) = E[(x(t)− µ)(x(t+ k)− µ)]/E[(x(t)− µ)2], (k = 0, 1, 2, . . .) (3.28)
If random process x is long-range dependent, the autocorrelation func-
tion r(k) decays slowly as k → ∞. Since the second-order statistic r(k)
captures the variance or burstiness of a stochastic process, an intuitive expla-
nation is that the burstiness is preserved at different time scale of a self-similar
stochastic process.
Following this ground-breaking work [40], researchers further investi-
gated traffic statistics at various network layers and showed the existence of
self-similarity in network traffic at almost every layer[63]. It is worth noting
that most network traffic research, i.e. [3], focused primarily on scaling be-
56
havior of the traffic process over a range of time scales typically from 1 second
and above.
Small Scale Scaling: Burstiness
The wavelet spectrum technique was used primarily for identifying LRD pro-
cesses at large time scales [3]. However, the complex nature of traffic at small
time scales requires more complete revealing of underlining multi-scale prop-
erties, and the wavelet spectrum could be easily extended to accommodate
the request. As introduced before, the wavelet spectrum reveals second-order
properties of random processes at all scales. Therefore, the wavelet spectrum
technique can be applied directly to detect details of traffic at small time scales
[32].
3.3 Measurement Setup in a Campus Building
In this section, we describe the network structures, hardware configurations,
and software utilities used in measurements conducted in a campus building
at the University of Texas at Austin (UT-Austin).
3.3.1 Description of Measurement Sites
The ENS building in the UT-Austin campus is the home of the Electrical
and Computer Engineering Department. The ENS network provides wired
(Ethernet) and wireless (IEEE 802.11b) network services to faculty, staff, and
57
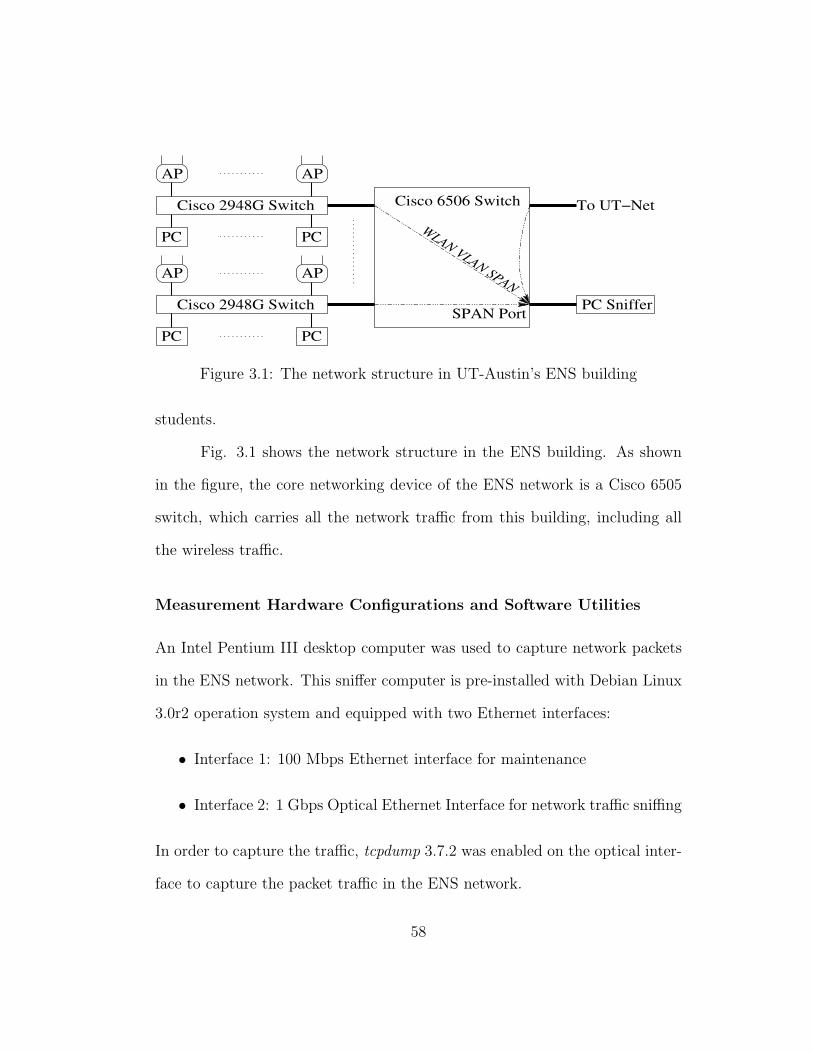
AP
PC
AP
PC
Cisco 2948G Switch
AP
PC
AP
PC
Cisco 2948G Switch
PC Sniffer
To UT−Net
WLAN VLAN SPAN
SPAN Port
Cisco 6506 Switch
Figure 3.1: The network structure in UT-Austin’s ENS building
students.
Fig. 3.1 shows the network structure in the ENS building. As shown
in the figure, the core networking device of the ENS network is a Cisco 6505
switch, which carries all the network traffic from this building, including all
the wireless traffic.
Measurement Hardware Configurations and Software Utilities
An Intel Pentium III desktop computer was used to capture network packets
in the ENS network. This sniffer computer is pre-installed with Debian Linux
3.0r2 operation system and equipped with two Ethernet interfaces:
• Interface 1: 100 Mbps Ethernet interface for maintenance
• Interface 2: 1 Gbps Optical Ethernet Interface for network traffic sniffing
In order to capture the traffic, tcpdump 3.7.2 was enabled on the optical inter-
face to capture the packet traffic in the ENS network.
58

On the Cisco switch side, Virtual Local Area Network (VLAN) [31]
technology is adopted for the ENS network. By design, the ENS network is
divided into several VLANs. In particular, all the WLAN traffic is grouped to
a single VLAN, while the Ethernet traffic is tagged into other VLANs.
The Switched Port Analyzer (SPAN) feature supported by the Cisco
switch enables a flexible and easy way to capture network traffic going through
the switch. During the traffic measurement campaign, the SPAN feature was
engaged on VLANs. Therefore every packet from one particular VLAN is
mirrored to the gigabit optical Ethernet port to which the sniffer computer
was attached. This measurement procedure is depicted in Fig. 3.1.
Combining the SPAN and VLAN techniques together, all the WLAN
traffic carried on the ENS network was mirrored packet-by-packet to the optical
interface of the sniffer computer. Therefore, tcpdump could capture all the
WLAN packets. Throughout this measurement, no WLAN packet was lost as
reported by tcpdump.
Considerations in Designing Measurement Procedures
The primary concern in capturing high-volume packet traffic on high-speed
links, i.e., gigabit Ethernet, is the limited processing speed of the sniffer com-
puter compared to the transmission rate of the traffic. It is very likely that
the sniffer device may not be able to handle the traffic, especially during peak
periods, and therefore dropping packets. In order to avoid the described situ-
ations from happening, we limited the capturing size of each Ethernet packet
59

to just include IP header information. The reduced capturing size increased
the capacity of the sniffer computer, and resulted zero packet loss during the
measurements as reported by tcpdump.
3.4 Scaling Analysis of ENS 802.11b Traffic
In this section, we apply the theory of wavelets in the analysis of IEEE 802.11b
traffic traces. Our approach is to identify the burstiness from the traffic traces,
and further compare it with the spectrum of the propagation channel. The
objective is to conduct physical modeling of WLAN traffic.
3.4.1 802.11b Traffic Traces Pre-processing
As seen from Fig. 3.1, all traffic traces were collected at the Ethernet links
between the APs and the Internet. Therefore, neither IEEE 802.11 control
messages, e.g., RTS/CTS, nor corrupted packets, e.g., dropped packets due to
collision, appear in the traces. To compare the spectra of the channel and the
WLAN traffic, only outbound traffic (from WLAN to the Internet) is studied
in order to identify impact that the radio channel has on traffic statistics.
Our traffic was captured in 2004 on the Internet. At the same period,
Shakkottai et. al. [54] showed that RTT distributions on the Internet are
almost exclusively concentrated above 10 ms time scales and peak around
100 ms and change very little. Based on the RTT range given in [54], the
discretized traffic traces used a 5 ms time window and should preserve almost
60
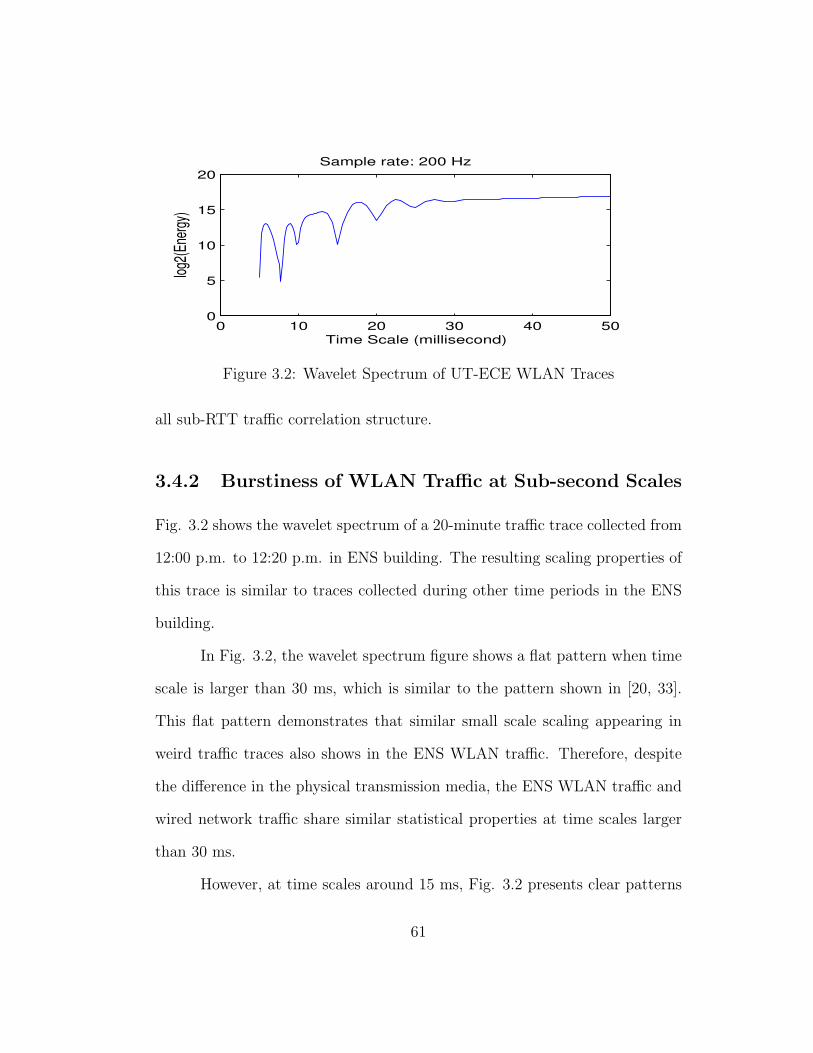
0 10 20 30 40 500
5
10
15
20
Time Scale (millisecond)
log2(E
nergy
)Sample rate: 200 Hz
Figure 3.2: Wavelet Spectrum of UT-ECE WLAN Traces
all sub-RTT traffic correlation structure.
3.4.2 Burstiness of WLAN Traffic at Sub-second Scales
Fig. 3.2 shows the wavelet spectrum of a 20-minute traffic trace collected from
12:00 p.m. to 12:20 p.m. in ENS building. The resulting scaling properties of
this trace is similar to traces collected during other time periods in the ENS
building.
In Fig. 3.2, the wavelet spectrum figure shows a flat pattern when time
scale is larger than 30 ms, which is similar to the pattern shown in [20, 33].
This flat pattern demonstrates that similar small scale scaling appearing in
weird traffic traces also shows in the ENS WLAN traffic. Therefore, despite
the difference in the physical transmission media, the ENS WLAN traffic and
wired network traffic share similar statistical properties at time scales larger
than 30 ms.
However, at time scales around 15 ms, Fig. 3.2 presents clear patterns
61
of fluctuations. For example, the wavelet spectrum of the ENS WLAN traffic
peaks around 13 ms and 18 ms while dips at 15 ms time scale. Similar phe-
nomena appear in all WLAN traffic traces collected from ENS building which
have not been reported in wired traffic study literature before. Hence, it is
very likely that the fluctuations in this range are peculiar to the ENS WLAN
networks.
It is interesting to realize that Doppler shifts cause radio channels fluc-
tuating around the sub-second time scales. Moreover, typical PSD of Doppler
shifts has very similar shape as the fluctuations observed from Fig. 3.2. Con-
sidering the intuitive mapping relation between wavelet spectrum and PSD, it
is very clear that Doppler shifts might be the mostly likely source of impact
that generates the fluctuations in Fig. 3.2.
Fig. 3.2 also shows that identifying time scales is the key to the con-
jecture. Communication networks, WLAN networks in particular, are very
complex systems, in which many factors, i.e., radio propagations, MAC, and
network protocols, combine together and influence the traffic traces. However,
each of these machineries has its own influential time scales and very likely
makes its impact apparent at certain time scales. From Fig. 3.2, we suspect
that the time scales around 15 ms might be the range in which the Doppler
shifts during radio transmission can be identified from traffic traces. Because
Doppler shifts are highly site-specific and motion sensitive, We design a new
measurement campaign in a controlled environment to verify this conjecture.
This portion of work is documented in next chapter.
62
3.5 Conclusions
In this chapter, we introduced the progress achieved in traffic studies with
focuses on corresponding analyzing tools. In particular, wavelet spectrum is
introduced and its relationship to PSD is established “intuitively”. By fol-
lowing the common practice in the traffic study literature, the captured ENS
WLAN traffic is analyzed by wavelet spectrum. The results reveal unusual
fluctuations in a specific time scales around 15 ms. By relating wavelet spec-
trum to PSD, we conjecture that the observed fluctuations around this time
scale might mainly be the result of Doppler shifts caused by motion during
radio transmissions. This observation has not been reported in previous traffic
or channel studies. Motivated by the observation, we further investigated the
impact of Doppler shifts during radio transmission to the upper networking
layers in the following chapter.
63
Chapter 4
Channel Characteristics:
Sub-second Time Scales
4.1 Introduction
In radio communications, modeling propagation channel has long been a cen-
tral part of research for developing PHY and MAC. Generally speaking, radio
propagations are hostile due to the combined effects of multipath propagations,
Doppler shifts, and intricate interactions between signals and environments
[50]. Because of the difficulties in modeling propagation phenomena, analysis
at the higher layers, e.g., the network layer and layers above, usually assumes
the wireless channel to be in “ideal”, less realistic states. In most cases, such
assumptions also allow simple mathematical modeling or computational feasi-
ble simulations of wireless communication systems. In Chapter 3 we identified
64
the unusual fluctuations in WLAN traffic traces at sub-second time scales. It
is interesting to further investigate the causes, which may be helpful in better
understanding the radio channel.
In the 1960s, Gilbert [25] pioneered the use of a Markov process to
model the generic communication channel and initiated the search for link layer
channel models. Essentially, Markov channel models provide a probability
value indicating the success rate of each data packet. Elliott [17] further
refined Gilbert’s Markov models and established the so called Gilbert-Elliott
channel models. Fritchman [24] extended the Gilbert-Elliott model to a more
general partitioned Markov framework.
Considerable effort has been made in the literature to verify, estimate or
improve the link layer channel model within the framework of Gilbert-Elliott
Markov models. A large portion of Markov channel models [60, 61, 58, 66]
are directly derived from analytical channel models, especially the Rayleigh
channel model [34]. However, Tan and Beaulieu [56] argued that first-order
Markov models have difficulty in matching radio propagation correlations even
from the analytical models. Also, analytical models such as Rayleigh models
should not be applied blindly to all wireless environments, as they do not
consider temporal correlations, and they do not properly describe the less
severe fadings in wideband channels. Therefore, a better approach is to build
the link layer models from site-specific channel measurements or models.
Swarts and Ferreira [55] verified the effectiveness of Markov character-
izations of digital fading mobile VHF channels via measurements. They used
65
an FM transmitter to transmit four digitally modulated signals, FSK @ 300
baud, DPSK @ 1200 baud, QPSK @ 1200 baud and 8-PSK @ 1600 baud, with
RF carrier frequency of 145.2 MHz. The estimated Fritchman Markov channel
models worked well with 8-PSK but had large discrepancies with FSK mod-
ulation. Clearly, this result indicates that it is very important to be cautious
when using link-layer channel models.
It is not a coincidence that constructing link layer channel models is
difficult and confusing. The complex channel propagation phenomena require
us to carefully study and understand the channel before starting to model it.
For example, flat-fading channel models, e.g. Rayleigh and Rayleigh-based
Markov models, should not be blindly used in frequency-selective fading envi-
ronments. Therefore, a thorough study of the temporal correlation structure at
the link layer from a generic radio propagation model is necessary for building
link layer channel models.
Multipath is a key factor that contributes to channel variations. The
time scales of multipath time dispersion is highly site-specific. For example,
typical indoor environments exhibit time dispersions (or echoes) on the order
of 10 ns to 1000 ns, while typical outdoor environments might have values up
to tens of microsecond [50]. Depending on environmental factors and trans-
mission characteristics, multipath can induce perceivable temporal correlation
structure for packet traffic.
Induced by relative movement of transmitters, receivers, or reflectors
in the physical channel, Doppler shift also generates channel fluctuations, but
66

typically at a much larger scale than typical multipath time dispersions. Chan-
nel coherence time is inversely proportional to Doppler shifts. Depending on
carrier frequencies and relative velocities, Doppler shifts are typical in the
range of tens to hundreds Hertz in current broadband networks. Therefore,
coherence time is on the order of ten to several hundreds of millisecond [50].
It is interesting to observe the fact that channel coherence time is lo-
cated in the range of time scales that exhibit complex scaling in traffic analysis,
as documented in Chapter 3. Because of this apparent overlap between channel
variations and traffic fluctuations, a cross-layer [53] approach that considers
traffic and channel simultaneously follows naturally. By analyzing statistical
properties at time scales critical to channel fluctuation and packet traffic, we
expect to reveal characteristics of both propagation channel and packet traffic.
Leveraging upon tools and results in small scale traffic research works,
we show in this chapter that WLAN traffic is influenced by the channel cor-
relation structure at time scales that are coincident with Doppler shift. This
result sheds light on physical modeling of wireless traffic at sub-second scales.
On the other hand, our work also shows that it is possible to provide or im-
prove site-specific channel estimation from observed traffic variations. It is
well-known that channel state information, if available, can be intelligently
exploited to improve system performance [7, 38]. By utilizing actual traffic to
estimate channel parameters, not only could we reduce the overhead involved
in some algorithms, but also yield better site-specific channel estimation.
We would like to point out that our objective is not to provide new
67

channel models or traffic models. The initial approach in this research may
be somewhat similar to that in [37] which used a traffic trace analysis algo-
rithm to construct link layer Markov models for GSM systems. However, our
study is primarily focusing on channel and traffic interactions instead of a new
link layer channel model. Specifically, we are interested in understanding and
modeling both channel and network traffic over a range of coinciding time
scales over which they interact with each other. Although modeling the traffic
correlation structure or predicting channel conditions is difficult in itself, we
claim that traffic-assisted channel prediction or channel-assisted traffic estima-
tion are viable approaches to control and manage wireless networking systems.
This has never been done to date, but clearly if end uses can reveal channel
condition by relating received traffic flows to clearly identified environmental
changes, e.g., Doppler by movements, it becomes possible to adapt and control
MAC and PHY on the fly.
This chapter is organized as follows. Section 4.2 explains the wide-band
channel experienced by 802.11b systems and its correlation structure due to
Doppler shifts. Section 4.3 establishes the connection between the measured
packet traffic and channel fluctuations due to Doppler effects. A systematic
cross-layer approach is presented in section 4.4 examining the interactions of
traffic and channel. Section 4.4 also proposes future research directions. We
conclude this chapter in section 4.5.
68

4.2 Correlation Structure of Wideband Chan-
nel
Bello [6] established the theoritical foundations for modeling general wide-
band channels as experienced by IEEE 802.11 digital symbols. In [6], random
time-variant linear systems are proposed to model radio transmission channels
because of their influence on the communication signals. Several canonical
channel models as represented by the Wide-Sense Stationary Uncorrelated
Scattering Channel (WSSUC) are also proposed and widely used thereafter.
According to linear system theory, each linear system can be described
by its impulse response function h(t). In practice, the observed channel im-
pulse function h(t) often is the result of superposition of waveforms. Most
likely, h(t) is the result of the combination of very slow fluctuations and more
rapid fluctuations.
When digital signals are transmitted over radio channels, the channel
may show time or frequency selectivity [50] when the duration and bandwidths
of the superposition waveforms are greater than these of the signals. In this
case, the combined results of the rapid changing waveforms can be modeled
as WSSUC.
The slow waveforms, however, typical can not be modeled by wide-sense
stationary processes. However, as Bello asserts in [6], most slow waveforms
do show quasi-stationary behavior, which makes mathematical modeling of
radio channels from measurements feasible. Therefore, a complete general
69

description of many wide-band radio channels can be achieved by identifying
the correlation structure of the channel at its stationary and quasi-stationary
time scales, respectively. The final impact of the channel to transmitted signal
is the combination both.
There are two major factors that affect channel properties [50]: multi-
path propagation and Doppler shift. In typical transmission environments, the
rapid changing waveforms are the result of the constructive and destructive
combination of multipath components. On the other hand, Doppler shifts gen-
erally cause slow fluctuations, which attribute to the slow waveforms. Hence,
it is feasible to measure the correlation structures of multipath propagation
and Doppler shifts separately while still providing a complete description of
radio channels.
It is worth noting that most channel modeling efforts model the rapid
fluctuating stationary channel. The slow fluctuations caused by Doppler shifts
are almost forgotten. While it is understandable that most channel models are
used by modem designers to whom the time scales of rapid channel fluctua-
tions are of interests, Doppler shifts can actually impact packet transmission
directly because of the coincide time scales in high-speed packet networks, e.g.
WLANs. Therefore, it is time to model the slow fluctuations structure of radio
channels.
70

A B C D
E
0 m
5 m
8 m
47.75 m
Figure 4.1: Measurement locations on the fourth floor of ENS building withIEEE 802.11b at channel 1
4.3 Effects of Doppler Shifts on Packet Traffic
To demonstrate the effect of Doppler shifts on channel variations at the in-
terested sub-second time scales, comparison measurements were conducted in
ENS building under controlled conditions. The objective of this measurement
campaign is twofold. First, it is highly desirable to identify the conditions
under which the sub-second channel correlation structures may affect upper
layers. One the other hand, the characteristics of the channel correlation struc-
ture, if been identified, are key elements for intelligently system optimizations.
As shown in [42], one key metric to quantify IEEE 802.11b channel quality is
the average signal-to-noise ratio (SNR). Therefore, SNR and Doppler effects
were the two selected metrics to be controlled in the measurements.
4.3.1 Description of the Measurement Environment
The partial floor plan of ENS building’s 4th floor is shown in Fig. 4.1. The
71

transceivers, as indicated by the letters “A” through “E”, were positioned
approximately 1 meter high. Both the transmitters and the receivers (T-R)
were stationary during measurements. However, Doppler shifts were created
during one measurement by moving a metal board (1.5 m x 2 m x 1 cm)
between point “D” and “E” with fixed speed of approximately 1.5 m/s.
All WLAN measurements were made with ORiNOCO 802.11b cards
working on channel 1 with modulation rate at 11 Mbps. Besides the trans-
mitter and the receiver, a third computer was setup to passively monitor the
radio environment (from channel 1 to channel 5) throughout the experiment-
ing periods. Because the surveillance computer reported no interfering radio
activities in the interested bands, it is reasonable to assume that the only dif-
ference among the measurements was the injected Doppler variations and T-R
separations.
A constant UDP packet flow was generated for 20 minutes during each
measurement. Each UDP packet contains 12 bytes payload data. Besides
WLAN measurements, an identical measurement was conduct over a 10 Mbps
Ethernet link as well. The analysis would based on successfully received UDP
packet series. Table 4.1 summarizes the measurement setups. It is worth
noting that the SNR value at the Static and Motion case is chosen such that
it falls into the range of “critical” SNR values [42].
The traffic traces were discretized to estimated wavelet spectrum. Be-
cause all the packets are of the same size, only the number of packets were
counted without loss of generality. The UDP packet counts were aggregated
72
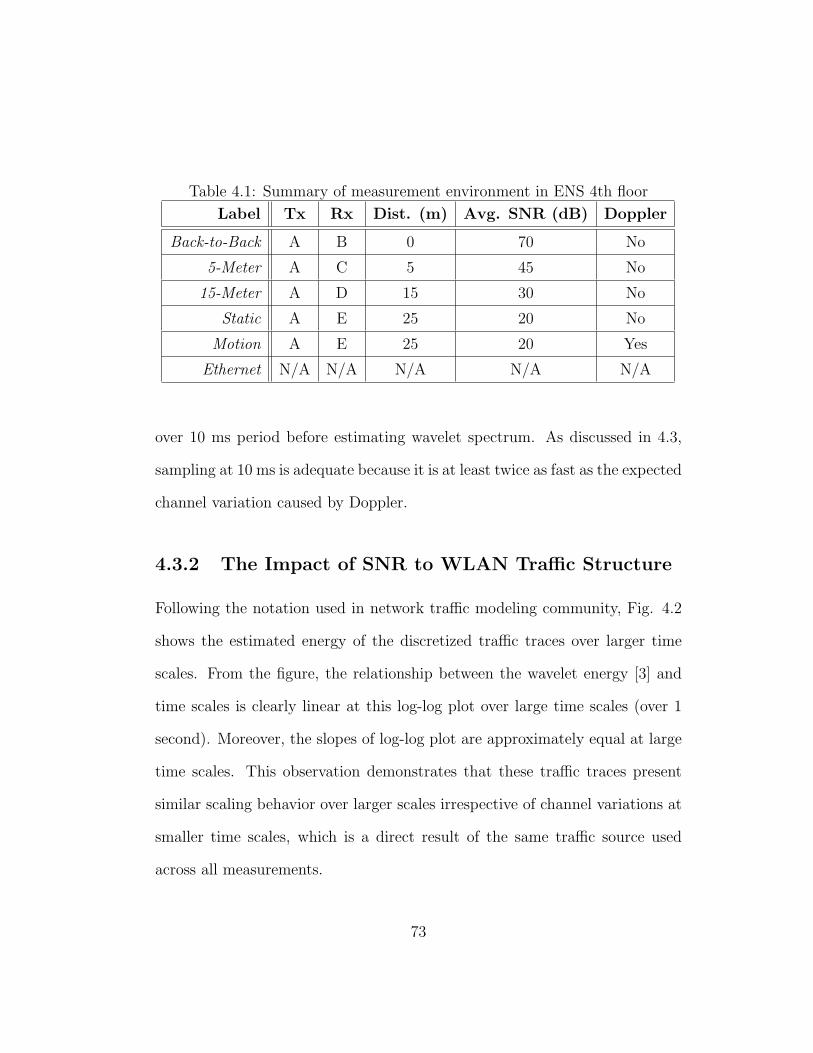
Table 4.1: Summary of measurement environment in ENS 4th floor
Label Tx Rx Dist. (m) Avg. SNR (dB) Doppler
Back-to-Back A B 0 70 No
5-Meter A C 5 45 No
15-Meter A D 15 30 No
Static A E 25 20 No
Motion A E 25 20 Yes
Ethernet N/A N/A N/A N/A N/A
over 10 ms period before estimating wavelet spectrum. As discussed in 4.3,
sampling at 10 ms is adequate because it is at least twice as fast as the expected
channel variation caused by Doppler.
4.3.2 The Impact of SNR to WLAN Traffic Structure
Following the notation used in network traffic modeling community, Fig. 4.2
shows the estimated energy of the discretized traffic traces over larger time
scales. From the figure, the relationship between the wavelet energy [3] and
time scales is clearly linear at this log-log plot over large time scales (over 1
second). Moreover, the slopes of log-log plot are approximately equal at large
time scales. This observation demonstrates that these traffic traces present
similar scaling behavior over larger scales irrespective of channel variations at
smaller time scales, which is a direct result of the same traffic source used
across all measurements.
73
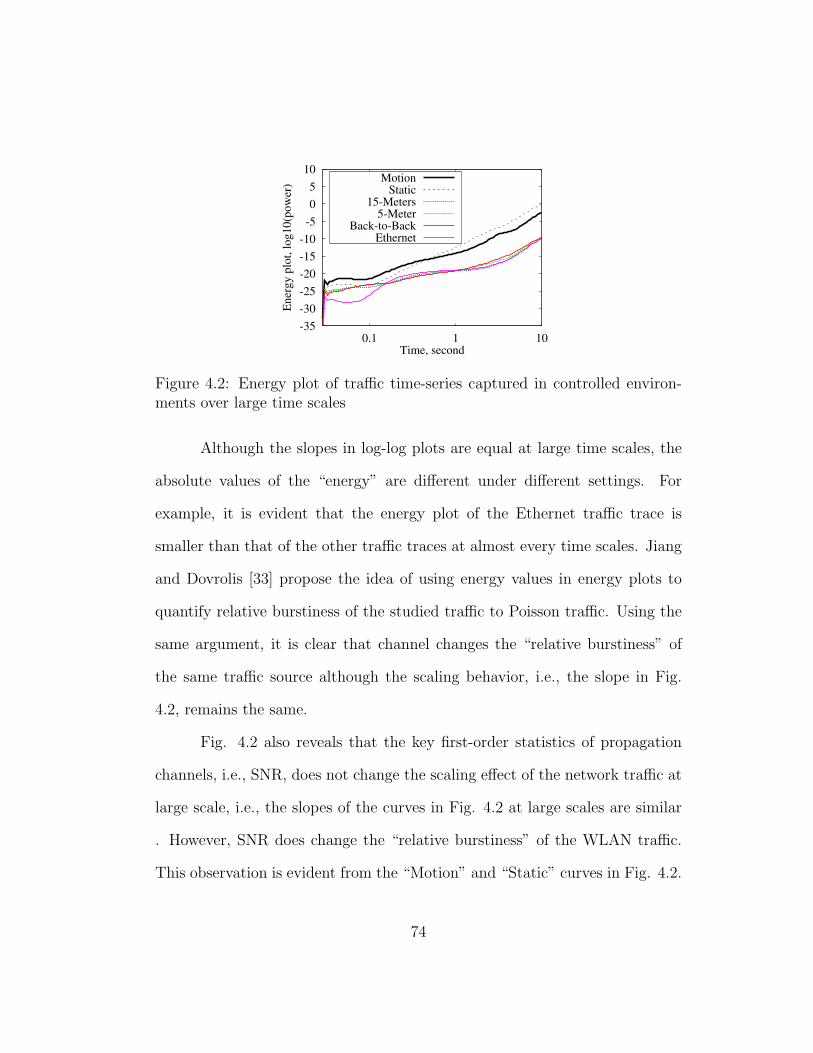
-35-30-25-20-15-10-5 0 5
10
1010.1
Ene
rgy
plot
, log
10(p
ower
)
Time, second
MotionStatic
15-Meters5-Meter
Back-to-BackEthernet
Figure 4.2: Energy plot of traffic time-series captured in controlled environ-ments over large time scales
Although the slopes in log-log plots are equal at large time scales, the
absolute values of the “energy” are different under different settings. For
example, it is evident that the energy plot of the Ethernet traffic trace is
smaller than that of the other traffic traces at almost every time scales. Jiang
and Dovrolis [33] propose the idea of using energy values in energy plots to
quantify relative burstiness of the studied traffic to Poisson traffic. Using the
same argument, it is clear that channel changes the “relative burstiness” of
the same traffic source although the scaling behavior, i.e., the slope in Fig.
4.2, remains the same.
Fig. 4.2 also reveals that the key first-order statistics of propagation
channels, i.e., SNR, does not change the scaling effect of the network traffic at
large scale, i.e., the slopes of the curves in Fig. 4.2 at large scales are similar
. However, SNR does change the “relative burstiness” of the WLAN traffic.
This observation is evident from the “Motion” and “Static” curves in Fig. 4.2.
74
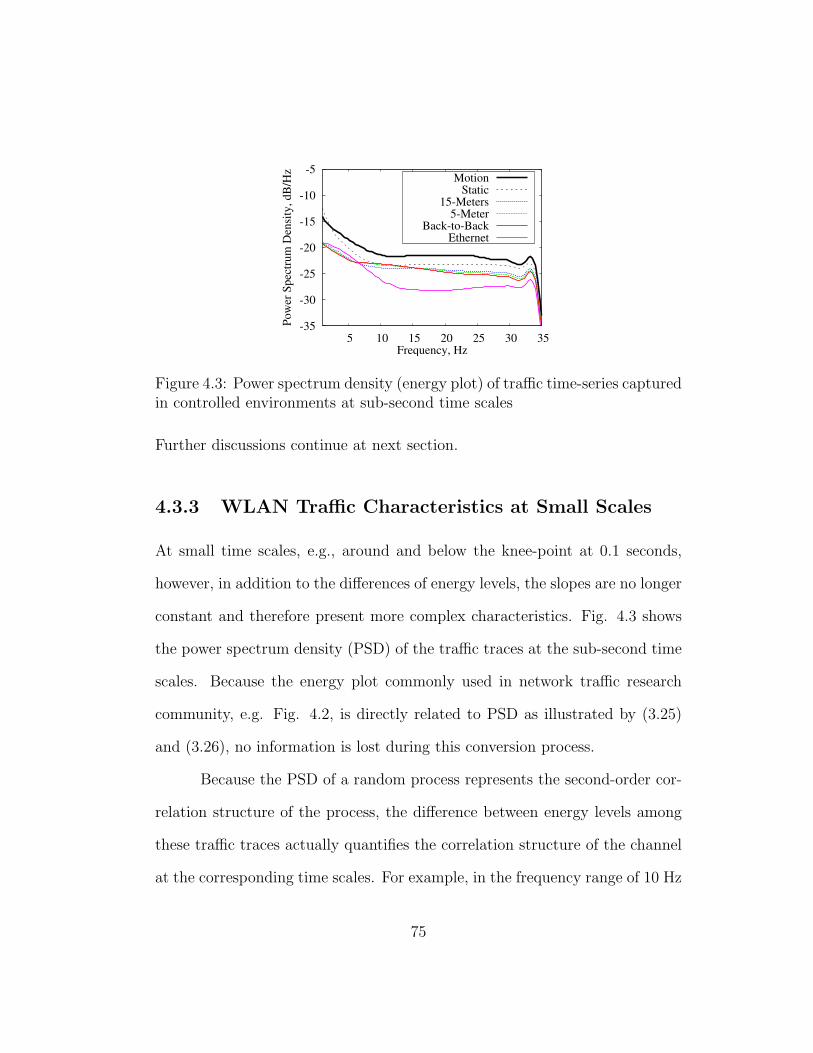
-35
-30
-25
-20
-15
-10
-5
5 10 15 20 25 30 35
Pow
er S
pect
rum
Den
sity
, dB
/Hz
Frequency, Hz
MotionStatic
15-Meters5-Meter
Back-to-BackEthernet
Figure 4.3: Power spectrum density (energy plot) of traffic time-series capturedin controlled environments at sub-second time scales
Further discussions continue at next section.
4.3.3 WLAN Traffic Characteristics at Small Scales
At small time scales, e.g., around and below the knee-point at 0.1 seconds,
however, in addition to the differences of energy levels, the slopes are no longer
constant and therefore present more complex characteristics. Fig. 4.3 shows
the power spectrum density (PSD) of the traffic traces at the sub-second time
scales. Because the energy plot commonly used in network traffic research
community, e.g. Fig. 4.2, is directly related to PSD as illustrated by (3.25)
and (3.26), no information is lost during this conversion process.
Because the PSD of a random process represents the second-order cor-
relation structure of the process, the difference between energy levels among
these traffic traces actually quantifies the correlation structure of the channel
at the corresponding time scales. For example, in the frequency range of 10 Hz
75
to 15 Hz, Fig 4.3 demonstrates that the Motion trace has higher correlation
degree than the Static trace. In other words, the channel correlation structure
in this time scales has changed. Because the only difference between these two
traffic measurements is the injected Doppler shifts, it is evident that the chan-
nel variations caused by the movement is concentrated within this frequency
range.
4.4 A Systematic View of Traffic, the MAC,
and the Channel
4.4.1 Interactions Between Traffic Study and Wireless
Channel
In traffic study, physical modeling of traffic, i.e., relating traffic properties to
physics that generates actual traffic, is the key to comprehend and understand
the characteristics of traffic[48]. Physical modeling enables theoritical expla-
nations of observed traffic in concrete physical causes, and provides insights
into the dynamic nature of traffic.
It has been shown empirically [36] that the complex scaling characteris-
tics of network traffic are usually associated with the round-trip time. On the
other hand, traffic variations and channel fluctuations are closed correlated in
WLAN environments as well. Hence, proper selection of relevant time scales
is important in analyzing traffic characteristics.
76
Our results show that the selection of time scales is a direct result
of the channel fluctuations and the traffic variations. Both of them present
strong physical modeling implications. Therefore, it is clearly physically that
the traffic and channel time scales can be divided into three regimes: rapid
fluctuations, slow fluctuations, and scales above TCP round-trip times. For
MAC layer simulation and design, the sub-second time scales discussed in this
dissertation work is the key.
4.4.2 Interactions Between the Channel and the IEEE
802.11 MAC
To make the channel more accessible to upper layers, researchers has been
working on packet level channel models for several decades [25, 24]. As ex-
plained in Section 4.2, most existing channel models are not suitable for mod-
eling the channel characteristics due to Doppler shifts. Therefore, they should
not be applied directly to packet data traffic.
Regardless, there are still attempts to convert the existing channel mod-
els to link-layer models. However, even converting from existing propagation
models to link layer models is not a straightforward process. Most conver-
sions are ad hoc and error-prone [56]. On the other hand, although complex
higher-order Markovian models, which are typical for the converted models,
might be able to model channel measurements closely, the extensive usage of
the two-state Clarke-Elliot Markov channel model shows the importance of a
77
simpler model. It will be interest to leverage on the results obtained from this
dissertation work and construct a packet level channel model from physical
modeling.
4.4.3 Examples
We present two examples of the possible applications of our results and the
future link-layer channel models in this section.
Performance Anomaly of 802.11
Martin Heusse etc. al. [28] analyzes the performance losses in IEEE 802.11b
environment caused by a phenomenon they named as Performance Anomaly.
Performance anomaly is caused by the adaptive switch of modulation scheme
from one modulation mode to another according to the changing signal strength.
For a single host in a 802.11b cell, suppose the propagation time is
negligible. the overall transmission time is:
T = ttr + tov (4.1)
where ttr is the packet transmission time and is dictated by the frame length,
and tov is the overhead associated with the packet:
tov = DIFS + tpr + SIFS + tpr + tACK (4.2)
tpr is the transmission time of Physical Layer Convergence Protocol (PLCP)
preamble. Clearly the overall transmission time T depends on the bit rate
78
used by the node for the transmission because both ttr and tov change by the
modulation rate.
Suppose there are N competing nodes. Obviously collision and expo-
nential back-off mechanism will decrease the rate from one host to the access
point. Let use tcont(N) to model the overhead. Now the overall transmission
time for one packet is:
T = ttr + tov + tcont(N) (4.3)
tcont(N) is related to the collision probability Pc(N). The performance degra-
dation due to competition it is obvious.
It is well known that the IEEE 802.11 MAC is designed to ensure long-
term fairness for nodes to access the channel. Therefore, each node has ap-
proximately similar chance to access the channel. Hence overall all hosts must
achieve the same throughput.
On the other hand, wireless nodes typically experience different signal
levels due to T-R distance, fading, or Doppler shifts. Hence some nodes may
operate at speeds lower then the others. Considering the fairness design of
MAC, slower node essentially wastes spectrum resources since faster nodes
need to wait for channel access. Therefore, no wireless node can achieve long-
term throughput higher then the worse node. Therefore, The MAC protocol
and channel fluctuations entangle together causing this unfortunate result.
Predicting channel fluctuations at the time scales of packet transmission and
channel accessing may help improve MAC protocol to avoid this performance
79

anomaly.
Measurement of MAC Metrics
It is relatively simple to design a plan to measure, simulate and analyze WLAN
traffic and channel on a peer-to-peer link with unidirectional traffic. However,
in a networked environment with bi-directional traffic, the situation becomes
more involved. For example, it is no longer obvious regarding the throughput
at the network level due to impacts from the MAC and higher layers with
mostly highly interactive applications.
One possible approach to attack this system level issue is conduct sys-
tem level optimization by combining the measured packet-lee channel results
at the physical layer together with measured MAC layer metrics. For example,
it is very likely that the packet collision probability Pc(N) can be measured in
real-time, which could yield very interesting scheduling results.
Each wireless host is an autonomous system. Traditional wisdom is
to measure achievable performance one wireless node can attain and con-
duct optimization based on those measurement. However, wireless environ-
ments changes because of channel changes and mobility. It is necessary that
wireless nodes to measure surrounding environment and adjust operation au-
tonomously.
Throughput performance of IEEE 802.11 is sensitive to the number of
competing terminals. An accurate estimation of the number of competing
terminals n could be used by the host to estimate a reasonable throughput
80
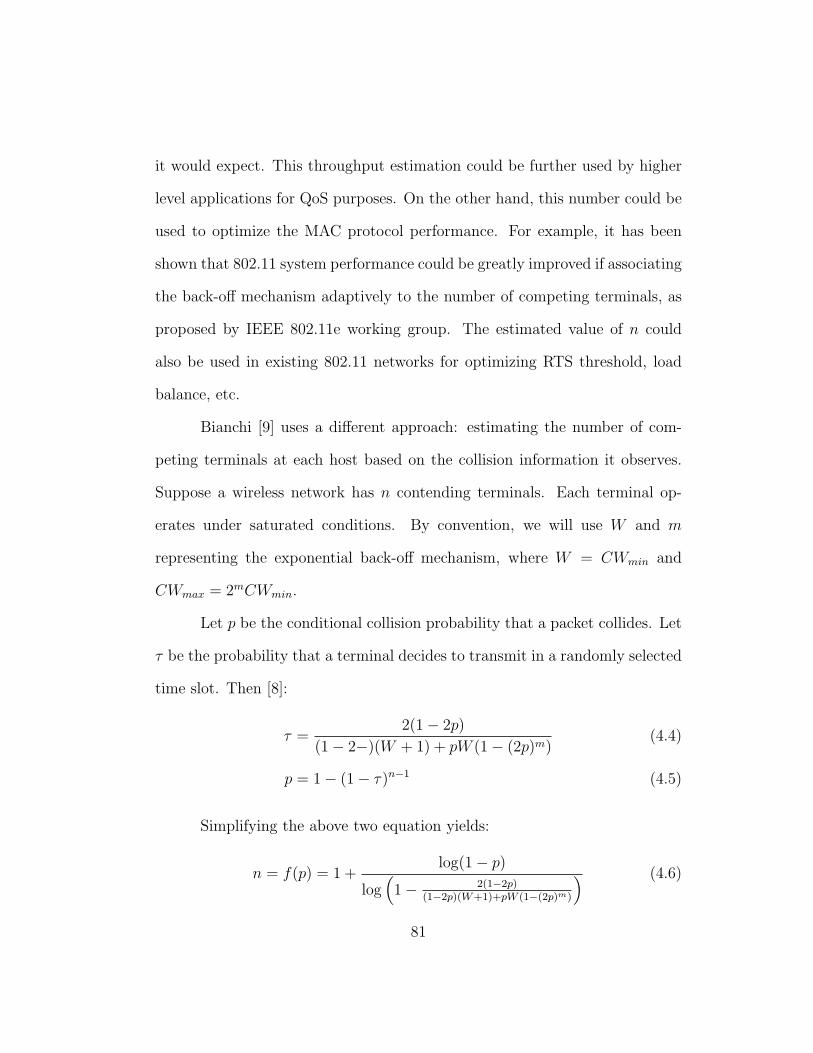
it would expect. This throughput estimation could be further used by higher
level applications for QoS purposes. On the other hand, this number could be
used to optimize the MAC protocol performance. For example, it has been
shown that 802.11 system performance could be greatly improved if associating
the back-off mechanism adaptively to the number of competing terminals, as
proposed by IEEE 802.11e working group. The estimated value of n could
also be used in existing 802.11 networks for optimizing RTS threshold, load
balance, etc.
Bianchi [9] uses a different approach: estimating the number of com-
peting terminals at each host based on the collision information it observes.
Suppose a wireless network has n contending terminals. Each terminal op-
erates under saturated conditions. By convention, we will use W and m
representing the exponential back-off mechanism, where W = CWmin and
CWmax = 2mCWmin.
Let p be the conditional collision probability that a packet collides. Let
τ be the probability that a terminal decides to transmit in a randomly selected
time slot. Then [8]:
τ =2(1− 2p)
(1− 2−)(W + 1) + pW (1− (2p)m)(4.4)
p = 1− (1− τ)n−1 (4.5)
Simplifying the above two equation yields:
n = f(p) = 1 +log(1− p)
log(1− 2(1−2p)
(1−2p)(W+1)+pW (1−(2p)m)
) (4.6)
81

From this formula, the value of contending terminals n can be calcu-
lated by estimating conditional collision probability p. This environmental
information could be passed to other layers for reference or performance opti-
mization.
4.5 Conclusion
In this chapter, we show that the correlation structure of IEEE 802.11b chan-
nel is influenced by Doppler shifts, especially when the SNR level is at the
critical level. This result is demonstrated by exercising a 802.11b peer-to-peer
link with constant packet rate traffic. The time scales of such influence in
typical 802.11b networks are located at the sub-second regime that is above
packet transmission time while below the effective region of LRD phenomenon.
This result also demonstrates that with adequate site-specific knowledge, i.e.,
building layout, T-R separation, and typical moving speed in the environment,
it is possible to better model channel behavior and time scale correlations for
IEEE 802.11 networks.
82

Chapter 5
Measurement Tools and
Procedures
5.1 Introduction
Measurements are the key to achieve the proposed research goals in this disser-
tation work. At small time scales, the objective of our measurement campaigns
include:
• Characterizing aggregated WLAN traffic properties
• Modeling WLAN channel from packet data input
• Capturing and analyzing/optimizing WLAN MAC mechanism
And at large time scales, the measurements should enable:
• Network usage analysis
83

• Backbone network usage provisioning
• Access point optimization
In order to fulfill the above requirements for WLAN traffic study, a
suite of measurement methodology is established, including choices of hard-
ware and software tools, and procedures to conduct measurements in different
environments. This chapter presents the measurement framework in details.
The common practices and tools used in network traffic research is introduced
section 5.2. Section 5.3 presents a literature survey of WLAN traffic measure-
ment study with focuses on measurement platforms. Section 5.4 documents
some of the measurement procedures used this dissertation work.
5.2 Common Practices and Tools Used in LAN/WAN
Environments
Measurement has been one of the most important approaches for monitoring,
analyzing and eventually improving performance of data networks. There have
been tremendous research activities in this area. However, WLAN traffic is
still largely unknown. Fortunately, because TCP/IP protocol suites dominates
modern networks, and because most of the deployed WLANs support TCP/IP
from the very beginning of design, a large amount of tools and procedures from
the similar measurements can be applied directly in the proposed WLAN traffic
research.
84
This section introduces the procedures and tools for packet (or IP)
based, networks. Because data collecting involves privacy issues, techniques
such as hashing 1 for protecting this information has been available. In this
research, these techniques will be enforced. No sensitive information that
could be used to trace to individual user network usage, including visited IP
addresses, used applications, etc., will be disclose from this research. However,
certain information as defined in the contract will be confidentially provided
to the sponsor.
It is worth-noting that there emerge some excellent tools from the open-
source software community. Actually, most of them relate to research projects
from universities. Open source software, which shows the most fundamen-
tal concepts and valuable implementation details from the publicly available
source codes, plays a wonderful role for research projects like this one.
5.2.1 Common Practices
Data networks, as diverse as it could possibly be, are almost impossible to be
fully monitored and measured by a single technique or a single software tool.
Instead, measurements are taken at every layer for serving specific monitoring
or performance benchmarking purposes. In this report, considering the status
of the currently deployed WLANs, these measurement approaches are divided
into two classes: microscope and macroscopic measurements. Both approaches
could find their positions in this research work.
1Mapping one identify, e.g., each IP address, into a “random” number
85

Microscopic Measurement and Analysis
By microscopic, we emphasis that the small scale properties of traffic, irre-
spective of the layers at where the measurement is been taken, is of primary
interests. For example, in WLAN networks, each MAC packet is scheduled
to transmit based on long term fairness criteria. The enforcing mechanism is
carrier sense multiple access and collision avoidance (CSMA/CD). However,
a WLAN with fair resource allocation is not necessarily optimum if network
level throughput is concerned. To improve the current scheme requires un-
derstanding the traffic properties, for example, how one packet experiences
the radio channel, how two packets from different origins compete or interfere
with each other. Understandings similar to this example have to be learned
from microscopic measurements and further be verified by microscopic mea-
surements. Device manufacturers and scheduling algorithm designers tend to
take this measurement approach.
Macroscopic Measurement and Analysis
Very detailed traffic traces have to be captured in microscopic measurements.
One the other hand, there is another class of users, who are providing the
network service and would like to monitor the networks and evaluate perfor-
mance over a longer period of time. Macroscopic measurements are conducted
for these purposes. Unlike microscopic measurements which often take places
at one single point, macroscopic measurements general span over a fairly large
86

amount of points, most of which are networking devices.
The most commonly used protocol for macroscopic measurements is
simple network management protocol (SNMP). By simple it means the pro-
tocol itself is simple, which could roughly summarized by “reading statistics
from one device” or “setting parameters for one device”. To the contrary,
the definitions of the values that could be get set are voluminous, and often
different from devices to devices, vendors to vendors.
5.2.2 Traffic Capturing in LAN Environments
Different data link medium provides different data packaging. Theoretically,
traffic data capturing and analyzing techniques should be applicable as long
as the information been transmitted is packet data. For example, An ATM
link should share the same traffic capturing and analyzing framework/tool set
from that of a Ethernet LAN. However, implementation details often impose
various practical difficulties.
In this research, fortunately, traffic is going to be captured in Ethernet
or Ethernet-like LAN environments with no exceptions. Partially it is the
result of the widely usage of Ethernet as a common inter-connecting technique.
Also, it attributes to the designers of WLAN, who intentionally mimic the
design of Ethernet.
Hardware requirements are relatively simple. A commonly seen (portable)
personal computer with Ethernet and/or WLAN interfaces would be adequate.
However, during the capturing process, even only the Ethernet packet header
87
(the first 68 bytes of each packet in our measurements) is been captured, the
amount of data to be stored is still an issue. Especially during peak time,
hard drive access time will be critical to keep track of network transmission.
Thus, faster hard drive and larger memory are more important than faster
CPU clock frequency for packet capturing purpose.
All the microscopic measurement tools used in this research project are
non-intrusive in order to avoid artifacts. Sometimes, a unidirectional Ethernet
cable is used to physically guarantee passive measurements.
Tcpdump
Tcpdump is used throughout our measurement campaign as the primary packet
capturing utility. It is a classical traffic capturing and analyzing tool designed
and actively maintained by UC-Berkeley. It primarily works on Unix platform
as a light-weighted command-line utility and is perfect for traffic capturing in
this research.
In most of our measurements, the first 68 bytes of each Ethernet packet
is captured. This choice is made by taking privacy protection, information
needed for this research and laptop PC hardware capacity into account. The
first 68 bytes contain information up to layers based on TCP/UDP, which is
adequate for this project.
Tcpdump also stores a time-stamp for each captured packet. The reso-
lution of the time-stamp depends on operation systems. In our measurement
setup, it is 10−6 second.
88
5.2.3 Tools for Traffic Data Interpretation and Analysis
Because microscopic network packet capturing is a network / hard drive in-
tensive task, real-time processing is not applicable for most commonly seen
personal computers. Thus, our approach is to capture raw packets and save
them for off-line processing.
5.3 WLAN Packet Traffic Measurement in the
Literature
This section reviews several papers in the area of wireless data traffic measure-
ments, in particular, WLAN traffic. The primary objective of this literature
survey is to study the pros and cons of other WLAN measurement setups
5.3.1 TCP and UDP Performance over a Wireless LAN
The paper[65] focuses on single hop interference-free performance measure-
ment for WLAN environment. Their experiments compare the performance
difference between bidirectional data traffic (TCP) and unidirectional traffic
(UDP).
One computer installed with Linux operation system with kernel 2.0.32
consists of the basic measurement platform. To eliminate interfering factors
during traffic measurements, all the irrelevant tasks are all terminated. Several
slightly modified standard tools and wireless LAN card driver are adopted in
89
the measurement. The tools includes:
• Modified wireless LAN driver (with packet statistics and percentage of
signal and noise levels recording capability).
• Modified ttcp for sending and receiving TCP and UDP packets.
• netstat for monitoring measurement computers activities.
• tcpdump for logging of packet sending/receiving activities.
The major weakness of the measurement environment includes:
• Unable to detect accurate value of physical layer signal strength. This
is a common problem in WLAN measurement mainly due to the lack of
openness and support from WLAN model manufacturers.
• MAC layer monitoring functionality is very weak. For example, there is
no ability to directly detect MAC layer collisions.
Their basic measurement procedures are as follows:
1. Record initial states of wireless link interface with netstat.
2. Start tcpdump to monitor wireless link transmissions.
3. Use ttcp to send 10,000 packets with size 500, 1000 and 1500 bytes re-
spectively.
90
In this measure campaign, physical signal strength is collected only at
the beginning of measurements. However, because measurement is conducted
under high signal strength environment. it is not a serious issue for the purpose
of this paper.
There are several interesting observations from this paper:
• Packet loss increases with increased packet sizes
• UDP throughput increases with increased packet size while TCP through-
put decreases, which is mainly due to fact that the relative high-rate
packet loss is introduced into the feedback loop of TCP protocol.
• UDP testing software can easily overflow network implementation soft-
ware, and introduce measurement errors. Therefore, some form of empir-
ical flow control is necessary to ensure the correctness of WLAN traffic
measurement results. Also, matching the sender and receiver by their
processing power helps reducing over-flows.
The measurement results [65] show that unidirectional traffic is different
from bidirectional traffic. Also, it is evident that physical layer, MAC layer
and higher layers change WLAN characteristics together. Thus, this paper
[65] quests for further studies to understand the impact of each mechanism on
the measured traffic.
91
5.3.2 Measure Performance of the IEEE 802.11 LAN
Bing [10] conducts measurements of IEEE 802.11 WLAN traffic at the MAC
layer, and examines the effect of delay caused by different packet sizes.
The measurement setup in [10] consists of one mobile and one AP.
Both nodes are intentionally positioned close to each other to ensure strong
signal levels. This setup helps to identify the impact of WLAN equipment
in measurements, i.e., buffering at the access point and delay. An Ethernet
connection is used in parallel between the AP and the mobile to benchmark
the performance. One separate network analyzers are used for MAC packet
profiling to quantify those two factors.
Bing’s measurement results show that buffering effect appears when
traffic is saturated. Consequently, packet delay is almost a constant mainly due
to the larger queueing delay than that of the channel’s. This paper reminds
the importance of eliminating queueing effect in order to measure channel
characteristics from packet traffic.
5.3.3 Measured Performance of 802.11a at 5 GHz
Chen [13] conducted IEEE 802.11a traffic measurements at Atheros’s Sunny-
vale office in California. The measurement environment is a typical office of
area 265 foot by 115 foot. They use two Atheros 802.11a PC reference design
cards for the measurement.
At each position, the measurement is conducted by collecting 1000 uni-
92

directional packets. Broadcast packets are sent because they require no ac-
knowledge packets from the peers. The packet error rate is calculated for each
rate and the optimal rate is selected as the data link rate and throughput is
calculated accordingly.
Chen [13] shows that data link transmission rate changes due to mod-
ulation scheme switching is directly correlated to the T-R separation between
the transmitter and the receiver. What is more, both 802.11a and 802.11b
share the same rule: the longer the distance, the lower the data link would
be. For 802.11a, the switching points are roughly at 24 foot, 36 foot, 80 foot,
85 foot, 130 foot and 170 foot. The data link rates decrease from 54 Mbps to
6 Mbps. For 802.11b, the distances are roughly located at 110 foot and 180
foot.
The measurement results in [13] suggest that there exist a possibility of
modeling 802.11a and 802.11b throughput within the same framework despite
different modulation techniques in the two standards.
5.4 Measurement Methodology
This dissertation work involves several measurement campaigns as presented
in Chapter 2, 3, and 4. Each campaign requires different measurement plans
to fulfill the requirements. However, there are several general guidelines that
are applicable across these campaigns. The establishment of the guidelines is
a process of learning from measurement experiments and from the literature.
93
This section describe these guidelines.
• Radio environment survey: several measurement campaigns require ac-
tive measurements, i.e., network traffic has to be generated in a con-
trolled fashion to excise the network. Because of the popularity of
WLANs, it is very likely that there are interferences around the area.
Moreover, sometime it is difficult to identify and gain access to the in-
terfering sources. Therefore, site survey becomes extremely important
to ensure the measurement results to be valid.
During our measurement campaigns, the goal of the site survey of to
identify the frequency range of the interfering sources in order to avoid
these bands. To ensure measurement quality across the measurement
period, the site survey should be conduct throughout the measurement
period.
In WLAN measurements, typically a separate computer is used for the
site survey purpose. However, some monitoring applications, including
the popular NetStumbler, send probing packets in a frequency-hopping
fashion to actively search for nearby wireless devices. Obviously, the
probing packets generate interferences and disturb the control traffic.
Therefore, it is important to choose tools that do not cause the site
survey computer to generate interference. Kismet is one of such passive
WLAN monitors and was used successfully in our measurement.
• Configurations of sniffer computer: network traffic capturing is a del-
94
icate process both for the hardware and the software. High quality
traffic traces demands a properly configured hardware and software sys-
tem. It has been documented extensively in the literature about the
design and implementation of sniffers. In the earlier days [40], special
hardware devices were developed in order to ensure adequate speed to
capture Ethernet traffic. However, since the progress of both the hard-
ware and software on personal computer, traffic capturing on Ethernet
or Ethernet-like networks has become simpler. However, there are still
areas requiring attentions.
On the hardware site, the storage device needs to be fast with enough
storage space. In our measurement, high-speed hard disks are used when-
ever possible. Also, it is advised to use computers with similar configu-
rations, as pointed out in [65, 10].
Tcpdump is used exclusively in this research to capture network traffic.
However, our experience proves that tcpdump can be very useful in pre-
processing the captured traffic. In fact, it is more reliable and robust to
use tcpdump than other customized tools for the pre-processing.
We also used tools donated by Wireless Valley Communications Inc.
measuring WLAN throughput with unidirectional and bidirectional traf-
fic during our measurement campaigns.
• Networking equipment: because of the fast-paced development of WLAN
technology, WLAN modems experience fast changes as well. Although
95
the progressive changes consistently improve the transmission capacity of
WLAN in general, it is not trivial to conduct WLAN traffic measurement
mostly due to undisclosed hardware and firmware information, as well as
lingering development of device drivers. At the time we conducted our
measurements, IEEE 802.11b was chosen as the primary measurement
platform because of its relative mature status and wide support. Also,
the choice of vendors, i.e., Cisco and ORiNOCO, also was decided mostly
by the openness of their 802.11b products.
IEEE 802.11 cards and access points are also factors need to take into
account. To avoid discrepancies, standard PCMCIA WLAN modem
cards are used in all measurements. It is also helpful in selecting WLAN
cards and access points, and also potentially possibilities of changing
physical setups such a antenna.
The above guidelines are adopted across the measurement campaigns to
devise measurement plans that are suitable for different tasks. Certainly there
are differences in each plan. However, the above methodology has proved to
be very effective and constructive in guiding through the plans that presented
in the previous chapters.
96
Chapter 6
Conclusions
6.1 Summary
Comprehensive measurement results of IEEE 802.11b WLAN traffic statistics
and channel correlation structures are presented in this dissertation. This dis-
sertation work, as mainly an experimental work, strives to present new traffic
statistics and develop new methods for identifying channel characteristics. We
believe that the results obtained in this dissertation work are going to be funda-
mental building blocks for comprehensive WLAN simulation and performance
evaluation environments.
Chapter 2 presents two empirical models to predict IEEE 802.11B appli-
cation layer throughput from measured SNR values that quantifies the large-
scale fading characteristics of radio channels. Moreover, we show the traffic
statistics measured at three commercial hotspots. With the knowhow of the
97
traffic statistics and the throughput prediction models, it is possible to better
design and deploy public WLAN service infrastructure from the physical layer
up to the application layer.
Inspired by the traffic statistics from Chapter 2 and some recent results
from the network traffic study literature [1], we further discuss the WLAN
traffic scaling properties in Chapter 3 with emphasis on small-scale burstiness
analysis. Our result indicates that WLAN traffic exhibits rapid fluctuations in
over the frequency range of Doppler shifts typically seen for a 2.4 GHz carrier
communication system.
The results in Chapter 2 and 3 prompt the study of characteristics of
WLAN channels in the time scales that are observable by packet data while
statistically intact from influences by the higher layers. In Chapter 4, we
extend the traffic analysis further to the WLAN channel, in which the chan-
nel is exercised by controlled packet traffic. Motivated by channel sounder
techniques [50], we argue that it is a plausible approach to estimate channel
conditions given intelligent selection of time scales. From comparison obtained
from controlled measurements, we observe clear “burstiness” in the same fre-
quency range as seen in Chapter 3, which according to the measurement design
clearly is due to the Doppler shifts injected during the measurement.
In Chapter 5, the measurement methodology adopted throughout the
dissertation work is summarized. In the foreseeable future, empirical measure-
ment will continue be an important part of performance evaluation and design
validation tool in wireless environments. Therefore, we hope this chapter to
98

serve as a general guideline in designing WLAN and other packet network
measurement.
6.2 Future work
In this dissertation work, we conducted a series of measurements and analy-
sis to model WLAN performance from a cross-layer point of view. Because
of the complexity of radio propagations and the intricate interactions among
layered network protocols, however, this dissertation work is a beginning of
the cross-layer approach to study WLAN. Future work should further validate
the measure-based cross-layer framework and investigate WLAN performance
as deployment and standard work evolve. In particular, improved models with
interference considerations, better comprehending of the interaction between
link layer traffic and channel variations in networked environment, and intel-
ligent channel estimations adapting to site-specific information are perhaps
among the most interesting topics to be studied within the methodology es-
tablished in this dissertation work.
Radio interference has become one of the most limiting factors. Without
a paradigm shift, e.g., changes of frequency allocation policies, it is apparent
that issues associated with interference are inevitable and only become worse
as denser deployments of a diverse range of wireless networks appear.
During the measurement campaign, careful site surveys were conducted
to ensure interference-free environments. Therefore, the proposed throughput
99

prediction models in Chapter 2 do not consider the effect of interference. We
have not seen in the literature discussions of the influence of interference on
achievable throughput. Therefore, it would be interesting to take interference
into account for more general throughput models.
During the measurement campaign of validating the effect of Doppler
shifts, interference also was monitored and avoided. Therefore, although the
measurement results validated the existence of Doppler “fluctuations” at the
link layer, it could not show how interference would influence the link layer
traffic flows, let alone the combined effect of Doppler and interference.
There are other factors that influence the link layer besides interference.
Among them, the MAC protocol is probably the most important mechanism.
Unfortunately, the IEEE 802.11 MAC is very difficult to model. On the other
hand, our emphasis in this dissertation work is on the physical layer. Therefore,
peer-to-peer links were adopted to validate and quantify the effect of Doppler
at the link layer. It is going to be a very meaningful while challenging task
to improve upon the existing results to develop more comprehensive link layer
models that consider radio propagation, the PHY, and the MAC in networked
environments.
On key contribution of this dissertation work is the observation and
validation of the effect of Doppler shifts at the link layer. It would be an
interesting follow-up work to use site-specific knowledge to estimate Doppler
shifts. During radio propagations, the Doppler shifts depend heavily on the
angles-of-arrival (AOA) [50], which is entirely site-specific knowledge. One ap-
100

proach to streamline WLAN deployment is to integrate site-specific knowledge
into the estimation of the link layer and to the throughput. Further study of
the accuracy of this approach should be performed.
Finally, it is worth nothing that the methodology and basic cross-layer
principles are not limited to WLAN systems. For example, one very inter-
esting topic is how Doppler affects other data networks with larger coverage
area. Examples of such wireless data networks include the commercialized 3G
cellular networks and the emerging IEEE 802.16 networks. Mobility is much
more prevalent in such networks and environment settings tend to be more
complex. Therefore, in principle, the range of Doppler shifts should enlarge
and the strength of Doppler may become stronger. The methods presented in
this dissertation can provide a good starting point in verifying and therefore
utilizing such phenomenon.
101
Bibliography
[1] Patrice Abry, Richard G. Baraniuk, Patrick Flandrin, Rudolf H. Riedi,
and Darryl Veitch. Multiscale nature of network traffic. IEEE Signal
Processing Magazine, May 2002.
[2] Patrice Abry, Paulo A. Goncalves, and P. Flandrin. Wavelet-based spec-
tral analysis of 1/f processes. In Proceedings of the IEEE International
Conference on Acoustics, Speech, and Signal Processing, volume 3, pages
237–240, 1993. Minneapolis, MN, USA.
[3] Patrice Abry and Darryl Veitch. Wavelet analysis of long-range-dependent
traffic. IEEE Transactions on Information Theory, 44(1):2–15, 1998.
[4] Anand Balachandran, Geoffrey M. Voelker, Paramvir Bahl, and P. Venkat
Rangan. Characterizing user behavior and network performance in a pub-
lic wireless LAN. In Proceedings of the 2002 ACM SIGMETRICS inter-
national conference on Measurement and modeling of computer systems,
pages 195–205. ACM Press, 2002.
102
[5] Magdalena Balazinska and Paul Castro. Characterizing mobility and net-
work usage in a corporate wireless local-area network. In Proceedings of
the First International Conference on Mobile Systems, Applications, and
Services (MobiSys 2003), San Francisco, CA, USA. USENIX, 2003.
[6] Philip A. Bello. Characterization of randomly time-variant channels.
IEEE Transactions on Communications Systems, CS-11:360–393, 1963.
[7] Pravin Bhagwat, Partha P. Bhattacharya, Arvind Krishna, and Satish K.
Tripathi. Enhancing throughput over wireless LANs using channel state
dependent packet scheduling. In IEEE INFOCOM Computer and Com-
munications Societies Conference on Computer Communications, pages
1133–1140, 1996.
[8] Giuseppe Bianchi. Performance analysis of the ieee 802.11 distributed
coordination function. IEEE Journal of Selected Areas in Telecommuni-
cations, Wireless series, 18:535–547, March 2000.
[9] Giuseppe Bianchi and Ilenia Tinnirello. Kalman filter estimation of the
number of competing terminals in an IEEE 802.11 network. In IEEE
Infocom, San Francisco, March 2003.
[10] Benny Bing. Measured performance of the IEEE 802.11 wireless LAN. In
24th Conference on Local Computer Networks, 1999.
103
[11] R. B. Blackman and J. W. Tukey. The Measurement of Power Spectra
from the Point of View of communications Engineering. Dover Publica-
tion, 1958.
[12] Jin Cao, William S. Cleveland, Dong Lin, and Don X. Sun. Internet
traffic tends toward Poisson and independent as the load increases. In
C. Holmes, D. Denison, M. Hansen, B. Yu, and B. Mallick, editors, Non-
linear Estimation and Classification, pages 83–109. Springer, New York,
2002.
[13] James C. Chen and Jeffrey M. Gilbert. Measured performance of 5-GHz
802.11a wireless LAN systems. Technical Report, Atheros Communica-
tions, 2001.
[14] Jeremy K. Chen and Theodore S. Rappaport. Throughput Measurements
and Models of Public IEEE 802.11b Wireless Local Area Networks. Mas-
ter’s thesis, Dept. of Electrical and Computer Engineering, The University
of Texas at Austin, 2004.
[15] Mark E. Crovella and Azer Bestavros. Self-similarity in world wide web
traffic: evidence and possible causes. IEEE/ACM Transactions on Net-
working, 5(6):835–846, 1997.
[16] Ingrid Daubechies. Ten Lectures on Wavelets. Society for Industrial and
Applied Mathematics, Philadelphia, PA, USA, 1992.
104

[17] E. O. Elliott. Estimates of error rates for codes on burst-noise channels.
Bell System Technical Journal, 42(9):1977–1997, September 1963.
[18] Ashok Erramilli, Onuttom Narayan, Arnie Neidhardt, and Iraj Saniee.
Performance impacts of multi-scaling in wide-area TCP/IP traffic. In
IEEE INFOCOM Computer and Communications Societies Conference
on Computer Communications, pages 352–359, Tel Aviv, Israel, Mar 2000.
IEEE.
[19] Ashok Erramilli, Onuttom Narayan, and Walter Willinger. Experimental
queueing analysis with long-range dependent packet traffic. IEEE/ACM
Transactions on Networking, 4(2):209–223, 1996.
[20] A. Feldmann, A. C. Gilbert, and W. Willinger. Data networks as cascades:
investigating the multifractal nature of Internet WAN traffic. In ACM
SIGCOMM conference on Applications, technologies, architectures, and
protocols for computer communication, pages 42–55. ACM Press, 1998.
[21] Anja Feldmann, Anna C. Gilbert, Polly Huang, and Walter Willinger.
Dynamics of IP traffic: a study of the role of variability and the impact of
control. ACM SIGCOMM Computer Communication Review, 29(4):301–
313, 1999.
[22] Anja Feldmann, Anna C. Gilbert, Walter Willinger, and T. G. Kurtz. The
changing nature of network traffic: scaling phenomena. ACM SIGCOMM
Computer Communication Review, 28(2):5–29, 1998.
105
[23] Daniel R. Figueiredo, Benyuan Liu, Vishal Misra, and Don Towsley.
On the autocorrelation structure of TCP traffic. Computer Networks,
40(3):339–361, October 2002.
[24] Bruce D. Fritchman. A binary channel characterization using partitioned
Markov chains. IEEE Transactions on Information Theory, 13:221–227,
1967.
[25] Elliot N. Gilbert. Capacity of a burst-noise channel. Bell System Technical
Journal, 39(9):1253 – 1265, September 1960.
[26] Matthias Grossglauser and Jean-Chrysostome Bolot. On the relevance of
long-range dependence in network traffic. IEEE/ACM Transactions on
Networking, 7(5):629–640, 1999.
[27] Benjamin E. Henty and Theodore S. Rappaport. Throughput Measure-
ments and Empirical Prediction Models for IEEE 802.11b Wireless LAN
(WLAN) Installations. Technical Report MPRG 01-08, Dept. of Electri-
cal and Computer Engineering, Virginia Polytechnic Institute and State
University, 2001.
[28] Martin Heusse, Franck Rousseau, Gilles Berger-Sabbatel, and Andrzej
Duda. Performance anomaly of 802.11b. In INFOCOM, 2003.
[29] IEEE. IEEE Standard 802.11: Wireless LAN Medium Access Control
(MAC) and Physical Layer (PHY) specifications. IEEE, 1999.
106

[30] IEEE. IEEE Standard 802.11b: Higher Speed Physical Layer (PHY) ex-
tension in the 2.4 GHz band. IEEE, 1999.
[31] IEEE. IEEE Standards for Local and metropolitan area networksVirtual
Bridged Local Area Networks. IEEE, 2003.
[32] Hao Jiang and Constantinos Dovrolis. Source-level ip packet bursts:
causes and effects. In ACM SIGCOMM conference on Applications, tech-
nologies, architectures, and protocols for computer communication, pages
301–306. ACM Press, 2003.
[33] Hao Jiang and Constantinos Dovrolis. The origin of TCP traffic burstiness
in short time scales. Technical report, Georgia Institute of Technology,
2004.
[34] William C. Jakes Jr. Microwave Mobile Communications. Wiley-IEEE
Press, 1994.
[35] Thomas Karagiannis, Michalis Faloutsos, and Rudolf H. Riedi. Long-
Range Dependence: Now you see it now you don’t! In Global Internet,
November 2002.
[36] Thomas Karagiannis, Mart Molle, Michalis Faloutsos, and Andre Broido.
A nonstationary poisson view of internet traffic. In IEEE INFOCOM
Computer and Communications Societies Conference on Computer Com-
munications, Hong Kong, March 2004.
107
[37] Almudena Konrad, Ben Y. Zhao, Anthony D. Joseph, and Reiner Ludwig.
A markov-based channel model algorithm for wireless networks. Wireless
Networks, 9(3):189–199, 2003.
[38] Ger Koole, Zhen Liu, and Rhonda Righter. Optimal transmission policies
for noisy channels. Operations Research, 49:892–899, 2001.
[39] David Kotz and Kobby Essien. Analysis of a campus-wide wireless net-
work. In Proceedings of the eighth annual international conference on
Mobile computing and networking, pages 107–118. ACM Press, 2002.
[40] Will E. Leland, Walter Willinger, Murad S. Taqqu, and Daniel V. Wilson.
On the self-similar nature of Ethernet traffic. ACM SIGCOMM Computer
Communication Review, 25(1):202–213, 1995.
[41] Ta-Hsin Li and Hee-Seok Oh. Wavelet spectrum and its characteriza-
tion property for random. IEEE Transactions on Information Theory,
48(11):2922–2937, 2002.
[42] Chen Na, Jeremy K. Chen, and Theodore S. Rappaport. Hotspot traf-
fic statistics and throughput models for several applications. In IEEE
GLOBECOM Global Telecommunications Conference, 2004.
[43] Chen Na, Jeremy K. Chen, and Theodore S. Rappaport. Measured traffic
statistics and throughput of ieee 802.11b public wlan hotspots with three
different applications, Feb 2004. Submitted journal publication, under
review.
108

[44] Chen Na and Thedore S. Rappaport. Ieee 802.11b traffic variations and
doppler correlations at sub-second time scales. To be submitted for journal
publication, 2005.
[45] Chen Na and Thedore S. Rappaport. Measured ieee 802.11b channel
correlation structures, Feb 2005. Submitted to Globecomm 2005.
[46] Chen Na and Theodore S. Rappaport. Measured wireless LAN pub-
lic hotspot traffic statistics. IEE Electronics Letters, 40(19):1202–1203,
September 2004.
[47] Prabhakar S. Naidu. Modern Spectrum Analysis of Time Series. Dover
Publication, 1996.
[48] Kihong Park and Walter Willinger. Self-Similar Network Traffic and Per-
formance Evaluation. John Wiley & Sons, Inc., 2000.
[49] Vern Paxson and Sally Floyd. Wide area traffic: the failure of poisson
modeling. IEEE/ACM Transactions on Networking, 3(3):226–244, 1995.
[50] Theodore S. Rappaport. Wireless Communications: Principles and Prac-
tice, 2nd Edition. Prentice Hall, 2001.
[51] Rudolf H. Riedi, Matthew Crouse, Vinay Joseph Ribeiro, and Richard G.
Baraniuk. A multifractal wavelet model with application to network traf-
fic. IEEE Transactions on Information Theory, 45(3):992–1018, 1999.
109

[52] S. Y. Seidel and T. S. Rappaport. Site-specific propagation prediction
for wireless in-building personal communication system design. IEEE
Transactions on Vehicular Technology, 43(4):879–891, 1994.
[53] Sanjay Shakkottai, Theodore S. Rappaport, and Peter C. Karlsson. Cross-
layer design for wireless networks. IEEE Communications magazine, Oc-
tober 2003.
[54] Srinivas Shakkottai, R. Srikant, Nevil Brownlee, Andre Broido, and
kc claffy. The RTT distribution of TCP flows on the Internet and its
impact on TCP based flow control. Technical Report tr-2004-02, Univer-
sity of Illinois and CAIDA, 2004.
[55] Francis Swarts and H. Ferreira. Markov characterization of digital fading
mobile VHF channels. IEEE Trans. Vehic. Tech, pages 977–985, Novem-
ber 1994.
[56] Christopher C. Tan and Norman C. Beaulieu. On first-order markov
modeling for the Rayleigh fading channel. IEEE Trans. on Commun.,
48(12):2032–2040, December 2000.
[57] Diane Tang and Mary Baker. Analysis of a local-area wireless network.
In Proceedings of the 6th annual international conference on Mobile com-
puting and networking, pages 1–10. ACM Press, 2000.
110

[58] William Turin and Robert van Nobelen. Hidden Markov modeling of flat
fading channels. IEEE Journal on Selected Areas in Communications,
16(9):1809–1817, December 1998.
[59] Darryl Veitch and Patrice Abry. A wavelet based joint estimator of the
parameters of long-range dependence. IEEE Transactions on Information
Theory, 45(3):878–897, April 1999.
[60] Hong Shen Wang and Nader Moayeri. Finite-state markov channel - a
useful model for radio communication channels. IEEE Transactions on
Vehicular Technology, 44(1), February 1995.
[61] Hong Shen Wang and Nader Moayeri. On verifying the first-order Marko-
vian assumpition for a Rayleigh fading channel model. IEEE Transactions
on Vehicular Technology, 45(2), May 1996.
[62] P. D. Welch. The use of fast fourier transform for estimation of power
spectra: A method based on time averaging over short, modified peri-
odograms. IEEE Transactions, AU, 15:70–73, 1967.
[63] Walter Willinger, Murad S. Taqqu, and Ashok Erramilli. A bibliographical
guide to self-similar traffic and performance modeling for modern high-
speed networks. F. P. Kelly, S. Zachary and I. Ziedins (eds.), Oxford
University Press, Oxford, 1996.
[64] Walter Willinger, Murad S. Taqqu, Robert Sherman, and Daniel V. Wil-
son. Self-similarity through high-variability: statistical analysis of Ether-
111

net LAN traffic at the source level. IEEE/ACM Trans. Netw., 5(1):71–86,
1997.
[65] George Xylomenos and George C. Polyzos. TCP and UDP performance
over a wireless LAN. In INFOCOM (2), pages 439–446, 1999.
[66] Qinqing Zhang and Saleem A. Kassam. Finite-state Markov model
for Rayleigh fading channels. IEEE Transactions on Communications,
47(11):1688–1692, Nov 1999.
[67] Zhi-Li Zhang, Vinay J. Ribeiroz, Sue Moonx, and Christophe Diot. Small-
time scaling behavior of Internet backbone traffic. In IEEE INFOCOM
Computer and Communications Societies Conference on Computer Com-
munications. IEEE, 2003.
112
Vita
Chen Na was born May 11, 1974, to Xinbang Na and Yuxiu Lei in Xi’ning,
China. In 1996 and 1999, he graduated from Tsinghua University, Beijing,
China, receiving his B.S. and M.S. in Electrical Engineering, respectively. Sub-
sequently he joined Bell Labs China as a Memeber of Technical Staff (MTS)
working on Telecommunication Management Network (TMN) related projects.
He has been with The University of Texas at Austin since 2000. He is married
to Xuejiao Liu.
Permanent Address: 2501 Lake Austin Blvd. C203, Austin, TX 78703
This dissertation was typeset with LATEX2ε1 by the author.
1LATEX2ε is an extension of LATEX. LATEX is a collection of macros for TEX. TEX isa trademark of the American Mathematical Society. The macros used in formatting thisdissertation were written by Dinesh Das, Department of Computer Sciences, The Universityof Texas at Austin, and extended by Bert Kay and James A. Bednar.
113
Related Documents