COMPUTER SCIENCE Copyright © 2019 The Authors, some rights reserved; exclusive licensee American Association for the Advancement of Science. No claim to original U.S. Government Works. Distributed under a Creative Commons Attribution License 4.0 (CC BY). A trainable clustering algorithm based on shortest paths from density peaks Diego Ulisse Pizzagalli 1,2 , Santiago Fernandez Gonzalez 2 * † , Rolf Krause 1 * † Clustering is a technique to analyze empirical data, with a major application for biomedical research. Essentially, clustering finds groups of related points in a dataset. However, results depend on both metrics for point-to-point si- milarity and rules for point-to-group association. Non-appropriate metrics and rules can lead to artifacts, especially in case of multiple groups with heterogeneous structure. In this work, we propose a clustering algorithm that evaluates the properties of paths between points (rather than point-to-point similarity) and solves a global optimization pro- blem, finding solutions not obtainable by methods relying on local choices. Moreover, our algorithm is trainable. Hence, it can be adapted and adopted for specific datasets and applications by providing examples of valid and invalid paths to train a path classifier. We demonstrate its applicability to identify heterogeneous groups in challenging syn- thetic datasets, segment highly nonconvex immune cells in confocal microscopy images, and classify arrhythmic heart- beats in electrocardiographic signals. INTRODUCTION Clustering algorithms aim at automatically grouping points. This task is critical for extracting knowledge from complex datasets of unlabeled data, which are commonly produced by empirical studies (1) and are impossible to analyze manually (2). The identified groups can indicate the presence of multiple phenomena (i.e., populations) in the dataset. Moreover, the structure of each group (hereafter, shape) can indicate the relationship between the included points. Because clustering is a problem without a unique solution, results depend on different metrics for point-to-point similarity and rules for point-to-cluster association. However, metrics and rules generally restrict the set of admissible solutions. As a consequence, when metrics and rules are not chosen appropriately, clustering artifacts are introduced. This is especially relevant when analyzing datasets that have points from populations with arbitrary and heterogeneous structure. For example, common implementations of the broadly used K- means algorithm (3) use the Euclidean distance as a metric for point-to-point similarity and point-to-cluster association. Despite the efficiency of K-means in clustering linearly separable groups (i.e., globular-like), artifacts can be introduced when attempting to separate nonconvex and nested shapes. Methods based on density overcome these limitations. Arbitrary shapes are reconstructed according to a density-connectivity criterion. For example, DBSCAN (density-based spatial clustering of applications with noise) (4) considers two points belonging to the same cluster if a sufficient number of points in a neighborhood are common (density reachable). As a result, the association rule of DBSCAN correctly iden- tifies clusters with any shape having sufficient density. However, when two or more clusters are present and in close proximity, a wide density reachability threshold may join them, while an excessively strict threshold may fail in detecting the clusters. Generally, algorithms like DBSCAN depend on a density-connectivity threshold, which can be difficult to adapt for specific dataset and applications. Recently, Rodriguez and Laio (5) proposed a remarkable strategy that achieves clustering by finding density peaks (CDP). CDP addresses the limitations of DBSCAN by initially finding density peaks and using them to separate clusters. Density peaks are considered as points surrounded by enough other points with lower density. Hence, the distance between two density peaks should be higher than the distance between another arbitrary point and its closer point with a higher density. On the basis of this intuition, CDP identifies density peaks by detecting the outliers of a density-distance plot. This task can be performed either automat- ically or manually by inspecting the density-distance plot. Because of the simplicity of this rule, CDP can be applied whenever density can be measured, which holds in a wide range of applications. Once peaks are identified, CDP assigns them a unique label representing a cluster. However, the association rule of CDP for the remaining points consists of inheriting the label of the closest point with a higher density, which ends in being a density peak. Although this generic rule is appli- cable to any cluster shape, cases remain where such a local criterion is not optimal (i.e., it associates a point disregarding how the other points are associated). In this work, we propose to substitute the local association rule of CDP, with the solution of a global optimization problem on a graph, bringing two main contributions. First, a global vision on the dataset allows finding globally optimal solutions not identifiable with a local choice. Second, we evaluate path properties rather than point-to-point differences. This allows defining path-cost functions that can be gener- ically meaningful (i.e., large gap penalization). In addition, by providing examples of valid and invalid paths, a path classifier can be trained. This is used for easily adopting and adapting the proposed method to specific tasks and datasets, by providing examples rather than tuning param- eters, within a semisupervised approach for data analysis. We evaluate the proposed method (both with a generic path-cost function and with a trainable path classifier) on synthetic datasets designed to challenge clustering algorithms (2). Then, we provide two applications for analyzing real biomedical data. The first is the segmen- tation of highly nonconvex immune cells in confocal microscopy (grouping pixels in space). The second is the identification of different types of arrhythmia in electrocardiographic (ECG) signals. Our method obtained clustering results not obtainable by DBSCAN nor CDP. In conclusion, our method exploits network information (6) and the integration of possibly existing knowledge in line with a theory-guided 1 Institute for Research in Biomedicine, Faculty of Biomedical Sciences, Università della Svizzera italiana, CH6500 Bellinzona, Switzerland. 2 Institute of Computational Science, Università della Svizzera italiana, CH6900 Lugano, Switzerland. *Corresponding author. Email: [email protected] (S.F.G.); rolf.krause@ usi.ch (R.K.) †Co-last authors. SCIENCE ADVANCES | RESEARCH ARTICLE Pizzagalli et al., Sci. Adv. 2019; 5 : eaax3770 30 October 2019 1 of 10 on April 9, 2020 http://advances.sciencemag.org/ Downloaded from

Welcome message from author
This document is posted to help you gain knowledge. Please leave a comment to let me know what you think about it! Share it to your friends and learn new things together.
Transcript

SC I ENCE ADVANCES | R E S EARCH ART I C L E
COMPUTER SC I ENCE
1Institute for Research in Biomedicine, Faculty of Biomedical Sciences, Universitàdella Svizzera italiana, CH6500 Bellinzona, Switzerland. 2Institute of ComputationalScience, Università della Svizzera italiana, CH6900 Lugano, Switzerland.*Corresponding author. Email: [email protected] (S.F.G.); [email protected] (R.K.)†Co-last authors.
Pizzagalli et al., Sci. Adv. 2019;5 : eaax3770 30 October 2019
Copyright © 2019
The Authors, some
rights reserved;
exclusive licensee
American Association
for the Advancement
of Science. No claim to
originalU.S. Government
Works. Distributed
under a Creative
Commons Attribution
License 4.0 (CC BY).
A trainable clustering algorithm based on shortestpaths from density peaksDiego Ulisse Pizzagalli1,2, Santiago Fernandez Gonzalez2*†, Rolf Krause1*†
Clustering is a technique to analyze empirical data, with a major application for biomedical research. Essentially,clustering finds groups of related points in a dataset. However, results depend on both metrics for point-to-point si-milarity and rules for point-to-group association. Non-appropriate metrics and rules can lead to artifacts, especially incase of multiple groups with heterogeneous structure. In this work, we propose a clustering algorithm that evaluatesthe properties of paths between points (rather than point-to-point similarity) and solves a global optimization pro-blem, finding solutions not obtainable by methods relying on local choices. Moreover, our algorithm is trainable.Hence, it canbe adapted and adopted for specific datasets and applications by providing examples of valid and invalidpaths to train a path classifier. We demonstrate its applicability to identify heterogeneous groups in challenging syn-thetic datasets, segment highly nonconvex immune cells in confocalmicroscopy images, and classify arrhythmic heart-beats in electrocardiographic signals.
Do
on April 9, 2020
http://advances.sciencemag.org/
wnloaded from
INTRODUCTIONClustering algorithms aim at automatically grouping points. This task iscritical for extracting knowledge from complex datasets of unlabeleddata, which are commonly produced by empirical studies (1) and areimpossible to analyze manually (2). The identified groups can indicatethe presence of multiple phenomena (i.e., populations) in the dataset.Moreover, the structure of each group (hereafter, shape) can indicatethe relationship between the included points. Because clustering is aproblem without a unique solution, results depend on different metricsfor point-to-point similarity and rules for point-to-cluster association.However, metrics and rules generally restrict the set of admissiblesolutions. As a consequence, when metrics and rules are not chosenappropriately, clustering artifacts are introduced. This is especiallyrelevant when analyzing datasets that have points from populationswith arbitrary and heterogeneous structure.
For example, common implementations of the broadly used K-means algorithm (3) use the Euclidean distance as a metric forpoint-to-point similarity and point-to-cluster association. Despitethe efficiency of K-means in clustering linearly separable groups (i.e.,globular-like), artifacts can be introduced when attempting to separatenonconvex and nested shapes.
Methods based on density overcome these limitations. Arbitraryshapes are reconstructed according to a density-connectivity criterion.For example, DBSCAN (density-based spatial clustering of applicationswith noise) (4) considers two points belonging to the same cluster if asufficient number of points in a neighborhood are common (densityreachable). As a result, the association rule of DBSCAN correctly iden-tifies clusters with any shape having sufficient density. However, whentwo ormore clusters are present and in close proximity, a wide densityreachability threshold may join them, while an excessively strictthreshold may fail in detecting the clusters. Generally, algorithms likeDBSCAN depend on a density-connectivity threshold, which can bedifficult to adapt for specific dataset and applications.
Recently, Rodriguez andLaio (5) proposed a remarkable strategy thatachieves clustering by finding density peaks (CDP). CDP addresses thelimitations ofDBSCANby initially findingdensity peaks andusing themtoseparateclusters.Densitypeaksareconsideredaspoints surroundedbyenough other points with lower density. Hence, the distance betweentwodensity peaks should behigher than thedistance between anotherarbitrary point and its closer point with a higher density. On the basisof this intuition,CDP identifies density peaks bydetecting the outliersof a density-distance plot. This task can be performed either automat-ically or manually by inspecting the density-distance plot. Because ofthe simplicityof this rule,CDPcanbeappliedwheneverdensity canbemeasured,whichholds in awide rangeof applications.Oncepeaks areidentified, CDP assigns them a unique label representing a cluster.
However, the association rule of CDP for the remaining pointsconsists of inheriting the label of the closest point with a higher density,which ends in being a density peak. Although this generic rule is appli-cable to any cluster shape, cases remain where such a local criterion isnot optimal (i.e., it associates a point disregarding how the otherpoints are associated).
In this work, we propose to substitute the local association rule ofCDP, with the solution of a global optimization problem on a graph,bringing two main contributions. First, a global vision on the datasetallows finding globally optimal solutions not identifiable with a localchoice. Second, we evaluate path properties rather than point-to-pointdifferences. This allows defining path-cost functions that can be gener-ically meaningful (i.e., large gap penalization). In addition, by providingexamples of valid and invalid paths, a path classifier can be trained. Thisis used for easily adopting and adapting the proposedmethod to specifictasks and datasets, by providing examples rather than tuning param-eters, within a semisupervised approach for data analysis.
We evaluate the proposed method (both with a generic path-costfunction and with a trainable path classifier) on synthetic datasetsdesigned to challenge clustering algorithms (2). Then, we provide twoapplications for analyzing real biomedical data. The first is the segmen-tation of highly nonconvex immune cells in confocal microscopy(grouping pixels in space). The second is the identification of differenttypes of arrhythmia in electrocardiographic (ECG) signals. Ourmethodobtained clustering results not obtainable by DBSCAN nor CDP.
In conclusion, ourmethod exploits network information (6) and theintegration of possibly existing knowledge in line with a theory-guided
1 of 10

SC I ENCE ADVANCES | R E S EARCH ART I C L E
data science paradigm (7). We consider it as a step toward machines(fast, operation based) capable of working collaboratively with humans(slow, practice based) (1).
RESULTSComparison with CDP on a simplified datasetInCDP, a point is associatedwith the closest pointwith a higher density.This local rule takes place regardless of how the other points are asso-ciated, and there exist cases where artifacts are introduced. An exampleis illustrated in Fig. 1A, where a long-thin projection of a nonglobularcluster and a second globular-like cluster are in close proximity. Theestimated point density (Fig. 1Β) and the distance to the closest point
Pizzagalli et al., Sci. Adv. 2019;5 : eaax3770 30 October 2019
with a higher density (Fig. 1C) are used to find density peaks in adensity-distance plot (Fig. 1D). For a generic point x, the associationrule of CDP connects it to the wrong density peak q (Fig. 1D, whitearrows). By contrast, our algorithm computes the path optimallyconnecting x to a density peak, which turns out to be p (Fig. 1F, whitearrows). Although local heuristics would not consider that path (i.e.,longer, nonsmooth density variation), our algorithm identifies it bysolving a shortest path problem in which paths havingmultiple smallgaps rather than fewer but larger gaps are preferred. This has beenexpressed using a minimax path-cost function (Fig. 1G). As a result,the thin portion of the cluster is correctly associated by our algorithm(Fig. 1, H and I). We consider the differences in this example relevant.Analyzing the cuts introduced by the two algorithms (Fig. 1, dashed
on April 9, 2020
http://advances.sciencemag.org/
Dow
nloaded from
A B
0 2.50
140
ρ
δ
C
D
H I
0
140
0
2.5
E
q
p
x
F
q
p
x
s
qp
G
Γ = {s,p,a,b,c,d,e,f,g,x}ξ (Γ) = max wi Γ
p
c
d
b
a
e
x
g
fs
Dataset Density (ρ) Distance (δ)
Density peaks Local association (CDP) Global association (ours)
Path properties Results (CDP) Results (ours)
0
2.5
Fig. 1. Association rules on a simplified example. (A) Raw data points in a 2D space. (B) Color-coded point density (r). (C) Color-coded distance to the closest pointwith a higher density (d). (D) Density-distance plot for selecting density peaks (dashed box), characterized as outliers with sufficiently high density and distance. In thiscase, the density peaks correspond to the points p, q in (E) and (F). (E) Local association rule of CDP connecting a point x, to the closest point with higher density, untilthis is a density peak. This happens regardless of the other connections. (F) Global association rule of the proposed method, which computes the optimal path toconnect a starting node s to a generic point x, passing by density peaks. (G) The path from S, via p, to x can be evaluated according to its properties, such as themaximum gap included. (H) Color-coded results of CDP. (I) Color-coded results of the proposed algorithm.
2 of 10

SC I ENCE ADVANCES | R E S EARCH ART I C L E
on April 9, 2020
http://advances.sciencemag.org/
Dow
nloaded from
lines), CDP introduces a visually nonrealistic cut, without the possibilityof specifying how a cut should (or should not) be. By contrast, ouralgorithm obtained a visually realistic boundary by specifying desiredpath properties. The same result can be obtained using CDP to initiallyidentify multiple smaller clusters (i.e., selecting more density peaks)and subsequently applying a graph-based algorithm to join them.However, this would require selection of density peaks that are notemerging to a smaller extent from the density-distance plot. Moreover,it would require specifying how to join subclusters at a higher level ofabstraction (subgroup-to-subgroup similarity). Our algorithm solvesthis issue at the root and allows specifying how to group points at a low-er level of abstraction, which is useful when pairwise-to-pathwiseknowledge is available.
Algorithm for global optimizationWe consider clustering as the problem of associating each point to adensity peak with the optimal set of paths. This problem is modeledas a single-source shortest path (SSSP) on a graph (Fig. 1F and fig.S1). A globally optimal solution is computed by Dijkstra’s SSSPalgorithm (8), adopting a customized path-cost function.
To explain this in more detail, let us define the following quantities.LetG(V, E,w) be a weighted graph where a node v ∈V is connected
to another node u ∈V, v≠ u through an edge ev,u ∈ E with an associatedcost wv,u : E →ℝ+. wu, v is a distance metric (i.e., Euclidean distance).
Let rv be the density of a given node v ∈V, defined as the number ofpoints in a weighted neighborhood. See (5) for an implementationwhere a Gaussian kernel is used to estimate rv.
Let dv=min ∥ v − u∥ ∀u ∈V such that ru > rv, which is the distanceof v to the closest point u with a higher density.
LetPt⊂V,Pt = {v∣v∈V, rv> tr ∩ dv> td}, where 0< tr <max (r),0 <td <max (d) are two arbitrary thresholds.We call the points in the setPtdensity peaks, i.e., nodes whose local density and distance to the closestpoint with a higher density are both sufficiently high.
Let s be a fictitious node added to G and connected to each densitypeak with an edge having a negligible cost D (fig. S1).
The goal is to find the SSSP toward all the points with s as source,corresponding to the minimal spanning tree having s as root. Let G ={s, …, x} be the shortest path connecting the starting node s to an ar-bitrary point x. It is possible to show for reductio ad absurdum (proofS1) that x is reached, passing through a single density peak (and possiblyintermediate points). In this case, x belongs to the cluster containing p.
Let wi,j be the Euclidean distance between two nodes. If G is fullyconnected, the usage of a path-cost function that sums the cost of edgesin the path does not penalize large gaps nor the problem of associatingx to the closest but possibly not optimal peak p. Therefore, we describethe position of xwith respect to a density peak by evaluating the pathconnecting them. Properties of the path, such as mediating elements(9), textures (10), density patterns, or user-defined metrics, can beused to associate a meaningful cost.
Dijkstra’s SSSP algorithm can be adopted to compute the shortestpaths on graphs if the path cost is not decreasingwhen extending a path.Being x :G→R, x(G) = c the cost of a path G ∈G, the following shouldbe guaranteed
xðG ¼ fs; xigÞ ≤ xðG′ ¼ fs; xi; xiþ1gÞ ð1Þ
Several functions respect Eq. (1).Among these, cumulative functionssum theweights of edges included in the pathxpðGÞ ¼ ∑i;j∈G ð∣wi;j∣pÞ1p.
Pizzagalli et al., Sci. Adv. 2019;5 : eaax3770 30 October 2019
Values of p ≥ 1 penalize edges with high cost, preferring (if possible)alternative multiple edges with lower cost. Generally, p > 1 acts a reg-ularizer, preferring edges with similar value.
When p→ + inf, the total cost of a path is given by the edge withmaximum cost in the path. This metric is used in the minimax for-mulation, which defines for a generic path L the cost xinf(L) as max(wi, i+1), i, i + 1 ∈ L. L is “minimax” if its cost is minimum withrespect to all the existing paths from the same source to the samedestination
G ″minimax″ if xinf ðGÞ ≤ xinf ðLÞ ∀L ≠ G
Trainable path-cost functionThe Dijkstra algorithm incrementally extends a set of shortest paths byevaluating the cost of the possible extensions. We exploited this behav-ior and used a custom function for computing the cost of an extendedpath, based on the last path fragment. Let G1 = {s, x1, x2,…, xn−w,…, xn}be a path from s to xn with associated cost c1. The cost of the extendedpath G2 = {s, x1, x2,…, xn−w,…, xn, xn+1} can be evaluated by meansof a function that considers the cost until xn (corresponding to c1),and the path fragment xn−w,…, xn, xn+1, wherew + 1 is the number ofnodes in the fragment. In the original formulation of the Dijkstraalgorithm, this is computed by adding to c1 the cost of the edge fromxn to xn + 1. Instead, we propose to evaluate properties of a fragmentincluding w nodes (more than one). Therefore, this fragment can beevaluated by a path classifier trained on a fixed number of elements.
Among the possible features to describe such a path fragment,we propose the density profile as the ordered density values of thenodes in the fragment. This opens the possibility to integrate existingknowledge in a supervised learning approach to prefer certain pathswith respect to others by training a path classifier providingexamples of admissible and nonadmissible paths.
Reconstruction of heterogeneous synthetic shapesTo benchmark the proposed algorithm, we benefit from the availabilityof the ClustEval platform (2), which provides synthetic datasets specif-ically designed to challenge clustering algorithms, together with an eval-uation methodology. Among these datasets, we report the comparisonwith respect to other common methods on an example categorized asdifficult, which visually contains heterogeneous structures (i.e., twoglobular-like clusters, surrounded by one thin-elongated cluster)(Fig. 2A). Our method achieves comparable performances to state-of-the-art algorithms when the generic minimax path-cost function isused (Fig. 2, A and B, orange columns).
However, our method outperforms the other algorithms whentrained with examples of valid and invalid paths (Fig. 2, A and B, bluecolumns). In this example, 25 fragments of goodpaths and 25 fragmentsof bad paths composed by five points, respectively (Fig. 2C), were au-tomatically generated from the ground truth and were described usingthe density of points as feature vector (Fig. 2D). In comparison to CDP,ourmethod allowed correct clustering of the outermost elongated struc-ture while still keeping separate the two central globular clusters. Weprovide two scripts to train the algorithm. In demo_trainable.m (datafile S2), we provide the code for training the algorithm from an available(but not necessarily complete) ground truth. In demo_interactive.minstead, a GUI (graphical user interface) allows a user to visuallyinspect the dataset and annotate valid/invalid paths. A video showingan example of interactive training is provided inmovie S1. Quantitativeresults on the remaining datasets included in ClustEval are provided
3 of 10

SC I ENCE ADVANCES | R E S EARCH ART I C L E
on April 9, 2020
http://advances.sciencemag.org/
Dow
nloaded from
in fig. S2A. Among these, in fig. S2B, we zoom in another challengingdataset where the trainable version of the algorithm allowedclustering of heterogeneous groups. A performance degradation assaywith respect to the number of training paths and the length of the pathfragments is provided in fig. S3.Robustness to density peak detectionResults of the proposed algorithm depend on the initial identification ofdensity peaks. Figure 3 includes a performance assay, evaluating the F1score of the proposed method with respect to an artificial perturbationon the position of density peaks (Fig. 3A). In the example 04_fu_flamefrom ClustEval (2), the proposed method tolerates perturbations up to30% of the dataset size without decrease in performance (Fig. 3B).Above this level, the algorithm exhibited a variable and generallydecreasing behavior that was dependent on the position of the peakswith respect to the conformation of the dataset. More precisely, whentwo seeds were randomly assigned to points in the same cluster, anundesired partition was introduced, lowering the performances. Per-turbations keeping seeds in two separated clusters are better tolerated(Fig. 3C).
The identification of density peaks depends on the setting of thethreshold parameters tr and td. These two parameters can be set to se-lect only the outliers of a density-distance plot [see (5)] (Fig. 3D).Variations from the optimal values that do not select additional points
Pizzagalli et al., Sci. Adv. 2019;5 : eaax3770 30 October 2019
as density peaks keep the maximum achievable performance.Variations that include additional points result in the identification ofan increased number of clusters, lowering the performance with respectto the ground truth labels (Fig. 3E).Noise handlingThe proposed method can identify points that are suitable to be con-sidered as noise by analyzing the path connecting them to a cluster. Thiscan be achieved, for instance, by introducing a cutoff threshold on thepath cost.When using a trainable path-cost function, examples of pathsincluding noisy points can be used to penalize these connections.Automatic thresholding methods such as Otsu thresholding (11)can be used to set the cutoff distance. Considering that a density profilecan be used as path descriptor, this strategy is in line with the criterionof DBSCAN, which considers as noise those points not density reach-able from a cluster.
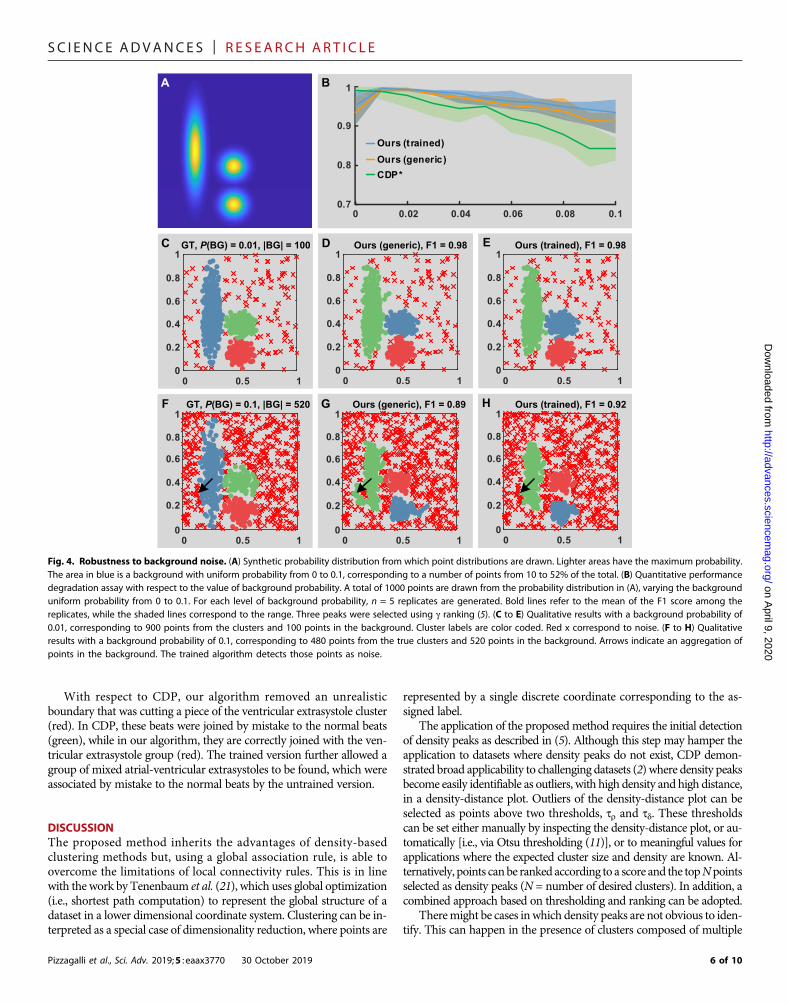
A benchmark of the proposedmethod in the presence of backgroundnoise is reported in Fig. 4. To this end, we generated a synthetic prob-ability distribution with three density peaks and a uniform backgroundwith a different probability (Fig. 4A). The proposed method exhibitedaverage better results than CDP, with a decreased slope of the F1 scorewith respect to the background noise level (Fig. 4B). With a low level ofbackground noise, both a minimax path-cost function and a trainedpath-cost function achieved similar performances (Fig. 4, C to E).
CDesiredNot desired
Training paths D
GT
00.20.40.60.8
1
F1 score Jaccard index
CDP
DBSCAN
Ours (generic)
Ours (trained)
B
A CDP Ours (generic) Ours (trained)DBSCAN
0
15
1 2 3 4 51 2 3 4 5
Density profile
Node
Path
Fig. 2. Evaluation on a synthetic dataset with heterogeneous structures. (A and B) The performances of the proposed method are evaluated on the syntheticdataset 01_chang_pathbased provided in ClustEval (2). This includes groups with heterogeneous structures (i.e., a thin-elongated structure surrounding two globular-like structures). Our method, with a generic minimax path-cost function, partially improved the results produced by CDP and DBSCAN (A and B) with respect to theground truth (GT). By contrast, by training a path classifier, the algorithm achieved full performances with an F1 score ≥0.99 and a Jaccard index ≥0.98. (C) Trainingpaths composed of 25 examples of desired paths and 25 examples of undesired paths. (D) Path features corresponding to the density profile (vector including thedensity of the nodes in the path).
4 of 10

SC I ENCE ADVANCES | R E S EARCH ART I C L E
on April 9, 2020
http://advances.sciencemag.org/
Dow
nloaded from
For higher levels of noise, a path-cost function trained to associatehigh cost to paths including noise (Fig. 4, F to H) yielded an improvedrecognition of background.
Application on biomedical dataSegmentation of immune cells in confocal microscopyMicroscopy images are considered challenging spatiotemporal bio-medical datasets (12, 13). This is particularly relevant for images ofimmune cells, which exhibit high plasticity, both globular and nonglob-ular shapes, possibly in contact (14, 15). Considering segmentation as agrouping task, the aforementioned properties represent challenges forclustering algorithms (i.e., heterogeneous shapes in close proximity).Moreover, they remain challenging for state-of-the-art bioimagingsoftware, which requires manual correction of results, lowers usability(16), and compromises reproducibility.
Here, we apply our clustering algorithm for grouping pixels. We as-sume that other image-processing tasks such as background removalhave been already executed with specific software such as Ilastik (17),Trainable Weka Segmentation (18), or Imaris (Bitplane). Qualitativeresults are presented in Fig. 5. Similar to the example in Fig. 1, in Fig.5A, the local association rule of CDP yields to the wrong associationof a thin dendrite (i) but correctly separates touching cells (ii). In Fig.5B, DBSCANcorrectly reconstructs the shape of dendritic cells but doesnot separate touching cells. In Fig. 5C, our algorithm, penalizing largegaps in the paths, connects the pixels to the correct density peaks in boththe cases.
In this example, training the algorithm does not increase perform-ances substantially. These are limited because more than necessarydensity peaks are identified as starting points. As a consequence, some
Pizzagalli et al., Sci. Adv. 2019;5 : eaax3770 30 October 2019
cells are split into multiple parts. Tomerge these subclusters, a differentmetric can be used for computing the d measure for each peak. Alter-natively, methods for merging multiple clusters such as (19) can be ap-plied for postprocessing.Identification of different heart rhythmsLong-term ECG records are widely used to capture the dynamic behav-ior of the heart, which may change over time and exhibit differentrhythms. Here, we applied clustering analysis to automatically identifydifferent rhythms in a complex ECG record showing various types ofarrhythmia (20). Arrhythmia affects the distance between heartbeats(Fig. 6A). To this end, we described each heartbeat with two parameterscorresponding to the distance (in seconds) from the previous (RR1) andthe next (RR2) heartbeat. These two parameters are similar in sinusrhythms (Fig. 6B) and vary linearly according to the heart rate.However,in the presence of extrasystoles, thesemay change. Extrasystoles are beatsthat stay closer to the previous beat and are possibly followed by a longpause. There are two main types of extrasystoles: atrial and ventricular.The second has an increased alteration of the distances. Life-threateningarrhythmias such as ventricular tachycardia and flutter result in ex-tremely short distances between beats (Fig. 6, C and D), compromisingthe pump function of the heart. In results presented in Fig. 6E, ouralgorithm identified six different rhythms.
Similar to the ground truth (manually annotated by a group ofcardiologists), our algorithm identified groups corresponding to ven-tricular flutter (brown), isolated ventricular extrasystoles (red), isolatedatrial extrasystoles (orange), and right bundle branch block (blue). Bycontrast, the algorithm identified two different subtypes (instead of one)of sinus beats, one associated with lower heart rate (gold), and one as-sociated with higher heart rate (green).
A
F1sc
ore
1
B
0 10
1
00 10
1
0 0
0.2
0.4
0.6
0.8
1F1 score (Ours) F1 score (CDP)
τ δ
τρτρ
τ δ
D E
0 100
1
0 100
1
ρ
δ
C
0 0.2 0.4 0.6 0.8 10.6
1 OursCDP*
F1 = 1J = 1
1
0
τ δ
Fig. 3. Robustness to density peak detection. (A) Color-coded ground truth including two clusters in close proximity (red and blue) from the synthetic dataset04_fu_flame provided in ClustEval. Points colored in black, at the intersection of the arrows, are the identified density peaks, which are used as seeds by the proposedalgorithm. The position of seeds is perturbed by a displacement of max ±1 (black line). (B) Performance degradation with respect to the maximum perturbation. Results areobtainedwith n = 5 replicaswith a randomperturbation direction. CDP* refers to amodified version of CDP, forced to associate points to the perturbed seeds. (C) Color-codedresults of the proposed method using the seeds colored in black. (D and E) Robustness to the setting of tr and td parameters. The optimal settings of the parameters (D)identifies two outliers of the d − r graph. (E) Variations from the optimal settings include additional subclusters, lowering the performances of the algorithm.
5 of 10
SC I ENCE ADVANCES | R E S EARCH ART I C L E
on April 9, 2020
http://advances.sciencemag.org/
Dow
nloaded from
With respect to CDP, our algorithm removed an unrealisticboundary that was cutting a piece of the ventricular extrasystole cluster(red). In CDP, these beats were joined by mistake to the normal beats(green), while in our algorithm, they are correctly joined with the ven-tricular extrasystole group (red). The trained version further allowed agroup of mixed atrial-ventricular extrasystoles to be found, which wereassociated by mistake to the normal beats by the untrained version.
DISCUSSIONThe proposed method inherits the advantages of density-basedclustering methods but, using a global association rule, is able toovercome the limitations of local connectivity rules. This is in linewith the work by Tenenbaum et al. (21), which uses global optimization(i.e., shortest path computation) to represent the global structure of adataset in a lower dimensional coordinate system. Clustering can be in-terpreted as a special case of dimensionality reduction, where points are
Pizzagalli et al., Sci. Adv. 2019;5 : eaax3770 30 October 2019
represented by a single discrete coordinate corresponding to the as-signed label.
The application of the proposed method requires the initial detectionof density peaks as described in (5). Although this step may hamper theapplication to datasets where density peaks do not exist, CDP demon-strated broad applicability to challenging datasets (2) where density peaksbecome easily identifiable as outliers, with high density and high distance,in a density-distance plot. Outliers of the density-distance plot can beselected as points above two thresholds, tr and td. These thresholdscan be set either manually by inspecting the density-distance plot, or au-tomatically [i.e., via Otsu thresholding (11)], or to meaningful values forapplications where the expected cluster size and density are known. Al-ternatively, points canbe ranked according to a score and the topNpointsselected as density peaks (N = number of desired clusters). In addition, acombined approach based on thresholding and ranking can be adopted.
Theremight be cases inwhich density peaks are not obvious to iden-tify. This can happen in the presence of clusters composed of multiple
B
0 0.02 0.04 0.06 0.08 0.10.7
0.8
0.9
1
Ours (generic)CDP*
Ours (trained)
A B
0 0.02 0.04 0.06 0.08 0.10.7
0.8
0.9
1
Ours (generic)CDP*
Ours (trained)
0 0.5 10
0.2
0.4
0.6
0.8
1
0 0.5 10
0.2
0.4
0.6
0.8
1
0 0.5 10
0.2
0.4
0.6
0.8
1
0 0.5 10
0.2
0.4
0.6
0.8
1
0 0.5 10
0.2
0.4
0.6
0.8
1
0 0.5 10
0.2
0.4
0.6
0.8
1GT, P(BG)=0.01, |BG|=100 Ours (generic), F1=0.98 Ours (trained), F1=0.98C D E
0 0.5 10
0.2
0.4
0.6
0.8
1
0 0.5 10
0.2
0.4
0.6
0.8
1
0 0.5 10
0.2
0.4
0.6
0.8
1GT, P(BG) = 0.01, |BG| = 100 Ours (generic), F1 = 0.98 Ours (trained), F1 = 0.98C D E
0 0.5 10
0.2
0.4
0.6
0.8
1
0 0.5 10
0.2
0.4
0.6
0.8
1
0 0.5 10
0.2
0.4
0.6
0.8
1
0 0.5 10
0.2
0.4
0.6
0.8
1
0 0.5 10
0.2
0.4
0.6
0.8
1
0 0.5 10
0.2
0.4
0.6
0.8
1GT, P(BG)=0.1, |BG|=520 Ours (generic), F1=0.89 Ours (trained), F1=0.92F G H
0 0.5 10
0.2
0.4
0.6
0.8
1
0 0.5 10
0.2
0.4
0.6
0.8
1
0 0.5 10
0.2
0.4
0.6
0.8
1GT, P(BG) = 0.1, |BG| = 520 Ours (generic), F1 = 0.89 Ours (trained), F1 = 0.92F G H
Fig. 4. Robustness to background noise. (A) Synthetic probability distribution from which point distributions are drawn. Lighter areas have the maximum probability.The area in blue is a background with uniform probability from 0 to 0.1, corresponding to a number of points from 10 to 52% of the total. (B) Quantitative performancedegradation assay with respect to the value of background probability. A total of 1000 points are drawn from the probability distribution in (A), varying the backgrounduniform probability from 0 to 0.1. For each level of background probability, n = 5 replicates are generated. Bold lines refer to the mean of the F1 score among thereplicates, while the shaded lines correspond to the range. Three peaks were selected using g ranking (5). (C to E) Qualitative results with a background probability of0.01, corresponding to 900 points from the clusters and 100 points in the background. Cluster labels are color coded. Red x correspond to noise. (F to H) Qualitativeresults with a background probability of 0.1, corresponding to 480 points from the true clusters and 520 points in the background. Arrows indicate an aggregation ofpoints in the background. The trained algorithm detects those points as noise.
6 of 10

SC I ENCE ADVANCES | R E S EARCH ART I C L E
on April 9, 2020
http://advances.sciencemag.org/
Dow
nloaded from
subclusters. Peaks of these subclusters may arise in the density-distanceplot. In this case, a hierarchical approach is suggested.
Recently, Du et al. (22) proposed an approach that facilitates theidentification of density peaks using the graph distance to compute d.Two points in the same cluster aremore likely to be connected by a pathwith low cost.Density peaks that are in distinct clusters instead aremorelikely to be connected by a path with high cost. Hence, the graph dis-tance of density peaks is likely to be higher than the graph distance ofarbitrary nonpeak points in the same cluster, resulting in higher valuesof d for density peaks.
The proposed method generalizes to high-dimensional datasets ifthey can be represented as a graph and a point density can be estimated.Commonmethods to estimate point density rely on Euclidean distanceto define a neighborhood. However, Euclidean distance loses significancewith an increasing number of variables (23). Hence, it should be com-puted only in a sufficiently restricted neighborhood. Figure S4 reportsa benchmark on synthetically generated datasets, including multi-dimensional distributions using Euclidean distance as metric to buildthe graph. The proposed algorithm exhibits comparable performancesto CDP.
Pizzagalli et al., Sci. Adv. 2019;5 : eaax3770 30 October 2019
Arbitrary nonnegative metrics for edge cost are supported by theproposed methods. Figure S5 reports an application on real high-dimensional data from the bone marrow leukemia dataset (2, 24).Such a dataset includes the gene expression level of 999 genes from38 samples of patients with three different types of leukemia. Theproposed method correctly identified three groups with comparableperformances to CDP. In this case, the graphwas built with an edge costderived from the Spearman correlation.
Alternatively, graph pruning can be used together with acumulative Euclidean path-cost function to limit the connectivityof each node within a restricted neighborhood. Methods for dimen-sionality reduction can further be used for data preprocessing.Among these, global and nonlinear approaches, such as Isomap(21), are preferable with respect to principal components analysisfor highly nonconvex datasets.
The proposed path-based formulation supports the expressionof a path cost by evaluating path properties. A nondecreasing path-cost function allows solving the proposed clustering problem usingDijkstra’s SSSP algorithm. Among the possible path-cost functions,minimax penalizes paths with large gaps, which is a generically
AOURSCDP
D
DBSCAN
i
ii
i
ii
i
ii
i
ii
B C
i
ii
i
ii
00.20.40.60.8
1
F1 score Jaccard index
CDPDBSCANOurs (generic)Ours (trained)
Fig. 5. Application for segmentation of immune cells. (A to C) Qualitative results (color-coded labels) produced by different density-based clustering algorithms forclustering pixels in space. Images show a confocal microscopy acquisition of murine immune cells, labeled with CD11c + GFP. (i) Magnification showing a cell withdendritic morphology close to a cell with globular shape. (ii) Magnification showing two cells with globular shape in contact. CDP (A) using a Euclidean metric correctlyseparates touching cells but associates a piece of dendrite to the wrong cell. DBSCAN (B) correctly reconstructs the shape of dendritic cells but is not able to separatetouching cells with the same density-reachability criterion. The proposed method (C) correctly associates the dendrite of the dendritic cell and separates the touchingcells. Black lines indicate the optimal path followed by the algorithm, from the cell centroid (density peak) to a point in the dendrite and in the touching region,respectively. (D) Quantitative performances. The F1 score and the Jaccard index are computed with respect to the ground truth. Here, the trained version of thealgorithm achieved similar performances to the generic version. These are bounded because of the separation of cells with increased size into multiple subclusters.
7 of 10

SC I ENCE ADVANCES | R E S EARCH ART I C L E
on April 9, 2020
http://advances.sciencemag.org/
Dow
nloaded from
desired property. Other nonlinear functions can be designed forspecific tasks.
Dijkstra’s SSSP algorithm exhibits a lower than quadratic com-putational complexity that can be reduced for sparse graphs. More-over, it does not require storage of the adjacencymatrix onmemoryand can be speeded up by adopting heuristics for optimal path-finding or graph-partitioning techniques. Another advantage ofthe Dijkstra algorithm is that it supports graphs withmultiple edgesbetween two nodes. This opens the possibility to express the dis-tance between two nodes using multiple edges and metrics. Duringthe optimization process, the edge and the metric that are moreconvenient for the solution will be automatically selected. There-fore, we consider this method suitable to be adapted and optimizedfor specific applications.
Last, existing knowledge can be integrated by defining an appropri-ate path-cost function, which can be obtained, for instance, by training apath classifier with examples provided by humans or available groundtruths. Therefore, it represents an intermediate method between ma-
Pizzagalli et al., Sci. Adv. 2019;5 : eaax3770 30 October 2019
chine and human computation for tasks that would benefit from a col-laborative effort (1, 25).
MATERIAL AND METHODSData generationConfocal microscopyFor data shown in Fig. 5, immunofluorescence confocal microscopywas performed using a Leica TCS SP5 microscope, with sequential ac-quisition to limit signal cross-talking. A murine trachea was collectedand fixed in 4% paraformaldehyde at 4°C for 1 hour. Tracheas werecut in two halves along the long axis. Pieces were placed on a micros-copy slide and embedded in FluoromountAqueousMountingMedium(Sigma-Aldrich). Three-dimensional (3D) images were acquired usingan HCX PL APO CS 20×/0.7 oil immersion objective, and z-step was1 mm for a total depth ranging from 50 to 112 mm. The bioimagingsoftware Bitplane Imaris (v 9.2.1) was used for computing the 2Dmax-imum intensity projections and formanual cell segmentation. The same
EDesired paths Undesired paths
CDP Ours (generic) Ours (trained)
RR
1 (s
)
RR
1 (s
)R
R1
(s)
RR
1 (s
)
RR
1 (s
)
RR
1 (s
)
RR2 (s) RR2 (s)
RR2 (s) RR2 (s) RR2 (s)
GT
RR2 (s)
VFAELRV
A B
C D
Fig. 6. Recognition of different heart rhythms. (A to D) Fragments of an ECG signal from a patient with several types of arrhythmia. Blue lines indicate a beat(systole). Cardiologists labeled six different types of beats “A, V, E, R, L, and !,” associated with different rhythms. Atrial/ventricular/ectopic beats “A/V/E” are extrasystolesclose to the previous beat that can induce a pause in the rhythm (A). Right bundle branch block “R”: beat appearing in this patient between two V. Left bundle branchblock “L” (B): normal beat type for this patient (similar RR1 and RR2 varying linearly in tachycardia and bradycardia). Runs of ventricular extrasystoles not followed bylong pause are also reported (C). Ventricular flutter “!,” later indicated as “VF,” a critical condition characterized by extremely fast contractions (D). (E) Heartbeatsrepresented as points, described according to their distance from the previous and to the next beat (RR1 and RR2). Our method recognized ventricular extrasystoles(red), which are otherwise mixed with L beats by CDP. The trained version of the algorithm further allowed identification of a group composed of mixed atrial andventricular extrasystoles (orange).
8 of 10

SC I ENCE ADVANCES | R E S EARCH ART I C L E
on April 9, 2020
http://advances.sciencemag.org/
Dow
nloaded from
software (Coloc functionality) was used to exclude the background andto create a channel containing only the points belonging toCd11c-GFP+
cells. This dataset along with the ground truth is provided in data file S1using the same format described in (2).
Mice were maintained in specific pathogen–free facilities at theInstitute for Research in Biomedicine, Bellinzona. Experiments wereperformed in accordance with the Swiss Federal Veterinary Officeguidelines, and animal protocols were approved by the veterinarianlocal authorities.Synthetic datasetsThe dataset presented in Fig. 1 is provided in data file S1. The syn-thetic point distributions in Fig. 4 were generated by the scriptbenchmark_noise.m in data file S2.More precisely, three bivariate dis-tributions were overimposed to a uniform background. This wasachieved by creating a probability matrix M of size 200 × 200. Then,1000 samples were extracted from the matrix as follows. For eachsample, a pair of random coordinates (x, y) and a random number p,from 0 to 1 with uniform probability, were generated. IfM(x, y) > p andthe point was not already selected, then it was included into the dataset.
Points in the background were selected if the probability of thebackgroundwas higher than the randomly generated number. Control-ling the probability of the background allowed selection of a differentnumber of points in the background with respect to the points in theother distributions.
The synthetic high-dimensional datasets in fig. S4 were generatedusing MDCGen (Multidimensional Dataset Generator for Clustering)(26), configured to generate two multivariate Gaussian distributions.The number of dimensions ranged from 2 to 100. For each dimension,15 different distributions (mean and variance) were randomly com-puted. Code is provided in the script benchmark_dimensions.m (datafile S2).
ImplementationThe proposed algorithm was implemented in MATLAB r2017b. Ademo for both the generic (minimax) and trainable algorithms areprovided respectively in demo_generic.m and demo_trainable.m in(data file S2). Moreover, an interactive example where the user canvisually draw examples of valid paths and invalid paths on a 2D datasetis provided in demo_interactive.m and in movie S1.
Dijkstra’s SSSP algorithm, which is at the core of the proposedmethod, was implemented using vectorization and outperformingthe graphshortestpath() routine distributed with the BioinformaticsToolbox of MATLAB r2017b.
The following libraries have been used:• DensityClust.m—implementation of the CDP clustering
algorithm (fileexchange/53922-densityclust)• dbscan.m—implementation of the DBSCAN clustering
algorithm (www.peterkovesi.com/matlabfns/Misc/dbscan.m)• FitCSVM—implementation of a supported vector machine
classifier (MATLAB Bioinformatics Toolbox)• mdcgen-matlab (26)—generator of high-dimensional datasets
for clustering (https://github.com/CN-TU/mdcgen-matlab).
Path classifierIn the example provided in Fig. 2 (C to E), a support vector machinewith radial basis function kernel was trained on 25 desired paths and 25nondesired path fragments. Results can be reproduced, and trainingdata can be generated using the MATLAB script demo_trainable.mprovided in data file S2.
Pizzagalli et al., Sci. Adv. 2019;5 : eaax3770 30 October 2019
EvaluationFor the quantitative benchmarking of the proposed method with re-spect to the ground truth, the F1 score and the Jaccard index (J) werecomputed according to (2). These were defined as follows: F1 = 2 *(Recall * Precision)/(Recall + Precision). J = TP/(TP + FN + FP),where TP is the true positive, FN is the false negative, FP is the falsepositive, and TN is the true negative. Recall = (TP)(TP + FN),Precision = TP/(TP + FP).
SUPPLEMENTARY MATERIALSSupplementary material for this article is available at http://advances.sciencemag.org/cgi/content/full/5/10/eaax3770/DC1Proof S1. Unique cluster assignation.Fig. S1. Graph structure.Fig. S2. Results on the 12 synthetic datasets provided by ClustEval.Fig. S3. Performance degradation with respect to number of training paths.Fig. S4. Benchmark on high-dimensional synthetic datasets.Fig. S5. Results on the bone marrow leukemia dataset.Data file S1. Additional datasets used in this article.Data file S2. MATLAB source code of both the generic and trainable algorithm.Movie S1. Demo showing the training procedure.
View/request a protocol for this paper from Bio-protocol.
REFERENCES AND NOTES1. M. I. Jordan, T. M. Mitchell, Machine learning: Trends, perspectives, and prospects. Science
349, 255–260 (2015).2. C. Wiwie, J. Baumbach, R. Röttger, Comparing the performance of biomedical clustering
methods. Nat. Methods 12, 1033–1038 (2015).3. J. MacQueen, Some methods for classification and analysis of multivariate observations,
in Proceedings of the Fifth Berkeley Symposium on Mathematical Statistics and Probability(University of California Press, 1967), vol. 1, pp. 281–297.
4. M. Ester, H.-P. Kriegel, J. Sander, X. Xu, A density-based algorithm for discovering clustersa density-based algorithm for discovering clusters in large spatial databases with noise,in Proceedings of the Second International Conference on Knowledge Discovery and DataMining (KDD'96) (AAAI Press, 1996), vol. 96, pp. 226–231.
5. A. Rodriguez, A. Laio, Clustering by fast search and find of density peaks. Science 344,1492–1496 (2014).
6. S. Gerber, I. Horenko, Improving clustering by imposing network information. Sci. Adv. 1,e1500163 (2015).
7. A. Karpatne, G. Atluri, J. H. Faghmous, M. Steinbach, A. Banerjee, A. Ganguly, S. Shekhar,N. Samatova, V. Kumar, Theory-guided data science: A new paradigm for scientificdiscovery from data. IEEE Trans. Knowl. Data Eng. 29, 2318–2331 (2017).
8. E. W. Dijkstra, A note on two problems in connexion with graphs. Numer. Math. 1,269–271 (1959).
9. B. Fischer, J. M. Buhmann, Path-based clustering for grouping of smooth curves andtexture segmentation. IEEE Trans. Pattern Anal. Mach. Intell. 25, 513–518 (2003).
10. S. Ghidoni, L. Nanni, S. Brahnam, E. Menegatti, in Studies in Health Technology andInformatics (IOS Press, 2014), pp. 74–82.
11. N. Otsu, A threshold selection method from gray-level histograms. IEEE Trans. Syst. ManCybern. 9, 62–66 (1979).
12. V. Ulman, M. Maška, K. E. G. Magnusson, O. Ronneberger, C. Haubold, N. Harder, P. Matula,P. Matula, D. Svoboda, M. Radojevic, I. Smal, K. Rohr, J. Jaldén, H. M. Blau, O. Dzyubachyk,B. Lelieveldt, P. Xiao, Y. Li, S.-Y. Cho, A. C. Dufour, J.-C. Olivo-Marin, C. C. Reyes-Aldasoro,J. A. Solis-Lemus, R. Bensch, T. Brox, J. Stegmaier, R. Mikut, S. Wolf, F. A. Hamprecht,T. Esteves, P. Quelhas, Ö. Demirel, L. Malmström, F. Jug, P. Tomancak, E. Meijering,A. Muñoz-Barrutia, M. Kozubek, C. Ortiz-de-Solorzano, An objective comparison ofcell-tracking algorithms. Nat. Methods 14, 1141–1152 (2017).
13. M. Maška, V. Ulman, D. Svoboda, P. Matula, P. Matula, C. Ederra, A. Urbiola, T. España,S. Venkatesan, D. M. W. Balak, P. Karas, T. Bolcková, M. Štreitová, C. Carthel,S. Coraluppi, N. Harder, K. Rohr, K. E. G. Magnusson, J. Jaldén, H. M. Blau,O. Dzyubachyk, P. Křížek, G. M. Hagen, D. Pastor-Escuredo, D. Jimenez-Carretero,M. J. Ledesma-Carbayo, A. Muñoz-Barrutia, E. Meijering, M. Kozubek,C. Ortiz-de-Solorzano, A benchmark for comparison of cell tracking algorithms.Bioinformatics 30, 1609–1617 (2014).
14. D. U. Pizzagalli, Y. Farsakoglu, M. Palomino-Segura, E. Palladino, J. Sintes, F. Marangoni,T. R. Mempel, W. H. Koh, T. T. Murooka, F. Thelen, J. V. Stein, G. Pozzi, M. Thelen, R. Krause,
9 of 10

SC I ENCE ADVANCES | R E S EARCH ART I C L E
Dow
nloaded from
S. F. Gonzalez, Leukocyte tracking database, a collection of immune cell tracks fromintravital 2-photon microscopy videos. Sci. Data 5, 180129 (2018).
15. J. B. Beltman, A. F. M. Marée, R. J. de Boer, Analysing immune cell migration.Nat. Rev. Immunol. 9, 789–798 (2009).
16. A. E. Carpenter, L. Kamentsky, K. W. Eliceiri, A call for bioimaging software usability.Nat. Methods 9, 666–670 (2012).
17. C. Sommer, C. Straehle, U. Köthe, F. A. Hamprecht, in 2011 IEEE International Symposiumon Biomedical Imaging: From Nano to Macro (IEEE, 2011), pp. 230–233.
18. I. Arganda-Carreras, V. Kaynig, C. Rueden, K. W. Eliceiri, J. Schindelin, A. Cardona,H. S. Seung, Trainable Weka segmentation: A machine learning tool for microscopy pixelclassification. Bioinformatics 33, 2424–2426 (2017).
19. R. Mehmood, S. El-Ashram, R. Bie, H. Dawood, A. Kos, Clustering by fast search andmerge of local density peaks for gene expression microarray data. Sci. Rep. 7,45602 (2017).
20. A. L. Goldberger, L. A. N. Amaral, L. Glass, J. M. Hausdorff, P. C. Ivanov, R. G. Mark,J. E. Mietus, G. B. Moody, C.-K. Peng, H. E. Stanley, PhysioBank, PhysioToolkit, andPhysioNet: Components of a new research resource for complex physiologic signals.Circulation 101, e215–e220 (2000).
21. J. B. Tenenbaum, V. de Silva, J. C. Langford, A global geometric framework for nonlineardimensionality reduction. Science 290, 2319–2323 (2000).
22. M. Du, S. Ding, X. Xu, Y. Xue, Density peaks clustering using geodesic distances. Int. J.Mach. Learn. Cybernet. 9, 1335–1349 (2018).
23. C. C. Aggarwal, A. Hinneburg, D. A. Keim, in International Conference on Database Theory(Springer, 2001), pp. 420–434.
24. S. Monti, P. Tamayo, J. Mesirov, T. Golub, Consensus clustering: A resampling-basedmethod for class discovery and visualization of gene expression microarray data.Mach. Learn. 52, 91–118 (2003).
25. G. Re Calegari, G. Nasi, I. Celino, Human computation vs. machine learning: Anexperimental comparison for image classification. J. Hum. Comput. 5, 13–30 (2018).
Pizzagalli et al., Sci. Adv. 2019;5 : eaax3770 30 October 2019
26. F. Iglesias, T. Zseby, D. Ferreira, A. Zimek, MDCGen: Multidimensional dataset generatorfor clustering, in Journal of Classification (Springer, 2019).
Acknowledgments:We are thankful to D. Eynard, M. Thelen, B. Thelen, I. Arini, L. Karagyaur,A. Pulfer, G. Pozzi, F. Maffessanti, G. Rovi, P. Zulian, Y. Farsakoglu, and N. Chatziandreoufor technical discussion and support; R. D'Antuono and D. Morone for microscopyassistance; and T. Virgilio and M. Palomino-Segura for having generated microscopy data.Funding: This project was supported financially by the Swiss National Science Foundation(SNF) with the SystemsX.ch iPhD grant 2013/124 to D.U.P., by the SNF with the grantAmbizione 148183 and 176124 to S.F.G., by the Marie Curie Reintegration Grant 612742 toS.F.G., and by the Center for Computational Medicine in Cardiology (CCMC) at ICS. Authorcontributions: D.U.P. conceptualized and implemented the algorithm and wrote themanuscript. S.F.G. supervised the biological aspects of the project, provided microscopydata, acquired funding, and wrote the manuscript. R.K. supervised the computationalaspects of the project, acquired funding, and wrote the manuscript. Competinginterests: The authors declare that they have no competing interests. Data and materialsavailability: All data needed to evaluate the conclusions in the paper are present inthe paper and/or the Supplementary Materials. Additional data related to this paper maybe requested from the authors. This work has been tested on the publicly availabledatasets included in ClustEval (2). Datasets used in Figs. 1, 5, and 6 are provided in datafile S1. MATLAB code is provided in data file S2.
Submitted 18 March 2019Accepted 14 September 2019Published 30 October 201910.1126/sciadv.aax3770
Citation: D. U. Pizzagalli, S. F. Gonzalez, R. Krause, A trainable clustering algorithm based onshortest paths from density peaks. Sci. Adv. 5, eaax3770 (2019).
http
10 of 10
on April 9, 2020
://advances.sciencemag.org/

A trainable clustering algorithm based on shortest paths from density peaksDiego Ulisse Pizzagalli, Santiago Fernandez Gonzalez and Rolf Krause
DOI: 10.1126/sciadv.aax3770 (10), eaax3770.5Sci Adv
ARTICLE TOOLS http://advances.sciencemag.org/content/5/10/eaax3770
MATERIALSSUPPLEMENTARY http://advances.sciencemag.org/content/suppl/2019/10/25/5.10.eaax3770.DC1
REFERENCES
http://advances.sciencemag.org/content/5/10/eaax3770#BIBLThis article cites 20 articles, 5 of which you can access for free
PERMISSIONS http://www.sciencemag.org/help/reprints-and-permissions
Terms of ServiceUse of this article is subject to the
is a registered trademark of AAAS.Science AdvancesYork Avenue NW, Washington, DC 20005. The title (ISSN 2375-2548) is published by the American Association for the Advancement of Science, 1200 NewScience Advances
BY).Science. No claim to original U.S. Government Works. Distributed under a Creative Commons Attribution License 4.0 (CC Copyright © 2019 The Authors, some rights reserved; exclusive licensee American Association for the Advancement of
on April 9, 2020
http://advances.sciencemag.org/
Dow
nloaded from
Related Documents