Copyright © 2014 Pearson Education, Inc. All rights reserved Chapter 8 Hypothesis Testing for Population Proportions

Welcome message from author
This document is posted to help you gain knowledge. Please leave a comment to let me know what you think about it! Share it to your friends and learn new things together.
Transcript
Copyright © 2014 Pearson Education, Inc. All rights reserved
Chapter 8
Hypothesis Testing
for Population
Proportions
8 - 2 Copyright © 2014 Pearson Education, Inc. All rights reserved
Learning Objectives
Know how to test hypotheses concerning a population proportion and hypotheses concerning the comparison of two population proportions.
Understand the meaning of p-value and how it is used.
Understand the meaning of significance level and how it is used.
Know the conditions required for calculating a p-value and significance level.
Copyright © 2014 Pearson Education, Inc. All rights reserved
8.1
The Main Ingredients of Hypothesis Testing

8 - 4 Copyright © 2014 Pearson Education, Inc. All rights reserved
Hypothesis Testing
How do you determine if someone is cheating when they toss a coin?
If the toss is fair P(Heads) = p = 0.5
Otherwise P(Heads) = p ≠ 0.5
If only 15 Heads come up out of 40 tosses, is the person cheating?
8 - 5 Copyright © 2014 Pearson Education, Inc. All rights reserved
Null and Alternative Hypotheses
H0: p = 0.5 “H naught” or “the Null Hypothesis” The status quo, no cheating, no surprises, no change, no
effect
Ha: p ≠ 0.5 “The Alternative Hypothesis” This is what we hope or guess is true.
Note that p is the population proportion. Hypothesis testing is always for the population parameter, never the statistic.

8 - 6 Copyright © 2014 Pearson Education, Inc. All rights reserved
Choosing the Null and Alternative Hypothesis
First come up with an idea or hypothesis. The dealer is palming aces. Babies are born less often on Tuesdays.
Write down the null hypothesis. H0: p = 1/4
H0: p = 1/7
Write down the alternative hypothesis. Ha: p > 1/4
Ha: p < 1/7

8 - 7 Copyright © 2014 Pearson Education, Inc. All rights reserved
Level of Significance
The Level of Significance, , is the probability of rejecting H0 when H0 is true. Concluding that the coin tossing is not fair when
it is fair. Saying that the defendant is guilty but he did not
commit the crime. Concluding that the person has psychic abilities
when she was just guessing.

8 - 8 Copyright © 2014 Pearson Education, Inc. All rights reserved
Typical Levels of Significance
Since the level of significance is the probability of making an error, it should be small. = 0.05 or 5% is the most typical. = 0.01 or 1% is used when making this error
has very bad repercussions. = 0.10 or 10% is used when an error is less an
issue than making no conclusion when Ha is true.

8 - 9 Copyright © 2014 Pearson Education, Inc. All rights reserved
The Test Statistic
In conducting a hypothesis test one takes a sample and finds .
The Central Limit Theorem for proportions:
The Test Statistic is the z-score:
p̂
0 00
(1 ),
p pN p
n
0
0 0
ˆ
(1 )
p pObserved Nullz
SE p p
n
8 - 10 Copyright © 2014 Pearson Education, Inc. All rights reserved
The Meaning of the Test Statistic
The test statistic tells us how unlikely that sample proportion could have happened by random chance had the null hypothesis been true.
If the null hypothesis is true, then the test statistic should be close to 0. Therefore, the farther the test statistic is from 0, the more the null hypothesis is discredited.

8 - 11 Copyright © 2014 Pearson Education, Inc. All rights reserved
The p-Value
The p-value is a probability. Assuming the null hypothesis is true, the p-value is the probability that if the experiment were repeated, you would get a test statistic as extreme as or more extreme than the one you actually got. A small p-value suggests that a surprising outcome has occurred and discredits the null hypothesis.
8 - 12 Copyright © 2014 Pearson Education, Inc. All rights reserved
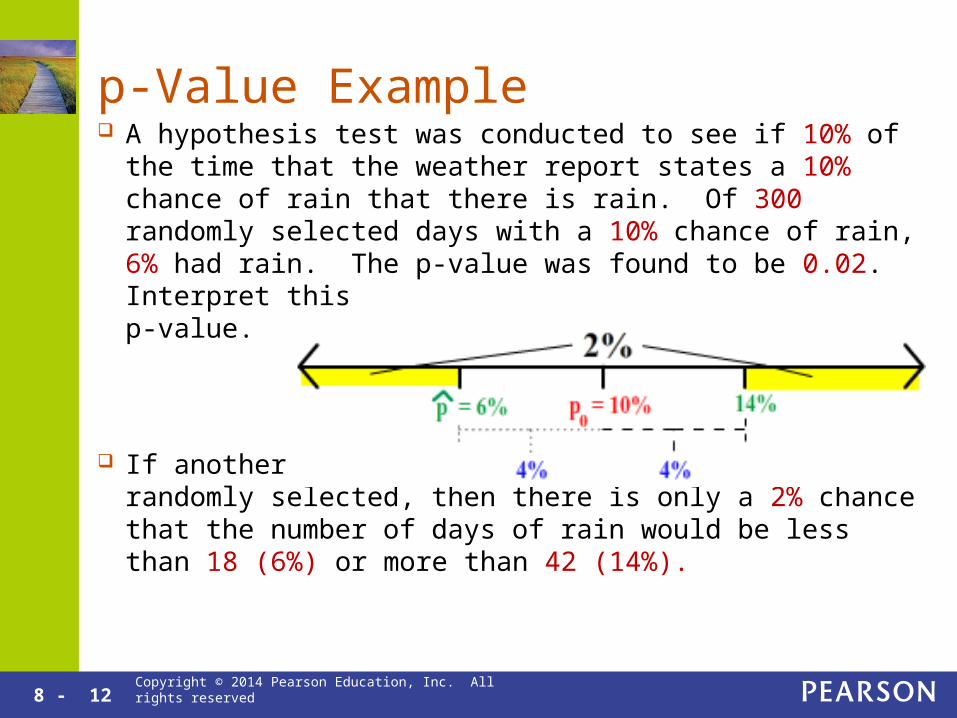
p-Value Example A hypothesis test was conducted to see if 10% of the time that
the weather report states a 10% chance of rain that there is rain. Of 300 randomly selected days with a 10% chance of rain, 6% had rain. The p-value was found to be 0.02. Interpret this p-value.
If another 300 days with 10% chance of rain were randomly selected, then there is only a 2% chance that the number of days of rain would be less than 18 (6%) or more than 42 (14%).
8 - 13 Copyright © 2014 Pearson Education, Inc. All rights reserved
Hypothesis Testing Summary
1. Hypothesize Come up with an idea or hypothesis. Write down H0 and Ha.
2. Prepare Choose the level of significance . Select the test statistic Check Sampling Distributions’ Conditions

8 - 14 Copyright © 2014 Pearson Education, Inc. All rights reserved
Hypothesis Testing Summary (Continued)
3. Compute to Compare Compute the test statistic. Compute the p-Value.
4. Interpret If p-Value < , reject H0.
If p-Value > , fail to reject H0. State the conclusion in the context of the study.

Copyright © 2014 Pearson Education, Inc. All rights reserved
8.2
Characterizing p-values
8 - 16 Copyright © 2014 Pearson Education, Inc. All rights reserved
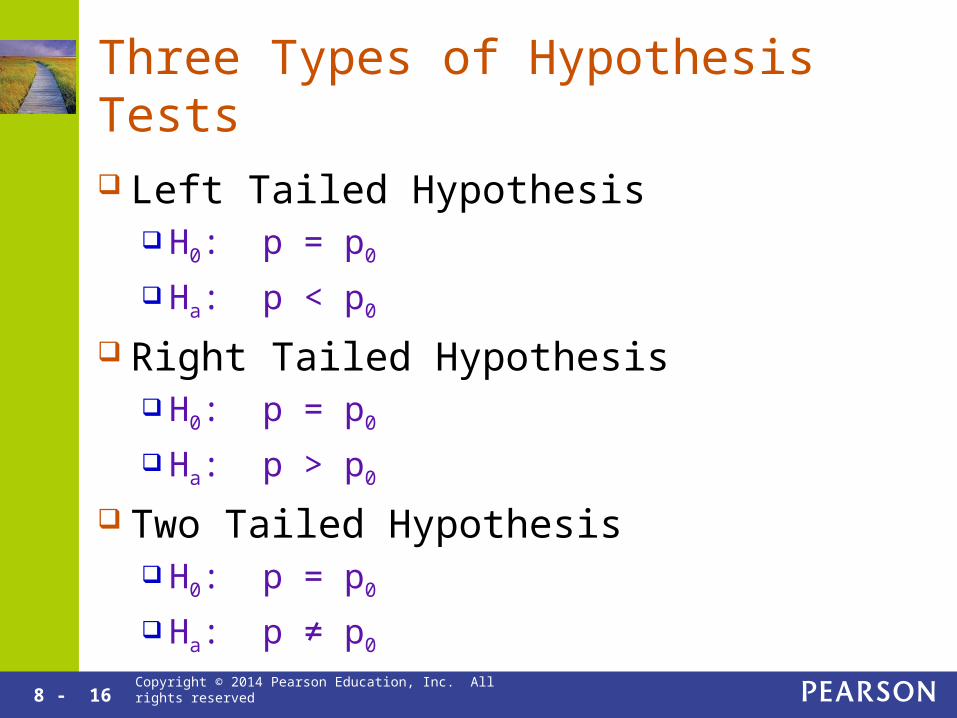
Three Types of Hypothesis Tests
Left Tailed Hypothesis H0: p = p0
Ha: p < p0
Right Tailed Hypothesis H0: p = p0
Ha: p > p0
Two Tailed Hypothesis H0: p = p0
Ha: p ≠ p0

8 - 17 Copyright © 2014 Pearson Education, Inc. All rights reserved
Left Tailed Hypothesis
H0: p = p0
Ha: p < p0
The p-value represents the probability that if p = p0 and another random sample is taken with the same sample size then the new sample proportion will be less than observed sample proportion.

8 - 18 Copyright © 2014 Pearson Education, Inc. All rights reserved
Right Tailed Hypothesis
H0: p = p0
Ha: p > p0
The p-value represents the probability that if p = p0 and another random sample is taken with the same sample size then the new sample proportion will be greater than observed sample proportion.

8 - 19 Copyright © 2014 Pearson Education, Inc. All rights reserved
Two Tailed Hypothesis
H0: p = p0
Ha: p ≠ p0
The p-value represents the probability that if p = p0 and another random sample is taken with the same sample size then the new sample proportion will be farther from p0 than observed sample proportion.

8 - 20 Copyright © 2014 Pearson Education, Inc. All rights reserved
p-Value Example
45% of Americans have type “O” blood. A study was done to see if the percent differs for college students. 47% of the 1000 randomly selected students had type O blood. The p-Value was 0.2.
Two tailed test: “differs” If 45% of college students do have type “O” blood
and if another 1000 randomly selected students are tested, then there is a 20% chance that either fewer than 43% or greater than 47% of this new group of students will have type “O” blood.
8 - 21 Copyright © 2014 Pearson Education, Inc. All rights reserved
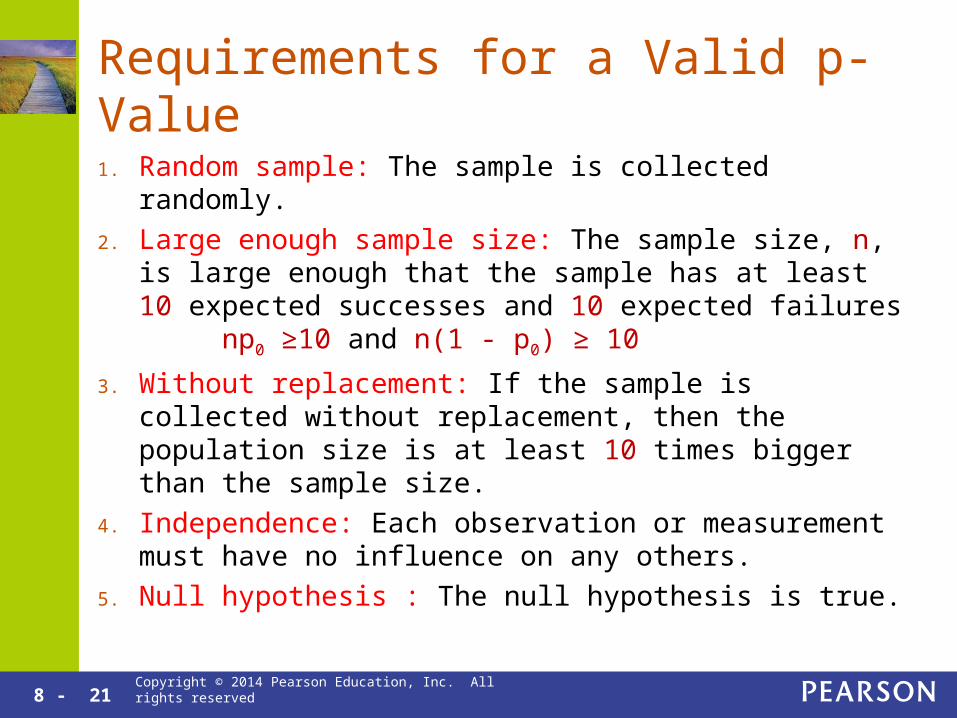
Requirements for a Valid p-Value
1. Random sample: The sample is collected randomly.
2. Large enough sample size: The sample size, n, is large enough that the sample has at least 10 expected successes and 10 expected failures np0 ≥10 and n(1 - p0) ≥ 10
3. Without replacement: If the sample is collected without replacement, then the population size is at least 10 times bigger than the sample size.
4. Independence: Each observation or measurement must have no influence on any others.
5. Null hypothesis : The null hypothesis is true.

8 - 22 Copyright © 2014 Pearson Education, Inc. All rights reserved
StatCrunch and the p-Value
Have more than 70% of all dogs had their rabies shots? 592 of the 800 dogs examined had their rabies shots.
H0: p = 0.7 Ha: p > 0.7 Stat→Proportions→One sample→with summary

8 - 23 Copyright © 2014 Pearson Education, Inc. All rights reserved
StatCrunch and the p-Value
Have more than 70% of all dogs had their rabies shots? 592 of the 800 dogs examined had their rabies shots.
H0: p = 0.7 Ha: p > 0.7
If 70% of all dogs have had their rabies shots and if another 800 randomly selected dogs are examined, then there is a 0.68% chance that more than 592 of them will have had their rabies shots.
8 - 24 Copyright © 2014 Pearson Education, Inc. All rights reserved
Summary of the p-Value
Tells us how surprising the sample data is if the null hypothesis is true.
A very small p-Value, less than 0.05 for example, indicates that the results that were obtained would be very surprising.
A larger p-Value, greater than 0.05 for example, indicates that the results that were obtained would not be very surprising.
Copyright © 2014 Pearson Education, Inc. All rights reserved
8.3
Hypothesis Testing in Four Steps
8 - 26 Copyright © 2014 Pearson Education, Inc. All rights reserved
Four Steps to Hypothesis Testing
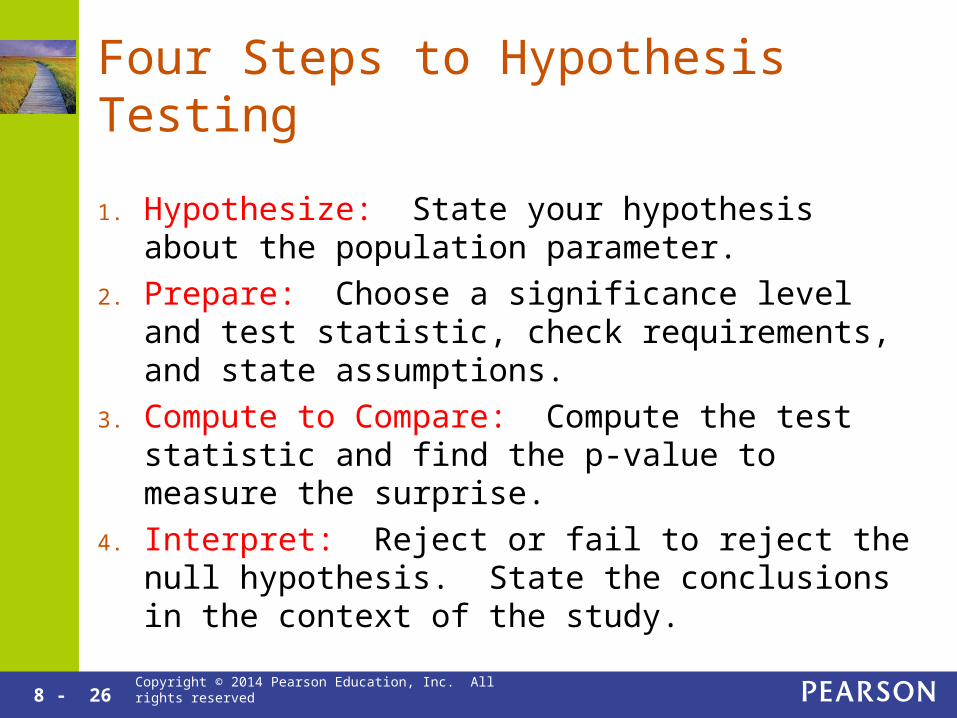
1. Hypothesize: State your hypothesis about the population parameter.
2. Prepare: Choose a significance level and test statistic, check requirements, and state assumptions.
3. Compute to Compare: Compute the test statistic and find the p-value to measure the surprise.
4. Interpret: Reject or fail to reject the null hypothesis. State the conclusions in the context of the study.
8 - 27 Copyright © 2014 Pearson Education, Inc. All rights reserved
Hypothesize
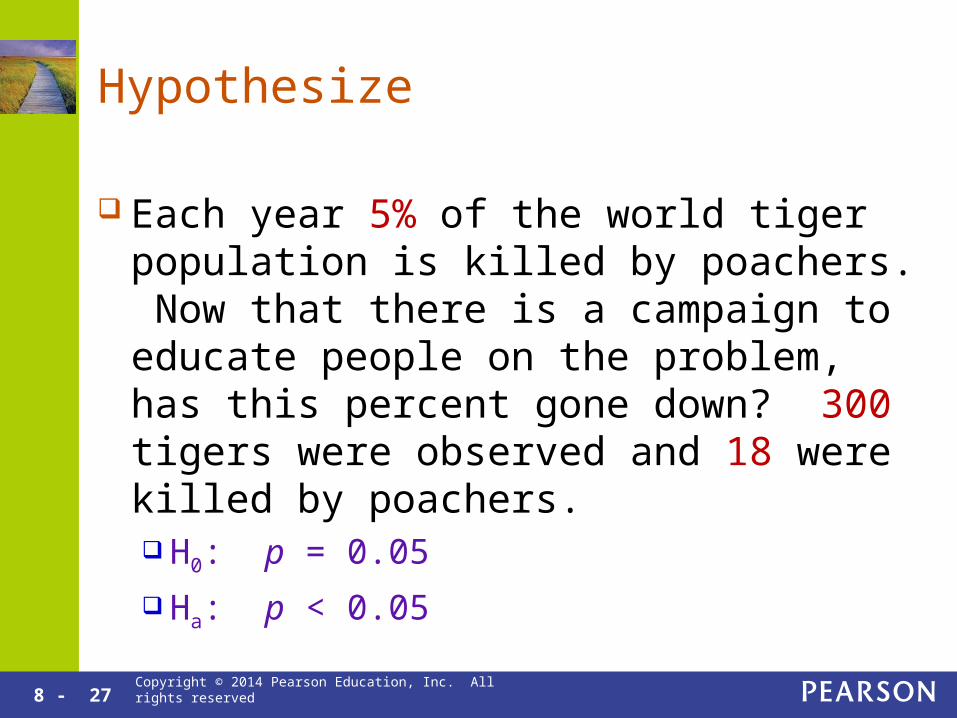
Each year 5% of the world tiger population is killed by poachers. Now that there is a campaign to educate people on the problem, has this percent gone down? 300 tigers were observed and 18 were killed by poachers. H0: p = 0.05
Ha: p < 0.05
8 - 28 Copyright © 2014 Pearson Education, Inc. All rights reserved
Hypothesize
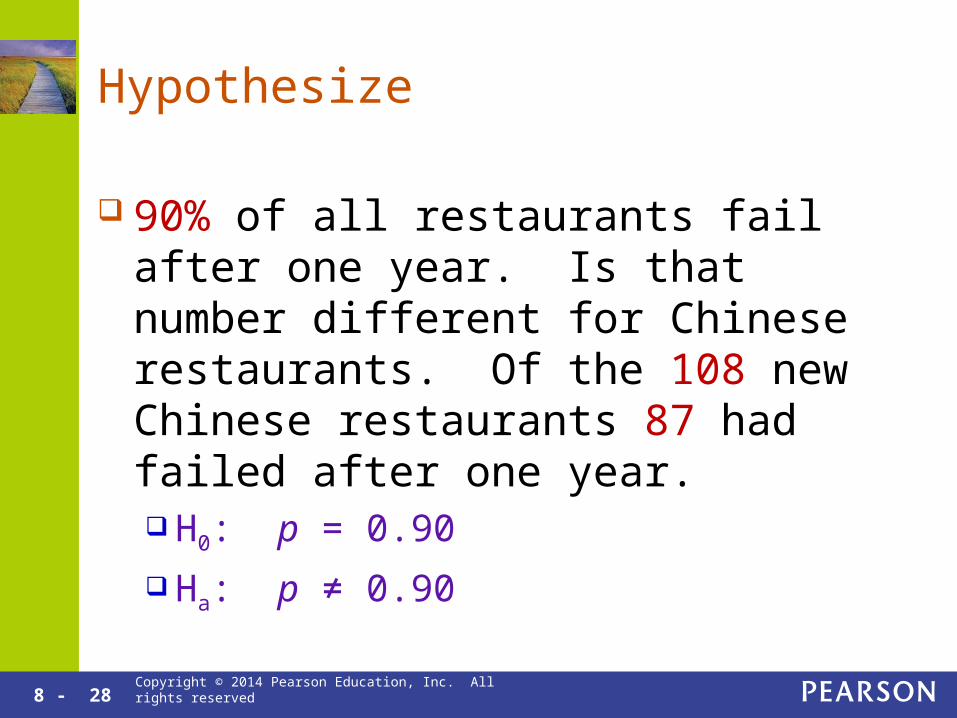
90% of all restaurants fail after one year. Is that number different for Chinese restaurants. Of the 108 new Chinese restaurants 87 had failed after one year. H0: p = 0.90
Ha: p ≠ 0.90
8 - 29 Copyright © 2014 Pearson Education, Inc. All rights reserved
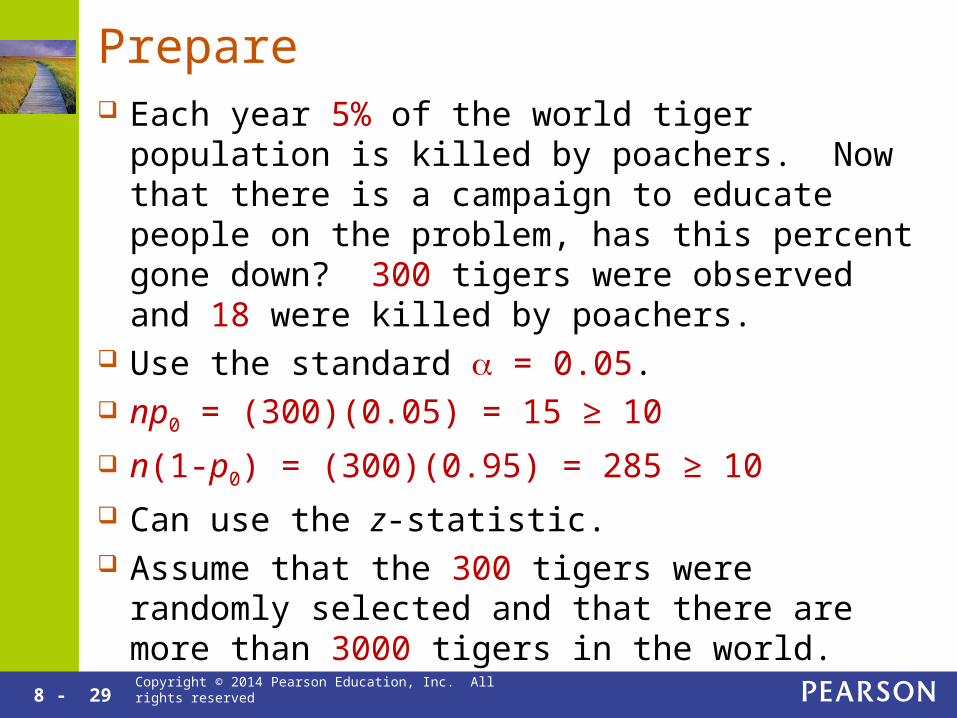
Prepare Each year 5% of the world tiger population is killed
by poachers. Now that there is a campaign to educate people on the problem, has this percent gone down? 300 tigers were observed and 18 were killed by poachers.
Use the standard = 0.05. np0 = (300)(0.05) = 15 ≥ 10
n(1-p0) = (300)(0.95) = 285 ≥ 10 Can use the z-statistic. Assume that the 300 tigers were randomly selected
and that there are more than 3000 tigers in the world.

8 - 30 Copyright © 2014 Pearson Education, Inc. All rights reserved
Prepare 90% of all restaurants fail after one year. Is that
number different for Chinese restaurants. Of the 108 new Chinese restaurants 87 had failed after one year.
Use the standard = 0.05. np0 = (108)(0.9) = 97.2 ≥ 10
n(1-p0) = (108)(0.1) = 10.8 ≥ 10 Can use the z-statistic. Assume that the 108 Chinese restaurants were
randomly selected and that there are more than 1080 Chinese restaurants in existence.
8 - 31 Copyright © 2014 Pearson Education, Inc. All rights reserved
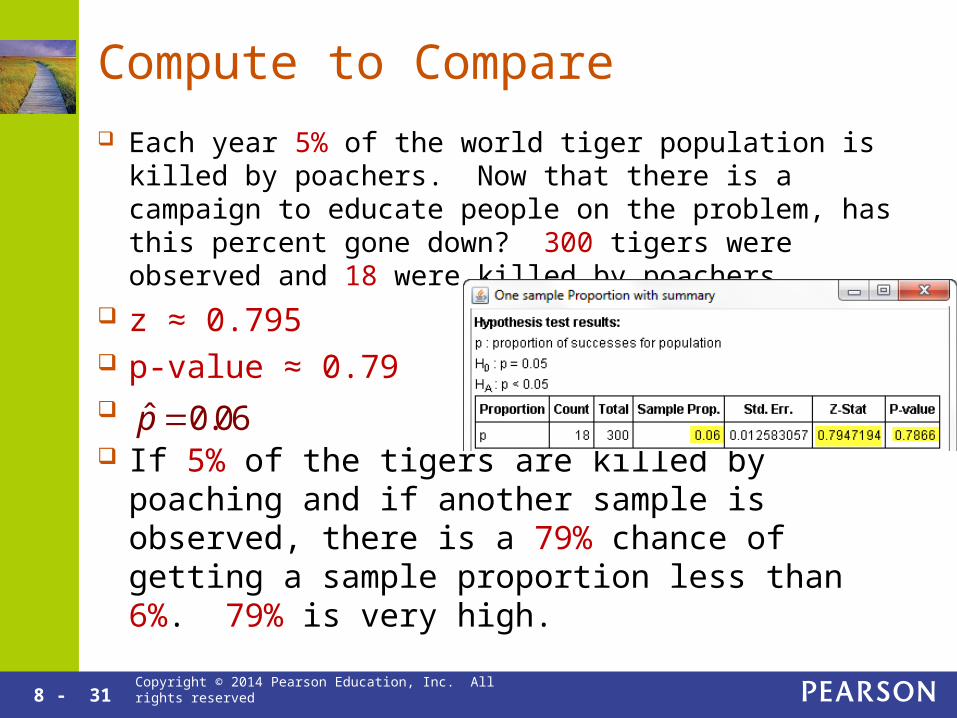
Compute to Compare
Each year 5% of the world tiger population is killed by poachers. Now that there is a campaign to educate people on the problem, has this percent gone down? 300 tigers were observed and 18 were killed by poachers.
z ≈ 0.795 p-value ≈ 0.79 If 5% of the tigers are killed by poaching and if
another sample is observed, there is a 79% chance of getting a sample proportion less than 6%. 79% is very high.
ˆ 0.06p

8 - 32 Copyright © 2014 Pearson Education, Inc. All rights reserved
Compute to Compare
90% of all restaurants fail after one year. Is that number different for Chinese restaurants. Of the 108 new Chinese restaurants 87 had failed after one year.
z ≈ -3.27 p-value ≈ 0.001 If 90% of all Chinese restaurants fail after one year
and if another sample is observed, there is a 0.1% chance of getting a sample proportion less than 81%. 0.1% is a very small chance.
ˆ 0.81p
8 - 33 Copyright © 2014 Pearson Education, Inc. All rights reserved
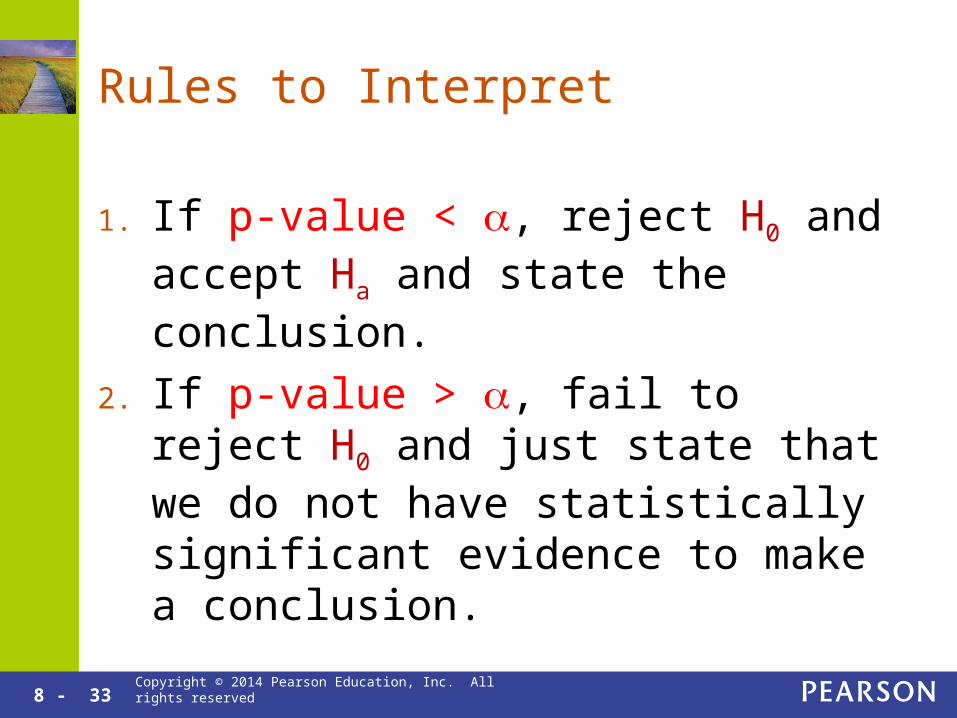
Rules to Interpret
1. If p-value < , reject H0 and accept Ha and state the conclusion.
2. If p-value > , fail to reject H0 and just state that we do not have statistically significant evidence to make a conclusion.

8 - 34 Copyright © 2014 Pearson Education, Inc. All rights reserved
Interpret Each year 5% of the world tiger population is killed
by poachers. Now that there is a campaign to educate people on the problem, has this percent gone down? 300 tigers were observed and 18 were killed by poachers.
z ≈ 0.795, p-value ≈ 0.79, Since p-value ≈ 0.79 > 0.05 = , fail to reject H0.
There is statistically insignificant evidence to support the claim that since the campaign began, less than 5% of the world tiger population is killed by poachers.
ˆ 0.06p

8 - 35 Copyright © 2014 Pearson Education, Inc. All rights reserved
Interpret 90% of all restaurants fail after one year. Is that
number different for Chinese restaurants. Of the 108 new Chinese restaurants 87 had failed after one year.
z ≈ -3.27, p-value ≈ 0.001, Since p-value ≈ 0.001 < 0.05 = , reject H0 and
accept Ha. There is statistically significant evidence to support the claim that the percent of Chinese restaurants that fail after one year is different from 90%.
ˆ 0.81p

Copyright © 2014 Pearson Education, Inc. All rights reserved
8.4
Comparing Proportions from Two Populations

8 - 37 Copyright © 2014 Pearson Education, Inc. All rights reserved
Comparing Two Populations
Comparing two groups, men vs. women, blacks vs. whites, with treatment vs. without treatment, etc.
Instead of the sample size, n, there will be two sample sizes, n1 and n2.
p1 and p2 instead of a single population proportion, p.
and instead of the sample proportion, 1p̂ 2p̂ p̂

8 - 38 Copyright © 2014 Pearson Education, Inc. All rights reserved
Hypothesis Tests
The Null Hypothesis will be: H0: p1 = p2
Three possibilities for the Alternative Hypothesis: Ha: p1 < p2 (Left Tailed Test)
Ha: p1 > p2 (Right Tailed Test)
Ha: p1 ≠ p2 (Two Tailed Test)

8 - 39 Copyright © 2014 Pearson Education, Inc. All rights reserved
The Test Statistic
The estimator is just the difference between the sample proportions:
The null value is typically 0.
StatCrunch is easier to use than the formula.
estimator null valuez
SE
1 2ˆ ˆp p
1 2
1 1 Total # of Successesˆ ˆ ˆ1 ,
Total # of TrialsSE p p p
n n

8 - 40 Copyright © 2014 Pearson Education, Inc. All rights reserved
Checking Conditions
Large Sample: Note the use of the pooled proportion.
Random Sample or at least close to random. The two samples are independent of each other. Independent Within Samples: The observations
within each sample must be independent of one another.
The Null Hypothesis is true.
1 1 2 2ˆ ˆ ˆ ˆ10, 1 10, 10, 1 10n p n p n p n p

8 - 41 Copyright © 2014 Pearson Education, Inc. All rights reserved
Using StatCrunch Stat→Proportions→Two sample→with summary

8 - 42 Copyright © 2014 Pearson Education, Inc. All rights reserved
Caffeine Therapy For Premature Infants
Apnea of prematurity occurs when premature babies have shallow breathing or stopbreathing for more than 20 seconds.
Treatment group received caffeine therapy while the other group received a placebo.

8 - 43 Copyright © 2014 Pearson Education, Inc. All rights reserved
Does caffeine therapy lower the rate of bad events? Of the 937 infants given the therapy, 377 suffered from death or disability. The placebo group had 932 infants, and of these, 431 suffered from death or disability.
1. Hypothesize H0: p1 = p2, Ha: p1 < p2
2. Prepare Use = 0.05. z-statistic 937 x 0.43, 937 x 0.57, 932 x 0.43, 932 x 0.57
are all greater than or equal to 10. Assume that the infants were randomly and independently selected.

8 - 44 Copyright © 2014 Pearson Education, Inc. All rights reserved
Does caffeine therapy lower the rate of bad events? Of the 937 infants given the therapy, 377 suffered from death or disability. The placebo group had 932 infants, and of these, 431 suffered from death or disability.
3. Compute to Compare
StatCrunch → z = -2.62, p-value = 0.004
4. Interpret p-value = 0.004 < 0.05 = Reject H0, Accept Ha. There is statistically significant
evidence to conclude that a lower proportions of babies will die or suffer with this therapy than without this therapy.
377 431ˆ 0.43
937 932p
8 - 45 Copyright © 2014 Pearson Education, Inc. All rights reserved
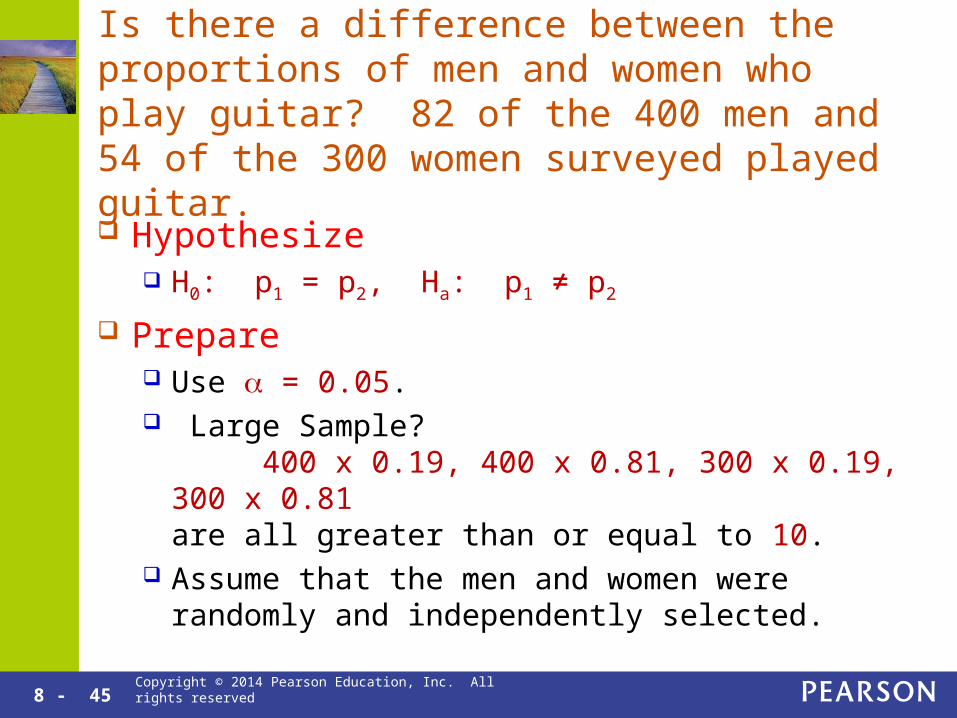
Is there a difference between the proportions of men and women who play guitar? 82 of the 400 men and 54 of the 300 women surveyed played guitar.
Hypothesize H0: p1 = p2, Ha: p1 ≠ p2
Prepare Use = 0.05. Large Sample?
400 x 0.19, 400 x 0.81, 300 x 0.19, 300 x 0.81are all greater than or equal to 10.
Assume that the men and women were randomly and independently selected.

8 - 46 Copyright © 2014 Pearson Education, Inc. All rights reserved
Is there a difference between the proportions of men and women who play guitar? 82 of the 400 men and 54 of the 300 women surveyed played guitar.
Compute to Compare StatCrunch → z = 0.83, p-value = 0.41
Interpret p-value = 0.41 > 0.05 = Fail to Reject H0. There is statistically insufficient
evidence to make a conclusion about there being a difference between the proportions of men and women who own a guitar.
82 54ˆ 0.19
400 300p
Copyright © 2014 Pearson Education, Inc. All rights reserved
8.5
Understanding Hypothesis Testing
8 - 48 Copyright © 2014 Pearson Education, Inc. All rights reserved
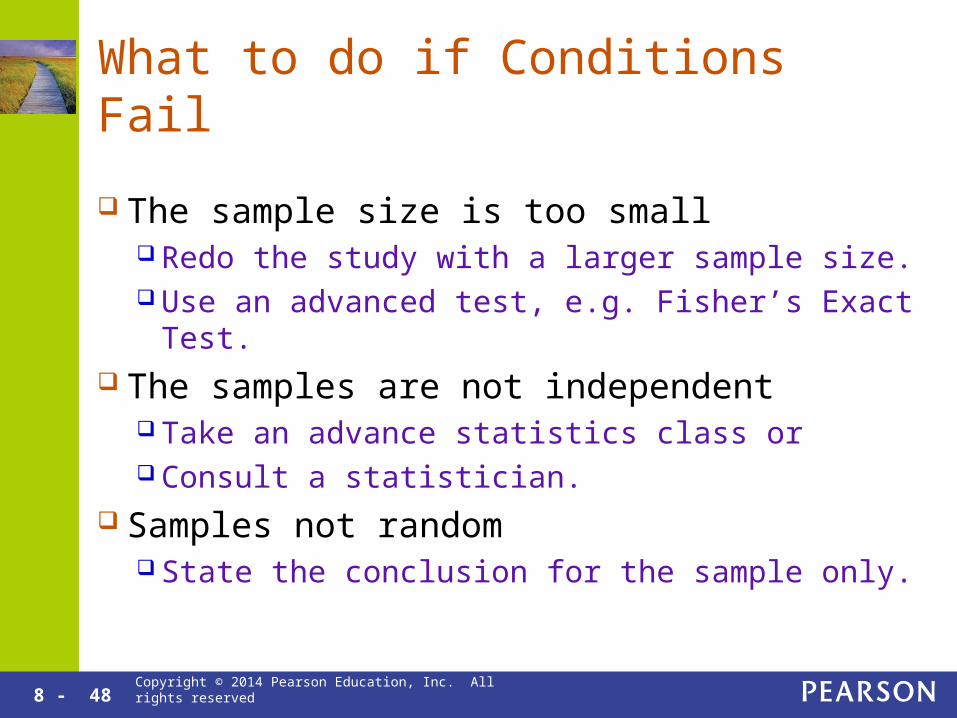
What to do if Conditions Fail
The sample size is too small Redo the study with a larger sample size. Use an advanced test, e.g. Fisher’s Exact Test.
The samples are not independent Take an advance statistics class or Consult a statistician.
Samples not random State the conclusion for the sample only.

8 - 49 Copyright © 2014 Pearson Education, Inc. All rights reserved
Power
The Power of a hypothesis test is the probability of rejecting the null hypothesis when the null hypothesis is false.
Example: If the alternative hypothesis is that the person cheated, then the power is the probability that if the person is cheating then we will conclude correctly that cheating occurred.
Always strive for a large power.

8 - 50 Copyright © 2014 Pearson Education, Inc. All rights reserved
Hypotheses, Power, and Level of Significance
Before the data is collected you can choose to make it more likely to reject H0 or more likely to fail to reject H0, but not both.
Both choices lead to an increased chance of one of the “Bad” outcomes.
Only increasing the sample size decreases the chance of both “Bad” outcomes.

8 - 51 Copyright © 2014 Pearson Education, Inc. All rights reserved
Power vs. Level of Significance
Increasing the level of significance decreases the power.
If you want a better chance of rejecting H0 when H0 is false, you can decrease the level of significance.
The only way to have a large power and a large level of significance is to have a large sample size.
8 - 52 Copyright © 2014 Pearson Education, Inc. All rights reserved
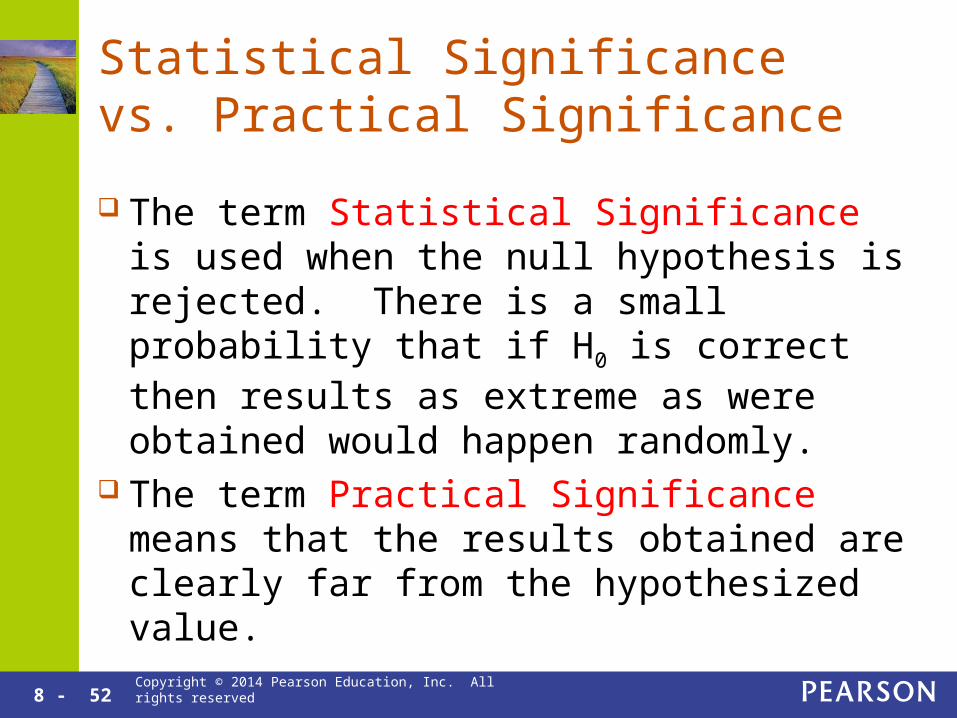
Statistical Significance vs. Practical Significance
The term Statistical Significance is used when the null hypothesis is rejected. There is a small probability that if H0 is correct then results as extreme as were obtained would happen randomly.
The term Practical Significance means that the results obtained are clearly far from the hypothesized value.

8 - 53 Copyright © 2014 Pearson Education, Inc. All rights reserved
Statistical Significance and Practical Significance
A poll to see if the incumbent will get more than 50% of the votes results resulted in a sample proportion 58%. = 0.05 and the p-value = 0.06. This is practically significant but statistically
insignificant. A study to see if there is a difference in pass rates
for male vs. female statistics students resulted in a sample proportion of men: 72.1% and women: 72.3%. = 0.05 and the p-value = 0.04. This is practically insignificant but statistically
significant.

8 - 54 Copyright © 2014 Pearson Education, Inc. All rights reserved
Hypotheses Should Never Be Changed After the Data is Analyzed
The null and alternative hypotheses must be written down before the data is analyzed.
Never adjust H0 and Ha to fit your results. If you change your mind based on the data,
you must collect a new data set in order to support the adjusted hypotheses.

8 - 55 Copyright © 2014 Pearson Education, Inc. All rights reserved
Using Proper Language
If the p-value is less than the level of significance, , then state that we “reject H0” and “accept Ha”. Do not state that the alternative hypothesis is proven or true.
If the p-value is greater than then state that we “fail to reject H0” and that no conclusion can be made. Do not state that H0 is accepted or true. It is possible that the power is too small and that H0 is still false.

8 - 56 Copyright © 2014 Pearson Education, Inc. All rights reserved
Conclude Only the Inequality
A two tailed test was used to see whether there is a difference between the proportion of genetically modified seeds that germinate and natural seeds that germinate. The sample proportions were 0.68 and 0.43 and H0 was rejected.
State that there is evidence for a difference in the population proportions. Do not state that for all seeds, the ones that are genetically modified are 25% more likely to germinate.

Copyright © 2014 Pearson Education, Inc. All rights reserved
Chapter 8
Case Study
8 - 58 Copyright © 2014 Pearson Education, Inc. All rights reserved
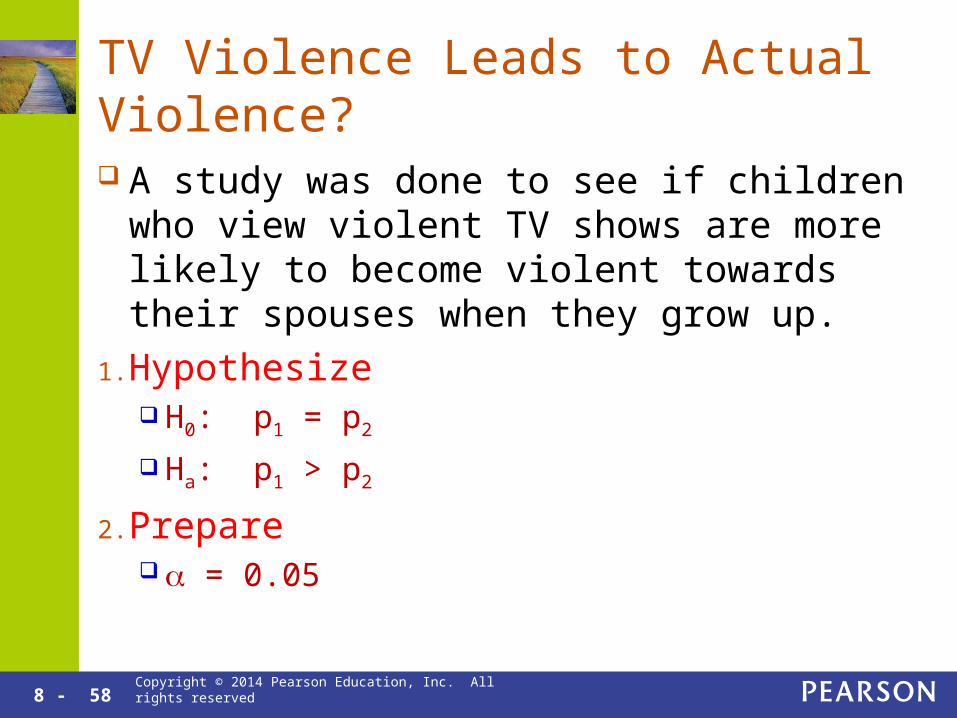
TV Violence Leads to Actual Violence?
A study was done to see if children who view violent TV shows are more likely to become violent towards their spouses when they grow up.
1. Hypothesize H0: p1 = p2
Ha: p1 > p2
2. Prepare = 0.05
8 - 59 Copyright © 2014 Pearson Education, Inc. All rights reserved
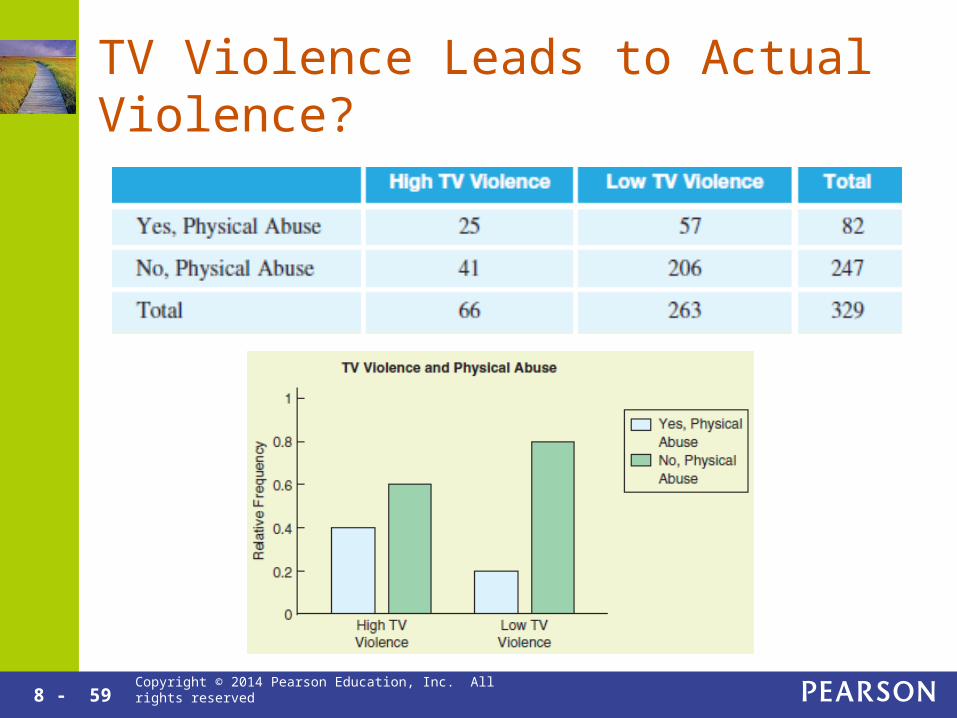
TV Violence Leads to Actual Violence?

8 - 60 Copyright © 2014 Pearson Education, Inc. All rights reserved
Checking Conditions
We will assume that the participants were selected randomly and are independent from each other.
The population sizes are certainly large compared to the sample sizes.
66ˆ 0.25 :
32966 0.25,66 .75,263 0.25,263 .75 10
p

8 - 61 Copyright © 2014 Pearson Education, Inc. All rights reserved
3. Compute to Compare

8 - 62 Copyright © 2014 Pearson Education, Inc. All rights reserved
4. Interpret Since p-value = 0.0033 < 0.05 = , we reject the
null hypothesis and accept the alternative hypotheses.
There is statistically significant evidence to conclude that children who grow up watching violent TV are more likely to become violent towards their spouses when they grow up.
We cannot conclude based solely on the data that watching violent TV as children causes adults to become violent towards their spouses.
Copyright © 2014 Pearson Education, Inc. All rights reserved
Chapter 8
Guided Exercise 1

8 - 64 Copyright © 2014 Pearson Education, Inc. All rights reserved
Gun Control
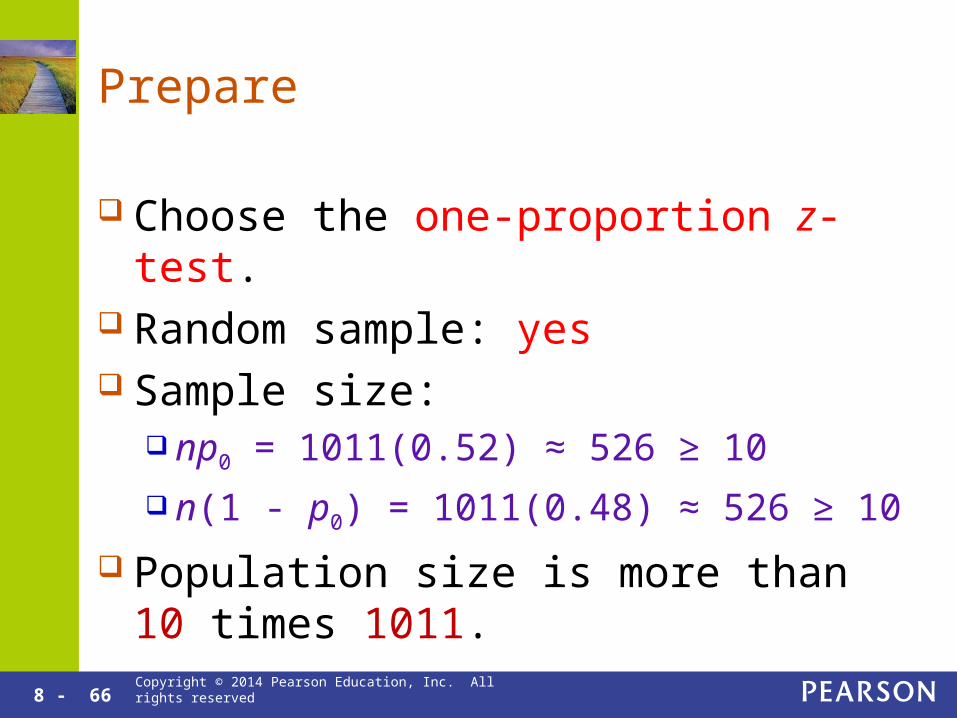
Historically, the percentage of U.S. residents who support stricter gun control laws has been 52%. A recent Gallup Poll of 1011 people showed 495 in favor of stricter gun control laws . Assume the poll was given to a random sample of people.
QUESTION Test the claim that the proportion of those favoring stricter gun control has changed from 0.52. Perform a hypothesis test, using a significance level of 0.05.

8 - 65 Copyright © 2014 Pearson Education, Inc. All rights reserved
Hypothesize
Test the claim that the proportion of those favoring stricter gun control has changed from 0.52. H0: The population proportion that supports gun
control is 0.52, p = 0.52 Ha: p ≠ 0.52
8 - 66 Copyright © 2014 Pearson Education, Inc. All rights reserved
Prepare
Choose the one-proportion z-test. Random sample: yes Sample size:
np0 = 1011(0.52) ≈ 526 ≥ 10
n(1 - p0) = 1011(0.48) ≈ 526 ≥ 10
Population size is more than 10 times 1011.

8 - 67 Copyright © 2014 Pearson Education, Inc. All rights reserved
Compute and Compare
8 - 68 Copyright © 2014 Pearson Education, Inc. All rights reserved
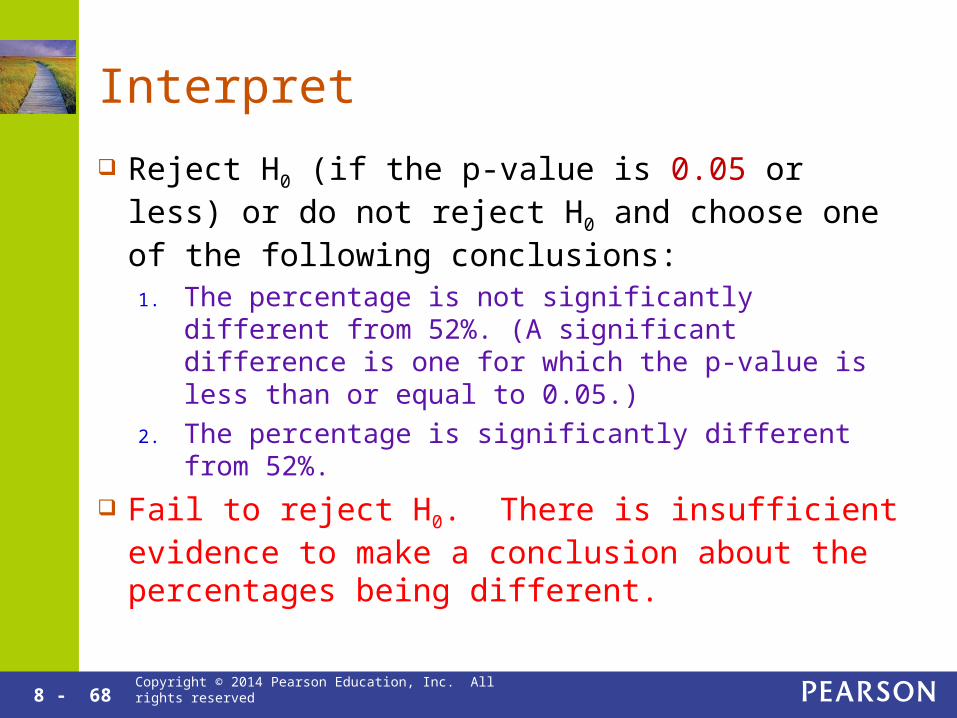
Interpret
Reject H0 (if the p-value is 0.05 or less) or do not reject H0 and choose one of the following conclusions:
1. The percentage is not significantly different from 52%. (A significant difference is one for which the p-value is less than or equal to 0.05.)
2. The percentage is significantly different from 52%.
Fail to reject H0. There is insufficient evidence to make a conclusion about the percentages being different.

Copyright © 2014 Pearson Education, Inc. All rights reserved
Chapter 8
Guided Exercise 2

8 - 70 Copyright © 2014 Pearson Education, Inc. All rights reserved
Perform a hypothesis test to test whether those who take Vioxx have a greater rate of heart attack than those who take a placebo. Use a level of significance of 0.05. Can we conclude that Vioxx causes an increased risk of heart attack?

8 - 71 Copyright © 2014 Pearson Education, Inc. All rights reserved
The Study
In the fall of 2004, drug manufacturer Merck Pharmaceutical withdrew Vioxx, a drug that had been used for arthritis pain, from the market after a study revealed that its use was associated with an increase in the risk of heart attack. The experiment was placebo-controlled, randomized, and double-blind. Out of 1287 people taking Vioxx there were 45 heart attacks, and out of 1299 people taking the placebo there were 25 heart attacks (Source: Los Angeles Times , October 23, 2004).

8 - 72 Copyright © 2014 Pearson Education, Inc. All rights reserved
Sample Proportions
Find the proportion of people in the sample taking Vioxx who had a heart attack and the proportion of people in the sample taking a placebo who had a heart attack. Compare these proportions.
There is a clear practical significance with 3.5% much higher than 1.9%.
1
45ˆ 0.035
1287p 2
25ˆ 0.019
1299p
8 - 73 Copyright © 2014 Pearson Education, Inc. All rights reserved
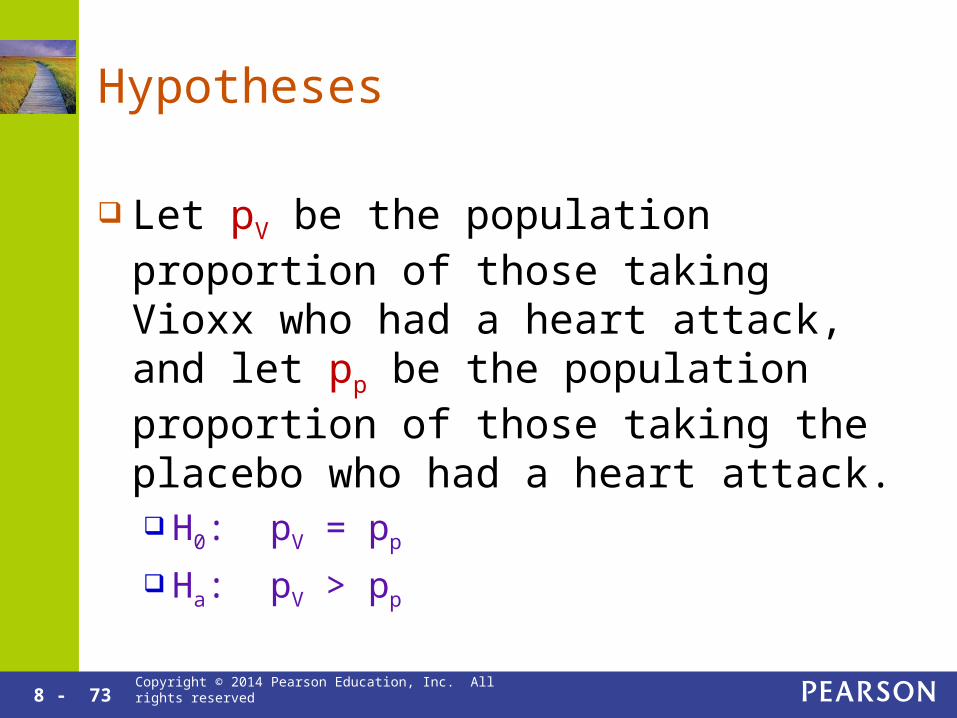
Hypotheses
Let pV be the population proportion of those taking Vioxx who had a heart attack, and let pp be the population proportion of those taking the placebo who had a heart attack. H0: pV = pp
Ha: pV > pp

8 - 74 Copyright © 2014 Pearson Education, Inc. All rights reserved
Prepare
Choose the two-proportion z -test. Although we don’t have a random sample, we have random assignment to groups. The pooled proportion of heart attacks is 45 25 70
ˆ 0.0271287 1299 2586
p
1 ˆ 1287 0.027 34.7 10n p
1 ˆ1 1287 0.973 10n p
2 ˆ 1299 0.027 10n p
2 ˆ1 1299 0.973 10n p

8 - 75 Copyright © 2014 Pearson Education, Inc. All rights reserved
Compute and Compare
z ≈ 2.46 p-value = 0.0069

8 - 76 Copyright © 2014 Pearson Education, Inc. All rights reserved
Interpret
Reject or do not reject H0 and choose i or ii: Those taking Vioxx did not have a significantly different
rate of heart attack than those taking the placebo. Those who took Vioxx had a significantly higher heart
attack rate than those who took the placebo.
Since p-value = 0.0069, we reject H0 and accept Ha. There is statistically significant evidence to support the claim that Vioxx users have a higher heart attack rate compared to non-Vioxx users.
Note that this does not mean that Vioxx causes heart attacks.
Related Documents