Copyright © 2012 Pearson Education, Inc. All rights reserved. Chapter 10 Introductio n to Time Series Modeling and Forecasting

Copyright © 2012 Pearson Education, Inc. All rights reserved. Chapter 10 Introduction to Time Series Modeling and Forecasting.
Dec 29, 2015
Welcome message from author
This document is posted to help you gain knowledge. Please leave a comment to let me know what you think about it! Share it to your friends and learn new things together.
Transcript

Copyright © 2012 Pearson Education, Inc. All rights reserved.
Chapter 10
Introduction to Time Series Modeling and Forecasting

Copyright © 2012 Pearson Education, Inc. All rights reserved.
Section 10.1
What Is a Time Series

Copyright © 2012 Pearson Education, Inc. All rights reserved.
Section 10.2
Time Series Components

Copyright © 2012 Pearson Education, Inc. All rights reserved.10- 4
Figure 10.1 The components of a time series

Copyright © 2012 Pearson Education, Inc. All rights reserved.
Section 10.3
Forecasting Using Smoothing Techniques

Copyright © 2012 Pearson Education, Inc. All rights reserved.10- 6

Copyright © 2012 Pearson Education, Inc. All rights reserved.10- 7
Figure 10.2 MINITAB plot of quarterly power loads

Copyright © 2012 Pearson Education, Inc. All rights reserved.10- 8

Copyright © 2012 Pearson Education, Inc. All rights reserved.10- 9
Figure 10.3 MINITAB plot of quarterly power loads and 4-point moving average

Copyright © 2012 Pearson Education, Inc. All rights reserved.10- 10

Copyright © 2012 Pearson Education, Inc. All rights reserved.10- 11
Figure 10.4 MINITAB printout of exponentially smoothed quarterly power loads

Copyright © 2012 Pearson Education, Inc. All rights reserved.10- 12
Figure 10.5 MINITAB plot of exponentially smoothed quarterly power loads

Copyright © 2012 Pearson Education, Inc. All rights reserved.10- 13

Copyright © 2012 Pearson Education, Inc. All rights reserved.10- 14

Copyright © 2012 Pearson Education, Inc. All rights reserved.10- 15

Copyright © 2012 Pearson Education, Inc. All rights reserved.10- 16

Copyright © 2012 Pearson Education, Inc. All rights reserved.10- 17
Copyright © 2012 Pearson Education, Inc. All rights reserved.
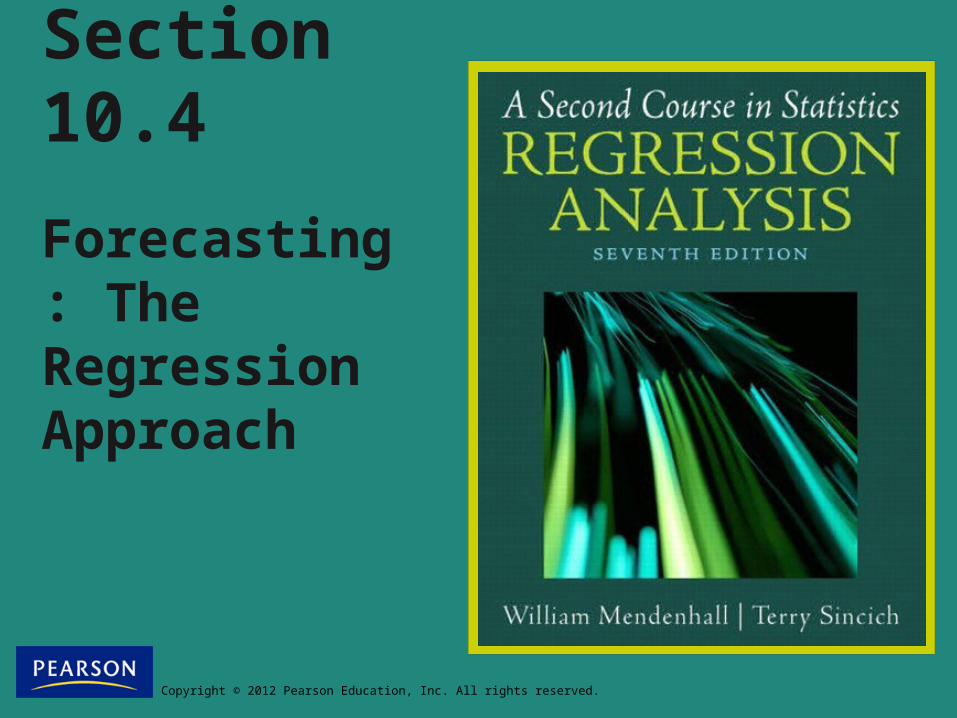
Section 10.4
Forecasting: The Regression Approach

Copyright © 2012 Pearson Education, Inc. All rights reserved.10- 19

Copyright © 2012 Pearson Education, Inc. All rights reserved.10- 20
Figure 10.6 SAS scatterplot of sales data

Copyright © 2012 Pearson Education, Inc. All rights reserved.10- 21
Figure 10.7 SAS printout for straight-line model of yearly sales revenue
continued on next slide

Copyright © 2012 Pearson Education, Inc. All rights reserved.10- 22
Figure 10.7 SAS printout for straight-line model of yearly sales revenue (cont’d)

Copyright © 2012 Pearson Education, Inc. All rights reserved.10- 23
Figure 10.8 SAS printout for quarterly power load model
continued on next slide

Copyright © 2012 Pearson Education, Inc. All rights reserved.10- 24
Figure 10.8 SAS printout for quarterly power load model (cont’d)

Copyright © 2012 Pearson Education, Inc. All rights reserved.
Section 10.5
Autocorrelation and Autoregressive
Error Models

Copyright © 2012 Pearson Education, Inc. All rights reserved.10- 26
Figure 10.9a Autocorrelation functions for several first-order auto regressive error models: Rt = 1Rt-1 + t

Copyright © 2012 Pearson Education, Inc. All rights reserved.10- 27
Figure 10.9b Autocorrelation functions for several first-order auto regressive error models: Rt = 1Rt-1 + t
Copyright © 2012 Pearson Education, Inc. All rights reserved.10- 28
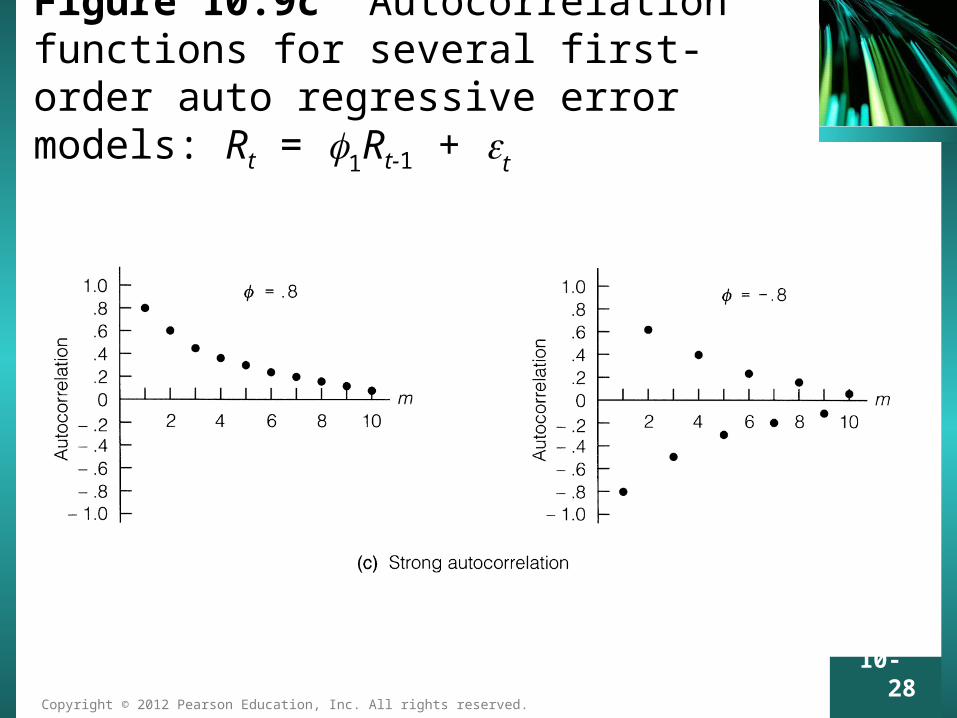
Figure 10.9c Autocorrelation functions for several first-order auto regressive error models: Rt = 1Rt-1 + t

Copyright © 2012 Pearson Education, Inc. All rights reserved.
Section 10.6
Other Models for Autocorrelated Errors
(Optional)

Copyright © 2012 Pearson Education, Inc. All rights reserved.10- 30
Figure 10.10 Autocorrelations for a first-order moving average model: Rt = t + t-1

Copyright © 2012 Pearson Education, Inc. All rights reserved.10- 31
Figure 10.11 Autocorrelations for a fourth-order moving average model

Copyright © 2012 Pearson Education, Inc. All rights reserved.
Section 10.7
Constructing Time Series Models

Copyright © 2012 Pearson Education, Inc. All rights reserved.10- 33
Figure 10.12 A seasonal time series model

Copyright © 2012 Pearson Education, Inc. All rights reserved.10- 34
Figure 10.13 Seasonal model for quarterly data using dummy variables

Copyright © 2012 Pearson Education, Inc. All rights reserved.
Section 10.8
Fitting Time Series Models with Autoregressive Errors

Copyright © 2012 Pearson Education, Inc. All rights reserved.10- 36
Figure 10.14 SAS printout for model of annual sales revenue

Copyright © 2012 Pearson Education, Inc. All rights reserved.10- 37
Figure 10.15 MINITAB residual plot annual sales model
Copyright © 2012 Pearson Education, Inc. All rights reserved.10- 38
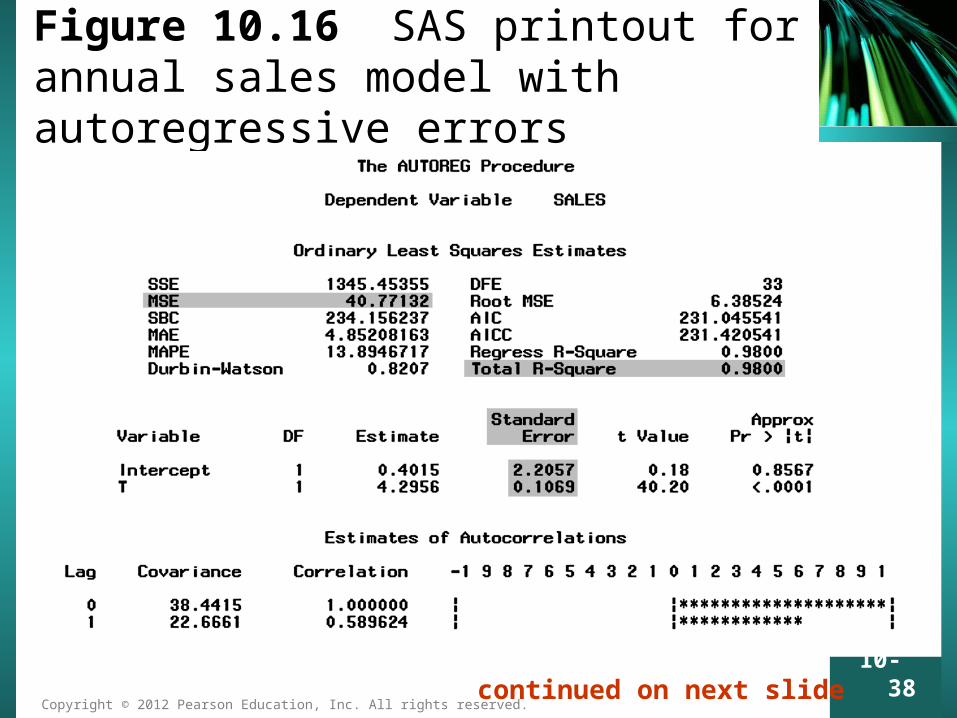
Figure 10.16 SAS printout for annual sales model with autoregressive errors
continued on next slide

Copyright © 2012 Pearson Education, Inc. All rights reserved.10- 39
Figure 10.16 SAS printout for annual sales model with autoregressive errors (cont’d)

Copyright © 2012 Pearson Education, Inc. All rights reserved.10- 40

Copyright © 2012 Pearson Education, Inc. All rights reserved.
Section 10.9
Forecasting with Time Series Autoregressive Models

Copyright © 2012 Pearson Education, Inc. All rights reserved.10- 42

Copyright © 2012 Pearson Education, Inc. All rights reserved.10- 43
Figure 10.17 SAS printout of forecasts of annual sales revenue using straight-line model with autoregressive errors

Copyright © 2012 Pearson Education, Inc. All rights reserved.10- 44

Copyright © 2012 Pearson Education, Inc. All rights reserved.
Section 10.10
Seasonal Time Series Models: An Example

Copyright © 2012 Pearson Education, Inc. All rights reserved.10- 46
Figure 10.18 Water usage time series

Copyright © 2012 Pearson Education, Inc. All rights reserved.10- 47
Figure 10.19 SAS printout for time series model of water usage
Copyright © 2012 Pearson Education, Inc. All rights reserved.10- 48
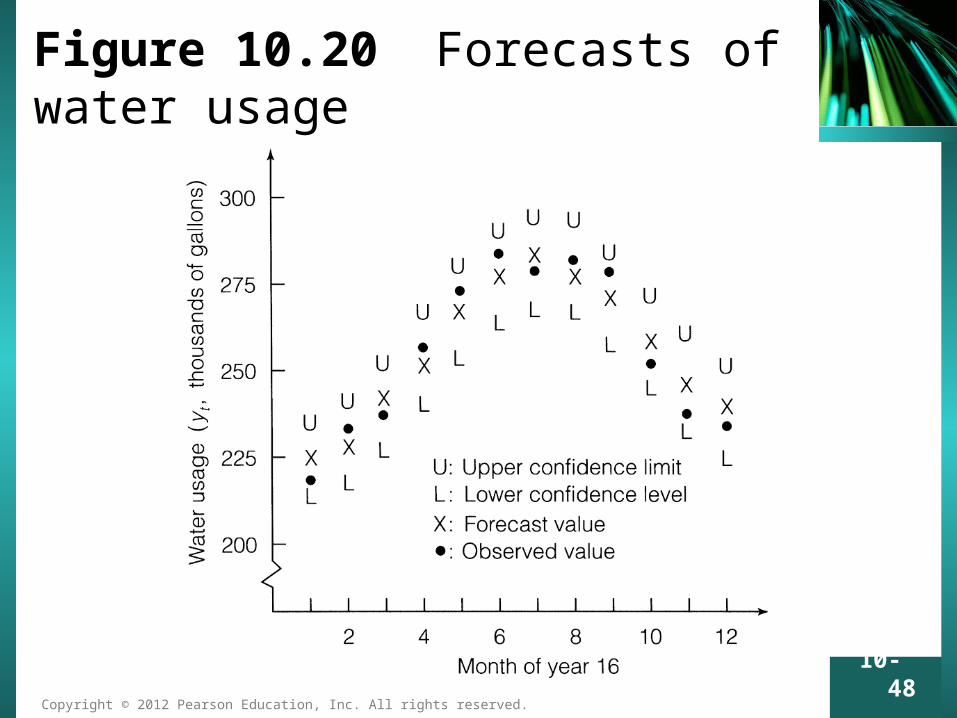
Figure 10.20 Forecasts of water usage

Copyright © 2012 Pearson Education, Inc. All rights reserved.
Section 10.11
Forecasting Using Lagged Values of the Dependent Variable (Optional)
Related Documents