Response to Mandated Change in Schools: Stages of Concern for Teachers in the First and Second Year of CSCOPE Curriculum Implementation by Bynum Blake Hightower, B.S., M.Ed. A Dissertation In Educational Leadership Submitted to the Graduate Faculty of Texas Tech University in Partial Fulfillment of the requirements for the Degree of Doctor of Education Approved Dr. Clint Carpenter Chair of Committee Dr. Fernando Valle Committee Member Dr. Eugene Wang Committee Member Peggy Gordon Miller Dean of the Graduate School August, 2012

Welcome message from author
This document is posted to help you gain knowledge. Please leave a comment to let me know what you think about it! Share it to your friends and learn new things together.
Transcript
Response to Mandated Change in Schools: Stages of Concern for Teachers in the First
and Second Year of CSCOPE Curriculum Implementation
by
Bynum Blake Hightower, B.S., M.Ed.
A Dissertation
In
Educational Leadership
Submitted to the Graduate Faculty
of Texas Tech University in
Partial Fulfillment of
the requirements for
the Degree of
Doctor of Education
Approved
Dr. Clint Carpenter
Chair of Committee
Dr. Fernando Valle
Committee Member
Dr. Eugene Wang
Committee Member
Peggy Gordon Miller
Dean of the Graduate School
August, 2012

Copyright 2012, Bynum Blake Hightower

Texas Tech University, Bynum Blake Hightower, May 2012
ii
Acknowledgements
I would like to acknowledge some very special contributors without whom I
would not have been able to finish this dissertation. My wife, Janie, has been supportive,
understanding, and long-suffering throughout the entire process of researching and
writing. Without her patience and encouragement, attaining this goal would have been
impossible. My love and adoration is expressed in the effort displayed in this
dissertation.
I would like to thank the principals who helped me in collecting surveys and their
faculty members who donated their time to further the scholarly understanding of the
impact curricular innovations have on elementary public school teachers.
I would also like to thank Doctoral Cohort 3. Bruce, Gionet, John, Kathy, and
Tracy you have all been great encouragers and wonderful friends. The arguments we
shared were stimulating, the conversations were rich, and the mutual encouragement
received and given was the perfect elixir for tired eyes on those late nights of reading and
writing. Thank you, my friends; you will forever hold a special place in my heart.
The Educational Leadership faculty at Texas Tech has been nothing short of
inspirational as they masterfully provoked my curiosity through their teaching. My
committee chair, Dr. Clint Carpenter provided encouragement and guidance at vital
stages throughout the writing and researching process. My committee members Dr.
Fernando Valle and Dr. Eugene Wang provided critical feedback in a timely manner,
which enabled me to stay focused on the critical attributes of this research. Additionally,
Dr. Alyx Shultz has provided excellent assistance with editing and formatting this work.
Texas Tech University, Bynum Blake Hightower, May 2012
iii
Table of Contents
Acknowledgements ................................................................................................. ii
Abstract .................................................................................................................. vi
List of Tables ........................................................................................................ vii
Table of Figures ................................................................................................... viii
I. Introduction .........................................................................................................1
Statement of the Problem .....................................................................................9
Significance of the Study ...................................................................................10
Theoretical Framework ......................................................................................11
Purpose of the Study ..........................................................................................12
Research Question .............................................................................................12
Delimitations of the Study .................................................................................13
Limitations of the Study ....................................................................................13
Assumptions .......................................................................................................14
Definition of Terms ...........................................................................................15
Overview of the Study .......................................................................................16
II. Review of Literature.........................................................................................18
Systems Theory ..................................................................................................18
School Reform ...................................................................................................21
CSCOPE Curriculum Development ..................................................................28
The Concerns-Based Adoption Model and Stages of Concern .........................33
Issues Surrounding Implementation Curricular Innovations .............................36
Theoretical Explanation .....................................................................................38
Chapter Summary ..............................................................................................42
III. Methodology ...................................................................................................45
Introduction ........................................................................................................45
Population and Sample ......................................................................................46
Instrumentation ..................................................................................................48
Research Design ................................................................................................50
Objectives. .........................................................................................................52
Texas Tech University, Bynum Blake Hightower, May 2012
iv
Research Question .............................................................................................53
Hypotheses .........................................................................................................53
Data Collection ..................................................................................................55
Data Analysis .....................................................................................................55
IV. Results.............................................................................................................57
Descriptive statistics for predictor variables .....................................................57
Descriptive statistics for outcome variables. .....................................................59
Bivariate correlations between variables. ..........................................................62
Assumptions for regression analysis. ................................................................64
Homoscedasticity and Linearity plots. ...........................................................65
Assumption of independent errors. ................................................................67
Plots of normally distributed errors. ...............................................................68
Regression analysis. ..........................................................................................69
Summary ...........................................................................................................78
V. Conclusions and Recommendations ................................................................81
Introduction ........................................................................................................81
Stages of Concern ..............................................................................................82
Conclusions and Recommendations by Stage of Concern ................................84
Stage 0 ...............................................................................................................84
Stage 1 ...............................................................................................................85
Stage 2 ...............................................................................................................86
Stage 3 ...............................................................................................................88
Stage 4 ...............................................................................................................89
Stage 5 ...............................................................................................................90
Stage 6 ...............................................................................................................91
Appendices ...........................................................................................................105
A. 5E Model of Instruction .............................................................................105
B. Superintendent and Principal Recruitment Letter ......................................109
C. Participant Recruitment Letter ...................................................................110
D. Stages of Concern Questionnaire ...............................................................111
E. Predictor Variable Campus Conditions ......................................................113
Texas Tech University, Bynum Blake Hightower, May 2012
v
F. Administrator Training ..............................................................................114
Texas Tech University, Bynum Blake Hightower, May 2012
vi
Abstract
This study examined the level of concern responses as measured by the Stages of
Concern Questionnaire of elementary school teachers relative to mandated curricular
change in West Texas. A recent curricular innovation known as CSCOPE was
implemented in the majority of K-12 public schools in Texas. Six public elementary
campuses participated in this study. Multiple linear regression was used to predict
teacher responses on the (SOcQ). This instrument was used to collect data on each
campus in order to determine the relationship between predictor variables and teacher
responses on the survey. Predictor variables included AYP status (federal
accountability), AEIS status (state campus rating), teacher years of service, and content
area taught, the year of implementation, and the level of CSCOPE implementation.
Results indicated that teachers were more resistant to the CSCOPE innovation in the first
year of implementation than in the second. Teachers also demonstrated less resistance to
the innovation when mandated to use the entire CSCOPE curriculum. Statistical
significance was demonstrated by the regression models for each stage of concern beyond
Stage 0.
Texas Tech University, Bynum Blake Hightower, May 2012
vii
List of Tables
4.1 Summary and Descriptive Results for Years of Teaching Experience
by School .....................................................................................................................58
4.2 Summary and Descriptive Results for Dichotomous Predictor
Variables ......................................................................................................................58
4.3 Mean and Standard Deviation of Scores within Stage of Concern 0, 1,
2 and 3 by School .........................................................................................................60
4.4 Mean and Standard Deviation of Scores within Stage of Concern 4, 5
and 6 by School ............................................................................................................60
4.5 Summary of Outcome Variables ..................................................................................62
4.6 Correlation Matrix for Predictor Variables and Outcome Variables ...........................63
4.7 Preliminary Data Analysis for Variables within Regression Models ..........................64
4.8 Independent Errors - Durbin-Watson Test Values between 1 and 3 ..........................67
4.9 Summary of the Regression Model for Stage 0 (Awareness) of Stages
of Concern ....................................................................................................................70
4.10 Predictor Variable Statistics within the Regression Model for Stage 0
(Awareness) of the Stages of Concern Model .............................................................70
4.11 Summary of the Regression Model for Stage 1 of Stages of Concern ......................71
4.12 Predictor Variable Statistics within the Regression Model for Stage 1
of the Stages of Concern Model...................................................................................72
4.13 Summary of the Regression Model for Stage 2 of Stages of Concern ......................72
4.14 Predictor Variable Statistics within the Regression Model or Stage2
of the Stages of Concern Model...................................................................................73
4.15 Summary of the Regression Model for Stage 3 of Stages of Concern ......................74
4.16 Predictor Variable Statistics within the Regression Model for Stage 3
of the Stages of Concern Model...................................................................................74
4.17 Summary of the Regression Model for Stage 4 of Stages of Concern ......................75
4.18 Predictor Variable Statistics within the Regression Model for Stage 4
of the Stages of Concern Model...................................................................................76
4.19 Summary of the Regression Model for Stage 5 of Stages of Concern ......................76
4.20 Predictor Variable Statistics within the Regression Model for Stage5
of the Stages of Concern Model...................................................................................77
4.21 Summary of the Regression Model for Stage 6 of Stages of Concern ......................77
4.22 Predictor Variable Statistics within the Regression Model for Stage 6
of the Stages of Concern Model...................................................................................78
Texas Tech University, Bynum Blake Hightower, May 2012
viii
Table of Figures
2.1. Stages of Concern Model ............................................................................................35
2.2. Organization systems independence ...........................................................................39
3.1. Stages of Concern for Implementation of an Innovation ............................................49
3.2. Stages of Concern Instrument .....................................................................................51
4.1. Mean Scores within each Stage of Concern by School. .............................................61
4.3. Homoscedasticity and linearity ...................................................................................65
4.3. Normally distributed errors .........................................................................................68
Texas Tech University, Bynum Blake Hightower, May 2012
1
Chapter I
Introduction
This study centered upon a major curricular innovation within school districts
throughout the state of Texas known as CSCOPE. According to CSCOPE developers,
“CSCOPE is a comprehensive, customizable, user-friendly curriculum management
system built on the most current research-based practices in the field” (The Texas
Education Service Center Curriculum Collaborative, 2012a, para. 1). CSCOPE was
developed by The Texas Education Service Center Curriculum Collaborative to address
current challenges for educators such as mobility rates and ineffective instructional
practices, while providing a guaranteed and viable curriculum for students based on
established standards (B. Gibson, personal communication, April 18, 2012).
Implementation of an innovation such as CSCOPE however, is a complex task that
involves systemic change for the school organization undertaking the process. This study
explores critical variables associated with innovation and systemic change, which include
the level of concern teachers exhibit via the SOcQ to mandated innovations.
The theoretical connections between Systems Theory, Concerns Theory, and
Management Theory are viewed through the lens of campus leadership as they relate to
effective innovation and change within organizations. The intent of the study is to add to
the current research-base and inform educational leaders of the effect the CSCOPE
innovation has upon the thoughts, feelings, and emotions of teachers as they encounter
this change process. The application of this study informs the practice of campus and
Texas Tech University, Bynum Blake Hightower, May 2012
2
district leaders relative to the best implementation practices associated with the CSCOPE
curriculum.
Educational leaders, and specifically principals, face a remarkable challenge: to
produce better and more equitable outcomes for students at-large and for the varying
student sub-populations across the nation as specified by state law, as stipulated by Texas
law, “The principal of a school is the instructional leader of the school” (Texas
Education Code, 1995). Many school districts are developing or acquiring new curricula,
which are developed based upon measureable performance standards to enhance student
achievement Lemons, Luschei, and Siskin (2003) state, “[w]hile details of the particular
policies vary, almost every state has now established a centralized curriculum and/or
performance standards, assessments to measure student learning” (p. 99).
This challenge to improve student performance has always been implicit for
conscientious educators however, despite the best efforts of teachers and administrators,
effective implementation of curricular programs has not consistently produced the desired
outcome of significantly improved student achievement among measureable sub-
populations. Jencks and Phillips (1998) found, “Black and Hispanic students still obtain
lower scores on standardized tests of reading, math, and science.” These results were in
direct contrast with the results of school improvement researchers in Cleveland Scott and
Bagaka’s (2004) who found that efforts were demonstrating significant school
improvement, "[f]indings show that teachers' perceptions of the success of reform
significantly predict improvement in student passage rates in both mathematics and
reading tests."
Texas Tech University, Bynum Blake Hightower, May 2012
3
For years, various educational theorists and researchers have claimed to have
answers to the questions relative to improving student achievement due to enumerable
educational conditions. These curricular and instructional mandates have failed to yield
results for many reasons. Dewey (1916) summarized this phenomenon nearly a century
ago in the following words:
Formal instruction, on the contrary, easily becomes remote and dead -- abstract
and bookish, to use the ordinary words of depreciation. What accumulated
knowledge exists in low grade societies is at least put into practice; it is
transmuted into character; it exists with the depth of meaning that attaches to its
coming within urgent daily interests (p. 10).
The practical application of the knowledge teachers try to impart to learners does
not resonate with them because there is no practical application for the knowledge apart
from the institutionalized setting of formal education. Again, Dewey’s assertions
concerning “low grade societies” are documented in Willis’ ethnography, Learning to
Labor: How Working Class Kids Get Working Class Jobs. “The rejection of school work
by 'the lads' and the omnipresent feeling that they know better is also paralleled by a
massive feeling on the shop floor, and in the working class generally, that practice is
more important than theory” (Willis, 1981, p. 56).
When John Dewey wrote about reforming education, he did so through the lens of
changing pedagogical practices by increasing educators’ awareness of the differences in
background of the students who educators are charged to educate. No doubt, he was
hoping that teachers would make standard their understanding of the importance of
Texas Tech University, Bynum Blake Hightower, May 2012
4
student context in the formal setting of institutional education. Dewey (1916) hoped for
refinement and tailoring of well informed instructional practice for the common good of
the progeny, stating, "What they must have in common in order to form a community or
society are aims, beliefs, aspirations, knowledge -- a common understanding -- like-
mindedness as the sociologists say" (p. 5).
Dewey’s claim concerning the importance of communication and shared
understanding between teacher-and-teacher and teacher-and-learner poses a more
daunting task today than it did in 1916. If one adds to the vast differences in background
of the 21st century learners the increasing diversity within the ranks of current educators,
the difficulty of attaining a shared vision and a sense of community has exponentially
increased. Further, Dewey (1916) acknowledged that sharing the same physical
proximity with others of the same species does not automatically indicate the existence of
a community, but may simply indicate a symbiotic relationship, "[t]he parts of a machine
work with a maximum of cooperativeness for a common result, but they do not form a
community" ( p. 5). Community and culture are critical in establishing a flourishing
learning environment for students.
Other researchers claim that the answers for reform already exist. Ron Edmunds
(1981) made the following provocative statement:
We can, whenever and wherever we choose, successfully teach all children whose
schooling is of interest to us. We already know more than we need to do that.
Whether or not we do it must finally depend on how we feel about the fact that we
haven’t so far. (p. 53)
Texas Tech University, Bynum Blake Hightower, May 2012
5
One can hardly argue with Edmunds assertion, as Dewey was aware of the problem and
hinting at a solution 70 years before Edmunds made the statement.
Many obstacles exist for school administrators across Texas as they attempt to
reform curriculum and instruction to facilitate increased student achievement within the
context of the K-12 public schools. Marzano, Waters, and McNulty (2005) identified and
studied 21 categories or responsibilities of school leaders in their research and stated,
“[c]onsequently, we examined the 69 studies in our meta-analysis looking for specific
behaviors related to principal leadership. We identified 21 categories of behaviors that
we refer to as responsibilities” (p. 41).
Although organizational contexts related to K-12 education vary considerably
across Texas, many of the variables affecting student achievement are quantifiable.
Marzano (2003) in his meta-analysis of research on school effectiveness further stated
that “guaranteed and viable curriculum is the most important aspect influencing student
achievement” (p. 10). Marzano defines this central tenet of effective schools by
enumerating three elements that must exist for a curriculum to be viable and guaranteed.
First, students must have the opportunity to learn the content. Second, the scope of the
curriculum must address the appropriate standards and third, the time must be afforded
the teacher to adequately address the content with the students (Marzano, 2003).
As our country becomes progressively more diverse, the gap in socioeconomic
status continues to widen (Bryan and Martinez, 2008). School administrators face
pressure to facilitate the implementation of programs to improve student achievement
(Texas Administrative Code, 2009) for an increasingly dissimilar student population.
Texas Tech University, Bynum Blake Hightower, May 2012
6
Implementation of new curriculum and instructional methodologies are plagued
by a myriad of problems, which are strongly associated with socio-economic status. Low
SES students experience an increased mobility rate as compared to students who are not
economically disadvantaged. Ream (2005) found that "[t]he incidence of mobility is
particularly high within large, predominantly minority, urban school districts with high
concentrations of students from low socioeconomic backgrounds" High mobility further
destructs low SES students’ ability to maintain familial, institutional, and community
networks. The absence of these social networks consistently demonstrates a correlation
to student underachievement (Putnam, 2000). Adding merit to his findings, Ream (2005)
enumerated the disruption of the social system of low SES students saying,
Like the frequent repotting of plants, mobility tends to disrupt social root systems,
limiting the capacity of students and their interlocutors to develop and maintain
social capital by (a) disrupting family cohesion, (b) inhibiting students' efforts to
make new friends and adjust socially to a new school situation, and (c) impinging
on the development of reciprocal relations between students and institutional
agents within the broader community (Jason et al., 1992; Pribesh and Downey,
1999; Putnam, 2000; Ream, 2003). (p. 12)
One significant problem is the learning gaps related to the transient nature of
many students within the state of Texas and it has stymied educators for decades. Many
highly mobile students across the state developed gaps in their learning because curricula
varied drastically from district to district, campus to campus, or even classroom to
classroom. Instructional standards also varied greatly. In an effort to deliver quality
Texas Tech University, Bynum Blake Hightower, May 2012
7
instruction aligned to state standards, a majority of Texas schools have implemented a
new curriculum called CSCOPE. CSCOPE stands for curriculum-scope. The Texas
Education Service Center Curriculum Collaborative (TESCCC) developed it. This
curriculum has been widely adopted by school districts across the state and is currently in
use by 810 districts and 4,631 campuses across Texas (J. Thomas, personal
communication, January 3, 2012).
CSCOPE is a web-based curriculum designed to meet the state performance
measures for all core-content areas in kindergarten through 12th
grade. CSCOPE is
comprised of four basic elements for every content area. The first element of CSCOPE is
the Vertical Alignment Document (VAD), which allows teachers and administrators to
compare the Texas Essential Knowledge and Skills for each grade level in a side-by-side
format. This document ensures that the curriculum is vertically and horizontally aligned.
It also informs teachers of the possible gaps in learning that any student may exhibit. The
second element of the curriculum is the Year at a Glance document (YAG), which is a
calendar-based graphic that establishes the timeline for content delivery within content
areas. The third element of the curriculum is the Instructional Focus Document (IFD),
which establishes the cognitive level to which the content must be taught, the necessary
vocabulary to be acquired, the common misconception associated with the performance
measures, and a general explanation of the lesson and how it relates to future and
previous learning. The fourth element is the Exemplar Lessons (EL), which provides
teachers with a scripted lesson plan that includes research-based instructional strategies.
These four elements within the CSCOPE curriculum ensure a guaranteed and viable
Texas Tech University, Bynum Blake Hightower, May 2012
8
curriculum for all learners according the Education Service Centers (ESC) who markets
this curriculum (The Texas Education Service Center Curriculum Collaborative, 2012b).
When CSCOPE is introduced to a new district, ESC personnel ask district leaders
several questions. After showing the district leaders the Vertical Alignment Document,
they ask, “Do you feel that your district needs a vertically and horizontally aligned
curriculum?” The resounding response was affirmative in no fewer than 810 cases.
“Then your district must establish that the VAD is a non-negotiable for the faculty,” and
the gavel drops and policy is made at that moment. This process continues in the same
manner as the sales team show the district leadership the Year at a Glance, and then the
Instructional Focus Document. However, when the ESC team engages conversation
around the Exemplar Lessons, the recommendation is that it this element of CSCOPE
should not be a non-negotiable. Teachers may choose to use the provided lessons or
simply retool their existing lessons to fit the rigor and content established in the IFD (see
Appendix E).
Using research-based curriculum should result in improved student achievement.
However, despite the use of CSCOPE, student achievement does not always improve.
Change initiatives are generally not well received by school organizations as documented
by Elliott, Kratochwill, and Roach (2003). They found that "[r]esistance to change is a
typical response among stakeholders in any organization" (p. 322). Research on
organizational behavior suggests educators who interpret the high-stakes accountability
systems as a threat may gravitate toward "rigidity of action rather than an expansion of
strategies and adaptation" (O'Day, 2002, p. 313).
Texas Tech University, Bynum Blake Hightower, May 2012
9
Researchers at the Southeastern Educational Developmental Laboratories
(SEDL) have identified problems typically encountered by school organizations as they
adopt new curricular and instructional innovations associated with change processes
(Elliott, Kratochwill, and Roach, 2003). The Concerns-Based Adoption Model (CBAM)
provides an analysis tool to measure how individuals within an organization feel about
the innovation or change process. The CBAM was developed at the University of Texas
at Austin within the Texas Research and Development Center for Teacher Education
(Faircloth, Smith, and Hall, 2001). Stages of Concern (SoCQ) measures seven levels or
stages of concern for individuals within an organization as they encounter change
initiatives, or innovations. Primary among the organizational roadblocks encountered by
any school organization is the emotional response to the innovation on the part of faculty
members. The CBAM model is the most prolific model found in the literature
surrounding organizational change and it has been used in hundreds of studies since
1977.
Statement of the Problem
CSCOPE is an educational innovation being implemented to varying degrees
across the state of Texas. This study identified the difference in teachers’ stages of
concern during the 1st and 2
nd year of CSCOPE implementation. This study also
examined other aspects of influence associated with the degree to which the innovation is
required to be implemented as well as the possible relationship between teachers’ stages
of concern relative to CSCOPE and their level of experience.
Texas Tech University, Bynum Blake Hightower, May 2012
10
Even though many reform initiatives are research-based and founded upon
scientifically sound pedagogical practices, educational bureaucracy fails to acknowledge
varying contexts that are inherently unique within our greatly varied institutions. Cheung
(2002) found
There are numerous factors that negatively impact educational innovation
however, chief among those reasons is the change facilitators lack of attention to
teachers' concerns in relation to the innovation are not considered as an integral
elements in the change process. (p. 1)
The distinctive context of every campus on which innovations are implemented
demands unique solutions and adaptations of the programs being instituted, or perhaps an
entirely different strategy needs to be used. Sergiovanni (2001) states, "[i]mplementation
decisions lead to the creation of policies in use. Good implementing decisions are able to
respond to local contexts and needs by resembling the handed down mandates while
being different" (p. 33).
Significance of the Study
The CSCOPE curriculum has been widely adopted by school districts across
Texas and is currently in use by 810 districts and 4,631 campuses in Texas (J. Thomas,
personal communication, January 3, 2012). The results of this study are relevant and
significant to the majority of educators across the state of Texas. CSCOPE is a unique
curriculum, which requires teachers to implement not only curricular change, but also
prescribes how teachers will instruct a given skill (when Exemplar Lessons are mandated)
and this unique feature has not been previously studied.
Texas Tech University, Bynum Blake Hightower, May 2012
11
Theoretical Framework
This study is based upon Systems Theory as it relates to the interdependent nature
of subsystems. The top-down change initiative, which is clearly associated with school
reform, does not routinely consider the effect such mandates have upon subsystems
within an organization. Beach and Lindahl (2004) found that “[t]his conceptual
background helps the leadership team to envision the school as embedded within the
overall district and environment and to understand how various sub-systems of the school
affect and are affected by the organizational improvement effort” (p. 8-9).
Also connected to this body of research is Management Theory, which is
inexorably intertwined with Systems Theory and organizational change as it relates to
school reform. As quantitative, data-driven leadership is increasingly in use due to high-
stakes testing, Taylorism looms as the management theory of choice for schools. As
Batagiannis notes in her research concerning NCLB, "The demand for instantaneous
perfection and the focus on simplistic, technical solutions also reflect the scientific
management theory and Taylorism of the early 1900s" (Batagiannis, 2007, p. 1).
Concerns Theory is a critical piece in this study as well. Concerns Theory as it
relates to school change is pertinent to all change initiatives because faculty levels of
concern often dictate resistance to change initiatives being undertaken.
There is an array of feelings, perceptions, worries, preoccupations, and moments
of satisfaction for those engaged with implementing new approaches. This
personal side of change is important to understand because failing to address
concerns can lead to resistance and even rejection of the new way. (Hall, Hord,
Texas Tech University, Bynum Blake Hightower, May 2012
12
Aguilera, Zepeda, and Frank, 2011, p. 1)
Purpose of the Study
School leaders must be cognizant of the impact program implementation and
innovations leading to change have upon their faculty, since program success depends
upon faculty response to the innovation, “[t]he transformational leadership model brings
attention to the leader's role in raising followers' understanding of, and commitment to,
specific organizational goals or values, even beyond their own idiographic needs” (Beach
and Lindahl, 2004, p. 1). Change initiatives are generally not well received by school
organizations (Elliott, Kratochwill, and Roach, 2003, p. 322). Research on organizational
behavior suggests educators who interpret the high-stakes accountability systems as a
threat may gravitate toward "rigidity of action rather than an expansion of strategies and
adaptation" (O'Day, 2002, p. 313).
The purpose of this study is to add to the knowledge base of educational leaders
as it relates to mandatory educational innovations and the influence of faculty concern on
the success of the innovation. This study focuses upon the CSCOPE curriculum and the
elemental level to which district and campus leaders choose to implement the curriculum
and the subsequent stages of concern, or attitudes, demonstrated by the faculty affected
by such change.
Research Question
The study was guided by the following research question:
Can researchers predict the Stages of Concern outcome (stages 0-6) for
teachers using the CSCOPE curriculum based on the following predictors?
Texas Tech University, Bynum Blake Hightower, May 2012
13
- Year of implementation (first, or second)
- Required Exemplar Lessons (yes or no)
- Years of experience teaching
- AEIS Rating of Academically Unacceptable
- AYP Rating of Missed AYP
- Content Area (Math, or other content area)
Delimitations of the Study
Parameters for this study include six West-Texas public elementary schools.
Three of which have fully mandated the implementation of CSCOPE to include all
CSCOPE elements including the Exemplar Lessons. The remaining three campuses have
implemented the CSCOPE curriculum without requiring Exemplar Lessons. Using the
Stages of Concern survey contained within the Concerns-based Adoption Model
developed by the University of Texas, faculty members will identify the effect that the
change initiative has evoked relative to their emotional response using an eight point
Likert scale. Data analysis will be conducted and will include the following variables:
years of experience, year of implementation, AEIS rating, AYP rating, level of
implementation of CSCOPE, and the content area of the teacher.
Limitations of the Study
This study is will focus only upon the Stages of Concern model for measuring the
affective response of the teachers utilizing the CSCOPE curricular change initiative in six
West Texas elementary schools. The researcher is aware that many variables outside the
implementation of this curriculum are not considered in the study. The researcher also
Texas Tech University, Bynum Blake Hightower, May 2012
14
acknowledges the varied level of administrative support and training made available to
the various schools being studied.
Assumptions
1. It is assumed during this study that participants will answer the survey openly
and honestly.
2. It is assumed during this study that the sample population will accurately
reflect the experiences and attitudes of the population from which it has been
selected.
Texas Tech University, Bynum Blake Hightower, May 2012
15
Definition of Terms
Concerns-Based Adoption Model (CBAM) is a scientific research model used to measure
and inform the organizational leadership of the degree to which an organizational
innovation has been accepted and implemented.
CSCOPE is a comprehensive web-based curriculum management system, which is
vertically and horizontally aligned across grade levels as described by the Texas Essential
Knowledge and Skills.
Exemplar Lessons are the individual learning objective content to be taught on a day-by-
day basis. It includes high-yield, research-based instructional strategies and activities
along with suggested materials for each lesson.
Instructional Focus Documents (IFD) is a document that provides teachers with common
misconceptions associated with given TEKS, the academic vocabulary associated with a
unit of instruction, and the level of cognition to which the content must be covered.
Stages of Concern (SoC) is the continuum of personal attitudinal responses to a given
innovation within an organization.
Stages of Concern Questionnaire (SoCQ) is the 35-question survey developed by the
Texas Research and Development Center for Teacher Education, University of Texas at
Austin. It has been in use since 1974 and is a well documented scientific instrument
found in the majority of literature surrounding educational change and innovation.

Texas Tech University, Bynum Blake Hightower, May 2012
16
Vertical Alignment Documents (VAD) demonstrates the vertical alignment associated
with the acquisition of essential learning objectives by content area and grade level. It is
graphically organized so that side-by-side comparisons between grade level TEKS are
easily observable.
Year at a Glance (YAG) is a graphical representation of the timeline for teaching the
stated curriculum.
Overview of the Study
The organization of this study is divided into five chapters. The first chapter
introduces the study and identifies the problem statements as well as delineating the
context in which the study will take place. The significance of the study is identified and
the theoretical framework associated with the topic is described. Definitions of key
terminology are provided and limitations and delimitations are acknowledged within
Chapter I.
Chapter II provides a review of the current literature surrounding the topic of
organizational change. The Concerns-Based Adoption Model is a focus within the
Stages of Concern survey instrument. Educational and curricular reform efforts are
explored and framed within the context of teachers’ response to change initiatives.
Lastly, four elements of the CSCOPE curriculum are discussed and the CSCOPE
implementation model is described.
Chapter III, Methodology, describes the research methods used to conduct this
work. The researcher used a web-based proprietary survey instrument to assess reaction
Texas Tech University, Bynum Blake Hightower, May 2012
17
to the implementation of the CSCOPE at six different Texas elementary schools.
Researchers downloaded the tab delineated results file into SPSS to analyze the results.
Descriptive statistics and regression analysis was completed on the data.
Chapter IV, Results, describes the data outcomes of the survey. Researchers used
both descriptive and correlation/regression data analysis to analyze the results. Results
are presented in tabular and paragraph form.
Within Chapter V, Conclusions, researchers discuss the results of this research.
The research variables are discussed and generalizations concerning the research
questions are enumerated. Recommendations for further study related to the results are
proposed.
Texas Tech University, Bynum Blake Hightower, May 2012
18
Chapter II
Review of Literature
This review of literature was framed within the context of organizational/school
management as it relates to educational innovations in the form of a particular curricular
and instructional innovation (CSCOPE). Systems Theory also impacted the study as it
relates power structures present within school organizations and the interdependent
nature of schools as systems. The role of campus principals as organizational change
facilitators was explored in this literature review through the lens of Systems Theory,
Management Theory, and Concern Theory relative to innovation within school
organizations. The literature review also explored the history of school reform efforts,
issues surrounding implementation strategies used by administrators to include the
concerns of teachers during innovation implementation, and current theoretical
perspectives associated with the CSCOPE curricular mandate being used in a majority of
Texas schools.
Systems Theory
Successful organizations are organic; they are able to metamorphose and recreate
themselves to suit the needs of their constituency and produce a final output consistent
with their goals, "[t]he phrase ‘continuous change’ is used to group together
organizational changes that tend to be ongoing, evolving, and cumulative" (Weick and
Quinn, 1999, p. 375). Schools, being organizations, must contend with change
initiatives. However, change initiatives within organizations, be they schools or not, are
many times fruitless and do not yield the desired outcome. One may cite enumerable
Texas Tech University, Bynum Blake Hightower, May 2012
19
reasons for failed change initiatives, but the current body of literature generally supports
the notion that management teams are not cognizant of the fact that change initiatives are
influenced by a vast array of variables. Hedge and Pulakos (2002) cite “the vested
interests of organizational members, fear of uncertainty, misunderstandings, social
disruption, inconvenience, organizational incompatibility, lack of top-level support and
commitment, and rejection of outsiders” (p. 3) as reasons for resistance to change.
Traditional management theories associated with efficiency in organizations are
imbedded in Systems Thinking. Doherty and Horne (2002) define human users as parts of
a system, "[i]n systems thinking, human activity systems are assumed to be part of a
universal hierarchy of wider systems and subsystems" (p. 34). This is closely associated
with the work of Frederick Taylor who developed his Scientific Management Theory in
the early 1900’s in order to maximize productivity and efficiency, "Taylorism is the
belief that both the preordained natural order and the maximization of profits dictate that
the fittest should manage as benevolent dictators and that the rest should work" (Gray,
1993, p. 21).
Throughout the 20th
century, Taylorism was the de facto management practice in
most organizations. Waring (1991) summarized his historical documentation saying,
Although managers repudiated parts of Taylor's prescriptions, his fundamental
premises met their philosophical and technical needs and by mid-century had
come to dominate managerial theory and practice. Even in the second half of the
century, moreover, many in the management community have continued to
believe that successful management and Taylor's scientific management were one
Texas Tech University, Bynum Blake Hightower, May 2012
20
and the same. (p. 9)
Schools like other large organizations assimilated themselves within the context of
Taylor’s framework. Indeed, archaic management practices continue to work against the
effectiveness of principals as they persist in top-down management styles. Which is
documented by previous research:
Clearly, educational leadership is challenging in today's volatile climate of policy
makers' endless blame and constant attacks on public education, including the
hidden dimension of a seeming determination to substitute technical management
for thoughtful leadership. (Bracey, 2002; Giroux, 2009a, 2009b; Goodlad, 2007)
(Batagiannis, 2011 p. 1304-1305)
Educational theorist John Dewey recognized the need for clearly defined direction
for subordinates, in the early 20th
century. In his opinion schools were not staffed with
teachers who had a great insight into methodology. He saw a dictatorial management
style as necessary, "‘Methods’ have then to be authoritatively recommended to teachers,
instead of being an expression of their own intelligent observations" (Dewey, 1921, p.
251).
Douglas McGregor, a professor at MIT, engineered a new vision for
organizational management based upon Maslow’s Hierarchy of Human Needs.
McGregor developed Theory X/Y in 1960. Theory Y postulates that humans are not lazy,
are capable of self-direction, and have much to offer relative to problem-solving within
the context of any organization. This theory was in direct contrast to the existing
Tayloristic management style, which was the standard in organizational structures in both
Texas Tech University, Bynum Blake Hightower, May 2012
21
the public and private sector throughout much of the 20th
century. Some organizations
began migrating into the McGregor postulates; however, school organizations have been
slow to adopt the Theory Y management philosophy:
The first wave of restructuring efforts to increase the quality and effectiveness of
the educational enterprise was comprised of public policy mandates and
inducements. This wave was characterized by adherence to the Industrial Age
model of management (Taylor, 1947). It was authoritarian, teacher centered,
competitive, stressed uniform minimum standards, accountability and was single
pathed and linear (Sergiovanni, 1993). (Enderlin-Lampe, 2002, p. 139)
School organizations have struggled to overcome the dynamics of Taylorism
despite the directives given in law to involve stakeholders in site-based management
activities. “This process must involve professional staff of the district, parents and
community members in establishing and reviewing the district’s and campuses’
educational plans, goals, performance objectives and major classroom instructional
programs” (Texas Education Code, 2011, para. b).
School Reform
The first efforts at curricular and instructional reform began in earnest with the
passage of The Elementary and Secondary Education Act in 1965. Stringfield alludes to
its historical importance stating:
It has provided our nation with our most accurate, most historically deep data set
on, among other issues, the depth of disadvantage that many of our students have
suffered. It has also provided some of our most stable data for hope about equity

Texas Tech University, Bynum Blake Hightower, May 2012
22
in our long-term future (Stringfield, 2007, p. 308).
Multiple studies advanced from the National Assessment of Educational Progress
measures have demonstrated a lack of improved achievement on the part of African
American students. Baltimore is cited in multiple studies as a community that introduced
curricular and instructional change efforts to no avail:
A series of reports from both White business groups and Black community
leaders between the late 1980s and mid-1990s-each calling for the combination of
increased funding, multiple reforms, and increased accountability-failed to bring
significant change to the system on any of these dimensions (Bowler, 1997;
Cibulka, 2003a, 2003b; Orr, 1999). (Stringfield and Yakimowski-Srebnick, 2005,
p. 47)
Curricular reform was again the focus in 1983 when the federal report entitled A
Nation at Risk was published. The report found that our schools were (at best) inefficient
mechanisms for delivering quality curriculum to students. The following excerpt is taken
from the report and reflects the research team’s concern with adequate preparation for
students in the core content areas:
We recommend that state and local high school graduation requirements be
strengthened and that, at a minimum, all students seeking a diploma be required to
lay the foundations in the Five New Basics by taking the following curriculum
during their 4 years of high school: (a) 4 years of English; (b) 3 years of
mathematics; (c) 3 years of science; (d) 3 years of social studies; and (e) one-half
year of computer science. For the college-bound, 2 years of foreign language in
Texas Tech University, Bynum Blake Hightower, May 2012
23
high school are strongly recommended in addition to those taken earlier. (National
Commission on Excellence in Education, 1983, Recommendation A)
States and local education agencies across the nation reacted by legislating and
mandating strict adherence to curriculum standards. Within the parameters of high-
stakes, accountability-based assessment, administrators face a daunting challenge to
increase achievement levels of the measureable sub-populations identified by state and
federal education entities. African American students, Hispanic students, Limited
English Proficiency students, special education students, and economically disadvantaged
students are all measured independently within our accountability system (Academic
Excellence Indicator System Reports, 2012).
Many of the curricular mandates exist due to a disparity in achievement between
the afore-mentioned sub-populations and their Caucasian counterparts. Good (2003),
found that a significant gap was still apparent between Black and White students and that
the gap increased in 2002 (The College Board, 2002), and Black students still obtain
lower scores on standardized tests of reading, math, and science (Jencks and Phillips,
1998). Again, Stringfield (2007) stated:
The longitudinal NAEP has provided very clear data that the racial achievement
gap between Blacks (and, in other analyses, Hispanics) and Whites has been
reduced by nearly half since the early 1970s … These narrowing gaps have been
true at all three NAEP ages (9, 13, and 17) and in both Reading and Mathematics.
(p. 308)
Since The National Commission on Educational Excellence produced the report,
Texas Tech University, Bynum Blake Hightower, May 2012
24
A Nation at Risk (1983), educational leaders across the nation have been called upon to
improve instructional practices and increase the rigor of curriculum standards. However,
the task was not left to individual districts or campuses and the end result was an endless
series of top-down initiatives designed to meet the demand for increased student
achievement. Hunt, 2008, commented, "Many of these excellence initiatives came from
state legislatures and state departments of education. The movement was clearly
perceived to be top-down" (p. 580).
Efforts relative to mandated school reform subsequent to the A Nation at Risk
report have increased accountability measure even further. Federal and state
governments flood school campuses across the nation with new curricular initiatives.
Addressing the achievement gaps for varying sub-populations was again the focus for
legislators with the passage of No Child Left Behind Act:
The No Child Left Behind Act (NCLB) of 2001 mandated that teachers of core
subjects be highly qualified, provided federal money to educate low achieving
students, and required that programs using federal money be based on scientific
research. (Hodge and Krumm, 2009, p. 20)
Implementation on the part of teachers and campus leaders is mandatory as
educators are assimilated into an expanding bureaucracy. Autonomy in decision-making
at the district and campus level is compromised due to the increasing numbers of
mandates associated with federal legislation. As stated by Bloomfield and Cooper
(2003), “[t]he trend toward the macro-authority of state and federal mandates, and away
from the relatively micro-authority of local governance, has moved much decision-
Texas Tech University, Bynum Blake Hightower, May 2012
25
making to the state level under strict federal guidelines that demand institutional
solutions” (p. 6).
Indeed, the need for curricular reform leading to improved student achievement
targets closing the achievement gap relative to sub-population achievement. In Texas
and around the nation, the increased rigor associated with curricular reform appears to
widen the achievement gap between white students and varying sub-populations.
In the "Myth of the Texas Miracle in Education," Haney contends that Texas'
method of accounting for dropouts does not accurately reflect the number of students
who leave the system after failing to pass the graduation test. According to Haney's
analysis, only some 70% of African-American and Hispanic students persist from grade
six through graduation (Patterson, 2000). However, opposing studies suggest that
progress in closing the achievement gap has been made, “[a]fter just one year of
heterogeneous grouping, the passing rate for African American and Hispanic students
increased from 48% to 77%, while the passing rate for white and Asian American
students increased from 85% to 94%” (Burris and Welner, 2005, p. 597).
In January of 2002, President George W. Bush signed the No Child Left Behind
Act into law. The legislation was designed to combat the achievement gap between
white students and their sub-population counterparts. While the objectives of NCLB
were ultimately designed to meet the goal of increasing student achievement and closing
achievement gaps between groups of students, as with many previous federal education
initiatives, NCLB has been met with varying levels of support due to the directive nature
of the legislation (White, Loker, March, and Sockslager, 2009).

Texas Tech University, Bynum Blake Hightower, May 2012
26
The design of NCLB is unequivocally seen as a mandate to cause achievement
reform via curricular change. However, some studies demonstrate the net result of
NCLB has been detrimental to student achievement, "in fact, the slope of this
encouraging decrease became less steep from 2003 to 2005. This would indicate that
NCLB slowed down the rate at which the gap was closing" (White, Loker, March, and
Sockslager, 2009, p. 1).
Robert Marzano has demonstrated through research that the establishment of a
guaranteed and viable curriculum is of preeminent importance, "[t]he first school-level
factor is a guaranteed and viable curriculum. I rank this as the first factor, having the
most impact on student achievement" (Marzano, 2003, p. 22). Another program,
“Response to Intervention, or RtI” was designed to reduce the number of misidentified
students funneled into special education classes. Each of these changes are heralded to
be the answer for our educational woes, and consequently many of the ideas find support
in legislative bureaucracies and ultimately become mandates which, if implemented,
should lead to systemic school reform. Many questions remain regarding the state of
education in the United States and our failure to achieve substantial reform of our K-12
learning institutions.
Even though many reform initiatives are research-based and founded upon
scientifically sound pedagogical practices, our educational bureaucracy fails to
acknowledge varying contexts that are inherently unique within our greatly varied
institutions. The distinctive context of every campus on which these programs are
implemented demands unique solutions and adaptations of the programs being instituted,
Texas Tech University, Bynum Blake Hightower, May 2012
27
or perhaps an entirely different strategy needs to be used, "[i]mplementation decisions
lead to the creation of policies in use. Good implementing decisions are able to respond
to local contexts and needs by resembling the handed down mandates while being
different" (Sergiovanni, 2001, p. 11).
Principals need to have the autonomy to create solutions, or alter mandated
programs based on the individual campus needs.
That is, the state and local authorities have a responsibility to articulate clearly the
goals and priorities of the schools and what they will accept as evidence of
progress toward those goals. Beyond that, each school unit should be given as
much discretion as is possible regarding how the available resources will be
deployed to achieve those intended outcomes. (Lezotte, 1993, p. 37)
Increasingly, the role of campus level administrator is becoming that of
messenger rather than innovator. Receiving mandates and dictates from superiors within
school district hierarchies leaves principals powerless to improve instruction based on
individual campus contexts. The non-negotiables associated with campus reform
initiatives prescribe timelines and strategies that demand strict implementation of these
one size fits all programs. Bracey (2008) studied the impact upon teacher efficacy, "[t]he
changes in teachers' lives can be summarized as more and faster, with less autonomy" (p.
781).
Principals across the nation dutifully carry out their tasks as assigned by
superintendents; they deliver program mandates to overwhelmed and underpaid teachers
all the while falling victim to bounded awareness (the failure to take into account
Texas Tech University, Bynum Blake Hightower, May 2012
28
pertinent or pivotal information when making a decision), “…using evidence about
focalism to illustrate how people over focus on some information and fail to use other
easily available information” (Chugh and Bazerman, 2007, p. 4). Principals buy into the
program without full knowledge of best practices relative to change innovation.
Consequently, our nation’s school systems find themselves failing to produce the reform
our students so desperately need.
CSCOPE Curriculum Development
Amid the increasing demands of federal and state accountability standards, a new
curriculum has been developed in Texas know as CSCOPE. This curriculum differs from
all previous curricular change efforts because it provides not only what is to be taught
and when it is to be taught, but also how curriculum is to be taught. This curricular
migration to tighter control may contain the missing element, which all other curricular
models failed to consider, fidelity, “…schools should implement a systematic procedure
to insure that assessments are aligned with curriculum (their IEPs) and instruction. Such
alignment should be designed to insure that assessments not only support accountability,
but also they should specifically support learning” (Thornton, Hill, and Usinger, 2006, p.
115). Although CSCOPE is a relatively new curriculum, evidence is materializing that
supports a narrowing of the achievement gap in some schools using the product.
CSCOPE is a comprehensive web-based curriculum management system that
includes components for establishing a vertically and horizontally aligned curriculum and
standards for instruction based upon Texas Essential Knowledge and Skills. Over 30
grounded theories inform the CSCOPE curriculum with regard to best practices for
Texas Tech University, Bynum Blake Hightower, May 2012
29
curriculum and instruction. The four core elements of the curriculum do need to be
explained as they will be referred to throughout this study. System components of
CSCOPE include the following:
Vertical Alignment Documents (VAD) - The (VAD) graphically organizes the
TEKS in a side-by-side format from one grade to the next so that teachers can see the
relationship of the curriculum they are teaching to subsequent and previous grade levels.
The research and grounded theory to support the (VAD) is largely derived from the meta-
analysis of school reform literature compiled by Marzano in which researchers gathered
data on 69 studies between 1978 and 2001 (Marzano, Waters, and McNulty, 2005). In
particular, the guaranteed and viable curriculum is the premise on which the entire
CSCOPE product is based. Viability addresses to the concept that enough time must be
provided instructional personnel to teach a given curriculum. They found that, "[v]iability
refers to whether the stated curriculum can be adequately taught in the instructional time
available to teachers" (Marzano, Waters, and McNulty, 2005, p. 14). The guaranteed
nature of the curriculum is viewed as the requirement that all teachers cover the essential
portions of the curriculum, "this means that a school imposes the constraint that
classroom teachers must address specific content in specific courses at specific grade
levels" (Marzano, Waters and McNulty, 2005, p. 15).
Year at a Glance (YAG) - The YAG organizes the scope of when each element of
the curriculum will be taught so that all tested portions of the curriculum will be covered
prior to the yearly testing date. Built into this system are approximately five flex days for
each six week period to allow for reteaching, or curricular interruptions that invariably
Texas Tech University, Bynum Blake Hightower, May 2012
30
take place in the course of day-to-day school operations. This portion of the CSCOPE
product is based largely upon the research of Jacobs (2004) who analyzed the number of
standards to be taught in various states and school districts. She found that the standards
could not be taught independently due to the fact that so many standards existed, "[i]n the
7th and 8th grades alone, more than 1,000 standards existed in the core subject areas”
(Truesdale, Thompson, and Lucas, 2004, p. 13).
Chunking the standards together in order to connect the curriculum by linking the
standards conceptually is a necessity. Vertical and horizontal elements of the curriculum
must be considered when building and effective map, "[t]he lack of horizontal
consistency across schools and vertical continuity within schools created a major barrier
to quality" (Jacobs, 2004, p. 1). When using the CSCOPE (VAD), teachers can easily
make the conceptual connections between grade level standards as it is graphically
represented.
Instructional Focus Documents (IFD) - The IFD explains the level of rigor, or
Bloom’s level to which each part of the curriculum must be taught. The level of rigor is
informed by Marzano (2003), Wiggin and McTighe (2005), and Erickson (2001).
This document also details the required vocabulary associated with each
curricular unit. Marzano’s 2003 research on the acquisition of the appropriate academic
vocabulary forms the basis for the IFD. The structures for ensuring vocabulary
acquisition are presented in the IFD, "[a]s Stahl (1999) notes, ‘the goal of vocabulary
learning is to have students store the meanings of the words in their long-term memory’”
(Marzano, 2004, p. 6).
Texas Tech University, Bynum Blake Hightower, May 2012
31
The IFD also provides teachers with a list of common misconceptions associated
with the curricular unit. The research behind this particular element in the CSCOPE
curriculum is based upon the research of Grant Wiggins and Jay McTighe, which applies
the principle of reverse engineering to educational theory, "[t]he process of backward
design is a deliberate approach to help designers avoid these all-too-common mistakes”
(Wiggins and McTighe, 2005, p. 1). The common mistake to which Wiggin and
McTighe (2005) refer is random instruction that does not consider the performance
measure that students must meet.
Exemplar Lessons (EL) – The ELs are a practical application of the daily lesson as
described within each of the previous documents. Much of the EL is based upon the
learning theory of Lev Vygotsky and his postulates concerning social language and
cognition, “[t]he concept of cognition as a phenomenon that extends beyond the
individual, that arises in shared activity, owes a clear debt to the original Vygotskian
understanding that the interpersonal precedes the intrapersonal” (Daniels, 2001, p. 1).
Most of the EL’s include cooperative learning strategies through which students
articulate to one another concerning the learning objective. The acknowledgement that
learning is active, and linguistic discourse is a relevant and necessary for learning, is a
motif seen throughout the CSCOPE literature.
Constructivism is a central tenet of CSCOPE. The EL considers the assimilation
of new knowledge as a process related to long-term memory. “The effectiveness of this
approach to teaching, known as constructivism, has been extensively documented
(Carpenter, Zenger, Tolhurst, Day, Barron and Dozier, 1999; Chang and Barufaldi, 1999;
Texas Tech University, Bynum Blake Hightower, May 2012
32
Chang, Hua and Barufaldi, 1999)” (Clark and James, 2004,p. 1). Of note, is the fact that
EL’s are based upon the 5-E model of instruction and each lesson provides guiding
questions that ensure that the appropriate level of rigor is addressed during the lesson
presentation (See Appendix A).
CSCOPE is typically sold to districts by a visiting team from the Region
Education Service Center. The team brings with it manipulatives to describe the issues
that have prevented previous programs and curriculum initiatives from being successful.
Also discussed is the lack of teacher adherence to the Texas Essential Knowledge and
Skills. The presentation centers around the required curriculum (TEKS), the
implemented curriculum (TEKS), and the curriculum that is taught, but not required by
state standards. The team presents to a group of district leadership personnel, which
generally does not include teachers.
The first element discussed is the VAD. The VAD is explained in detail and a
question is then posed to the district leadership team. “Do you need a vertically and
horizontally aligned curriculum?” The district leadership team replies in the affirmative
and so the CSCOPE sales team then affirms the decision by confirming that the VAD
will be a non-negotiable for teachers to follow. The Region Service Center sales team
then asks the same question concerning the YAG, “Is covering the required curriculum a
non-negotiable for this district?” The district affirms they are agreeable to the non-
negotiable standard. The same process takes place with the IFD, however, when the EL
is presented, the team suggests that the district not establish a non-negotiable status for
the EL. The team states that it allows for a degree of teacher autonomy to exist so that
Texas Tech University, Bynum Blake Hightower, May 2012
33
the curriculum is not a complete mandate. The suggestion is that this degree of teacher
autonomy allows teachers to more readily accept the change innovation of the CSCOPE
curriculum.
The Concerns-Based Adoption Model and Stages of Concern
In 1974 a team from the Research and Development Center for Teacher Education
proposed the Concerns-Based Adoption Model (CBAM). The theoretical underpinnings
of which are directly related to systems thinking, scientific management theory, and
organizational change initiatives, “[t]he CBAM begins with viewing the adopting
institution as a USER system composed of individuals each of whom has his own
concerns, problems, skills, agendas, and needs” (Hall, Loucks, Rutherford, Newlove,
1975, p. 65).
Although the model contains three distinct diagnostic tools, the overarching
purpose of CBAM is to measure and inform the organizational leadership of the degree to
which an innovation has been accepted and implemented. First, CBAM measures the
attitudinal response of the individuals involved in the organizational change. Second,
CBAM measures the corresponding level of implementation concerning the innovation.
Third, CBAM informs the leadership within the organization of the needed configuration
of the innovation (Hall, Hord, Aguilera, Zepeda, and Frank, 2011).
Stages of Concern (SoC) are associated with the initial, individual response to the
organizational innovations. "Recently van den Berg and Ros (1999) conceptualized
concern as `the questions, uncertainties, and possible resistance that teachers may have in
response to new situations and/or changing demands'" (Cheung, 2002, p. 306). Each
Texas Tech University, Bynum Blake Hightower, May 2012
34
person will have a unique perspective relative to the innovation however; response to
change is predictable and can be viewed as a process:
There is an array of feelings, perceptions, worries, preoccupations, and moments
of satisfaction for those engaged with implementing new approaches. This
personal side of change is important to understand because failing to address
concerns can lead to resistance and even rejection of the new way. (Hall, Hord,
Aguilera, Zepeda, and Frank, 2011, p. 1)
Pigge and Marso (1990) found that the pattern of teacher concern was systemic
and predictable, "[i]n related cross-sectional studies, teaching task concerns have been
found to increase, self concerns have been found to decrease, and impact concerns have
been found to remain high" (Pigge and Marso, 1990, p. 287). The SoC model for
measuring teacher concern is consistent with the theoretical framework of both, systems
thinking as it relates to scientific management theory and organizational change as it
relates to school reform innovations.
Within the SoC there are seven progressive stages into which individuals affected
by the innovation may fall: Awareness, Informational, Personal, Management,
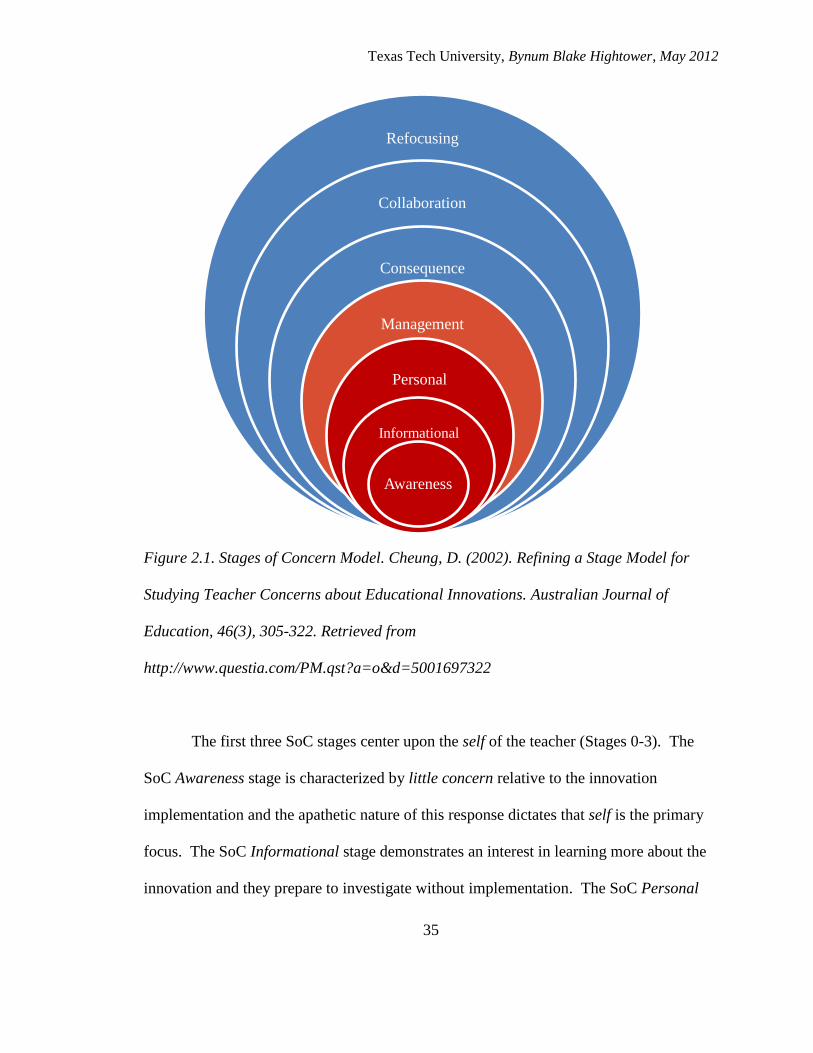
Consequence, Collaboration, and Refocusing. Figure 2.1 below, illustrates the Stages of
Concern using concentric circles, which illuminates the egocentric nature of the response
at the outset and the gradual broadening of perspective of those affected by the
innovation. Cheung (2002) stated that, “The seven SoC can be categorized into three
groups: self-concerns (Stages 1-3); task concerns about the innovation (Stage 4); and
impact concerns regarding students (Stages 5-7)" (p. 1).
Texas Tech University, Bynum Blake Hightower, May 2012
35
Figure 2.1. Stages of Concern Model. Cheung, D. (2002). Refining a Stage Model for
Studying Teacher Concerns about Educational Innovations. Australian Journal of
Education, 46(3), 305-322. Retrieved from
http://www.questia.com/PM.qst?a=o&d=5001697322
The first three SoC stages center upon the self of the teacher (Stages 0-3). The
SoC Awareness stage is characterized by little concern relative to the innovation
implementation and the apathetic nature of this response dictates that self is the primary
focus. The SoC Informational stage demonstrates an interest in learning more about the
innovation and they prepare to investigate without implementation. The SoC Personal
Refocusing
Collaboration
Consequence
Management
Personal
Informational
Awareness
Texas Tech University, Bynum Blake Hightower, May 2012
36
stage exhibits the egocentric mindset as the teacher queries how the innovation will
benefit them personally.
The fourth stage of the SoC is Management as the teacher begins to use the
innovation, but struggles to grasp how to manage the resources and tasks associated with
the innovation. Although, this stage is of great importance to the individual teacher, it is
obvious that the individual has moved to a less egocentric position relative to the
innovation and they are engaging in implementation. It is important to note that each of
the stages will require that the change facilitator respond to the individual based upon
their stage of concern.
The final three Stages of Concern are centered around effective implementation of
the innovation. Stage five of the SoC is Consequence the concern of the teacher is based
upon how the innovation is impacting students. The sixth stage of the SoC is
Collaboration and it centers upon the concern of peer teachers and how they are
implementing the innovation. The seventh stage of the SoC is Refocusing and at this
point the teacher is concerned about how to use the innovation for increased student
benefit (Cheung, 2002).
Issues Surrounding Implementation Curricular Innovations
K-12 educational leaders continue to struggle in their attempts to reform
instruction on campuses across the United States. The dynamics affecting their struggles
are as numerous, varied, and as unique as the number of contexts in which these
administrators find themselves. The biggest issue for most administrators is the problem
Texas Tech University, Bynum Blake Hightower, May 2012
37
of successfully implementing top-down mandates and curricular innovation handed down
by the hierarchies within the state and federal government. Current research clearly
demonstrates that top-down mandates negatively affect teacher morale and in fact may
ultimately lower student achievement due to the disenfranchisement of teachers,
"[c]oercion breeds hostility and defiance. If the coercer is strong enough, we will give as
much compliance as necessary to avoid harm, but we will not commit ourselves to the
goal of the coercion" (Kelly, 1999, p. 543). Teachers across our nation grudgingly turn in
paperwork in mock compliance with state mandates; however, administrators continue to
struggle with authentic implementation of programs and policies.
The simple repetition of reform initiatives, Elementary and Secondary Education
Act, 1965; A Nation at Risk,1983; No Child Left Behind, 2002, intended to close the
achievement gap demonstrates that change initiatives have not met their intention. By
studying Figure 2.1 one may conclude that in the majority of school districts, district
administrators implement change innovations with intent of fidelity, but district and
campus leaders have the smallest sphere of influence related to the outcome. The
literature is clear concerning the successful facilitation of innovations in schools. The
principal must cultivate relationships and construct a shared vision for what is possible.
Will the teachers respond to the change innovation in such a way as to impact student
performance? At the highest levels of authority, legislators and district level
administrator must carefully weigh the effectiveness of top-down mandates.
Texas Tech University, Bynum Blake Hightower, May 2012
38
Theoretical Explanation
System Thinking dictates a theoretical and literal interdependence related to the
interaction of leadership and the subordinate structures that exist within the school
district. The innovation of curriculum is profoundly influenced by levels of
implementation at the principal-level and teacher- level of the school organization. The
application of Systems Theory and organizational change principles to schools has been
explored with increasing frequency in the literature in recent years, and what we know
about essential elements in effective change efforts has grown as well (Fullan, 2001;
Senge, 1990). The illustration below (Figure 2.2) demonstrates a simplified perspective
the interdependence of the organizational system and subsystems associated with
curriculum interventions such as CSCOPE . The size of the cogs is proportional with the
direct influence upon students, which predicates the success or failure of reform
implementation. However, it should be noted that the traditional power structure within
the organization is inversely proportional to the size of each cog. District administrators
wield the most power, the principal is under their authority and the teachers in turn are
subject to principal authority under the traditional model of a district hierarchy. The
hegemonic structure then suggests that the most power relative to decision-making
resides within the smallest cog.
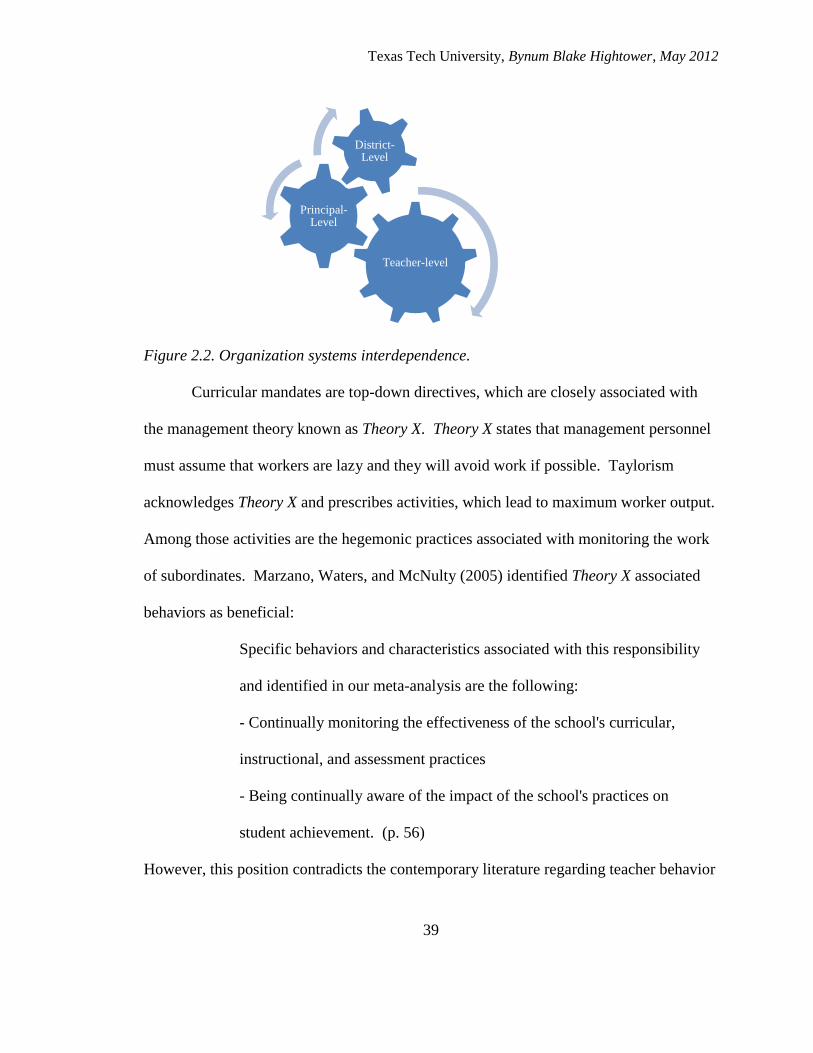
Texas Tech University, Bynum Blake Hightower, May 2012
39
Figure 2.2. Organization systems interdependence.
Curricular mandates are top-down directives, which are closely associated with
the management theory known as Theory X. Theory X states that management personnel
must assume that workers are lazy and they will avoid work if possible. Taylorism
acknowledges Theory X and prescribes activities, which lead to maximum worker output.
Among those activities are the hegemonic practices associated with monitoring the work
of subordinates. Marzano, Waters, and McNulty (2005) identified Theory X associated
behaviors as beneficial:
Specific behaviors and characteristics associated with this responsibility
and identified in our meta-analysis are the following:
- Continually monitoring the effectiveness of the school's curricular,
instructional, and assessment practices
- Being continually aware of the impact of the school's practices on
student achievement. (p. 56)
However, this position contradicts the contemporary literature regarding teacher behavior
Teacher-level
Principal- Level
District- Level
Texas Tech University, Bynum Blake Hightower, May 2012
40
associated with the implementation of change initiatives, “[i]n the panoply of rewards
and sanctions that attach to accountability systems, the most powerful incentives reside in
the face-to-face relationships among people in the organization, not in external systems”
(Marzano, Waters, and McNulty, 2005, p. 59). How teachers feel about impending
change must be a consideration. Sunbul (2003) found in his study on self-efficacy:
People's work-related satisfaction consists of achieving change and improvement,
and promoting their growth, which have important implications on teachers'
behaviors at work and affect their desire to continue their work and their
involvement in the job, and relationship with other staff. (p. 1)
There are moral and ethical implications to consider on the part of campus leaders
when the hierarchy demands adhesion to programs. Yet, in the face of all the detractors
that indicate reform would be impossible, some administrators have been successfully
initiating change. The decision-making of these administrators somehow elicits a
positive response to the implementation of programs and innovations. The decision-
making practice of successful administrators with regard to implementation of the
standardized mandates incites compliance and authentic engagement on the part of their
instructional faculty. "A more moral and rational strategy for school improvement would
be to use a theory that fits human nature better in the first place" (Sergiovanni, 2001, p.
15). The emotion and passion associated with teaching survive in tandem with data-
driven rationality dictating a positive impact on teacher motivation, "mood has an
important influence on the degree of cognitive flexibility the leader is able to exercise
during problem solving" (Leithwood, Jantzi, and Steinbach, 1999, p. 107).
Texas Tech University, Bynum Blake Hightower, May 2012
41
Concerns Theory was first postulated in 1969 as Frances Fuller studied the concerns of
pre-service teachers concerning their preparation to enter the field of education. The
study discovered that student teachers appeared to be more concerned with themselves
during their first few weeks of student teaching as compared with the more concern for
students and pedagogy as they gained more experience. A second study confirmed the
results from the initial study. Fuller then conducted a meta-analysis of research focused
upon teacher concerns spanning three decades. The result was a concerns theory that
demonstrated three distinct phases of concern: pre-teaching (primarily concerned with
self), early teaching (still self-oriented, but associated with management of task), and late
teaching (concern with students) (Pigge and Marso, 1990).
Resolution of the early concerns appeared to be a critical factor in teacher
education. Later, the research of Hall (1975) appended the phases of teacher concern
three basic abstractions: concerns focused on self, concerns focused on task, and concerns
focused upon impact. Subsequent studies confirmed the concern phenomenon and
substantiated the existence of a predictable pattern. "The findings derived from the
concerns scales are consistent with Fuller's stages of concerns teacher development
model established by Fuller" (Pigge and Marso, 1990, p. 287).
In subsequent studies, the stages of concern were documented in teachers during
times of organizational change, or when innovations were undertaken. It was found that
the concerns-based theory could be used to measure emotional response to innovation
and change within organizational settings:
The Concern Based Adoption Model (CBAM) is based on concern-based theory.
CBAM is based on the theory that change is a developmental progression of
events, many of which may be predictable (Merz, 1996). According to Hord,
Rutherford, Huling-Austin, and Hall (1987), "A central and major premise of
Texas Tech University, Bynum Blake Hightower, May 2012
42
CBAM is that the single most important factor in any change process is the people
who will be most affected by the change (the user system). (Srivastava, 2007, p.
1)
Campus leaders at public schools must be mindful of the moral quandary that is
always present when making a decision “whenever there is an unequal distribution of
power between two people, the relationship becomes a moral one" (Sergiovanni, 2001, p.
36). When new initiatives (innovations) or programs are implemented on a campus, they
are often accompanied by strict guidelines for implementation. Knowledgeable leaders
employ a variety of decision-making strategies to ensure success. Successful leaders
might consider manipulation of subordinates by convincing a faculty that compliance will
be good for students while others resort to directives and coercion. Coercive practices
yield few results when new strategies are compulsory, "[t]he power of calculated
involvement pales when compared with the power of moral involvement" (Sergiovanni,
2001, p. 9). As campus administrators face the challenge of improving our schools, they
must make decisions rife with moral ramifications. Most consider the “ends”
justification for the “means” however; the process employed by school leaders must
ultimately be based upon the tenets of ethical leadership. Community theory as explained
by Sergiovanni (2001) is a practical and expedient method upon which campus leaders
may build change initiatives.
Chapter Summary
This review of literature first explores the dynamics of organizational change and
Scientific Management Theory as it relates to Systems Theory. The idea of evolving
Texas Tech University, Bynum Blake Hightower, May 2012
43
organization into change-centric entities rather than static, tradition-based entities is the
focus lens for the literature surrounding innovation.
The literature review then focuses upon legislation, school reform initiatives, and
the repetition of both are cited as evidence that the initiatives have not produced the
desired changes in student achievement, "[t]he number of schools engaged in school
reform for improving student outcomes continues to grow. However, few schools seem
able to sustain efforts long enough to produce lasting change (Fullan, 2003)" (Stollar,
Poth, Curtis, and Cohen, 2006, p. 1).
Research also reveals that recently achievement gaps continue to exist among
sub-populations. In spite of repeated attempts to mandate change at the state and federal
levels, meaningful educational innovations have eluded the most well intentioned
legislation.
CSCOPE is the most recent innovation in Texas’ public schools. CSCOPE’s
research base associated with this innovation is explored in depth, “[t]he concept of
cognition as a phenomenon that extends beyond the individual, that arises in shared
activity, owes a clear debt to the original Vygotskian understanding that the interpersonal
precedes the intrapersonal” (Daniels, 2001, p. 1). Definitions within the CSCOPE
curriculum are explained and defined. The process of selling CSCOPE is illuminated and
the elements contained within the program are elaborated upon.
The Concerns-Based Adoption Model is discussed and the Stages of Concern
measurement instrument is documented and explored as a valid means to assess the
attitudinal response of teachers to change and innovation. The link to systems theory and
Texas Tech University, Bynum Blake Hightower, May 2012
44
management theory is apparent from the literature. The elements of the Stages of
Concern are discussed in detail and varying studies are cited as evidence of the
instrument’s validity and reliability.
The theoretical frameworks implicitly linked to this study are also addressed
within the review of literature. Systems Theory acknowledges the interdependence of
systems and subsystems relative to innovation implementation. Scientific Management
Theory is also explored to include Theory X and Theory Y behaviors associated with
effective innovation implementation by leadership personnel. Concerns Theory is also
explored as it relates to systemic change processes and its reliability and validity is
substantiated. The amalgamation of theoretical knowledge is necessary to advance the
practice of school administrators as innovation is a constant for school organizations.
Finally, the issues surrounding implementation of innovations are discussed. The
role of innovation facilitator falls upon the campus principal and once again, systems
theory emerges as the theoretical connection between the innovation facilitator and the
classroom teacher. Scientific management theory (Taylorism) is once again addressed as
a critical piece in the change facilitator’s role, however it conflicts a multitude of
research, which cites relationship cultivation as a chief predictor of innovation success.
Texas Tech University, Bynum Blake Hightower, May 2012
45
Chapter III
Methodology
Introduction
CSCOPE is a recent curricular innovation, which is being used in 810 of Texas’
1265 school districts. The innovation is multi-faceted in that a district may require the
implementation of this innovation to varying levels. This curriculum innovation is
unique when implemented to the level of exemplar lessons because this element of the
curriculum dictates how a teacher will deliver instruction to students. It is vital that
school administrators understand the reaction of teachers to the CSCOPE innovation.
Hall et al. (2011) found, "How leaders address the potential arousal of impact concerns
can make all the difference in ultimate implementation success and effectiveness" (p. 1).
The research base for this study covers a timeline, which encompasses nearly 100
years and surrounds the impetus for curricular and instructional change in American
schools. Beginning with John Dewey’s seminal work, Democracy and Education (1916),
the need for curricular and instructional change is explored as it progresses through
legislative initiatives to include the Elementary and Secondary Education Act (1965); A
Nation at Risk (1983); and the No Child Left Behind Act (2001). Also explored in the
literature are the specific challenges of providing quality instructional models for low
SES students and students with high mobility rates. This is critical information as it
illuminates the rationale for the advent of CSCOPE. Additionally, the validity and
reliability of the survey instrument chosen for this study, The Stages of Concern
Texas Tech University, Bynum Blake Hightower, May 2012
46
Questionnaire is substantiated through the review of scholarly writing which cites its use
as a valid and reliable instrument for study throughout the last 35 years (George, Hall,
Stiegelbauer, 2008).
This relational study is designed as a multiple linear regression analysis. Field
stated, “[m]ultiple regression is a logical extension of simple linear regression when there
are several predictors” (p. 210). Because this study proposes the use of six predictor
variables it is logical to use a multiple regression model to establish a linear relationship.
This chapter will provide a detailed description of the research methodology,
which was chosen to answer the proposed research question. First, the participants,
research question, and the predictors are enumerated. Next, the quantitative research
design is explained. Finally, a synopsis of the inference process is presented.
Population and Sample
The population being studied consists of the teachers who are currently using the
CSCOPE curriculum in 810 (65%) of the 1,265 school districts within the state of Texas.
The population selected for this study work in a variety of content areas and implements
the elements of the curriculum to varying levels. CSCOPE is currently being
implemented in both urban and rural school districts across the state.
The sample for this study was purposefully selected from six elementary
campuses in west-Texas in either the first or the second year of CSCOPE
implementation. The sample represented both rural and urban schools that are
implementing the CSCOPE curriculum to varying elemental levels. The number of
Texas Tech University, Bynum Blake Hightower, May 2012
47
content area teachers on each of the sample campuses ranged from 30 to 45 teachers. The
selection of the sample population is based upon each campus meeting the following
conditions required for the study.
The first condition for a campus to participate in the study is that each campus
must be in either year one of implementation of the CSCOPE curriculum, or year two of
CSCOPE implementation. Three schools (Burnet, Sudderth, and Travis) met the
condition of Year One of Implementation, and three schools met the condition of Year
Two of Implementation (Greenwood, Kermit, and Tatom). The second condition is the
establishment of the non-negotiable standard for exemplar lessons (EL’s). Three of the
campuses will require adherence to EL’s and the remaining three campuses will be
implementing CSCOPE, but without the non-negotiable standard for implementation of
EL’s. The three schools meeting the condition of Mandated EL’s were Tatom, Travis
and Kermit elementary schools. The three schools meeting the condition of non-
mandated EL were Burnet, Greenwood, and Sudderth elementary schools. The schools
meeting the predictor variable associated with state campus academic rating of
Academically Unacceptable were Kermit Elementary and Greenwood Elementary. The
predictor variable associated with federal accountability AYP was not a consideration in
the selection of participants. The remaining conditions associated with the predictor
variable criteria being studied are enumerated in the research question and no effort was
made to ensure equal frequency distributions of Years of Service, or Content Area
Math/Other (See Appendix E).
Texas Tech University, Bynum Blake Hightower, May 2012
48
Instrumentation
This survey instrument is called the Stages of Concern Questionnaire (SoCQ), and
was developed by the Texas Research and Development Center for Teacher Education,
University of Texas at Austin. The questionnaire will be used to determine if teachers
demonstrate a stage of concern, which falls into one of three progressive measures. The
first stage is awareness and simply indicates if a teacher is aware of the innovation being
studied. The second two stages, informational, and personal, describe actual levels of
concern relative to the innovation and are considered egocentric levels associated with
the SoCQ model. These two stages predict levels of resistance to the innovation
implementation. The fourth stage, which is Stage 3 of the SocQ instrument describes the
level to which the teacher is concerned with management of the innovation. This is a
critical measure where a low score can indicate a progression away from the egocentric
level of concern toward greater acceptance of the innovation. Higher scores in Stages 4-6
indicate progressively less personal resistance to the innovation as the teacher becomes
more concerned about the effect of the innovation on students.
The instrument consists of 35 statements, which are answered on a 7-point Likert
scale. Answering 0 indicates the statement is irrelevant while answering with a 7
indicates the statement is very true of me now. The questionnaire yields a quantitative
measure based upon a progression of the 7 Stages of Concern, which reflects a
progression of teacher disposition and attitude toward acceptance and implementation of
the innovation. Each of the 7 stages falls into a broad category of description which can
be seen in Figure 3.1.
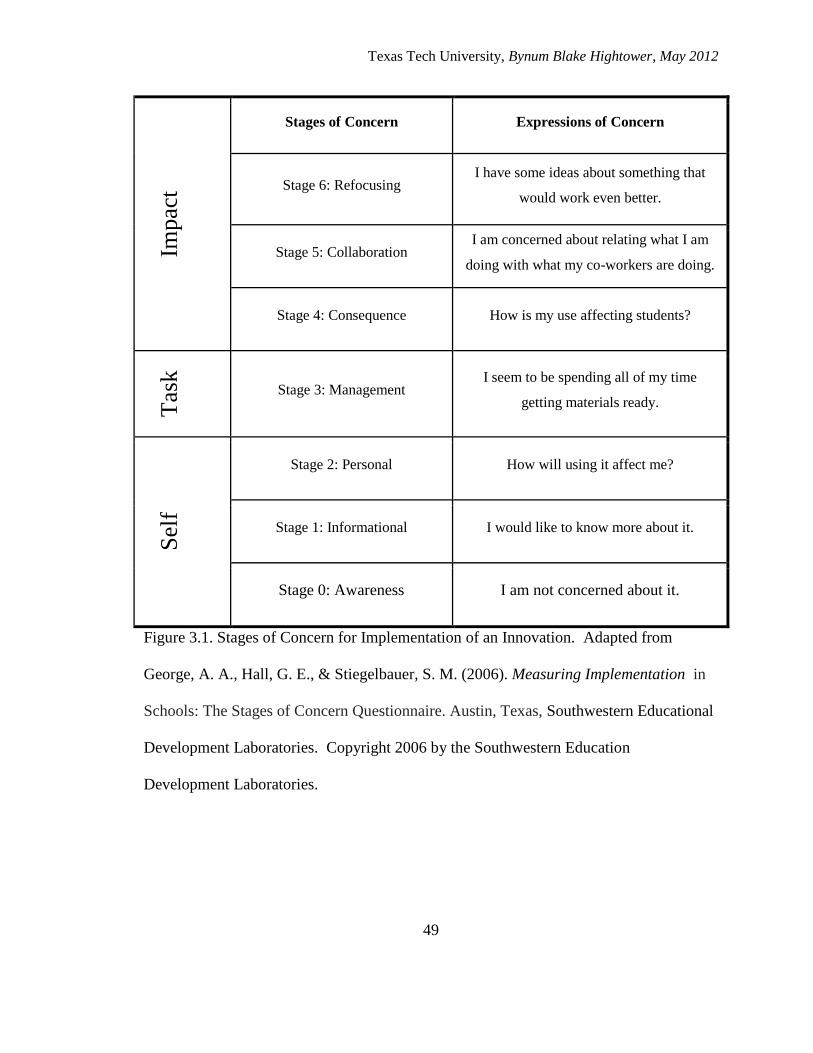
Texas Tech University, Bynum Blake Hightower, May 2012
49
Impac
t
Stages of Concern Expressions of Concern
Stage 6: Refocusing I have some ideas about something that
would work even better.
Stage 5: Collaboration I am concerned about relating what I am
doing with what my co-workers are doing.
Stage 4: Consequence How is my use affecting students?
Tas
k
Stage 3: Management I seem to be spending all of my time
getting materials ready.
Sel
f
Stage 2: Personal How will using it affect me?
Stage 1: Informational I would like to know more about it.
Stage 0: Awareness I am not concerned about it.
Figure 3.1. Stages of Concern for Implementation of an Innovation. Adapted from
George, A. A., Hall, G. E., & Stiegelbauer, S. M. (2006). Measuring Implementation in
Schools: The Stages of Concern Questionnaire. Austin, Texas, Southwestern Educational
Development Laboratories. Copyright 2006 by the Southwestern Education
Development Laboratories.
Texas Tech University, Bynum Blake Hightower, May 2012
50
Validity and reliability of the data-gathering instrument are well established via
the documentation found in the review of literature. Upon completion of the survey each
respondents’ answers are made available for the respondent to review. Also, the Primary
Investigator (Dr. Clint Carpenter) and the Co-Primary Investigator (Blake Hightower)
piloted the online survey in order to ensure that questions were formatted correctly.
Research Design
The research design of this study incorporated the use of a data gathering tool
know as the Stages of Concern Questionnaire (SoCQ). The SoCQ may be found at the
Southeastern Education Developmental Laboratories (SEDL) website. Data was
collected electronically via the SoCQ from six different elementary schools in West-
Texas. The raw data was collected with the online SoCQ instrument, which was
purchased from the SEDL. The data was analyzed using a multiple linear-regression
analysis in order to determine if a linear relationship exists between the predictors (quasi-
independent variables) and the outcome (dependent variable) as demonstrated by each
stage score (0-6) on the SoCQ. The 35 items that make up the SoCQ are shown in Figure
3.2.
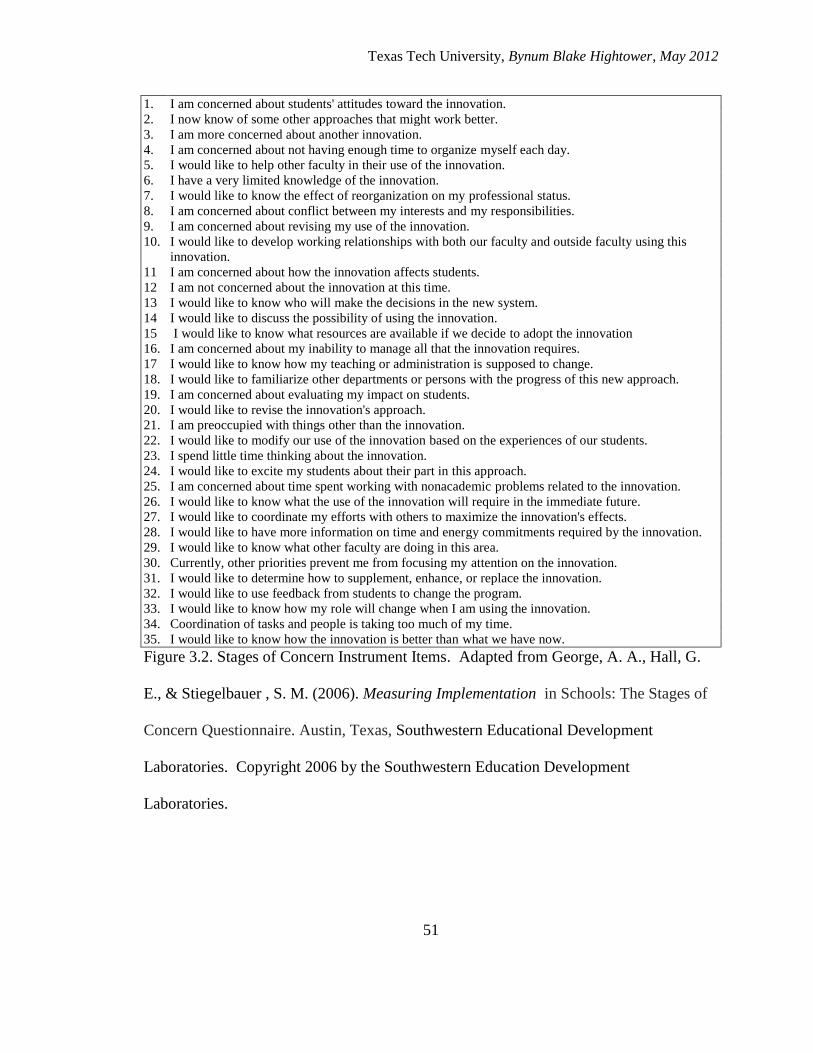
Texas Tech University, Bynum Blake Hightower, May 2012
51
1. I am concerned about students' attitudes toward the innovation.
2. I now know of some other approaches that might work better.
3. I am more concerned about another innovation.
4. I am concerned about not having enough time to organize myself each day.
5. I would like to help other faculty in their use of the innovation.
6. I have a very limited knowledge of the innovation.
7. I would like to know the effect of reorganization on my professional status.
8. I am concerned about conflict between my interests and my responsibilities.
9. I am concerned about revising my use of the innovation.
10. I would like to develop working relationships with both our faculty and outside faculty using this
innovation.
11 I am concerned about how the innovation affects students.
12 I am not concerned about the innovation at this time.
13 I would like to know who will make the decisions in the new system.
14 I would like to discuss the possibility of using the innovation.
15 I would like to know what resources are available if we decide to adopt the innovation
16. I am concerned about my inability to manage all that the innovation requires.
17 I would like to know how my teaching or administration is supposed to change.
18. I would like to familiarize other departments or persons with the progress of this new approach.
19. I am concerned about evaluating my impact on students.
20. I would like to revise the innovation's approach.
21. I am preoccupied with things other than the innovation.
22. I would like to modify our use of the innovation based on the experiences of our students.
23. I spend little time thinking about the innovation.
24. I would like to excite my students about their part in this approach.
25. I am concerned about time spent working with nonacademic problems related to the innovation.
26. I would like to know what the use of the innovation will require in the immediate future.
27. I would like to coordinate my efforts with others to maximize the innovation's effects.
28. I would like to have more information on time and energy commitments required by the innovation.
29. I would like to know what other faculty are doing in this area.
30. Currently, other priorities prevent me from focusing my attention on the innovation.
31. I would like to determine how to supplement, enhance, or replace the innovation.
32. I would like to use feedback from students to change the program.
33. I would like to know how my role will change when I am using the innovation.
34. Coordination of tasks and people is taking too much of my time.
35. I would like to know how the innovation is better than what we have now.
Figure 3.2. Stages of Concern Instrument Items. Adapted from George, A. A., Hall, G.
E., & Stiegelbauer , S. M. (2006). Measuring Implementation in Schools: The Stages of
Concern Questionnaire. Austin, Texas, Southwestern Educational Development
Laboratories. Copyright 2006 by the Southwestern Education Development
Laboratories.
Texas Tech University, Bynum Blake Hightower, May 2012
52
This study will analyze predictors and outcomes to determine if teachers differ
from one another via the SoCQ as it relates to the year of CSCOPE implementation (first
or second). The second predictor to be studied is the level of implementation, which is a
yes/no question. Do teachers on campuses requiring exemplar lessons demonstrate lower
levels of resistance to the CSCOPE curriculum? The third predictor investigates the
linear relationship between years of experience and resistance to the CSCOPE
curriculum. The fourth predictor is the campus’ score on the Academic Excellence
Indicator System (AEIS). Is there a linear relationship between campus rating of
academically unacceptable and teacher levels of resistance to the CSCOPE curriculum?
The fifth predictor is the campus’ Adequate Yearly Progress (AYP) rating. Is there a
linear relationship between missing AYP and teacher levels of resistance to the CSCOPE
curriculum? The sixth predictor being investigated is also a yes/no question relative to
the content area of mathematics. Is there a linear relationship between teacher levels of
resistance and teachers implementing the CSCOPE Mathematics curriculum?
Objectives
This work was guided by the following objectives:
1) Describe the year of implementation, required exemplar lessons, years of
experience teaching, AEIS rating, AYP rating, and content area (math or
other) of elementary school teachers in Texas who are using the CSCOPE
curriculum.
Texas Tech University, Bynum Blake Hightower, May 2012
53
2) Describe the Stages of Concern regarding the use of CSCOPE curriculum of
elementary public school teachers in Texas.
3) Predict the Stage of Concern regarding CSCOPE of elementary school
teachers in Texas based on year of implementation (first, or second), required
exemplar lessons (Yes or No), years of experience teaching, AEIS rating of
academically unacceptable, AYP rating of missed AYP, and content area
(math, or other content area)
Research Question
RQ1: Can researchers predict the Stages of Concern outcome (level 0-6) for teachers
using the CSCOPE curriculum based on the following predictors?
- Year of implementation (first, or second)
- Required Exemplar Lessons (Yes or No)
- Years of experience teaching
- AEIS Rating of Academically Unacceptable
- AYP Rating of Missed AYP
- Content Area (Math, or other content area)
Hypotheses
The null hypothesis for this study states that there will be no linear relationship
between the predictor variables and the dependent variable (outcome) for each stage of
concern within the SOCQ based upon the CSCOPE curricular innovation. The multiple
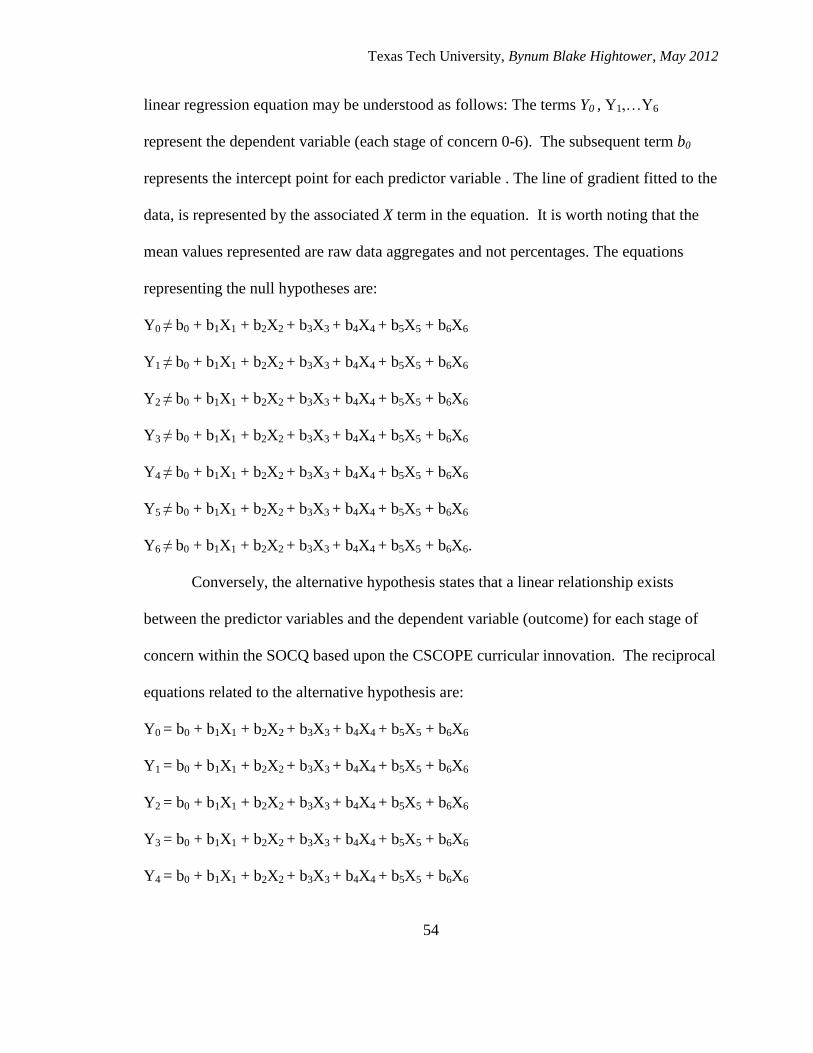
Texas Tech University, Bynum Blake Hightower, May 2012
54
linear regression equation may be understood as follows: The terms Y0 , Y1,…Y6
represent the dependent variable (each stage of concern 0-6). The subsequent term b0
represents the intercept point for each predictor variable . The line of gradient fitted to the
data, is represented by the associated X term in the equation. It is worth noting that the
mean values represented are raw data aggregates and not percentages. The equations
representing the null hypotheses are:
Y0 ≠ b0 + b1X1 + b2X2 + b3X3 + b4X4 + b5X5 + b6X6
Y1 ≠ b0 + b1X1 + b2X2 + b3X3 + b4X4 + b5X5 + b6X6
Y2 ≠ b0 + b1X1 + b2X2 + b3X3 + b4X4 + b5X5 + b6X6
Y3 ≠ b0 + b1X1 + b2X2 + b3X3 + b4X4 + b5X5 + b6X6
Y4 ≠ b0 + b1X1 + b2X2 + b3X3 + b4X4 + b5X5 + b6X6
Y5 ≠ b0 + b1X1 + b2X2 + b3X3 + b4X4 + b5X5 + b6X6
Y6 ≠ b0 + b1X1 + b2X2 + b3X3 + b4X4 + b5X5 + b6X6.
Conversely, the alternative hypothesis states that a linear relationship exists
between the predictor variables and the dependent variable (outcome) for each stage of
concern within the SOCQ based upon the CSCOPE curricular innovation. The reciprocal
equations related to the alternative hypothesis are:
Y0 = b0 + b1X1 + b2X2 + b3X3 + b4X4 + b5X5 + b6X6
Y1 = b0 + b1X1 + b2X2 + b3X3 + b4X4 + b5X5 + b6X6
Y2 = b0 + b1X1 + b2X2 + b3X3 + b4X4 + b5X5 + b6X6
Y3 = b0 + b1X1 + b2X2 + b3X3 + b4X4 + b5X5 + b6X6
Y4 = b0 + b1X1 + b2X2 + b3X3 + b4X4 + b5X5 + b6X6
Texas Tech University, Bynum Blake Hightower, May 2012
55
Y5 = b0 + b1X1 + b2X2 + b3X3 + b4X4 + b5X5 + b6X6
Y6 = b0 + b1X1 + b2X2 + b3X3 + b4X4 + b5X5 + b6X6.
Data Collection
Data was obtained through an online data collection instrument purchased from
SEDL that is available at the following website:
https://www.sedl.org/concerns/index.cgi?sc=qc5wz2
Data collection took place over a 14-day period of time, from March 22, 2012 to
April 4, 2012. Principals from participating campuses forwarded the SoCQ survey link
contained in the Superintendent and Principal Recruitment Letter (See Appendix B) to
their faculty members along with the survey instructions and the Participant Information
Letter (see Appendix C). On March 28, 2012, reminder emails were sent to building
principals concerning the survey closing date. One elementary campus did not respond
and the researcher spoke with the principal by phone. The principal explained that he had
forgotten to send the survey out and stated that he would send the survey link to teachers
immediately. Subsequent to the phone call, 17 surveys were submitted on April 4, 2012.
Data Analysis
Data was downloaded as a tab-delineated file into SPSS Version 19 for Windows.
The data was inspected for, and cleaned of, outliers and invalid responses. Descriptive
measures were completed. The data was checked for adherence to the assumptions for
Texas Tech University, Bynum Blake Hightower, May 2012
56
correlational/regression research, and upon finding satisfactory results, the
correlational/regression measures were completed.
The descriptive statistics were assimilated into tables and figures in Chapter 4.
The data was inspected and determination of statistical significance in relation to the
established alpha level (α = 0.05) was made for each of the Stages of Concern within the
model. Statistical significance was first determined for each predictor variable
independently to determine linearity/predictability relative to the SoCQ. Next, the
predictor variables were analyzed in combination with one another to determine if some
of the variables produced greater significance/higher predictability relative to the SoCQ
together. Finally, in Chapter 5, inferences were made by matching the group data to the
model suggested by George, Hall, and Stieglebauer (2006) who are the authors of the
Stages of Concern instrument.
Texas Tech University, Bynum Blake Hightower, May 2012
57
Chapter IV
Results
Descriptive statistics for predictor variables. Objective 1 was to describe the
year of implementation, required exemplar lessons, years of experience teaching, AEIS
rating, AYP rating, and content area (math or other) of elementary public school teachers
in Texas who are using the CSCOPE curriculum.
As shown in Table 4.1, the total number of respondents was 168. On average,
teachers in the sample had 12.0 years of teaching experience, with a median of 11.0, and
a standard deviation of 8.03 years.
The individual campus sample sizes ranged from 17 to 42 faculty responses with
most campuses being close to 30. Median and mean scores were generally close to one
another with Travis demonstrating the greatest difference (2.3) between the median and
the mean. The campus with the most tenured faculty was Greenwood with an average
mean of 16.0 years of experience, and a median of 16.0. The campus demonstrating the
lowest years of experience per teacher was Kermit, with a mean of 10.0 years and a
median of 12.0.
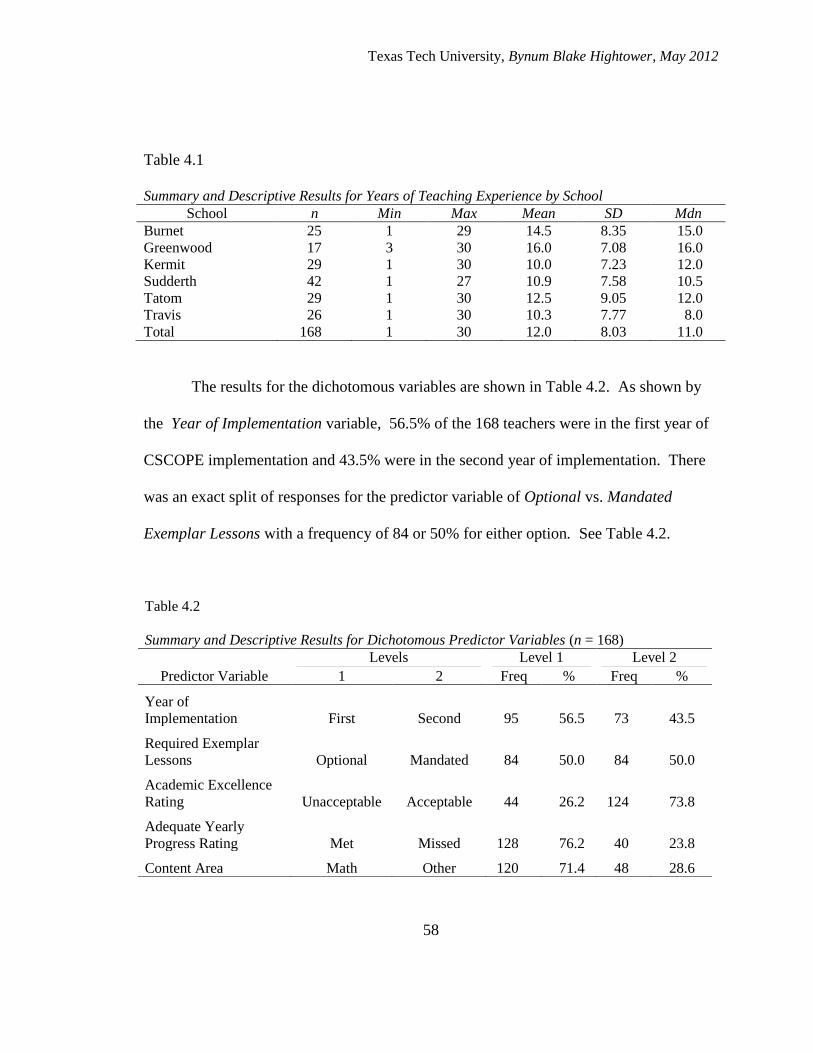
Texas Tech University, Bynum Blake Hightower, May 2012
58
Table 4.1
Summary and Descriptive Results for Years of Teaching Experience by School
School n Min Max Mean SD Mdn
Burnet 25 1 29 14.5 8.35 15.0
Greenwood 17 3 30 16.0 7.08 16.0
Kermit 29 1 30 10.0 7.23 12.0
Sudderth 42 1 27 10.9 7.58 10.5
Tatom 29 1 30 12.5 9.05 12.0
Travis 26 1 30 10.3 7.77 8.0
Total 168 1 30 12.0 8.03 11.0
The results for the dichotomous variables are shown in Table 4.2. As shown by
the Year of Implementation variable, 56.5% of the 168 teachers were in the first year of
CSCOPE implementation and 43.5% were in the second year of implementation. There
was an exact split of responses for the predictor variable of Optional vs. Mandated
Exemplar Lessons with a frequency of 84 or 50% for either option. See Table 4.2.
Table 4.2
Summary and Descriptive Results for Dichotomous Predictor Variables (n = 168)
Levels Level 1 Level 2
Predictor Variable 1 2 Freq % Freq %
Year of
Implementation First Second 95 56.5 73 43.5
Required Exemplar
Lessons Optional Mandated 84 50.0 84 50.0
Academic Excellence
Rating Unacceptable Acceptable 44 26.2 124 73.8
Adequate Yearly
Progress Rating Met Missed 128 76.2 40 23.8
Content Area Math Other 120 71.4 48 28.6
Texas Tech University, Bynum Blake Hightower, May 2012
59
Descriptive statistics for outcome variables. Objective 2 was to describe the
Stages of Concern regarding the use of CSCOPE curriculum of elementary public school
teachers teaching core curriculum in Texas.
Table 4.3, Table 4.4, and Figure 4.1 describe the results of the SoCQ for the
sample population as an aggregate mean and by campus displayed by raw mean scores.
Stage 0 (Unconcerned) had an overall mean of 44.1 with the lowest campus (Burnet)
scoring 34.5 and the highest campus (Travis) scoring 51.3. Stage 1 (Informational) had a
mean of 59.2 with the low campus (Kermit) scoring 41.0 and the high campus (Burnet)
scoring 75.1. The Stage 2 (Personal) mean was 62.4 with a low campus (Tatom) score of
46.6 and a high campus (Burnet) score of 92.9. The mean for Stage 3 (Management) was
62.7. It was the highest total mean score for any of the Stages of Concern. The highest
campus score for Stage 3 (Management) was 98.1 (Burnet) and the lowest campus score
was 46.6 (Tatom). Stage 4 (Consequence) had a mean of 36.1. The highest campus
mean for Stage 4 was 49.8 (Burnet) and the lowest campus mean was 23.6 (Kermit). The
Stage 5 (Collaboration) mean was 37.9 with the highest campus mean 54.4 (Tatom) and
the lowest campus mean being 24 (Burnet). Stage 6 (Refocusing) had a mean of 57.9.
The highest campus mean was 78 (Burnet) and the lowest campus mean was 38.9
(Kermit).
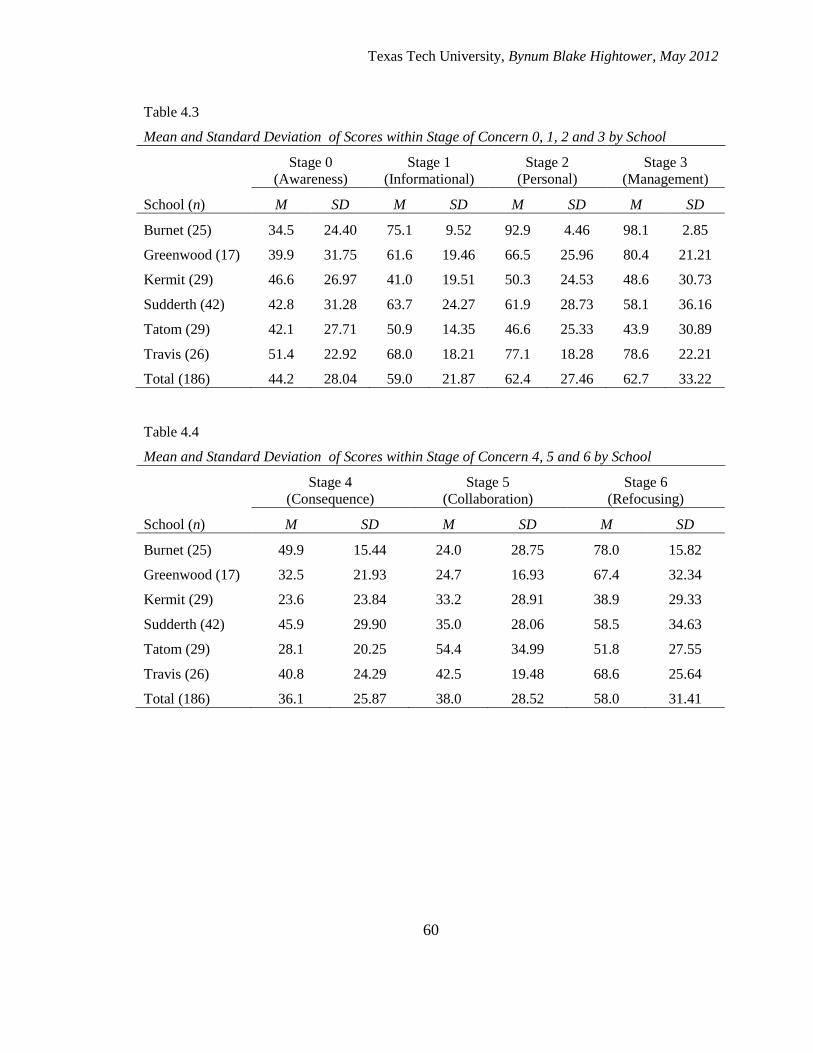
Texas Tech University, Bynum Blake Hightower, May 2012
60
Table 4.3
Mean and Standard Deviation of Scores within Stage of Concern 0, 1, 2 and 3 by School
Stage 0
(Awareness)
Stage 1
(Informational)
Stage 2
(Personal)
Stage 3
(Management)
School (n) M SD M SD M SD M SD
Burnet (25) 34.5 24.40 75.1 9.52 92.9 4.46 98.1 2.85
Greenwood (17) 39.9 31.75 61.6 19.46 66.5 25.96 80.4 21.21
Kermit (29) 46.6 26.97 41.0 19.51 50.3 24.53 48.6 30.73
Sudderth (42) 42.8 31.28 63.7 24.27 61.9 28.73 58.1 36.16
Tatom (29) 42.1 27.71 50.9 14.35 46.6 25.33 43.9 30.89
Travis (26) 51.4 22.92 68.0 18.21 77.1 18.28 78.6 22.21
Total (186) 44.2 28.04 59.0 21.87 62.4 27.46 62.7 33.22
Table 4.4
Mean and Standard Deviation of Scores within Stage of Concern 4, 5 and 6 by School
Stage 4
(Consequence)
Stage 5
(Collaboration)
Stage 6
(Refocusing)
School (n) M SD M SD M SD
Burnet (25) 49.9 15.44 24.0 28.75 78.0 15.82
Greenwood (17) 32.5 21.93 24.7 16.93 67.4 32.34
Kermit (29) 23.6 23.84 33.2 28.91 38.9 29.33
Sudderth (42) 45.9 29.90 35.0 28.06 58.5 34.63
Tatom (29) 28.1 20.25 54.4 34.99 51.8 27.55
Travis (26) 40.8 24.29 42.5 19.48 68.6 25.64
Total (186) 36.1 25.87 38.0 28.52 58.0 31.41
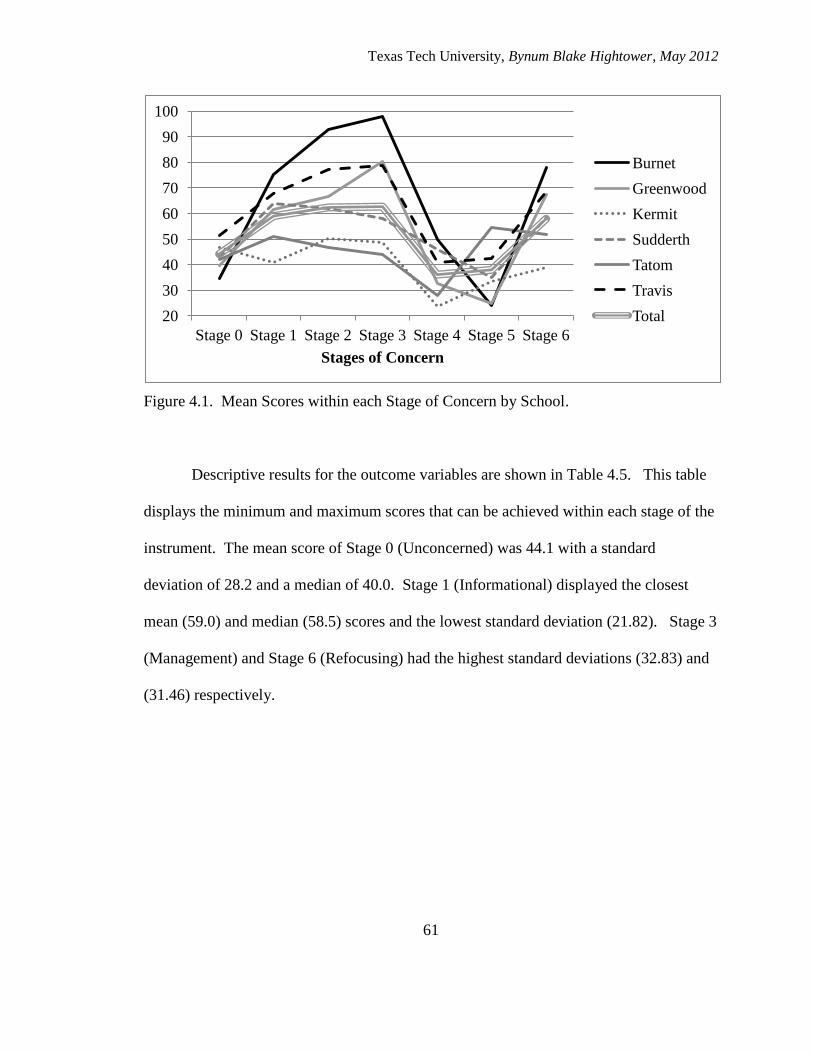
Texas Tech University, Bynum Blake Hightower, May 2012
61
Figure 4.1. Mean Scores within each Stage of Concern by School.
Descriptive results for the outcome variables are shown in Table 4.5. This table
displays the minimum and maximum scores that can be achieved within each stage of the
instrument. The mean score of Stage 0 (Unconcerned) was 44.1 with a standard
deviation of 28.2 and a median of 40.0. Stage 1 (Informational) displayed the closest
mean (59.0) and median (58.5) scores and the lowest standard deviation (21.82). Stage 3
(Management) and Stage 6 (Refocusing) had the highest standard deviations (32.83) and
(31.46) respectively.
20
30
40
50
60
70
80
90
100
Stage 0 Stage 1 Stage 2 Stage 3 Stage 4 Stage 5 Stage 6
Stages of Concern
Burnet
Greenwood
Kermit
Sudderth
Tatom
Travis
Total
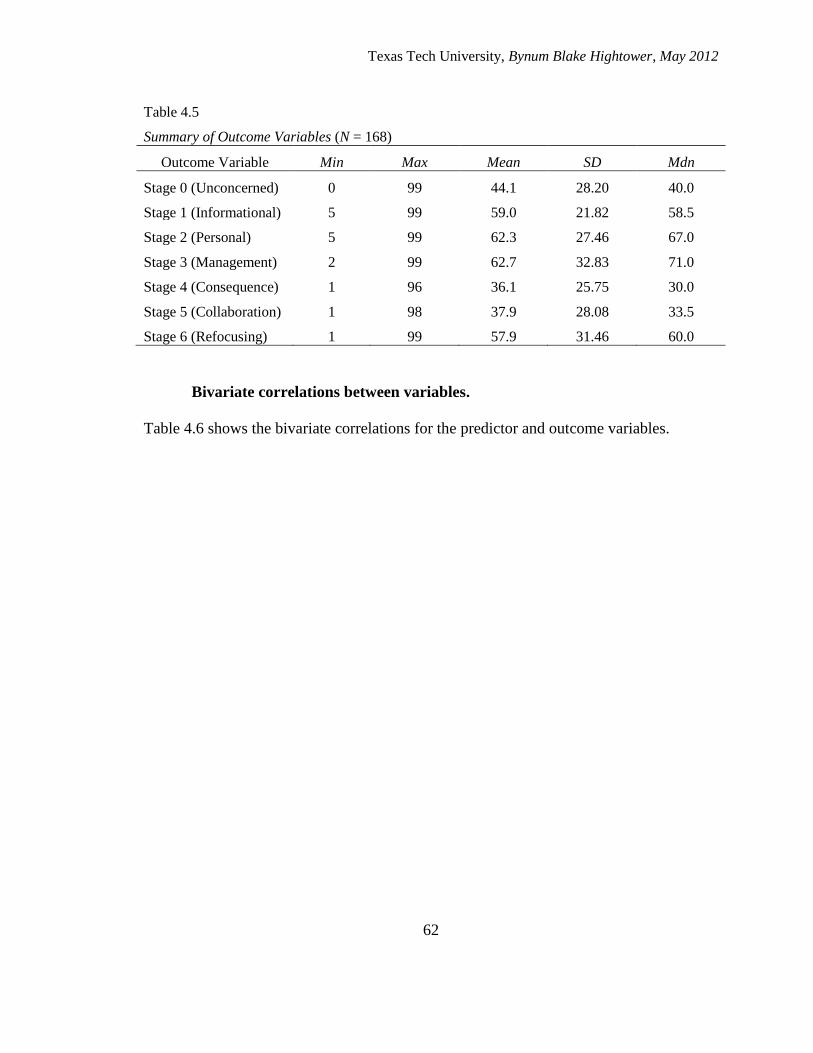
Texas Tech University, Bynum Blake Hightower, May 2012
62
Table 4.5
Summary of Outcome Variables (N = 168)
Outcome Variable Min Max Mean SD Mdn
Stage 0 (Unconcerned) 0 99 44.1 28.20 40.0
Stage 1 (Informational) 5 99 59.0 21.82 58.5
Stage 2 (Personal) 5 99 62.3 27.46 67.0
Stage 3 (Management) 2 99 62.7 32.83 71.0
Stage 4 (Consequence) 1 96 36.1 25.75 30.0
Stage 5 (Collaboration) 1 98 37.9 28.08 33.5
Stage 6 (Refocusing) 1 99 57.9 31.46 60.0
Bivariate correlations between variables.
Table 4.6 shows the bivariate correlations for the predictor and outcome variables.
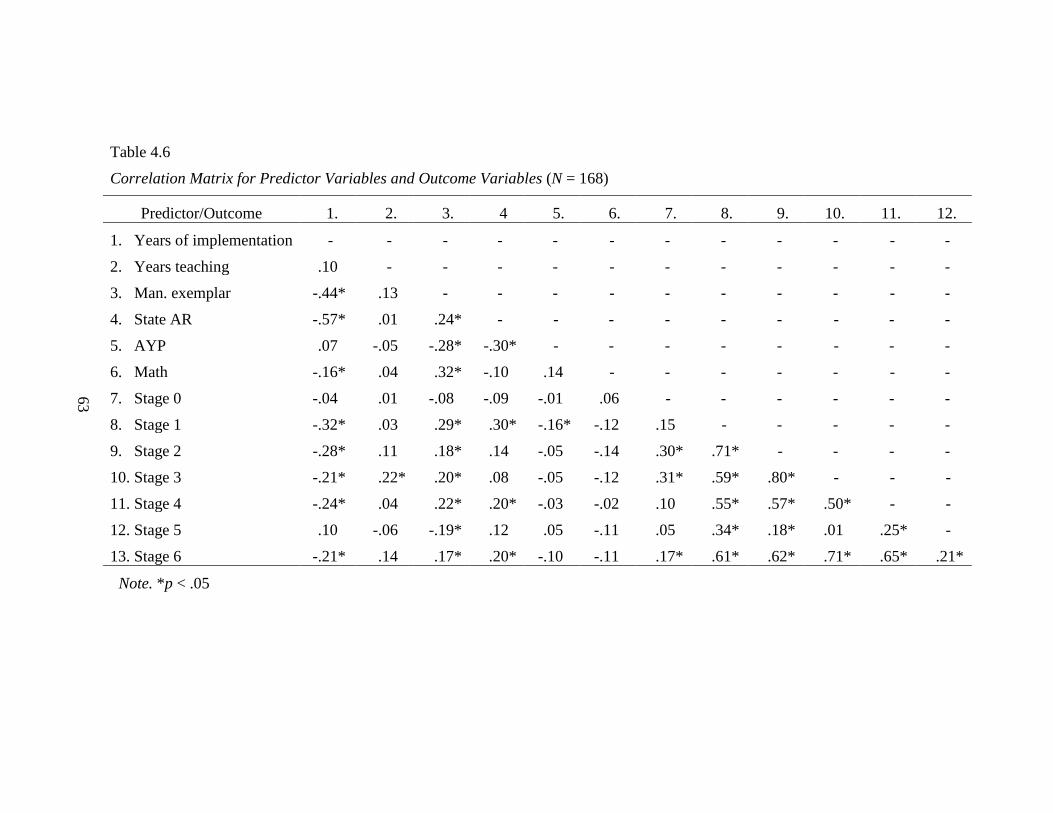
63
Table 4.6
Correlation Matrix for Predictor Variables and Outcome Variables (N = 168)
Predictor/Outcome 1. 2. 3. 4 5. 6. 7. 8. 9. 10. 11. 12.
1. Years of implementation - - - - - - - - - - - -
2. Years teaching .10 - - - - - - - - - - -
3. Man. exemplar -.44* .13 - - - - - - - - - -
4. State AR -.57* .01 .24* - - - - - - - - -
5. AYP .07 -.05 -.28* -.30* - - - - - - - -
6. Math -.16* .04 .32* -.10 .14 - - - - - - -
7. Stage 0 -.04 .01 -.08 -.09 -.01 .06 - - - - - -
8. Stage 1 -.32* .03 .29* .30* -.16* -.12 .15 - - - - -
9. Stage 2 -.28* .11 .18* .14 -.05 -.14 .30* .71* - - - -
10. Stage 3 -.21* .22* .20* .08 -.05 -.12 .31* .59* .80* - - -
11. Stage 4 -.24* .04 .22* .20* -.03 -.02 .10 .55* .57* .50* - -
12. Stage 5 .10 -.06 -.19* .12 .05 -.11 .05 .34* .18* .01 .25* -
13. Stage 6 -.21* .14 .17* .20* -.10 -.11 .17* .61* .62* .71* .65* .21*
Note. *p < .05
63
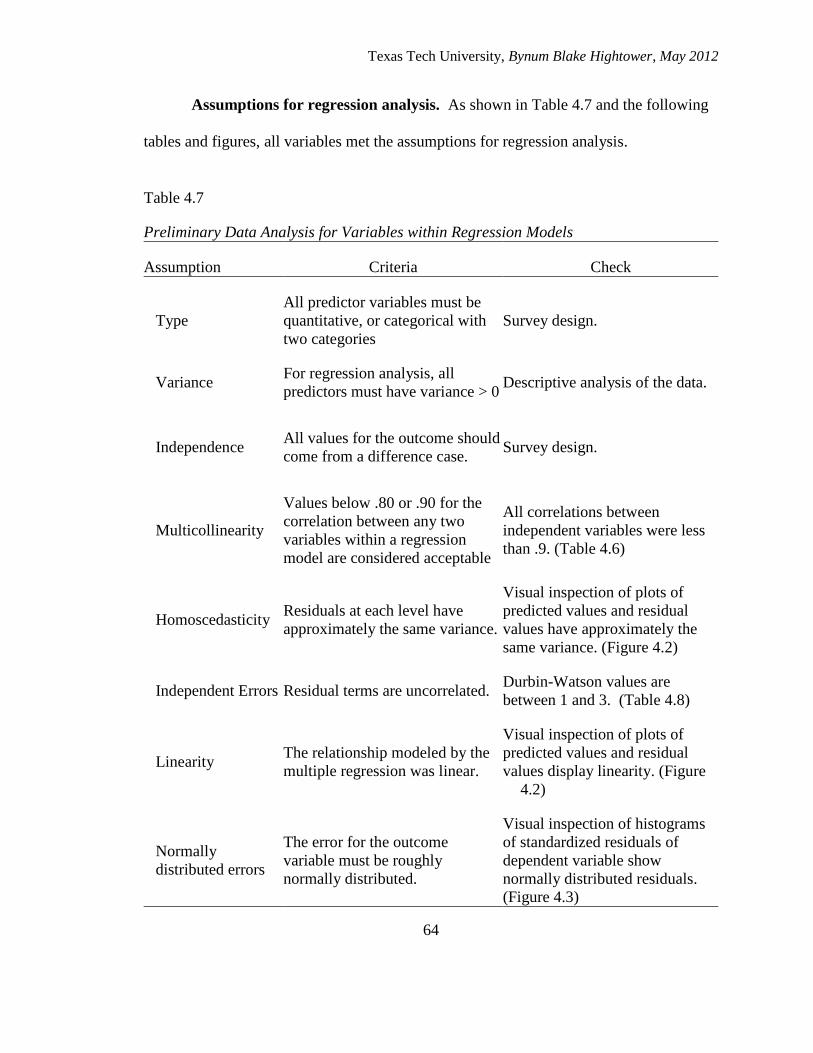
Texas Tech University, Bynum Blake Hightower, May 2012
64
Assumptions for regression analysis. As shown in Table 4.7 and the following
tables and figures, all variables met the assumptions for regression analysis.
Table 4.7
Preliminary Data Analysis for Variables within Regression Models
Assumption Criteria Check
Type
All predictor variables must be
quantitative, or categorical with
two categories
Survey design.
Variance For regression analysis, all
predictors must have variance > 0 Descriptive analysis of the data.
Independence All values for the outcome should
come from a difference case. Survey design.
Multicollinearity
Values below .80 or .90 for the
correlation between any two
variables within a regression
model are considered acceptable
All correlations between
independent variables were less
than .9. (Table 4.6)
Homoscedasticity Residuals at each level have
approximately the same variance.
Visual inspection of plots of
predicted values and residual
values have approximately the
same variance. (Figure 4.2)
Independent Errors Residual terms are uncorrelated. Durbin-Watson values are
between 1 and 3. (Table 4.8)
Linearity The relationship modeled by the
multiple regression was linear.
Visual inspection of plots of
predicted values and residual
values display linearity. (Figure
4.2)
Normally
distributed errors
The error for the outcome
variable must be roughly
normally distributed.
Visual inspection of histograms
of standardized residuals of
dependent variable show
normally distributed residuals.
(Figure 4.3)
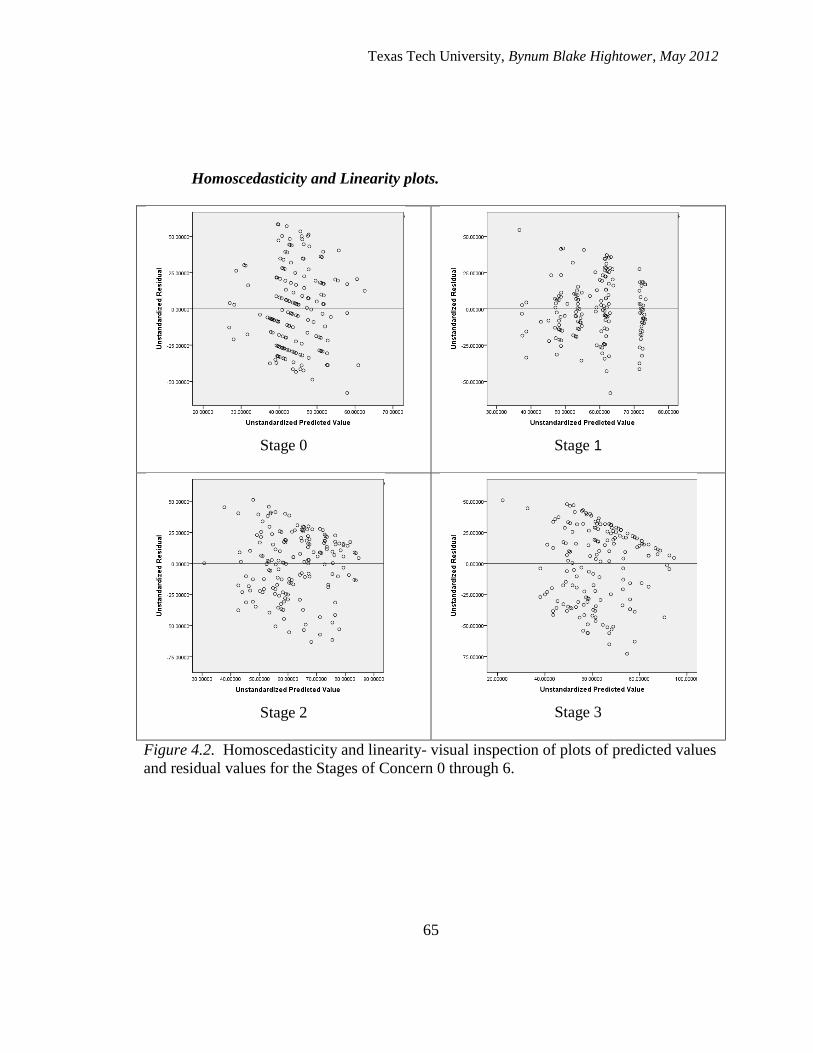
Texas Tech University, Bynum Blake Hightower, May 2012
65
Homoscedasticity and Linearity plots.
Stage 0
Stage 1
Stage 2
Stage 3
Figure 4.2. Homoscedasticity and linearity- visual inspection of plots of predicted values
and residual values for the Stages of Concern 0 through 6.
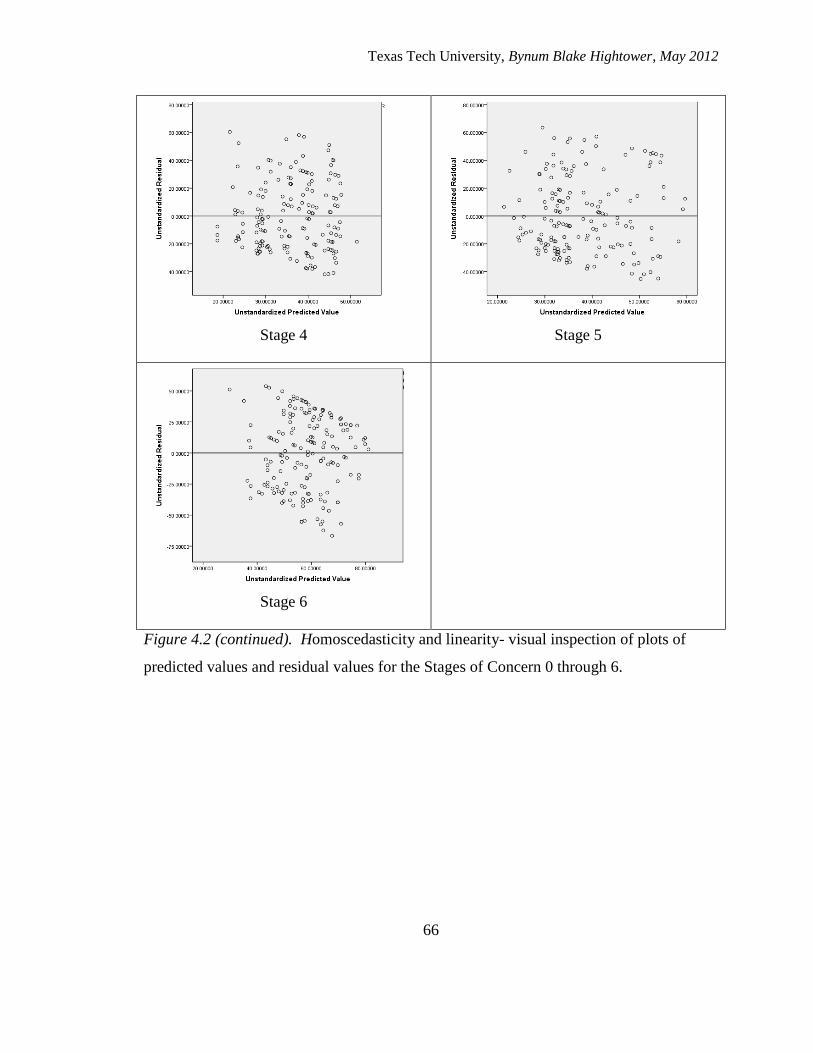
Texas Tech University, Bynum Blake Hightower, May 2012
66
Stage 4
Stage 5
Stage 6
Figure 4.2 (continued). Homoscedasticity and linearity- visual inspection of plots of
predicted values and residual values for the Stages of Concern 0 through 6.
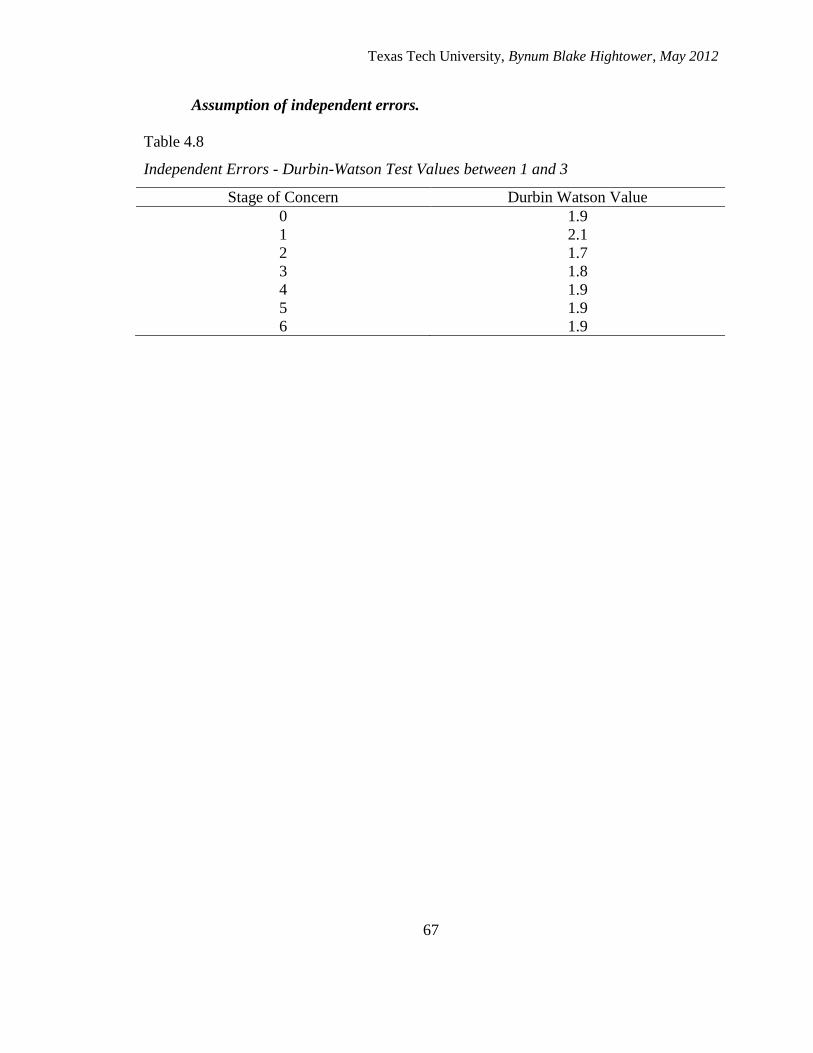
Texas Tech University, Bynum Blake Hightower, May 2012
67
Assumption of independent errors.
Table 4.8
Independent Errors - Durbin-Watson Test Values between 1 and 3
Stage of Concern Durbin Watson Value
0 1.9
1 2.1
2 1.7
3 1.8
4 1.9
5 1.9
6 1.9
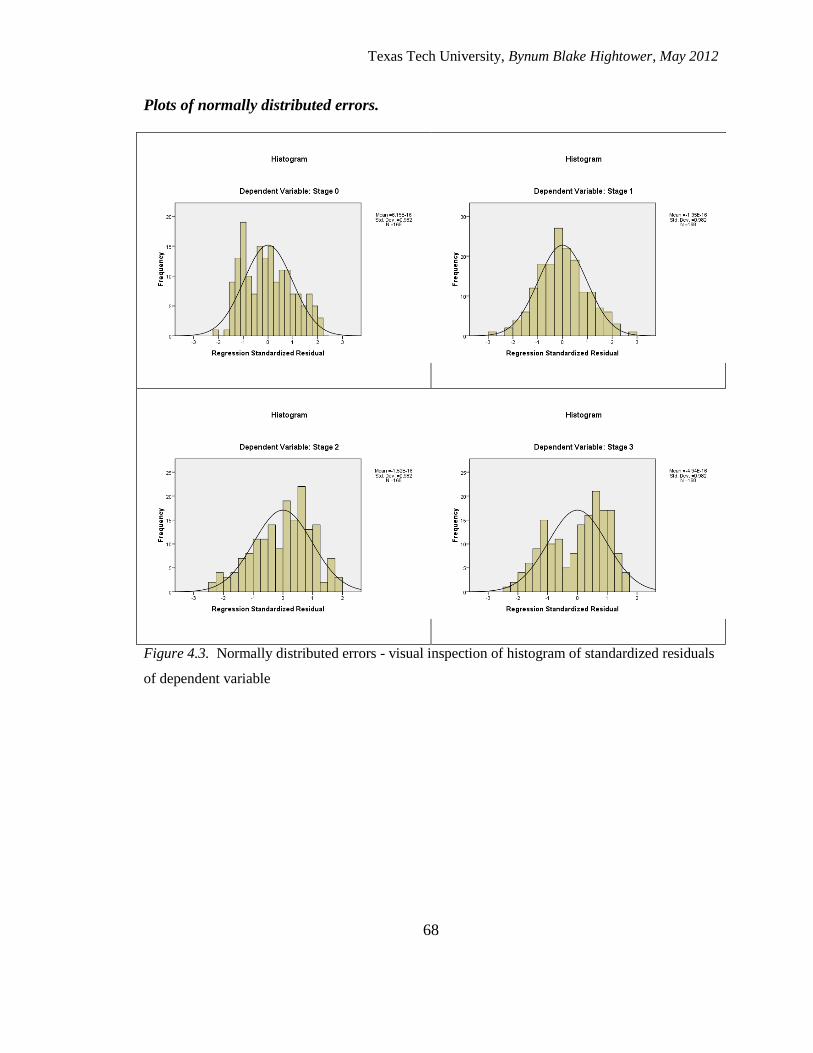
Texas Tech University, Bynum Blake Hightower, May 2012
68
Plots of normally distributed errors.
Figure 4.3. Normally distributed errors - visual inspection of histogram of standardized residuals
of dependent variable
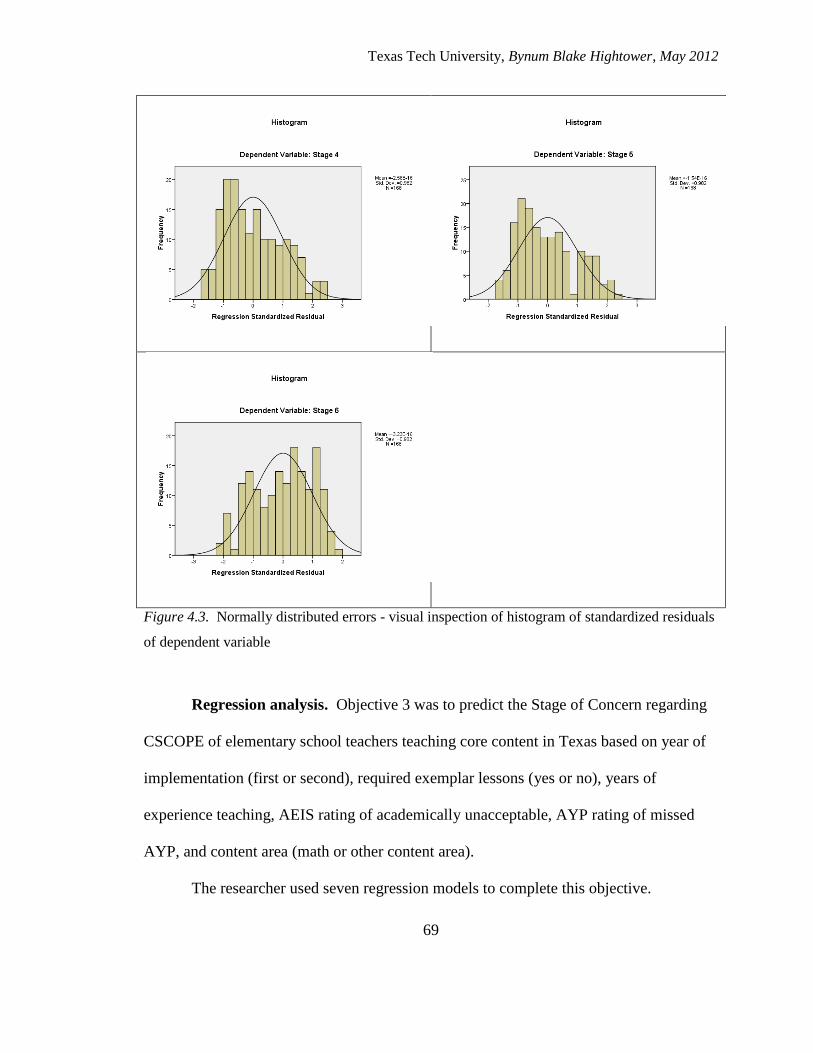
Texas Tech University, Bynum Blake Hightower, May 2012
69
Figure 4.3. Normally distributed errors - visual inspection of histogram of standardized residuals
of dependent variable
Regression analysis. Objective 3 was to predict the Stage of Concern regarding
CSCOPE of elementary school teachers teaching core content in Texas based on year of
implementation (first or second), required exemplar lessons (yes or no), years of
experience teaching, AEIS rating of academically unacceptable, AYP rating of missed
AYP, and content area (math or other content area).
The researcher used seven regression models to complete this objective.
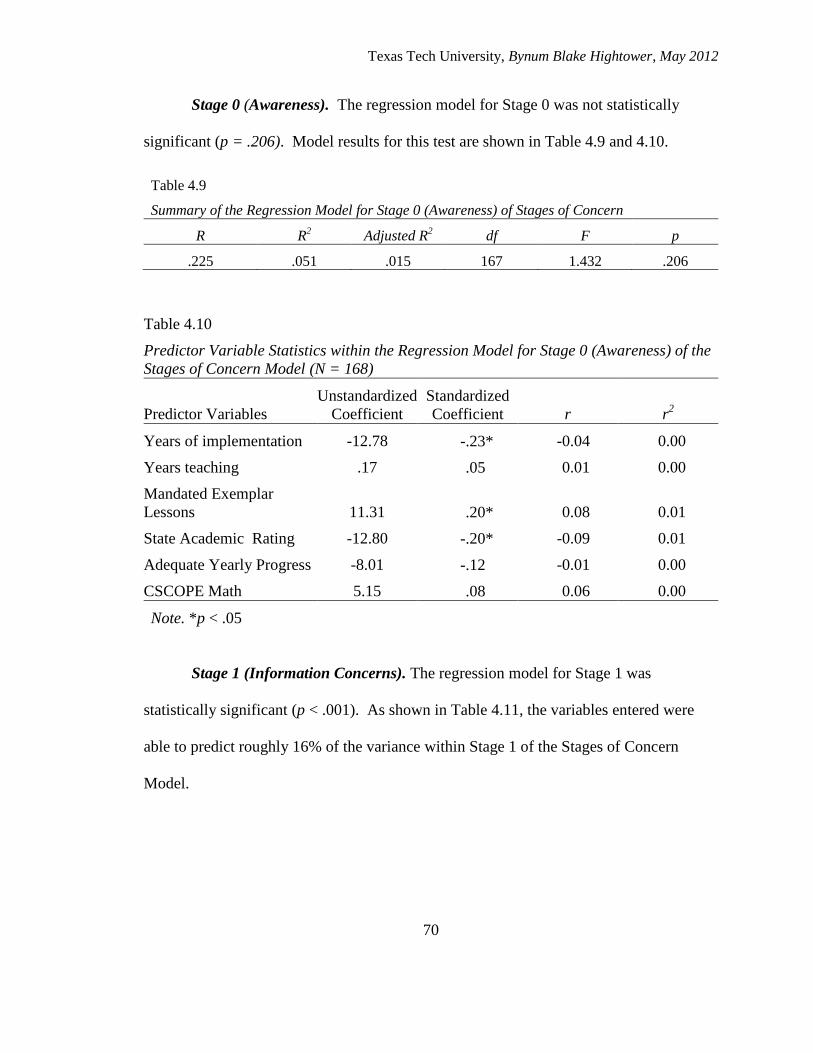
Texas Tech University, Bynum Blake Hightower, May 2012
70
Stage 0 (Awareness). The regression model for Stage 0 was not statistically
significant (p = .206). Model results for this test are shown in Table 4.9 and 4.10.
Table 4.9
Summary of the Regression Model for Stage 0 (Awareness) of Stages of Concern
R R2
Adjusted R2
df F p
.225 .051 .015 167 1.432 .206
Table 4.10
Predictor Variable Statistics within the Regression Model for Stage 0 (Awareness) of the
Stages of Concern Model (N = 168)
Predictor Variables
Unstandardized
Coefficient
Standardized
Coefficient r r2
Years of implementation -12.78 -.23* -0.04 0.00
Years teaching .17 .05 0.01 0.00
Mandated Exemplar
Lessons 11.31 .20*
0.08 0.01
State Academic Rating -12.80 -.20* -0.09 0.01
Adequate Yearly Progress -8.01 -.12 -0.01 0.00
CSCOPE Math 5.15 .08 0.06 0.00
Note. *p < .05
Stage 1 (Information Concerns). The regression model for Stage 1 was
statistically significant (p < .001). As shown in Table 4.11, the variables entered were
able to predict roughly 16% of the variance within Stage 1 of the Stages of Concern
Model.

Texas Tech University, Bynum Blake Hightower, May 2012
71
Table 4.11
Summary of the Regression Model for Stage 1 (Informational) of Stages of Concern
R R2
Adjusted R2
df F p
.434 .188 .158 167 6.217 p < .001
Regarding the independent variables, refer to Table 4.12 for unstandardized
coefficients, standardized coefficients, correlation with the dependent variable, effect size
(r2), and significance for each variable.
As shown in Table 4.12, the variable that predicted the most variance in the
dependent variable, in combination with the other variables as shown by the standardized
coefficient, was mandated exemplar lessons, ( = 0.23). Within SPSS, the variable “Are
Exemplar Lessons a non-negotiable on your campus?” was coded 1 = yes, 2 = no. As
such, a positive standardized coefficient illustrates that teachers required to implement
exemplar lessons demonstrate lower levels of concern within Stage 1 than teachers not
required to use exemplar lessons.
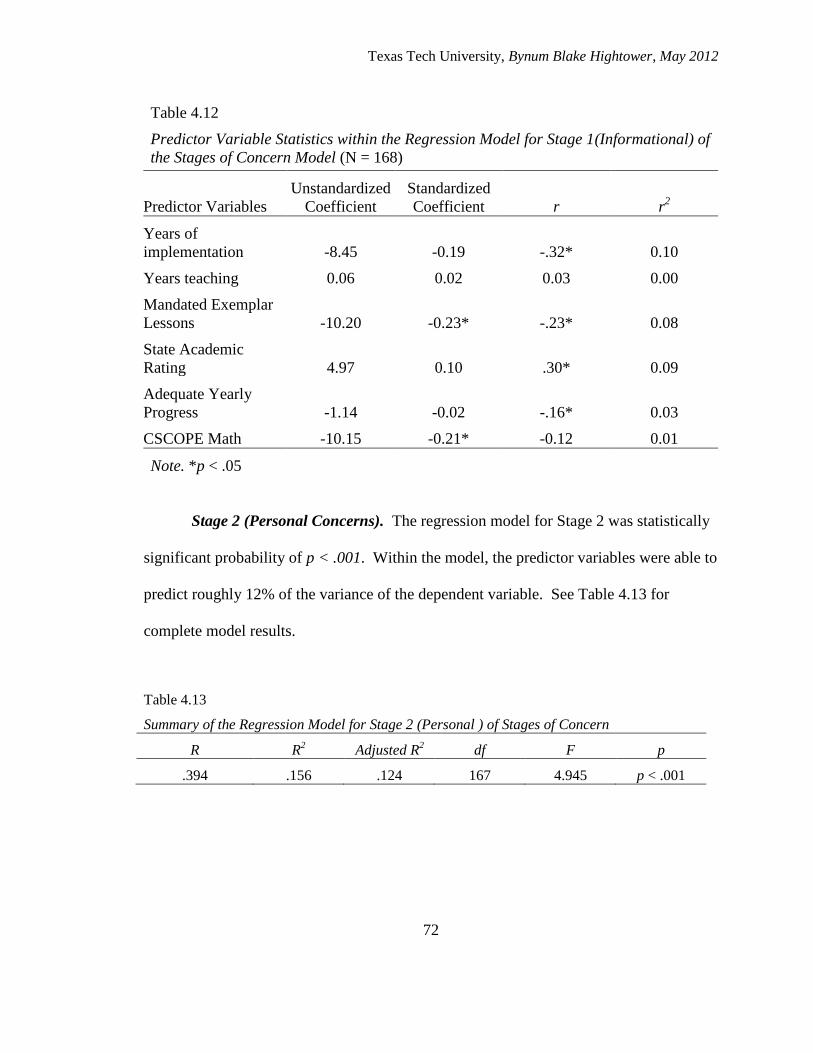
Texas Tech University, Bynum Blake Hightower, May 2012
72
Table 4.12
Predictor Variable Statistics within the Regression Model for Stage 1(Informational) of
the Stages of Concern Model (N = 168)
Predictor Variables
Unstandardized
Coefficient
Standardized
Coefficient r r2
Years of
implementation -8.45 -0.19 -.32* 0.10
Years teaching 0.06 0.02 0.03 0.00
Mandated Exemplar
Lessons -10.20 -0.23* -.23* 0.08
State Academic
Rating 4.97 0.10 .30* 0.09
Adequate Yearly
Progress -1.14 -0.02 -.16* 0.03
CSCOPE Math -10.15 -0.21* -0.12 0.01
Note. *p < .05
Stage 2 (Personal Concerns). The regression model for Stage 2 was statistically
significant probability of p < .001. Within the model, the predictor variables were able to
predict roughly 12% of the variance of the dependent variable. See Table 4.13 for
complete model results.
Table 4.13
Summary of the Regression Model for Stage 2 (Personal ) of Stages of Concern
R R2
Adjusted R2
df F p
.394 .156 .124 167 4.945 p < .001
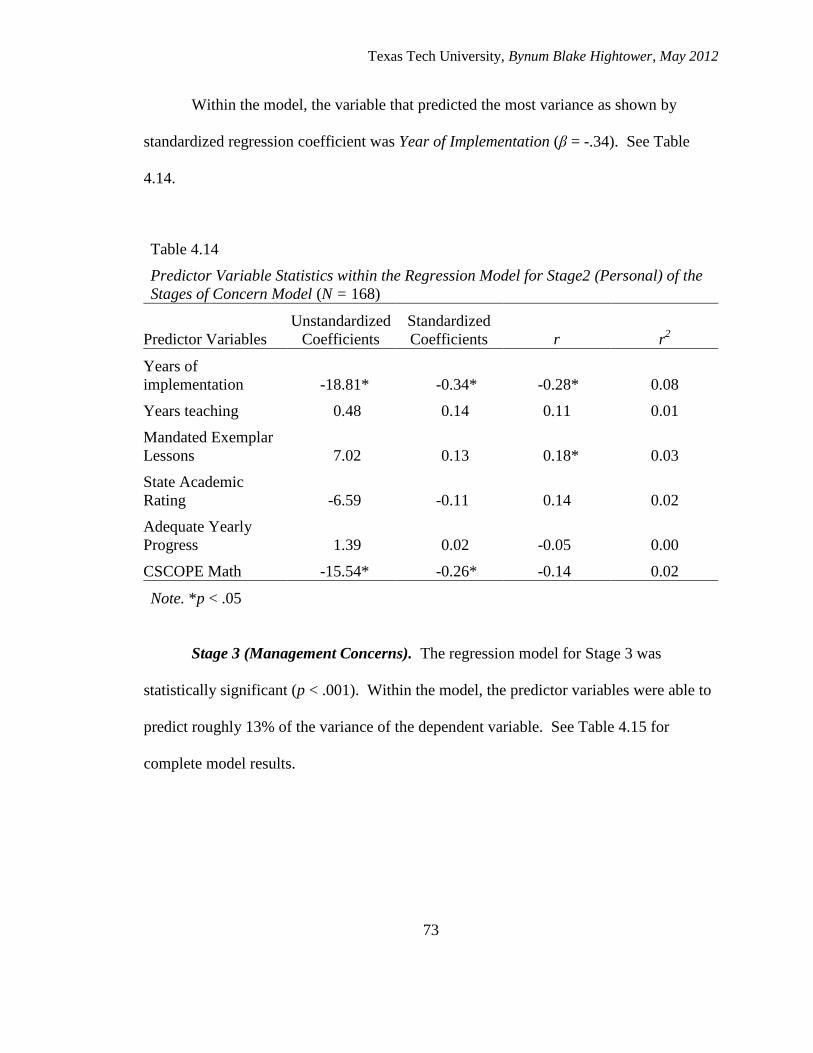
Texas Tech University, Bynum Blake Hightower, May 2012
73
Within the model, the variable that predicted the most variance as shown by
standardized regression coefficient was Year of Implementation (β = -.34). See Table
4.14.
Table 4.14
Predictor Variable Statistics within the Regression Model for Stage2 (Personal) of the
Stages of Concern Model (N = 168)
Predictor Variables
Unstandardized
Coefficients
Standardized
Coefficients r r2
Years of
implementation -18.81* -0.34* -0.28* 0.08
Years teaching 0.48 0.14 0.11 0.01
Mandated Exemplar
Lessons 7.02 0.13 0.18* 0.03
State Academic
Rating -6.59 -0.11 0.14 0.02
Adequate Yearly
Progress 1.39 0.02 -0.05 0.00
CSCOPE Math -15.54* -0.26* -0.14 0.02
Note. *p < .05
Stage 3 (Management Concerns). The regression model for Stage 3 was
statistically significant (p < .001). Within the model, the predictor variables were able to
predict roughly 13% of the variance of the dependent variable. See Table 4.15 for
complete model results.
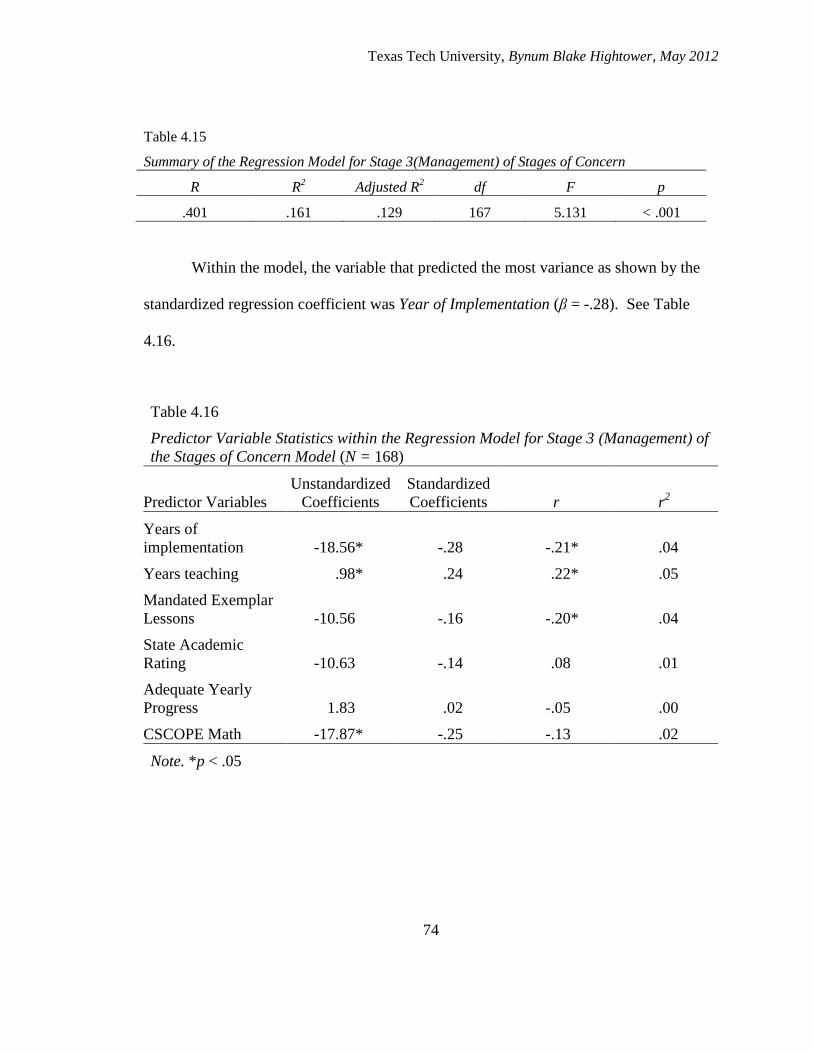
Texas Tech University, Bynum Blake Hightower, May 2012
74
Table 4.15
Summary of the Regression Model for Stage 3(Management) of Stages of Concern
R R2
Adjusted R2
df F p
.401 .161 .129 167 5.131 < .001
Within the model, the variable that predicted the most variance as shown by the
standardized regression coefficient was Year of Implementation (β = -.28). See Table
4.16.
Table 4.16
Predictor Variable Statistics within the Regression Model for Stage 3 (Management) of
the Stages of Concern Model (N = 168)
Predictor Variables
Unstandardized
Coefficients
Standardized
Coefficients r r2
Years of
implementation -18.56* -.28 -.21* .04
Years teaching .98* .24 .22* .05
Mandated Exemplar
Lessons -10.56 -.16 -.20* .04
State Academic
Rating -10.63 -.14 .08 .01
Adequate Yearly
Progress 1.83 .02 -.05 .00
CSCOPE Math -17.87* -.25 -.13 .02
Note. *p < .05

Texas Tech University, Bynum Blake Hightower, May 2012
75
Stage 4 (Consequence concerns). The regression model for Stage 4 was
statistically significant (p = .015). Within the model, the predictor variables were able to
predict roughly 6% of the variance of the dependent variable. See Table 4.17 for
complete model results.
Table 4.17
Summary of the Regression Model for Stage 4 (Consequence) of Stages of Concern
R R2
Adjusted R2
df F p
.303 .092 .058 167 2.716 .015
Within the model, the variable that predicted the most variance as shown by the
standardized regression coefficient was Mandated Exemplar Lessons (β = 0.19). See
Table 4.18 for complete results regarding the predictor variables.

Texas Tech University, Bynum Blake Hightower, May 2012
76
Table 4.18
Predictor Variable Statistics within the Regression Model for Stage 4 (Consequence) of
the Stages of Concern Model (N = 168)
Predictor Variables
Unstandardized
Coefficients
Standardized
Coefficients r r2
Year of
implementation -7.14 -0.14 -0.24* 0.06
Years teaching 0.11 0.03 0.04 0.00
Mandated Exemplar
Lessons -9.61* -0.19 -0.22* 0.05
State Academic
Rating 4.82 0.08 0.20* 0.04
Adequate Yearly
Progress 4.32 0.07 -0.03 0.00
CSCOPE Math -5.96 -0.10 -0.02 0.00
Note. *p < .05
Stage 5 (Collaboration concerns). The regression model for Stage 5 was
statistically significant (p = .011). Within the model, the predictor variables were able to
predict roughly 6% of the variance of the dependent variable. See Table 4.19 for
complete model results.
Table 4.19
Summary of the Regression Model for Stage 5 (Collaboration) of Stages of Concern
R R2
Adjusted R2
df F p
.310 .096 .063 167 2.859 .011
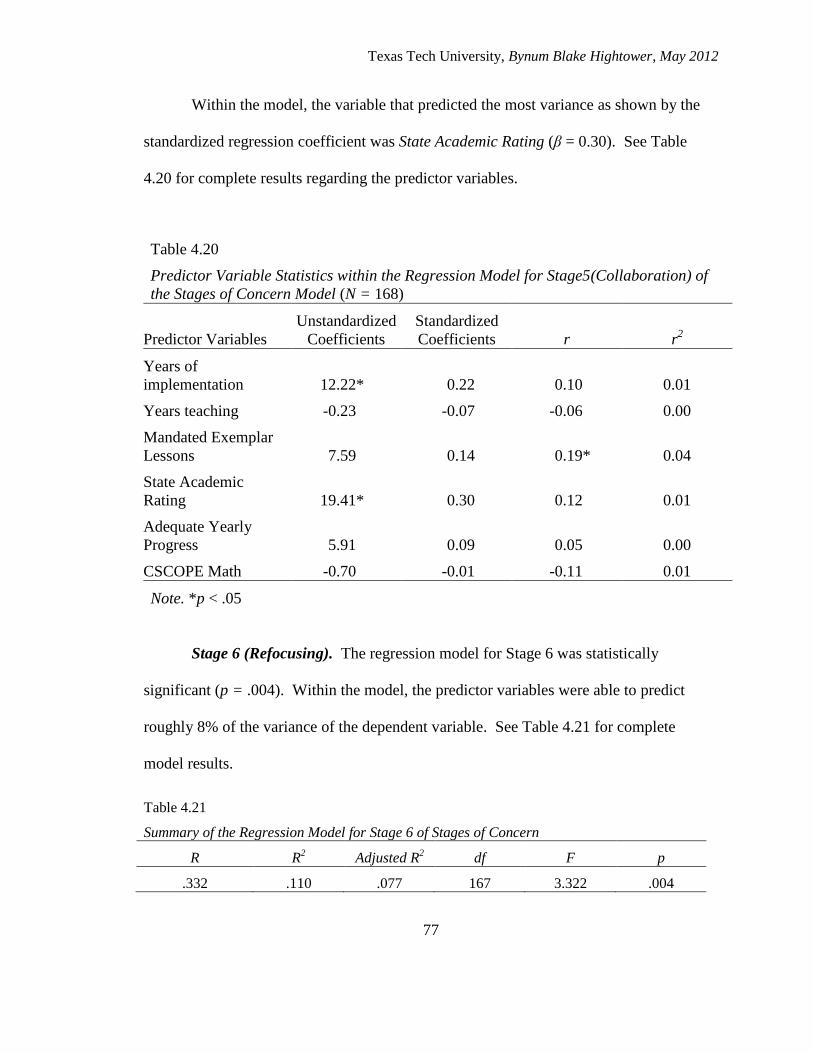
Texas Tech University, Bynum Blake Hightower, May 2012
77
Within the model, the variable that predicted the most variance as shown by the
standardized regression coefficient was State Academic Rating (β = 0.30). See Table
4.20 for complete results regarding the predictor variables.
Table 4.20
Predictor Variable Statistics within the Regression Model for Stage5(Collaboration) of
the Stages of Concern Model (N = 168)
Predictor Variables
Unstandardized
Coefficients
Standardized
Coefficients r r2
Years of
implementation 12.22* 0.22 0.10 0.01
Years teaching -0.23 -0.07 -0.06 0.00
Mandated Exemplar
Lessons 7.59 0.14 0.19* 0.04
State Academic
Rating 19.41* 0.30 0.12 0.01
Adequate Yearly
Progress 5.91 0.09 0.05 0.00
CSCOPE Math -0.70 -0.01 -0.11 0.01
Note. *p < .05
Stage 6 (Refocusing). The regression model for Stage 6 was statistically
significant (p = .004). Within the model, the predictor variables were able to predict
roughly 8% of the variance of the dependent variable. See Table 4.21 for complete
model results.
Table 4.21
Summary of the Regression Model for Stage 6 of Stages of Concern
R R2
Adjusted R2
df F p
.332 .110 .077 167 3.322 .004
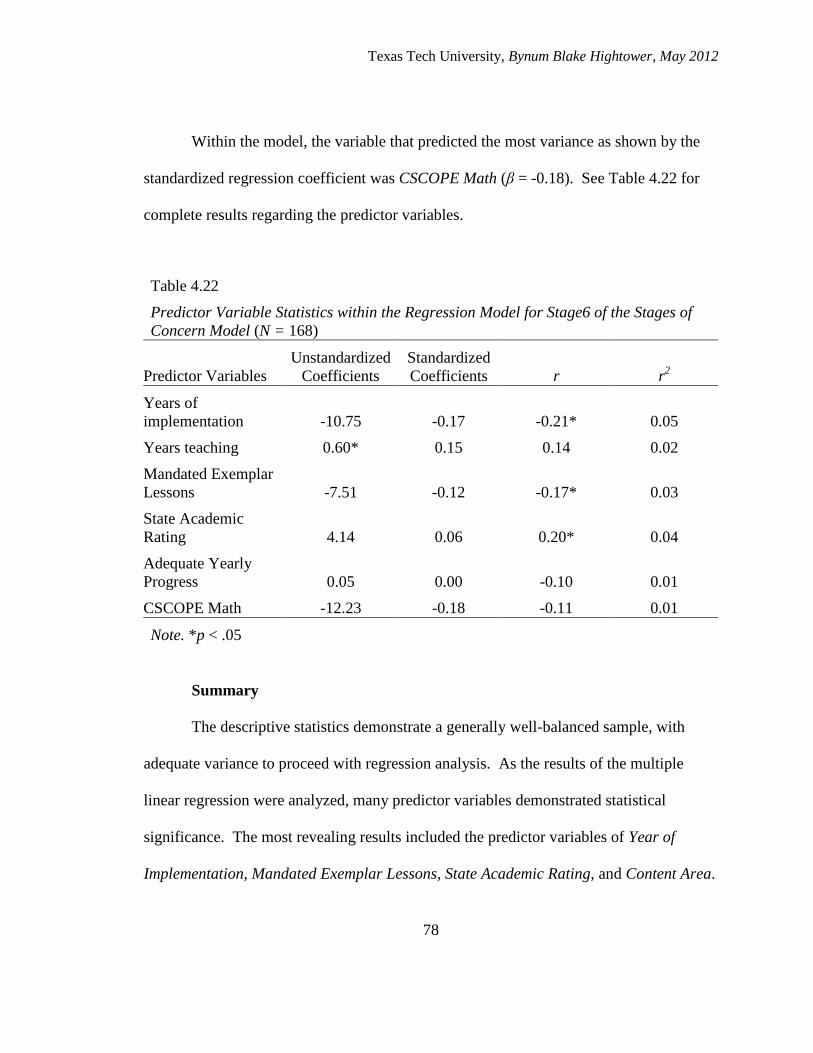
Texas Tech University, Bynum Blake Hightower, May 2012
78
Within the model, the variable that predicted the most variance as shown by the
standardized regression coefficient was CSCOPE Math (β = -0.18). See Table 4.22 for
complete results regarding the predictor variables.
Table 4.22
Predictor Variable Statistics within the Regression Model for Stage6 of the Stages of
Concern Model (N = 168)
Predictor Variables
Unstandardized
Coefficients
Standardized
Coefficients r r2
Years of
implementation -10.75 -0.17 -0.21* 0.05
Years teaching 0.60* 0.15 0.14 0.02
Mandated Exemplar
Lessons -7.51 -0.12 -0.17* 0.03
State Academic
Rating 4.14 0.06 0.20* 0.04
Adequate Yearly
Progress 0.05 0.00 -0.10 0.01
CSCOPE Math -12.23 -0.18 -0.11 0.01
Note. *p < .05
Summary
The descriptive statistics demonstrate a generally well-balanced sample, with
adequate variance to proceed with regression analysis. As the results of the multiple
linear regression were analyzed, many predictor variables demonstrated statistical
significance. The most revealing results included the predictor variables of Year of
Implementation, Mandated Exemplar Lessons, State Academic Rating, and Content Area.
Texas Tech University, Bynum Blake Hightower, May 2012
79
The regression model for Stage 0 (Awareness Concerns) of the SoCQ did not
prove to be statistically significant.
Stage 1 (Informational) demonstrated statistical significance related to three
predictor variables, which were able to predict over 50% the predicted variance within
Stage 1 scores. Year of Implementation, Mandated Exemplar Lessons, and State
Academic Rating were predictor variables of note within Stage 1.
The regression model for Stage 2 (Personal Concerns) of the SoCQ proved to be
statistically significant. Within the model, the predictor variables were able to predict
roughly 12% of the variance of the dependent variable. Predictor variables
demonstrating statistical significance for Stage 2 were Year of Implementation,
Mandated Exemplar Lessons, State Academic Rating, and CSCOPE Math.
The regression model for Stage 3 (Management Concerns) of the SoCQ proved to
be statistically significant. Within the model, the predictor variables were able to predict
roughly 13% of the variance of the dependent variable. The predictor variables
demonstrating statistical significance for Stage 3 were Year of Implementation, Years of
Experience, Mandated Exemplar Lessons, and CSCOPE Math.
Stage 4 (Consequence Concerns) of the SoCQ regression model proved to be
statistically significant. Within the model, the predictor variables were able to predict
roughly 6% of the variance of the dependent variable. The predictor variables
demonstrating statistical significance for Stage 4 were Year of Implementation, Mandated
Exemplar, and State Academic Ratings.
Texas Tech University, Bynum Blake Hightower, May 2012
80
The regression model for Stage 5 (Collaboration Concerns) of the SoCQ proved
to be statistically significant. Within the model, the predictor variables were able to
predict roughly 6% of the variance of the dependent variable. The predictor variables
demonstrating statistical significance for Stage 5 were Year of Implementation, Mandated
Exemplar, and State Academic Ratings.
The regression model for Stage 6 (Refocusing Concerns) of the SoCQ proved to
be statistically significant. Within the model, the predictor variables were able to predict
roughly 8% of the variance of the dependent variable. The predictor variables
demonstrating statistical significance for Stage 5 were Year of Implementation, CSCOPE
Math, Mandated Exemplar Lessons, Years of Experience, and State Academic Ratings.
Texas Tech University, Bynum Blake Hightower, May 2012
81
Chapter V
Conclusions and Recommendations
Introduction
This study centered upon a major curricular innovation within school districts
throughout the state of Texas known as CSCOPE. It was developed by The Texas
Education Service Center Curriculum Collaborative to address current challenges for
educators such as mobility rates and ineffective instructional practices, while providing a
guaranteed and viable curriculum for students based on established standards (B. Gibson,
personal communication, April 18, 2012). Implementation of an innovation such as
CSCOPE however, is a complex task that involves systemic change for the school
organization undertaking the process. This study explored critical variables associated
with innovation and systemic change, which include the emotional response of teachers
to mandated innovations.
The theoretical connections between Systems Theory, Concerns Theory, and
Management Theory are viewed through the lens of campus leadership as they relate to
effective innovation and change within organizations. Of particular interest to the
researcher is the unique aspect of the CSCOPE curriculum innovation. CSCOPE is a
unique curriculum, which requires teachers to implement not only curricular change, but
also prescribes how teachers will instruct a given skill (when Exemplar Lessons are
mandated) and this unique feature of the curriculum has not been previously studied. The
application of this study will potentially inform campus and district leaders relative to
Texas Tech University, Bynum Blake Hightower, May 2012
82
best implementation practices associated with the CSCOPE curriculum. This curriculum
has been widely adopted by school districts across the state and is currently in use by 810
districts and 4,631 campuses in Texas (J. Thomas, personal communication, January 3,
2012). The potential results of this study are relevant and significant to the majority of
educators across the state of Texas.
The research question was relative to the methodology used to explore the
relationship between predictor variables and the dependent/outcome variable (Stages of
Concern Questionnaire). Can researchers predict the Stages of Concern outcome (level
0-6) for teachers using the CSCOPE curriculum based on the following predictors?
- Year of implementation (first, or second)
- Required Exemplar Lessons (Yes or No)
- Years of experience teaching
- AEIS Rating of Academically Unacceptable
- AYP Rating of Missed AYP
- Content Area (Math, or other content area)
Stages of Concern
The outcome variable (SoC scoring) was measured by analyzing the means of the
raw data collected. It is recommended in the SoC scoring guide that group data be
analyzed by evaluating the two highest Stages of Concern relative to the raw data in order
to determine the levels of concern, which may also be interpreted as resistance to the
innovation. Observing the data represented in Table 4.3 and in Figure 4.1, the research
demonstrates the highest levels of concern in Stage 3 and Stage 2 respectively, with a
Texas Tech University, Bynum Blake Hightower, May 2012
83
mean score of 62.71 by elementary teachers in Stage 3 (Management Concerns). Stage 2
(Personal Concerns), demonstrates only a slightly smaller average mean score at 62.38
and closely mirrors the Stage 3 responses.
The most illuminating finding from the study relative to raw data is associated
with the predictor variable of Mandated Exemplar Lessons and the associated stage of
concern. When considering the entire CSCOPE curriculum Mandated Exemplar Lessons
represent the most prescriptive mandate to teachers. This level of implementation
dictates not only the content to be taught, the date on which the content must be taught,
the materials with which the content must be taught, and also the methodology by which
the content must be taught. According to the current body of research surrounding top-
down mandates, one would expect that the level of teacher concern would be greatest
when implementing CSCOPE at this level. However, the results of this study revealed
that teachers’ concerns were significantly lower when implementing Exemplar lessons
than their counterparts who were not required to implement the innovation to its most
prescriptive level. This statistic is interesting because it demonstrates that the body of
literature relative to top-down mandates does not hold true with the sample measured in
this study. For example, Kelly (1999) stated, "Coercion breeds hostility and defiance. If
the coercer is strong enough, we will give as much compliance as necessary to avoid
harm, but we will not commit ourselves to the goal of the coercion" (p. 543).
Texas Tech University, Bynum Blake Hightower, May 2012
84
Conclusions and Recommendations by Stage of Concern
Researchers were able to predict Stage of Concern scores using the predictor variables in
all but one stage. Conclusions and recommendations specific to each stage are discussed
below.
Stage 0 (Awareness Concerns). Stage 0 was the only stage to not have a
statistically significant regression model with the selected predictor variables. This may
be due to any number of external factors not addressed within the breadth of this
research. As explained by Weick and Quinn (1999) continuous change processes within
organizations are complex. As the initial stage in the adoption assimilation process,
Stage 0 may be impacted by such an array of external, internal, intrapersonal, and
interpersonal factors that patterns fail to develop and a cohesive model is not able to be
distilled. Evidence of this is contained in the correlation matrix for this stage (Table 4.7).
Additional research is needed to discover, distill, and describe variables that are
able to mathematically predict scores within this stage. However, the researcher
exploring the phenomenon associated with this stage of concern should consider a
methodology employing mixed methods in order to account for contextual differences
that must be considered individually by campus.
This research underscores the importance for elementary school administration
practitioners to be cognizant of their constituents’ concerns as they implement curricular
change within the district. There are potentially infinite factors that influence a teacher’s
perception of this innovation. In order to successful implement the innovation,
practitioners must be aware of this dynamic environment; be sympathetic (and perhaps
Texas Tech University, Bynum Blake Hightower, May 2012
85
empathetic) to teacher’s concerns; and be able to act and react accordingly without undo
preconceived expectations. Sergiovanni (2001) suggests that flexibility in
implementation is considered best practice, "[i]mplementation decisions lead to the
creation of policies in use. Good implementing decisions are able to respond to local
contexts and needs by resembling the handed down mandates while being different"
(p.11).
Stage 1 (Informational Concerns). The regression model for Stage 1 was
statistically significant and predicted more of the outcome variable than did any other
model within this research (16%). This is in stark contrast for the results of the
regression model for Stage 0. Seemingly, as teachers’ understanding of CSCOPE
matures, the factors that influence their Informational Concern become more distilled.
Other factors (predictor variables) contributing to this distillation process indicate that
Mandated Exemplar Lessons and State Academic Rating play a significant role in
lessening informational concerns of teachers implementing the CSCOPE innovation.
Considering the predictor variables that demonstrate statistical significance, the
researcher concludes that the results for Stage 1 are logical. It makes sense that
informational concerns about the innovation would lessen as teachers become better
acquainted with the curriculum over time. The same holds true when the administration
mandates the exemplar lessons, which require use of the curriculum thereby requiring
teachers to become better informed of the innovation. The role of the State Academic
Rating also appears to be important as teachers working at campuses with low academic
Texas Tech University, Bynum Blake Hightower, May 2012
86
ratings demonstrate lower informational concern scores than the higher achieving
campuses. Lower ratings appear to provide additional impetus for teachers to acquire a
working knowledge of the CSCOPE curriculum in order to raise achievement scores.
Interestingly, the predictor variable Years of Experience did not demonstrate
statistical significance when considering informational concerns. Further research should
be devoted to looking at the role of experience levels in innovation adoption models.
Practitioners should keep these factors associated with the statistically significant
predictor variables in mind as they develop and implementation plan for curricular
change. School administrators should be cognizant of the limited role that teacher
experience plays in the adoption process. As years of experience did not significantly
contribute to this model, strong teachers should not be overlooked for leadership roles
strictly on the basis of years of experience (or lack of years of experience).
Stage 2 (Personal Concerns). The regression model for Stage 2 was statistically
significant and predicted 12% of the outcome variable. Within the model, the predictor
variables demonstrating statistical significance included Year of Implementation,
Mandated Exemplar Lessons, State Academic Rating, and CSCOPE Math. Personal
concerns relative to CSCOPE implementation were lower in the second year of
implementation. Administrators that mandate exemplar lessons at the elementary school
level also appear to positively influence the personal concerns of their teachers as this
predictor variable indicates less concern over how the CSCOPE innovation impacts their
Texas Tech University, Bynum Blake Hightower, May 2012
87
personal life. Likewise, teachers working on campuses with low academic ratings appear
to have less personal concern related to the innovation.
Recommendations for further research are based upon the predictor variable of
CSCOPE Math. The results surrounding this predictor variable were surprising.
Teachers implementing the curricular innovation in the content area of Mathematics
demonstrated a high level of personal concern. This could be attributed to a unique
circumstance occurring in 2011-2012 school year associated with the availability of the
Math content. The Mathematics curriculum was being rewritten this year and teachers
were required to search out the materials, which were not readily available in the typical
online format. However, the researcher recommends this area for further research to
determine if this is a consistent phenomenon.
Practitioners should be aware that staying the course with implementation will
yield lower levels of personal concerns for teachers as the campus transitions to the
subsequent years of implementation. More required familiarity with the curriculum as
demonstrated by the mandate of exemplar lessons also aids in the adoption process.
Once again, lower achievement ratings appear to serve as a catalyst for acceptance of the
change process associated with CSCOPE implementation. District and campus leaders
should be aware that high achieving campuses may view the innovation as change for
changes sake and those teachers will experience higher levels of personal concern when
adopting CSCOPE.
Texas Tech University, Bynum Blake Hightower, May 2012
88
Stage 3 (Management Concerns). The regression model for Stage 3 was
statistically significant and predicted 13% of the outcome variable. Within the model, the
predictor variables demonstrating statistical significance included Year of
Implementation, Mandated Exemplar Lessons, Years of Experience, and CSCOPE Math.
Management concerns relative to CSCOPE implementation lower in the second year of
implementation again demonstrating that being familiar with the curricular innovation is
critical to lowering teacher concern levels. Exemplar lessons are also correlated to the
lowering of management concerns based on the scenario that teachers are forced to be
more familiar with the innovation.
Recommendations for further research regarding Stage 3 are based upon the
predictor variable of Years of Teaching. The results surrounding this predictor variable
demonstrate that teachers with low-levels of experience appear to have fewer
management concerns than teachers with higher levels of experience. This could be due
to a variety of factors, which may include familiarity with technology, established
teaching protocols, or perhaps that more experienced teachers are relied upon more
heavily to lead the implementation process and therefore feel more pressure to manage
the innovation for their colleagues. Only further research will illuminate this
phenomenon.
Practitioners should consider the data revealed concerning Stage 3 in order to
establish implementation protocols. The protocols might include establishing teachers
with middle levels of experience to mentor teachers with lower and higher experience
levels. Again, it is apparent that a lessening of management concerns is associated with
Texas Tech University, Bynum Blake Hightower, May 2012
89
the second year of implementation. Mandated exemplar lessons are also significant in
Stage 3 and district leaders should note that ensuring familiarity with the CSCOPE
innovation aids in lowering teacher levels of concern for Stage 3.
Stage 4 (Consequence Concerns). The regression model for Stage 4 was
statistically significant and predicted 6% of the outcome. Stage 4 represents a significant
statistical change in the amount of the model the regression was able to predict.
According to the SoCQ scoring information our sample is demonstrating an expected
outcome. The authors of the survey suggest that when the stage of concern is much
lower, this represents the process of moving through the stages of concern. Most teachers
have not progressed through the earlier stages of concern. However, the following
predictor variables did demonstrate statistical significance within Stage 4. State
Academic rating indicates that teachers may bring a prejudice to new innovations if their
campus is already performing well. They are concerned that changing the curriculum
may not yield increased student achievement and their previous curriculum has proven
merit. Contrasting this result, campuses with lower State Academic Ratings demonstrate
lower levels of concern and believe that change is necessary for student achievement to
improve.
Recommendations for further research relative to Stage 4 include an identical
study involving the same campuses for next year. If the information in the scoring
booklet is accurate, the subsequent study should show higher levels of concern for Stage
4 next year as teachers progress through the Stages of Concern model. Interestingly, the
Texas Tech University, Bynum Blake Hightower, May 2012
90
raw data indicates that although the levels of concern are lower in the second year of
implementation, teachers still display higher levels of concern in Stages 2 and 3. The
shape of the data in this study does not completely agree with the Stages of Concern
scoring booklet. A subsequent study would answer existing questions regarding this
phenomenon.
Practitioners should be aware of developing concerns as teachers move through
the Stages of Concern model and implement measure to alleviate teacher concerns so that
complete adoption can be achieved. Monitoring current concern levels for teachers will
allow district leaders to address the varying needs of the teachers as they implement the
innovation.
Stage 5 (Collaboration Concerns). The regression model for Stage 5 was
statistically significant and predicted 6% of the outcome. Statistically significant
predictor variables included Mandated Exemplar Lessons, State Academic Rating, and
Year of Implementation. Mandating exemplar lessons and being in the second year of
implementation seem to have a positive correlation relative to raising the levels of
concern in Stage 5. This is the first time these predictor variables appear to raise levels of
teacher concern rather than lowering them in the model for this study. State academic
ratings also demonstrate some departure from the previous statistical variations
associated with Stage 5. Academically Acceptable campuses have a higher level of
concern in stage 5 than do higher or lower performing campuses.
Texas Tech University, Bynum Blake Hightower, May 2012
91
Recommendation for further research involve the predictor variable of Mandated
Exemplar Lessons. With concerns being higher in this stage for teachers experiencing
this mandate the researcher might conclude that mandated lessons have moved teachers
further through the Stages of Concern model. A qualitative study involving this predictor
variable could establish this as a positive or a negative aspect of establishing non-
negotiable standards associated with the CSCOPE innovation.
Recommendations for practitioners concerning Stage 5 involve district leaders
promoting as much use of the CSCOPE innovation as possible. Mandating the Exemplar
lessons appears to demonstrate that teachers move through the stages of concern more
quickly. Additionally, the campuses implementing the innovation in the second year are
demonstrating more concern in Stage 5 lending additional evidence that more experience
with CSCOPE moves students through the process of change more quickly.
Stage 6 (Refocusing Concerns). The regression model for Stage 6 was
statistically significant and predicted 8% of the outcome variable. Statistically significant
predictor variables included Mandated Exemplar Lessons, State Academic Rating,
CSCOPE Math, and Year of Implementation. Once again exemplar lessons are
demonstrating a higher level of concern rather than a lowering of the level of concern and
this may indicate a positive rather than a negative relationship in that the progression
through the stages of concern could be expedited by establishing a non-negotiable
standard for this variable. Teachers involved in teaching CSCOPE Mathematics also
demonstrated high levels of concern Although the teachers in the second year of
Texas Tech University, Bynum Blake Hightower, May 2012
92
implementation did demonstrate a lowering in levels of concern for Stage 6 and this is
problematic based upon earlier assertions that this variable may expedite teacher
progression through the stages of concern.
Recommendations for further research center on the anomalous predictor
variables of Mandated Exemplar Lessons and Year of implementation. Stage 6
represents a divergence between these two predictor variables not previously seen in the
regression model. In other words these two variables have a positive correlation in
Stages 1-5 in the SocQ. A qualitative study exploring the “why’s” of this divergence is
in order.
Recommendations for practitioners relative to Stage 6 are associated once again
with mandating exemplar lessons when implementing the CSCOPE intervention. This
predictor variable demonstrated statistical significance in all stages of concern associated
with the SoCQ with the exception of Stage 0. This is compelling evidence that the
practice of mandating strict adherence to the curriculum creates a dynamic which
precipitates lowering levels of concern within the egocentric stages of concern and a
more rapid progression through the stages of concern as a whole. The researcher also
recommends that district and campus leaders employ the use of the Stages of Concern
questionnaire to aid in the determination of strengths and weaknesses of faculty members
relative to their SOcQ response to the CSCOPE innovation. By understanding what
teachers’ concerns are, administrators can better equip teachers to succeed and teachers
can better anticipate and communicate their needs and concerns.
Texas Tech University, Bynum Blake Hightower, May 2012
93
Limitations
The results of the multiple linear regression model used in this study proved to be
statistically significant for each stage of concern except Stage 0 (Unconcerned). The
predictor variables used reveal a small degree of predictability within the sample. In
generalizing these results to the population being studied, it should be noted that the
largest variance able to be predicted within any of the stages of concern was 16%. This
being said, practitioners must be cognizant that the variability of scores must be due to
other factors within the school context.
Summary
Educative processes are in flux around the globe and it is now more important
than ever to ensure that school leaders establish protocols to implement innovations in the
most efficient manner. Being aware of the emotional response of teachers regarding
systemic change is critical aspect to the successful adoption of new innovations. This
study adds new rhetoric to the body of literature which surrounds effective leadership
practices within this framework. Concerns Theory, Systems Theory, and Scientific
Management Theory are convergent factors which administrators must consider when
engaging any educational innovation in the context of public education.
Many of the survey responses to the predictor variables of our sample group
within the Stages of Concern model were validations of current research. However, the
most important revelations were centered upon mandated change and levels of teacher
experience. This study demonstrates that there are times when top-down mandates have
Texas Tech University, Bynum Blake Hightower, May 2012
94
a positive influence in lowering teachers’ level of concern relative the CSCOPE
curricular innovation. The implications for the convergence of Systems Theory,
Management Theory, and Concerns Theory reveal that individual subsystems, which
involve the dynamics of school change processes dictate much about the SOcQ response
to top-down mandates.
This study demonstrated that the most restrictive top-down mandate of employing
the exemplar lessons associated with CSCOPE actually facilitated more familiarity with
the curriculum, which played a part in lowering levels of concern among teachers. In
addition, teachers participating in this survey who were required to use exemplar lessons
demonstrated a more rapid progression through the stages of concern when compared to
teachers who were not required to use the most restrictive form of the CSCOPE
curriculum. It seems that the perspective of Dewey (1921) and Marzano (2005) is the
correct relative to improving teacher performance. Taylorism must ultimately be
considered a positive force in facilitating campus reform. This is in stark contrast to the
current body of research, which indicated that top-down mandates had been previously
ineffective at producing acceptance of curricular innovations by school faculty members
“…including the hidden dimension of a seeming determination to substitute technical
management for thoughtful leadership” (Bracey, 2002; Giroux, 2009a, 2009b; Goodlad,
2007) (Batagiannis, 2011, p. 1304-1305).
Ultimately, this study demonstrates that the administrative approach to school
innovation must be customized to fit the context of the campus. The one-size fits all
approach will often create a higher level of concern for teachers relative to the
Texas Tech University, Bynum Blake Hightower, May 2012
95
innovation. District and campus leaders must approach change and innovation with a
sincere degree of information gathering in order to establish the most appropriate
protocols to enhance and expedite the adoption process. This study mirrors the current
research findings relative to allowing each principal the flexibility to respond and adjust
to varying contexts on individual campuses when implementing the adoption of any
innovation. Again, Sergiovanni (2001) found, “[i]mplementation decisions lead to the
creation of policies in use. Good implementing decisions are able to respond to local
contexts and needs by resembling the handed down mandates while being different" (p.
33).
Texas Tech University, Bynum Blake Hightower, May 2012
96
References
Batagiannis, S. C. (2007). Leadership guided by courage: A challenge to instantaneous
perfection. The Journal of Educational Thought, 41(2), 145-157. Retrieved from:
http://www.questia.com/PM.qst?a=o&d=5035124252
Batagiannis, S. C. (2011). Promise and possibility for aspiring principals: An emerging
leadership identity through learning to do action research. The Qualitative Report,
16(5), 1304-1329. Retrieved from
http://www.questia.com/PM.qst?a=o&d=5051745423
Beach, R. H., & Lindahl, R. (2004). Identifying the knowledge base for school
improvement. Planning and Changing, 35(1/2), 2-33. Retrieved from
http://www.questia.com/PM.qst?a=o&d=5045074126
Bloomfield, D. C., & Cooper, B. S. (2003). NCLB: A new role for the federal
government: An overview of the most sweeping federal education law since 1965.
T H E Journal (Technological Horizons in Education), 30(10), 6- 9. Retrieved
from http://www.questia.com/PM.qst?a=o&d=5001965193
Bracey, G. W. (2008). Assessing NCLB. Phi Delta Kappan, 89(10), 781- 782. Retrieved
from http://www.questia.com/PM.qst?a=o&d=5027823616
Bryan, K. A., & Martinez, L. (2008). On the evolution of income inequality in the United
States. Economic Quarterly - Federal Reserve Bank of Richmond, 94(2), 97-120.
Retrieved from http://www.questia.com/PM.qst?a=o&d=5045030974
Texas Tech University, Bynum Blake Hightower, May 2012
97
Burris, C. C., & Welner, K. G. (2005). A special section on the achievement gap -
Closing the achievement gap by detracking. Phi Delta Kappan, 86(8), 594-598.
Retrieved from http://www.questia.com/PM.qst?a=o&d=5009329171
Cheung, D. (2002). Refining a Stage Model for Studying Teacher Concerns about
Educational Innovations. Australian Journal of Education, 46(3), 305-322.
Retrieved from http://www.questia.com/PM.qst?a=o&d=5001697322
Chugh, D., & Bazerman, M.H. (2007). Bounded awareness: What you fail to see can hurt
you. Mind and Society, 6(1), 1-18.
Clark, I. F., & James, P. R. (2004). Using Concept Maps to Plan an Introductory
Structural Geology Course. Journal of Geoscience Education, 52(3), 224-236.
Retrieved from: http://www.questia.com/PM.qst?a=o&d=5037552304
Daniels, H. (2001). Vygotsky and Pedagogy. London: Routledge Falmer. Retrieved from
http://www.questia.com/PM.qst?a=o&d=102924022
development. Austin, TX: The University of Texas, Research Development
Center for Teacher Education.
Dewey, J. (1916). Democracy and Education: An Introduction to the Philosophy of
Education. New York: Macmillan. Retrieved from
http://www.questia.com/PM.qst?a=o&d=77608452
Dewey, J. (1921). Democracy and education: An introduction to the philosophy of
education. New York: The Macmillan Company.
Doherty, T., & Horne, T. (2002). Managing public services. Implementing changes.
London, UK: Routledge.
Texas Tech University, Bynum Blake Hightower, May 2012
98
Edmunds, R. (1981). Making public schools effective. Social Policy, 12, 53-60.
Elliott, S. N., Kratochwill, T. R., & Roach, A. T. (2003). Implementing social-emotional
and academic innovations: Reflections, reactions, and research. School
Psychology Review, 32, 320-326.
Enderlin-Lampe, S. (2002). Empowerment: Teacher perceptions, aspirations and
efficacy. Journal of Instructional Psychology, 29(3), 139-146 . Retrieved from
http://www.questia.com/PM.qst?a=o&d=5000826720
Erickson, L. (2001, pg 35). Stirring the head, heart, and soul: Redefining curriculum and
instruction. Thousand Oaks, CA: Corwin Press Inc.
Faircloth, E.G., Smith, B.P, Hall, H.C. (2001) FCS teachers' stages of concern regarding
national standards. Journal of Family and Consumer Sciences: From Research to
Practice, 93(4), 29-32.
Field, A. (2009) Discovering Statistics Using SPSS, 3rd
ed. London: Sage Publications
Limited.
Fullan, M. (2003). Change Forces with a Vengeance. London: RoutledgeFalmer.
Retrieved from: http://www.questia.com/PM.qst?a=o&d=108047719
George, A. A., Hall, G. E., & Stiegelbauer , S. M. (2006). Measuring Implementation in
Schools: The Stages of Concern Questionnaire. Austin, Texas, Southwestern
Educational Development Laboratories.
Gray, K. (1993). Why we will lose: Taylorism in America's high schools. Phi Delta
Kappan, 74(5), 370-374.
Hall, E. (1978). The study of teachers’ concerns and consequent implications for staff
Texas Tech University, Bynum Blake Hightower, May 2012
99
Hall, G. E., Hord, S. M., Aguilera, R., Zepeda, O., & Frank, V. V. (2011, August).
Implementation: Learning Builds the Bridge between Research and Practice.
Journal of Staff Development, 32, 52- 57. Retrieved from
http://www.questia.com/PM.qst?a=o&d=5050714990
Hall, G.E, Loucks, S.F, Rutherford, W.L., Newlove, B.W. (1975). Levels of use of the
innovation: A framework for analyzing innovation adoption. Journal of Teacher
Education XXVI, 1, 52-56.
Hedge, J., & Pulakos, E. D. (Eds.) (2002). Implementing organizational interventions:
Steps, processes, and best practices. San Francisco, CA: Jossey-Bass.
Hodge, C.L., & Krumm, B.L. (2009). NCLB: A study of its effect on rural schools. Rural
Special Education Quarterly, 28(1), 20-27.
Hunt, J.W. (2008). A nation at risk and No Child Left Behind: Déjà vu for
administrators? Phi Delta Kappan, 89, 580-585.
in Schools: The Stages of Concern Questionnaire. Austin, TX: Southwest
Educational Development Laboratory.
Jacobs, H.H. (2004). Getting results with curriculum mapping. Alexandria, Virginia:
Association for Supervision and Curriculum Development.
Jencks, C. & Phillips, M. (1998). The black-white test score gap: An introduction. In C.
Jencks & M. Phillips (Eds.), The black-white test score gap. Washington, DC:
Brookings Institution Press.
Kelly, T. F. (1999). Why state mandates don't work. Phi Delta Kappan, 80(7), 543-
544,546. Retrieved from http://www.questia.com/PM.qst?a=o&d=5001242323
Texas Tech University, Bynum Blake Hightower, May 2012
100
Leithwood, K., Jantzi, D., & Steinbach, R. (1999). Changing Leadership for Changing
Times. Philadelphia: Open University Press. Retrieved April 4, 2012, from
http://www.questia.com/PM.qst?a=o&d=115651688
Lemons, R., Luschei, T. F., & Siskin, L. S. (2003). Leadership and the demands of
standards based accountability. In M. Carnoy, R. Elmore, and L. Siskin (Eds.),
The new accountability: High schools and high-stakes testing (pp. 99-127). New
York: Routledge
Lezotte, L. W. (1993). We can't use yesterday's standards anymore creating effective
schools today and tomorrow. Journal for Quality and Participation, 16(1), 22-30.
Marzano, R. J. (2003). What works in schools: Translating research into action.
Alexandria, VA: Association for Supervision and Curriculum Development.
Retrieved from http://www.questia.com/PM.qst?a=o&d=111480083
Marzano, R. J., Waters, T., & McNulty, B. A. (2005). School leadership that works:
From research to results. Alexandria, VA: Association for Supervision and
Curriculum Development.
National Commission on Excellence in Education (1983). A nation at risk -
Recommendations. Retrieved from
http://www2.ed.gov/pubs/NatAtRisk/recomm.html
O'Day, J.A. (2002). Complexity, Accountability, and School Improvement. Harvard
Educational Review, 72(3), 293-329.
Patterson, J. C. (2000). Texas' TAAS Miracle or Mirage?. Curriculum Administrator, 36,
30. Retrieved from http://www.questia.com/PM.qst?a=o&d=5001077673
Texas Tech University, Bynum Blake Hightower, May 2012
101
Pigge, F. L., & Marso, R. N. (1990). A longitudinal assessment of the affective impact of
preservice training on prospective teachers. Journal of Experimental Education,
58(4), 283-289. Retrieved from:
http://www.questia.com/PM.qst?a=o&d=96392092
Ream, R. K. (2005). Uprooting children: Mobility, social capital, and Mexican American
underachievement. New York: LFB Scholarly Publishing. Retrieved from
http://www.questia.com/PM.qst?a=o&d=111530126
Scott, C., & Bagaka’s, J. G. (2006). Teacher efficacy, school reform, and state tests.
Academic Exchange Quarterly, 10(3), 178-182.
Senge, P. (1990) The Fifth Discipline, The Art and Practice of the Learning
Organization. United States: Doubleday
Sergiovanni, T. (2001) Leadership: What’s in it for schools? London: RoutledgeFalmer.
Srivastava, D. K. (2007). Measuring stages of concern of management academia about
information technology based education. Advances in Competitiveness Research,
15(1/2), 116-132. Retrieved from:
http://www.questia.com/PM.qst?a=o&d=5044892601
Stella C. Batagiannis (2007). Leadership guided by courage: A challenge to instantaneous
perfection. Journal of Educational Thought.41 (2), 145-164.
Stollar, S. A., Poth, R. L., Curtis, M. J., & Cohen, R. M. (2006). Collaborative strategic
planning as illustration of the principles of systems change. School Psychology
Review, 35(2), 181-195. Retrieved from:
http://www.questia.com/PM.qst?a=o&d=5016029316
Texas Tech University, Bynum Blake Hightower, May 2012
102
Stringfield, S. (2007). Improvements in academic achievement among african american
students over time: National data and an urban case study. The Journal of Negro
Education, 76(3), 306-315. Retrieved from
http://www.questia.com/PM.qst?a=o&d=5035231353
Stringfield, S. C. & Yakimowski-Srebnick, M.E. (2005). Promise, progress, problems,
and paradoxes of three phases of accountability: A longitudinal case study of the
Baltimore City public schools. American Educational Research Journal, 42(1),
43-75
Sunbul, A. M. (2003). An Analysis of Relations among Locus of Control, Burnout and
Job Satisfaction in Turkish High School Teachers. Australian Journal of
Education, 47(1), 58-70. Retrieved from:
http://www.questia.com/PM.qst?a=o&d=5001941544
Texas Administrative Code, Standards required for the Principal Certificate 19.7§241.15
(2009) Retrieved from
http://info.sos.state.tx.us/pls/pub/readtac$ext.TacPage?sl=R&app=9&p_dir=&p_r
loc=&p_tloc=&p_ploc=&pg=1&p_tac=&ti=19&pt=7&ch=241&rl=15
Texas Education Code, Principals §11.202(a) (1995). Retrieved from
http://www.statutes.legis.state.tx.us/Docs/ED/htm/ED.11.htm#11.202
Texas Education Code, Sub Chapter F. District-Level and Site-Based Decision-Making
§11.251(b) (2011). Retrieved from
http://www.statutes.legis.state.tx.us/Docs/ED/htm/ED.11.htm#11.251
Texas Tech University, Bynum Blake Hightower, May 2012
103
The Texas Education Service Center Curriculum Collaborative (TESCCC), (2012a).
Welcome. Retreived from http://www.cscope.us/index.html
The Texas Education Service Center Curriculum Collaborative (TESCCC), (2012b).
Delivering a guaranteed, viable curriculum. Retrieved from
http://www.cscope.us/docs/cscope_components_%204.1.10.pdf
Thornton, B., Hill, G., & Usinger, J. (2006). An examination of a fissure within the
implementation of the nclb accountability process. Education, 127(1), 115- 120.
Retrieved from http://www.questia.com/PM.qst?a=o&d=5017885416
Truesdale, V., Thompson, C., & Lucas, M. (2004). Use of curriculum mapping to build a
learning community. In H. Jacobs (ED.), Getting results with curriculum mapping
(pp.10-24). Alexandria, Virginia: Association for Supervision and Curriculum
Development.
Vega, T. & Travis, B. (2011). An investigation of the effectiveness of reform
mathematics curricula analyzed by ethnicity, socio-economic status and limited
english proficiency. Mathematics and Computer Education, 45(1), 10 - 22.
Retrieved from: http://www.questia.com/PM.qst?a=o&d=5047816829
Waring, S.P. (1991). Taylorism transformed: Scientific Management Theory since 1945.
Chapel Hill, North Carolina: University of North Carolina Press.
Weick, K. E. & Quinn, R. E. (1999). Organizational change and development. Annual
Review of Psychology, 50, 361-386.
Texas Tech University, Bynum Blake Hightower, May 2012
104
White, T., Loker, T., March, A., & Sockslager, K. (2009). Is NCLB closing the minority-
majority achievement gap?. National Association of School Psychologists.
Communique, 37(8), 1,16-17. Retrieved from
http://www.questia.com/PM.qst?a=o&d=5045041680
Wiggins, G., & McTighe, J. (2005). Understanding by Design (Expanded ed.).
Alexandria, VA: Association for Supervision and Curriculum Development.
Retrieved from http://www.questia.com/PM.qst?a=o&d=111475322
Willis, P. (1981). Learning to Labor: How Working Class Kids Get Working Class Jobs.
New York: Columbia University Press. Retrieved from
http://www.questia.com/PM.qst?a=o&d=30758277

Texas Tech University, Bynum Blake Hightower, May 2012
105
Appendix A
5-E Model of Instruction
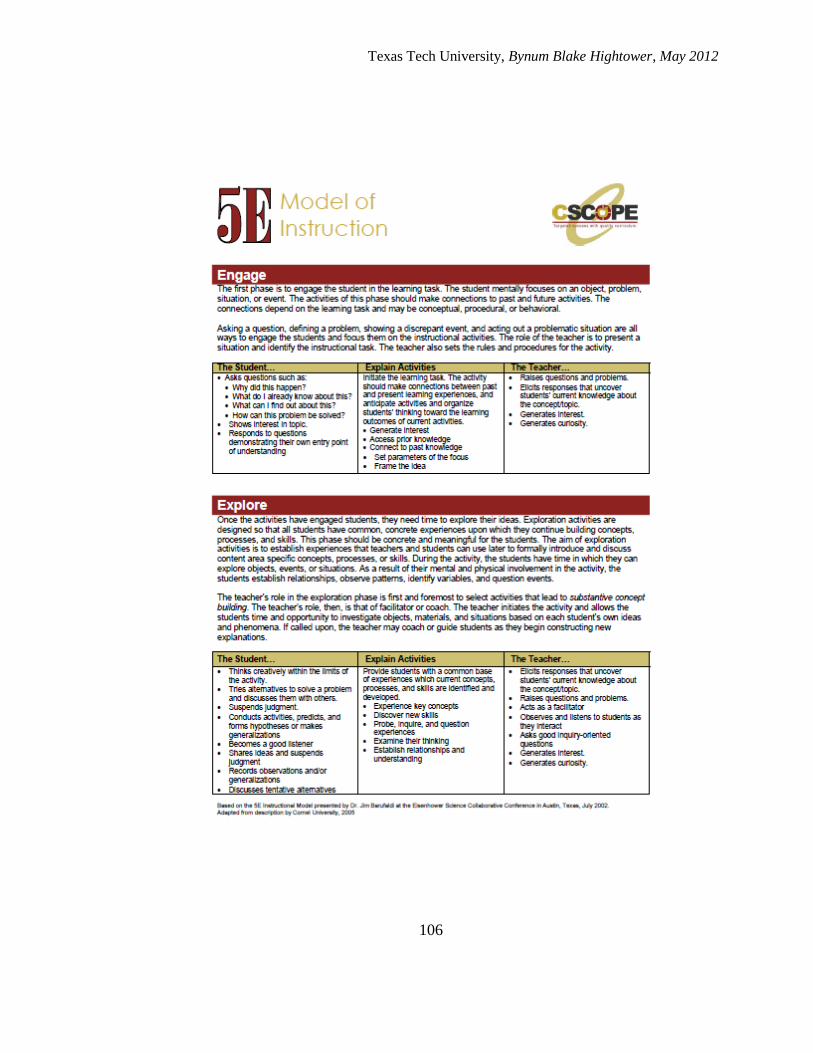
Texas Tech University, Bynum Blake Hightower, May 2012
106
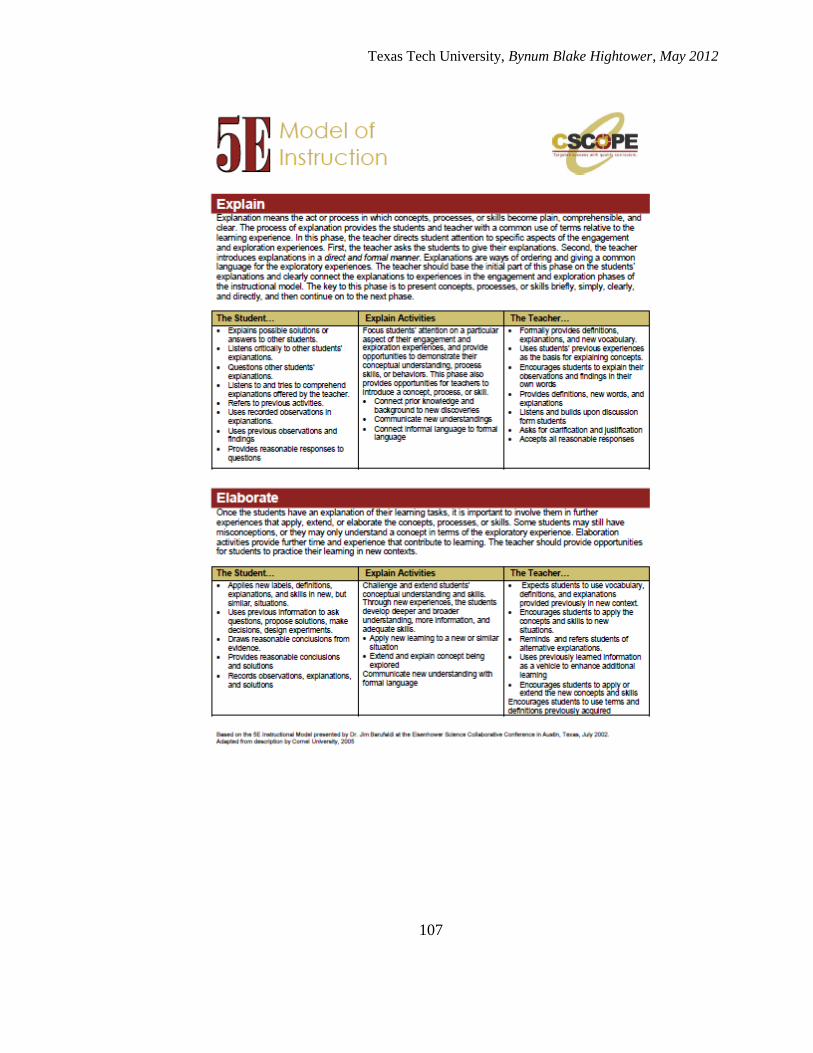
Texas Tech University, Bynum Blake Hightower, May 2012
107
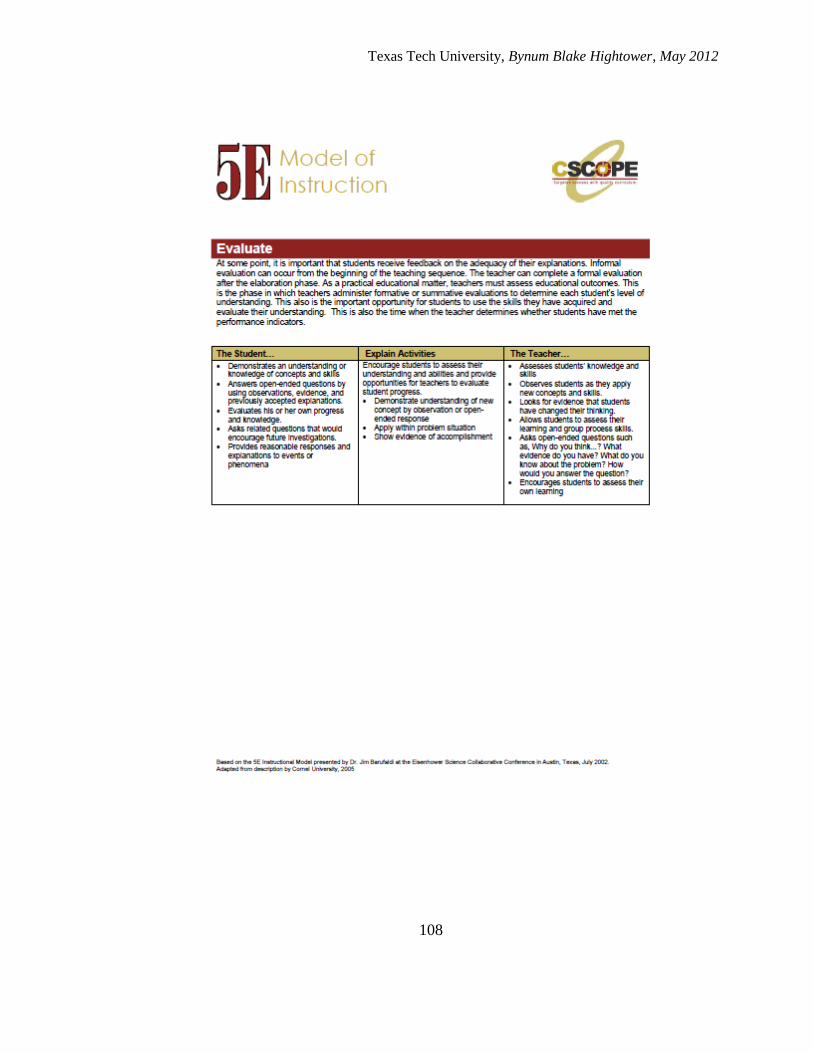
Texas Tech University, Bynum Blake Hightower, May 2012
108
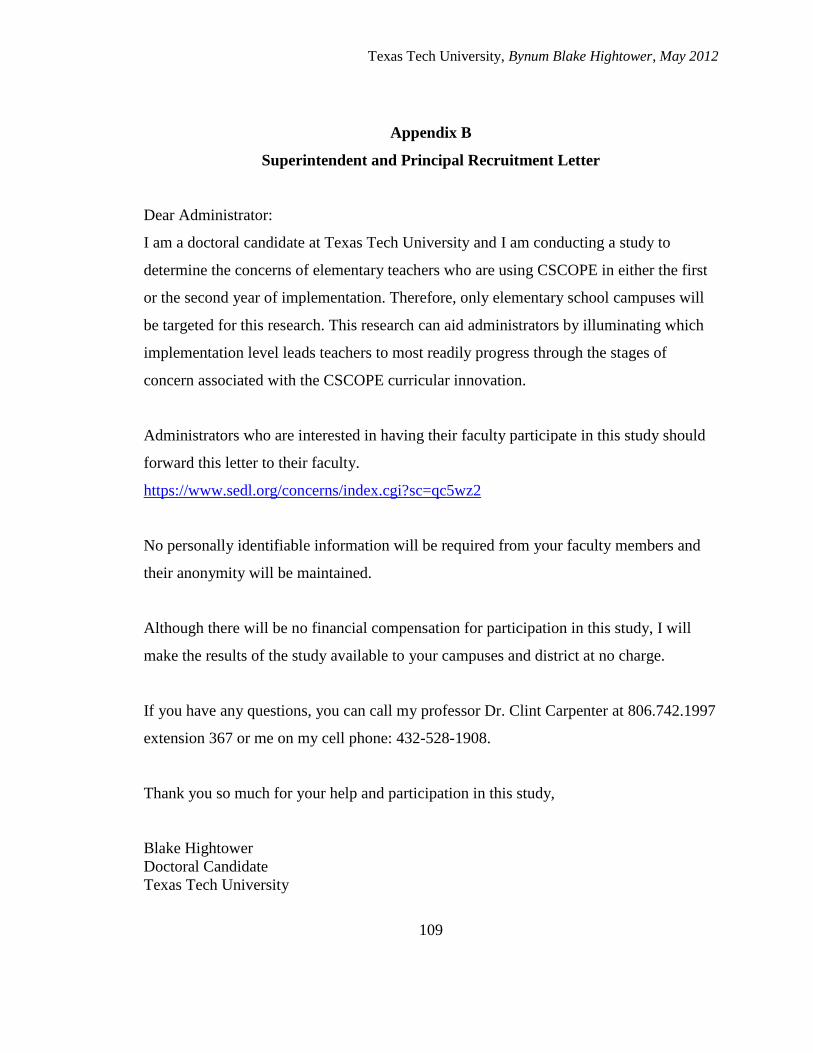
Texas Tech University, Bynum Blake Hightower, May 2012
109
Appendix B
Superintendent and Principal Recruitment Letter
Dear Administrator:
I am a doctoral candidate at Texas Tech University and I am conducting a study to
determine the concerns of elementary teachers who are using CSCOPE in either the first
or the second year of implementation. Therefore, only elementary school campuses will
be targeted for this research. This research can aid administrators by illuminating which
implementation level leads teachers to most readily progress through the stages of
concern associated with the CSCOPE curricular innovation.
Administrators who are interested in having their faculty participate in this study should
forward this letter to their faculty.
https://www.sedl.org/concerns/index.cgi?sc=qc5wz2
No personally identifiable information will be required from your faculty members and
their anonymity will be maintained.
Although there will be no financial compensation for participation in this study, I will
make the results of the study available to your campuses and district at no charge.
If you have any questions, you can call my professor Dr. Clint Carpenter at 806.742.1997
extension 367 or me on my cell phone: 432-528-1908.
Thank you so much for your help and participation in this study,
Blake Hightower
Doctoral Candidate
Texas Tech University

Texas Tech University, Bynum Blake Hightower, May 2012
110
Appendix C
Participant Recruitment Letter
Participant Information Letter
What is this project studying?
The study is called; The Affective Response to Mandated Change in Schools: Stages of
Concern for Teachers in the First and Second Year of CSCOPE Curriculum
Implementation This study will help explore how teachers feel about mandated
innovations and changes affecting their professional lives.
What should I expect during this study?
Teachers will participate in a 35 question online survey. Aggregation and analysis of
anonymous responses will then be studied and provided to administrators to inform them
of the affective response of teachers relative to the implementation of CSCOPE.
Am I required to participate in this survey?
No teacher, campus administrator, or district should feel pressure to participate in the
study. This study is designed to inform leadership of how teachers feel and think about
changes relative to top-down mandates. You may quit the online survey at any time by
closing your browser window. You may skip questions, or omit any information
requested as part of the survey.
How long will the online survey take?
The survey will take approximately 30 minutes of your time.
How is privacy protected?
No, personally identifiable information will be collected during the study, so teachers can
feel free to respond openly. In addition, district and campus leadership will only receive
averages from content area teacher responses.
To whom should I address questions regarding this study?
The study is being supervised by Dr. Clint Carpenter from the Educational Leadership
Department at Texas Tech University. If you have any questions, you can call Dr.
Carpenter at 806.742.1997 extension 273. TTU has a Board that protects the rights of
people who participate in research. You can ask questions at 806-742-2064. You can also
mail them at Institutional Review Board for the Protection of Human Subjects, Office of
the Vice President for Research, Texas Tech University, Lubbock, Texas 79409.
How will I benefit from participating?
District and campus leaders will have access to the quantitative data provided through the
study. This will inform the leadership of the affective response of teachers to not only
CSCOPE curriculum, but to any other innovation affecting the campus and district
organization.
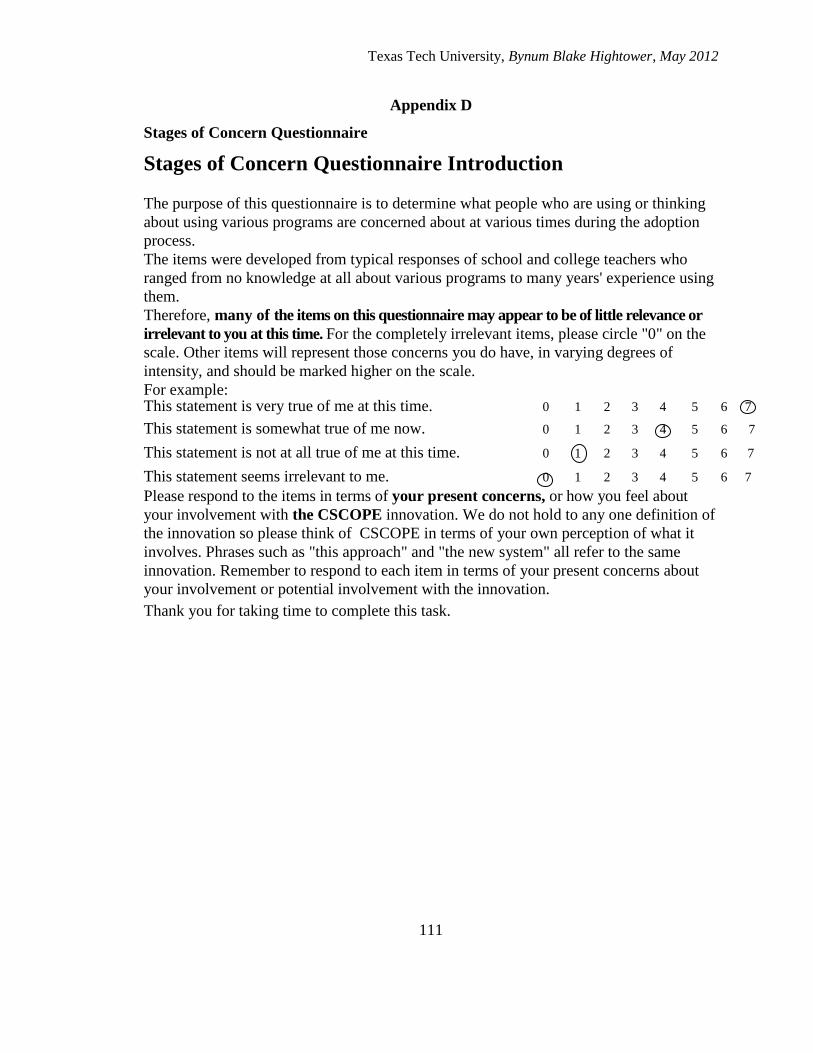
Texas Tech University, Bynum Blake Hightower, May 2012
111
Appendix D
Stages of Concern Questionnaire
Stages of Concern Questionnaire Introduction
The purpose of this questionnaire is to determine what people who are using or thinking
about using various programs are concerned about at various times during the adoption
process.
The items were developed from typical responses of school and college teachers who
ranged from no knowledge at all about various programs to many years' experience using
them.
Therefore, many of the items on this questionnaire may appear to be of little relevance or
irrelevant to you at this time. For the completely irrelevant items, please circle "0" on the
scale. Other items will represent those concerns you do have, in varying degrees of
intensity, and should be marked higher on the scale.
For example: This statement is very true of me at this time. 0 1 2 3 4 5 6 7
This statement is somewhat true of me now. 0 1 2 3 4 5 6 7
This statement is not at all true of me at this time. 0 1 2 3 4 5 6 7
This statement seems irrelevant to me. 0 1 2 3 4 5 6 7
Please respond to the items in terms of your present concerns, or how you feel about
your involvement with the CSCOPE innovation. We do not hold to any one definition of
the innovation so please think of CSCOPE in terms of your own perception of what it
involves. Phrases such as "this approach" and "the new system" all refer to the same
innovation. Remember to respond to each item in terms of your present concerns about
your involvement or potential involvement with the innovation.
Thank you for taking time to complete this task.
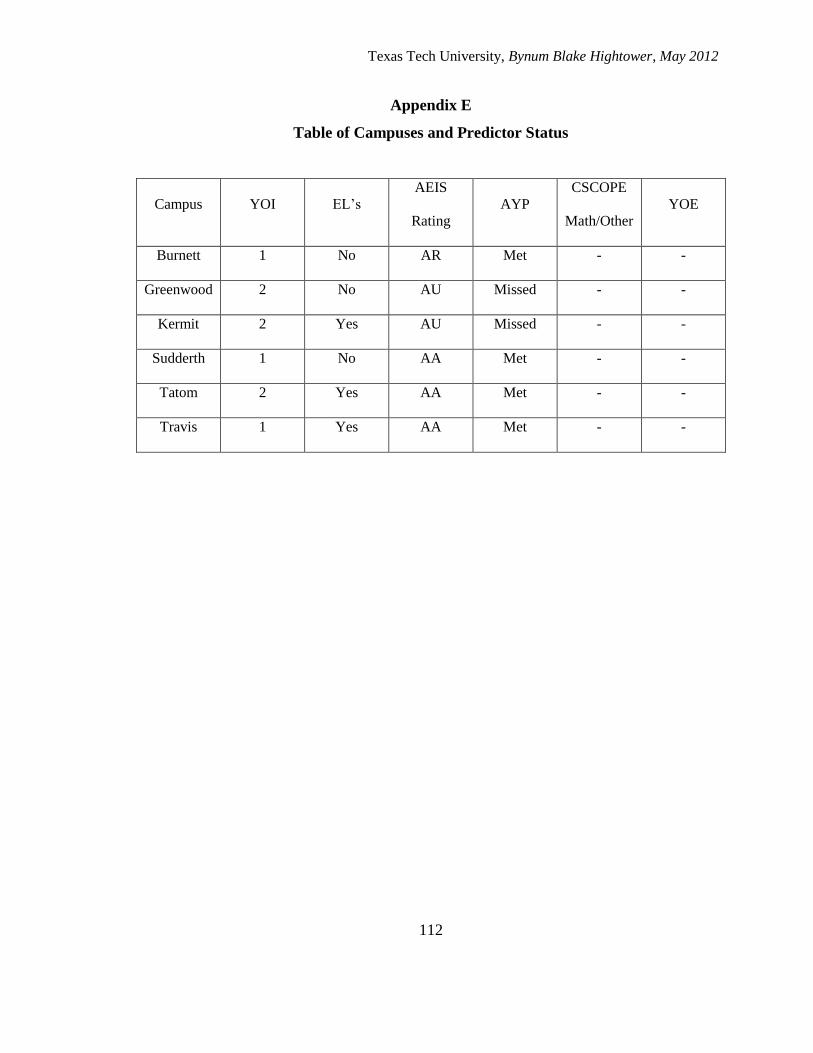
Texas Tech University, Bynum Blake Hightower, May 2012
112
Appendix E
Table of Campuses and Predictor Status
Campus YOI EL’s
AEIS
Rating
AYP
CSCOPE
Math/Other
YOE
Burnett 1 No AR Met - -
Greenwood 2 No AU Missed - -
Kermit 2 Yes AU Missed - -
Sudderth 1 No AA Met - -
Tatom 2 Yes AA Met - -
Travis 1 Yes AA Met - -
Texas Tech University, Bynum Blake Hightower, May 2012
113
Appendix F
Administrator Training
Texas Tech University, Bynum Blake Hightower, May 2012
114
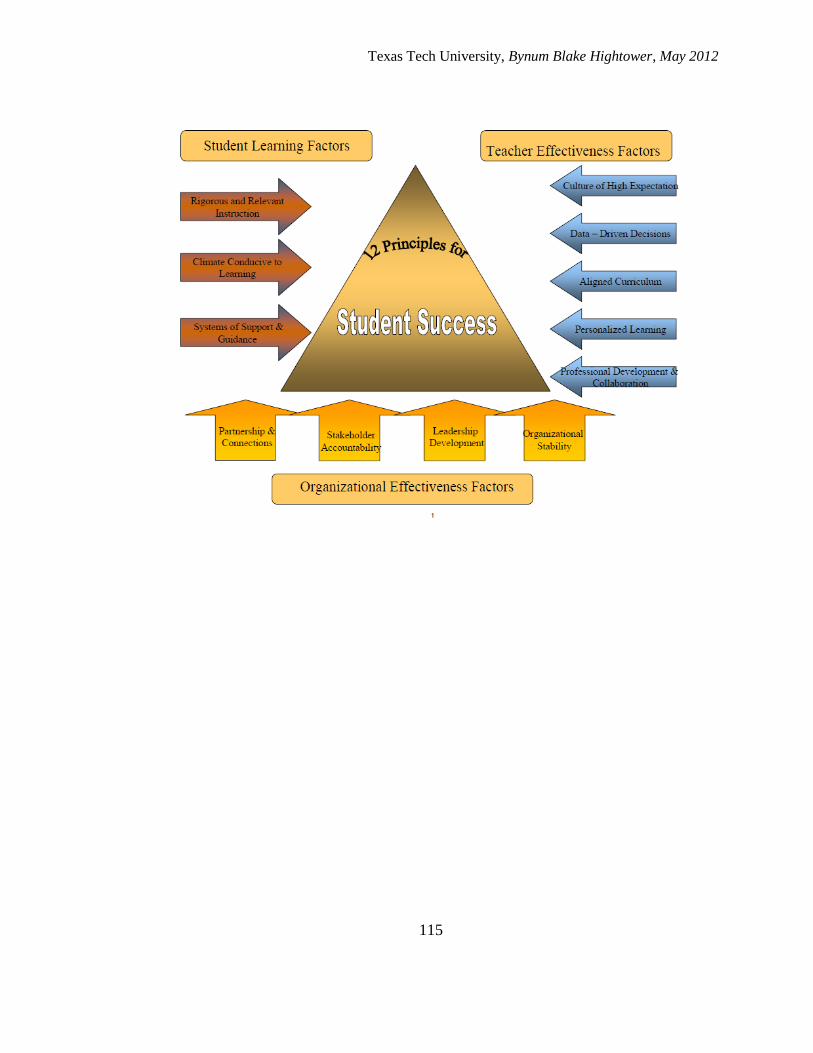
Texas Tech University, Bynum Blake Hightower, May 2012
115
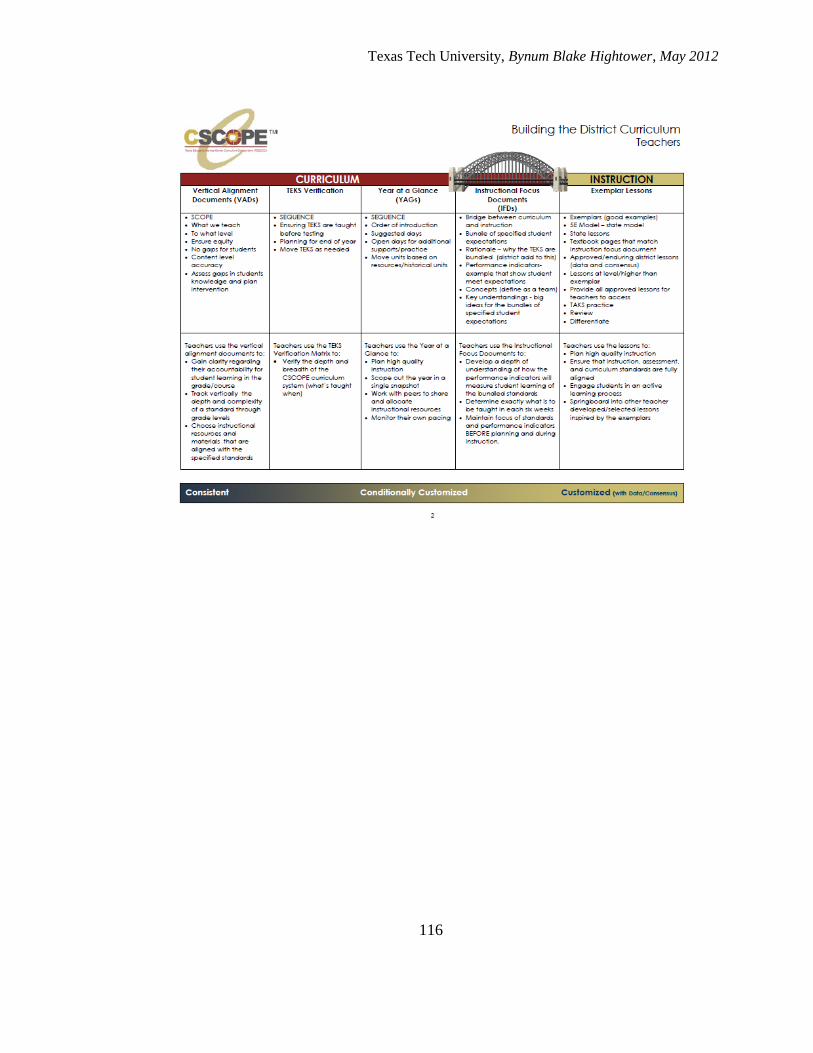
Texas Tech University, Bynum Blake Hightower, May 2012
116
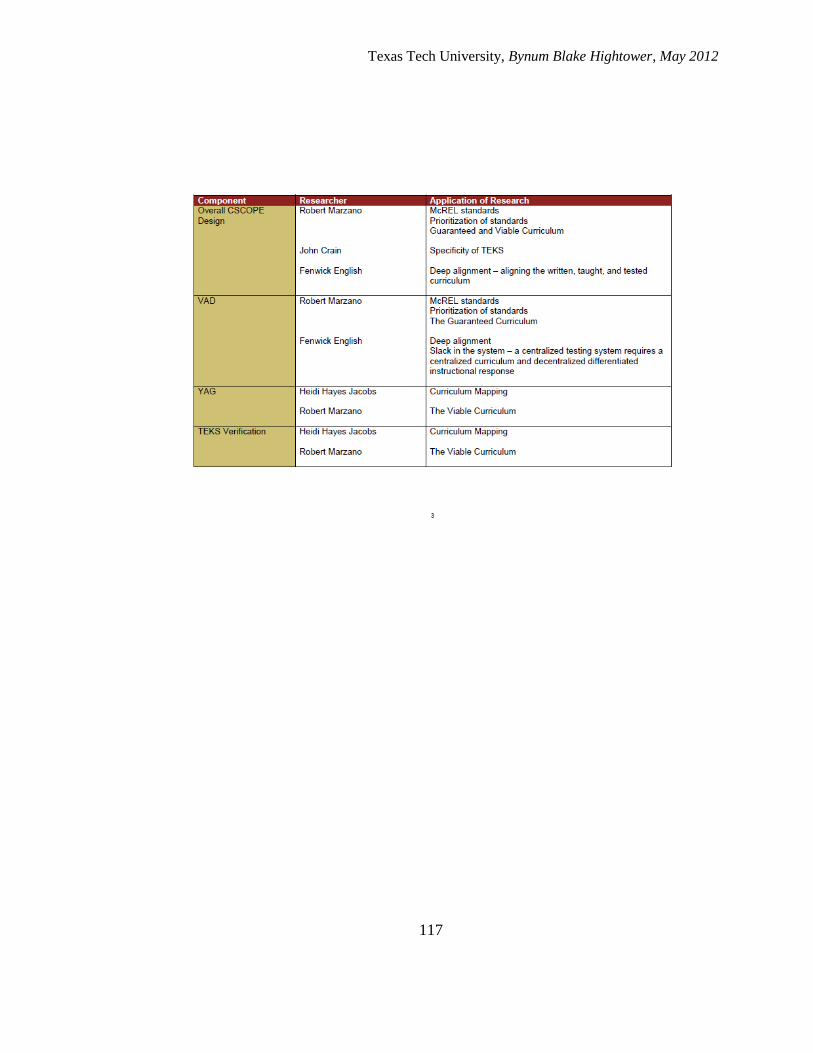
Texas Tech University, Bynum Blake Hightower, May 2012
117
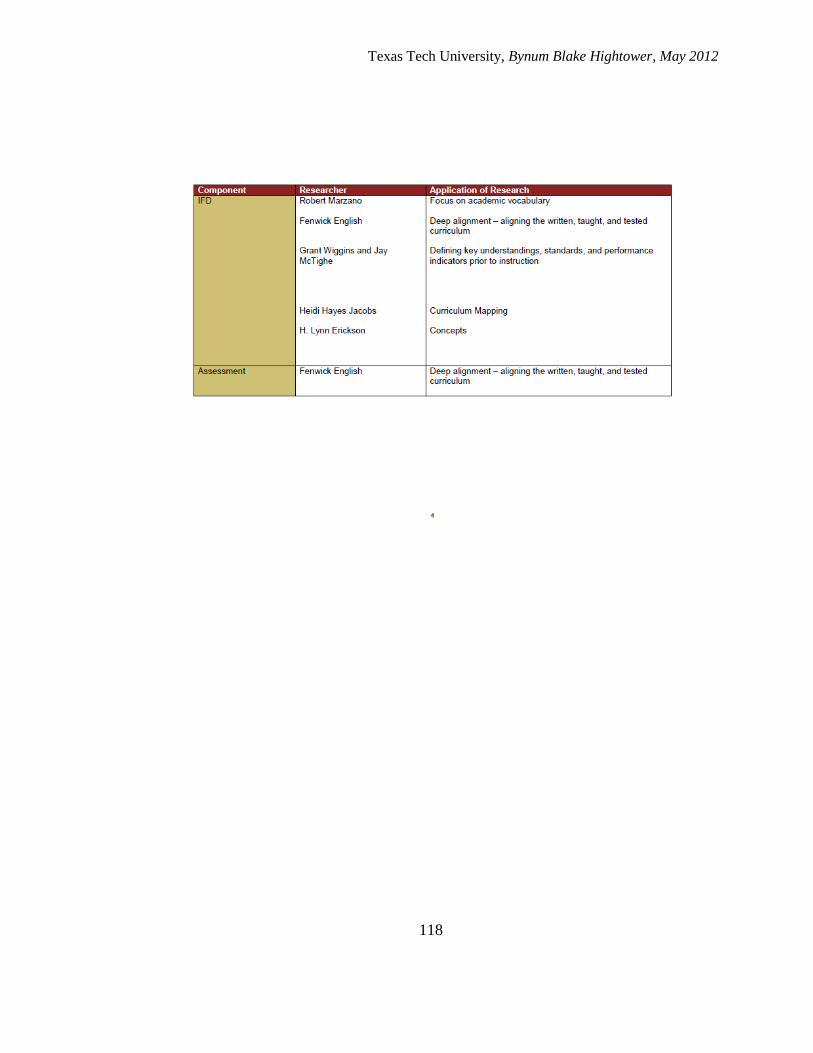
Texas Tech University, Bynum Blake Hightower, May 2012
118
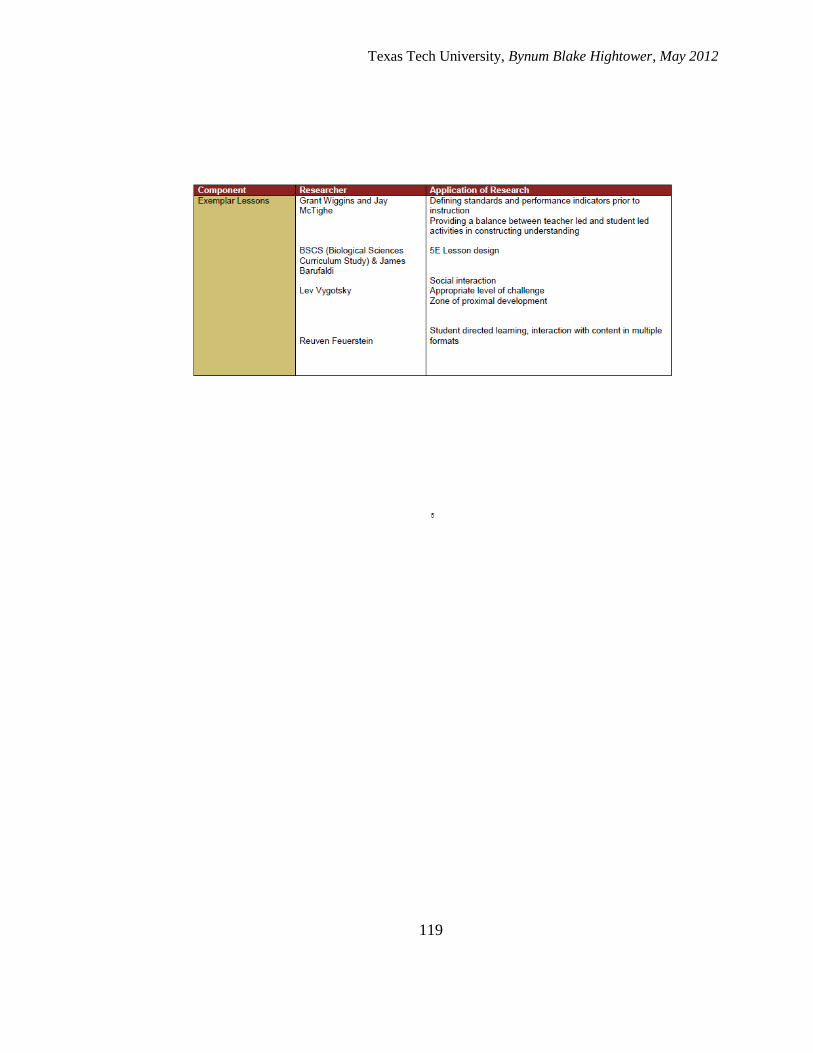
Texas Tech University, Bynum Blake Hightower, May 2012
119
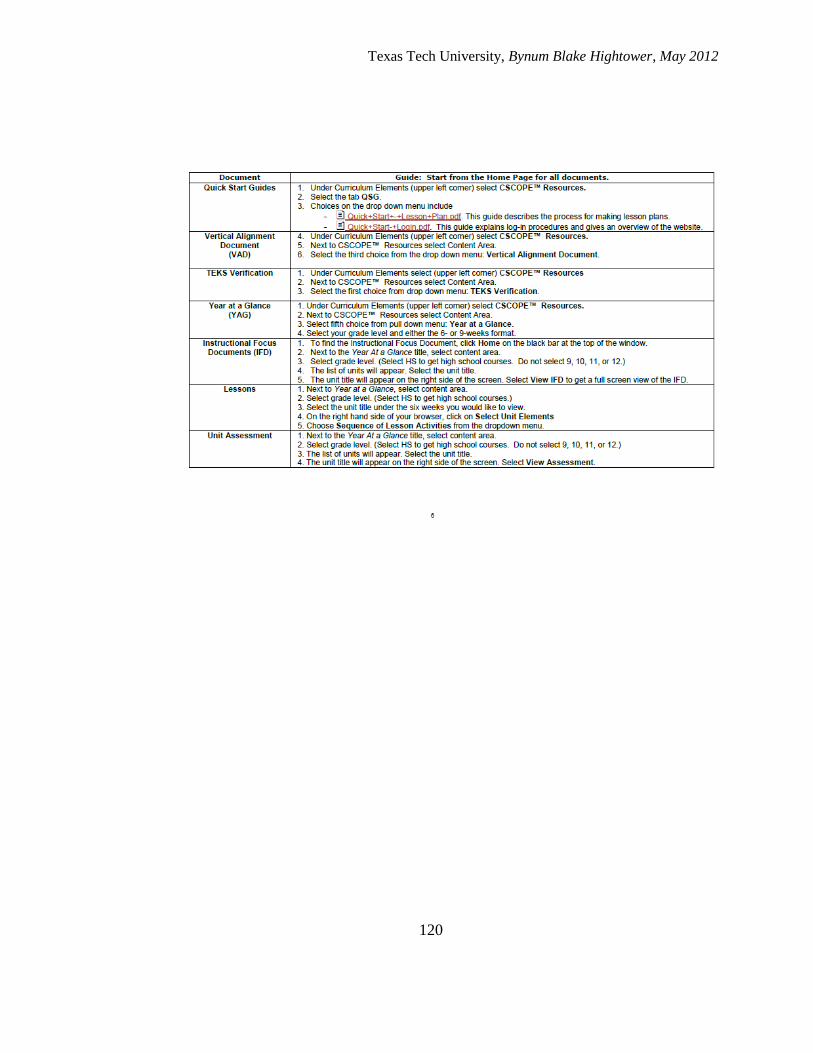
Texas Tech University, Bynum Blake Hightower, May 2012
120
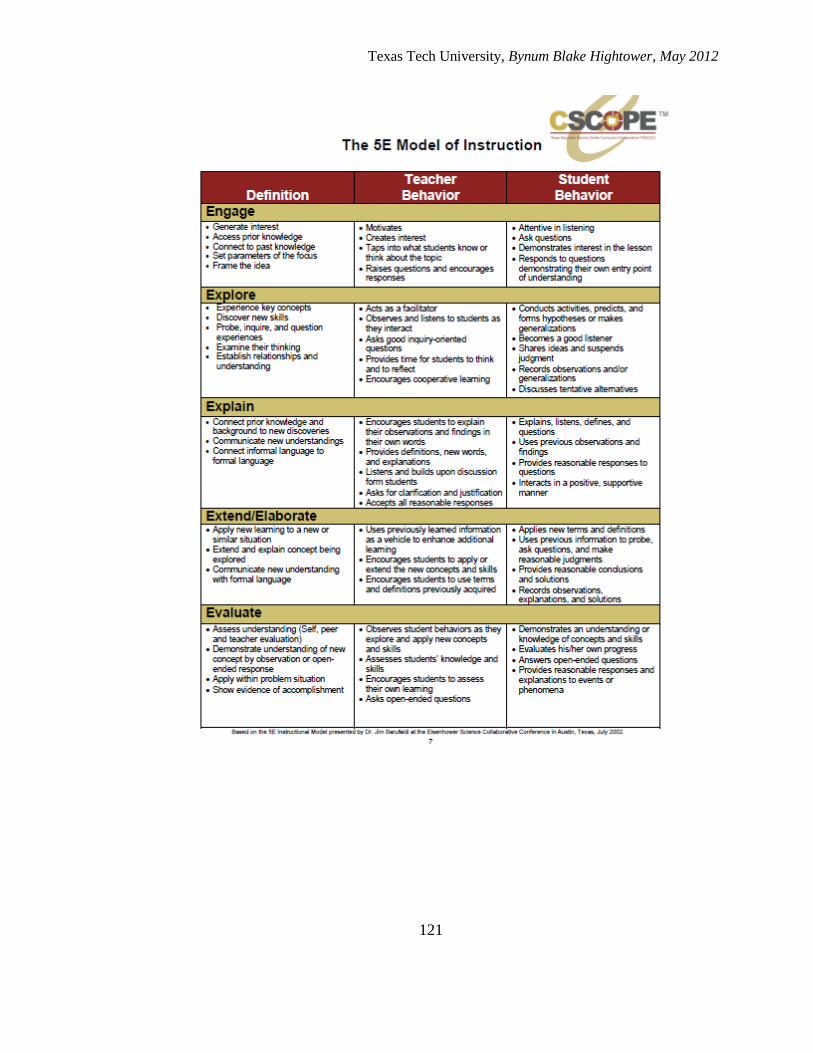
Texas Tech University, Bynum Blake Hightower, May 2012
121
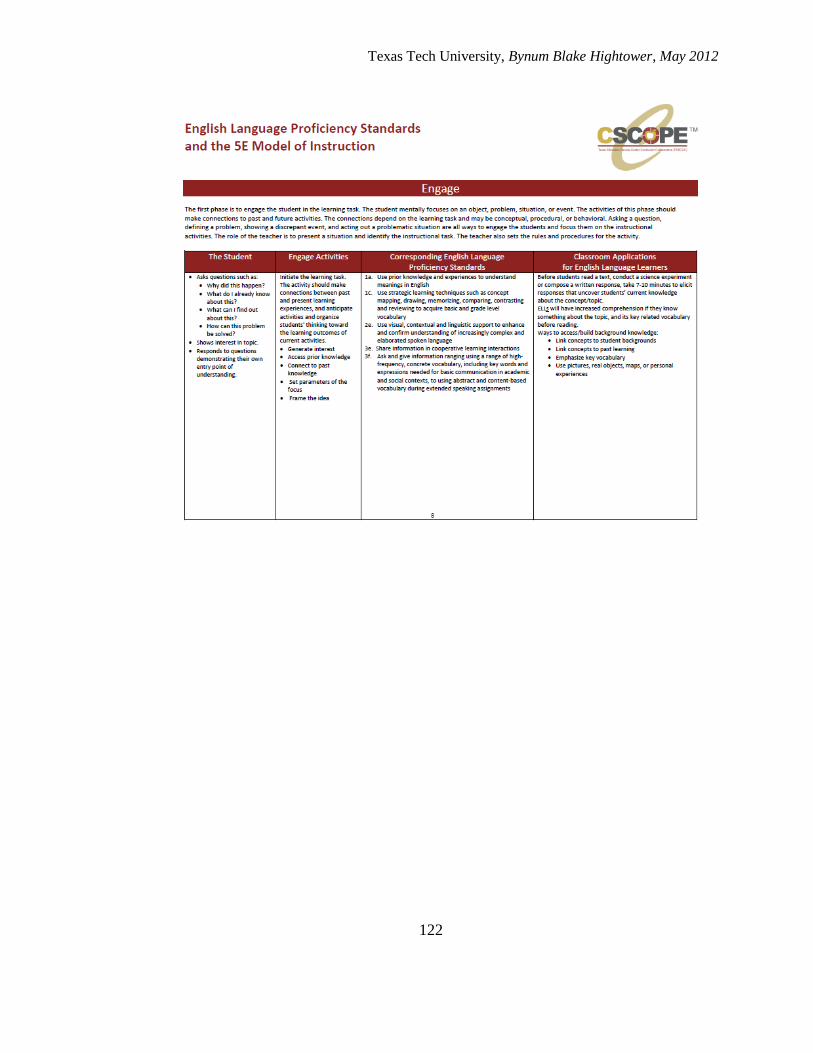
Texas Tech University, Bynum Blake Hightower, May 2012
122
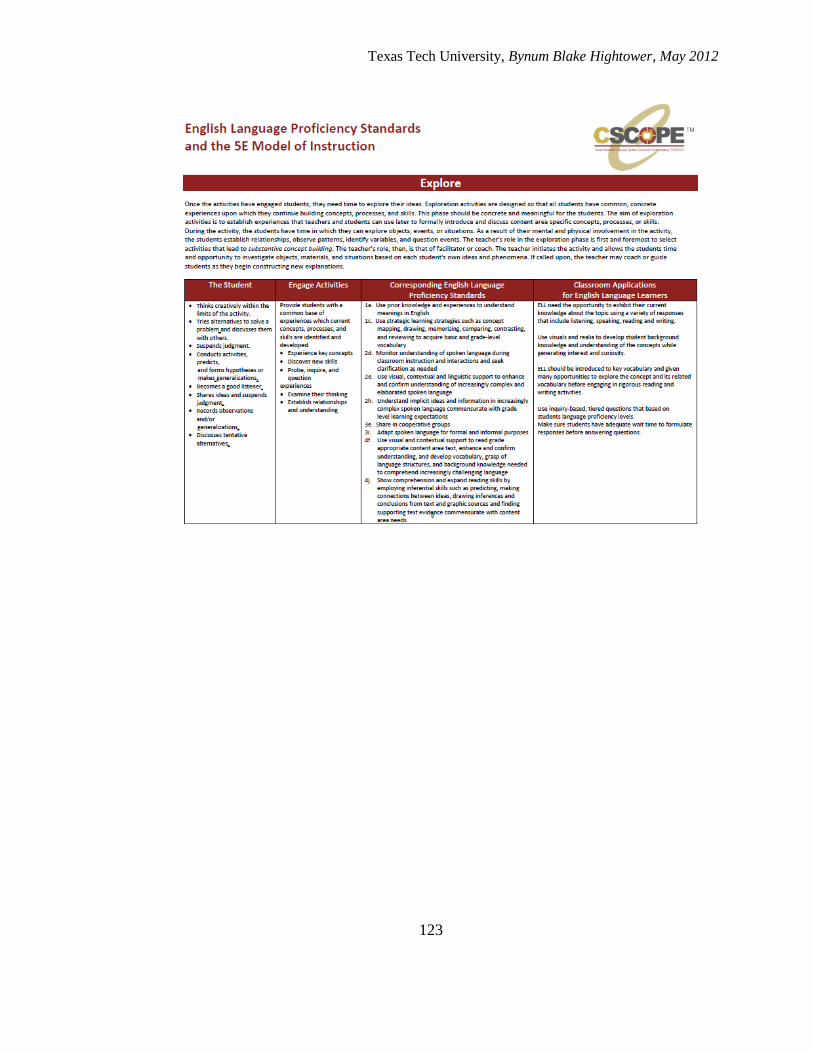
Texas Tech University, Bynum Blake Hightower, May 2012
123
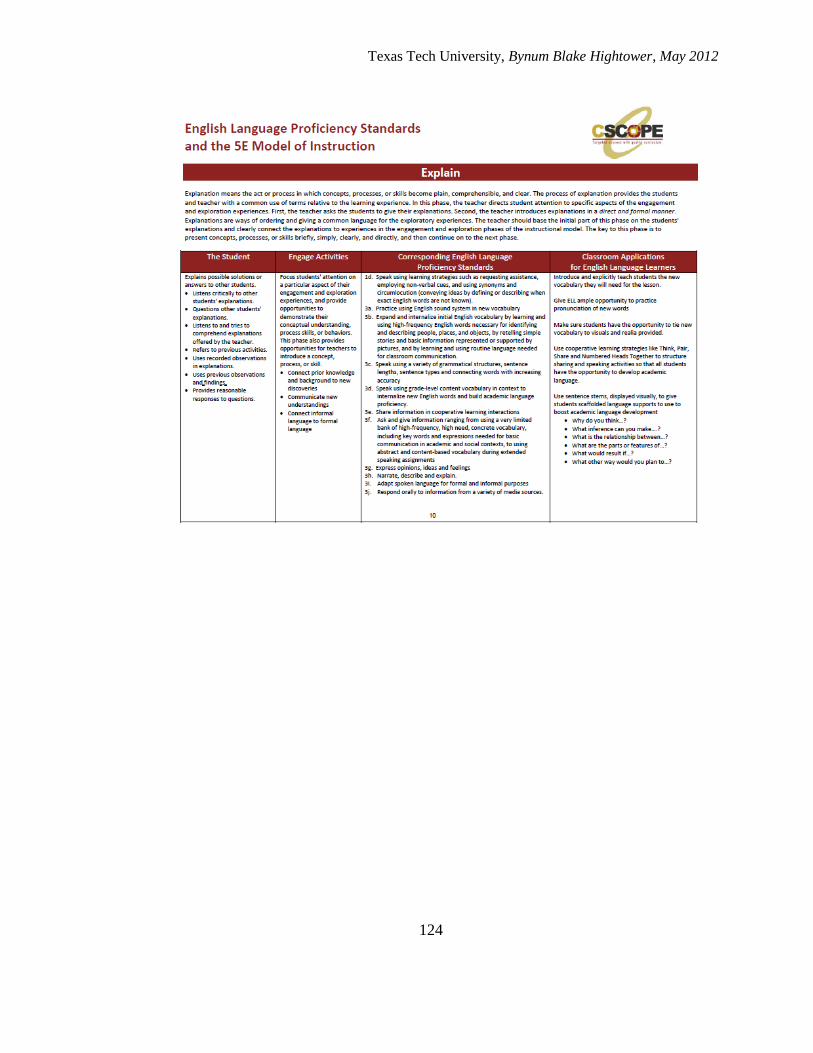
Texas Tech University, Bynum Blake Hightower, May 2012
124
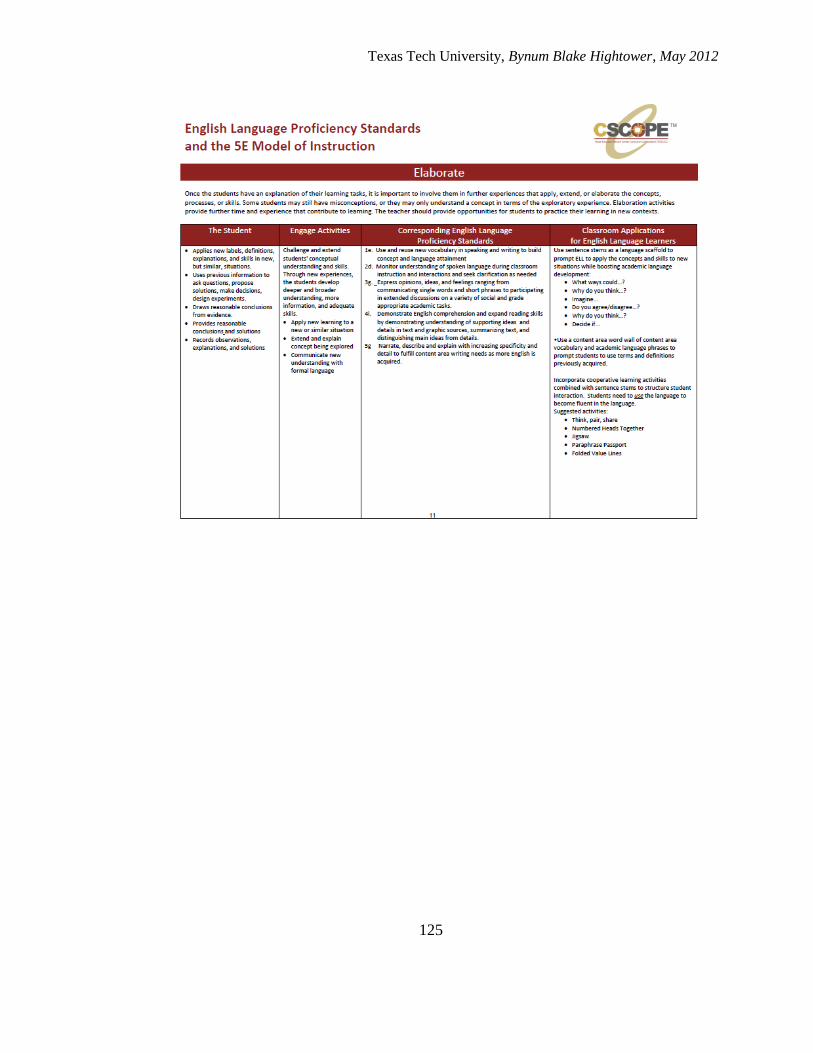
Texas Tech University, Bynum Blake Hightower, May 2012
125
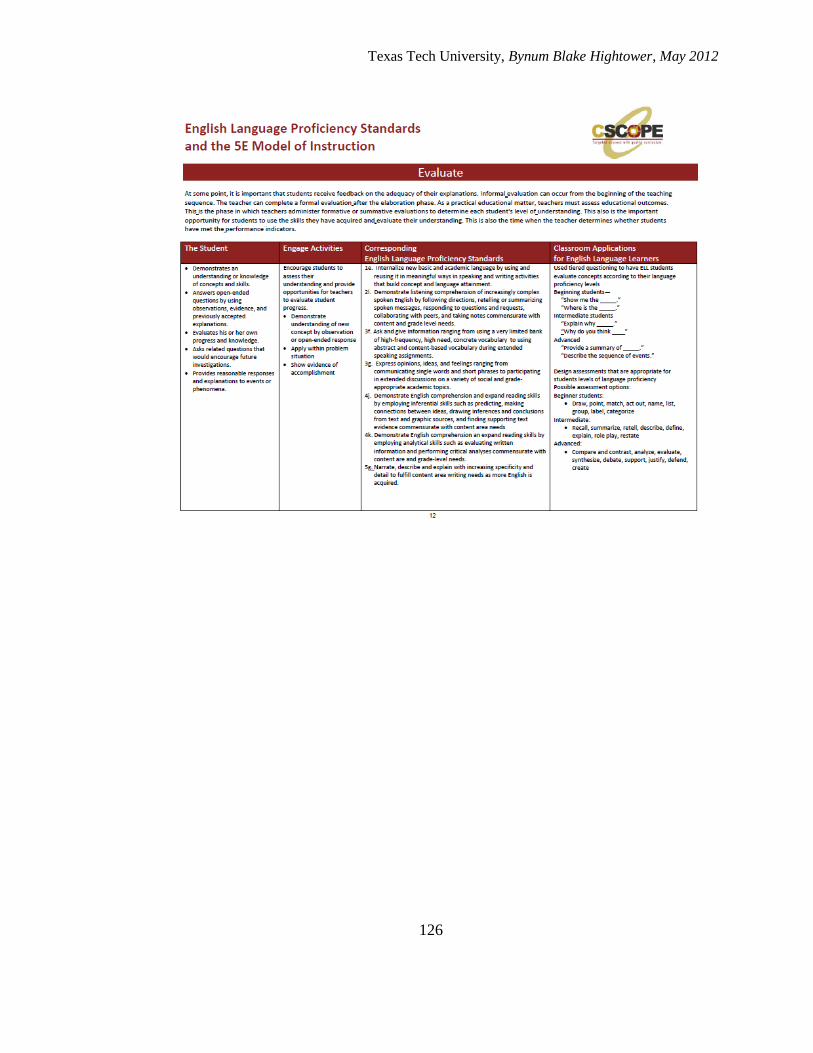
Texas Tech University, Bynum Blake Hightower, May 2012
126
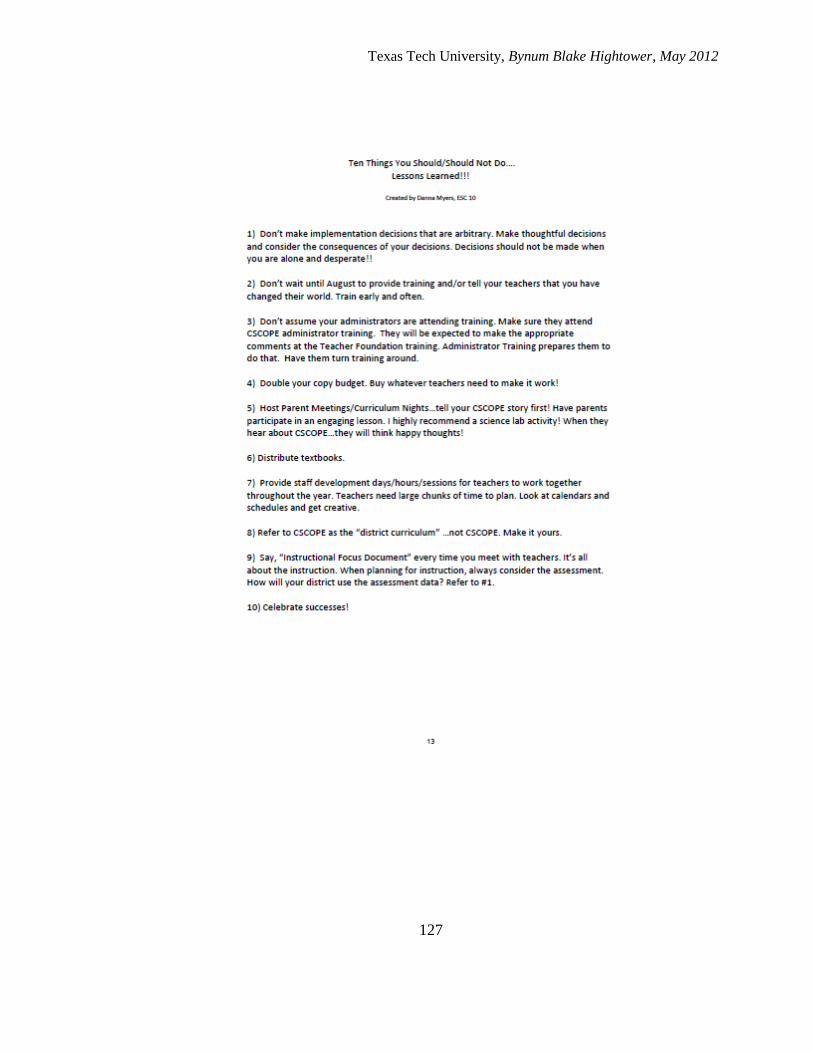
Texas Tech University, Bynum Blake Hightower, May 2012
127
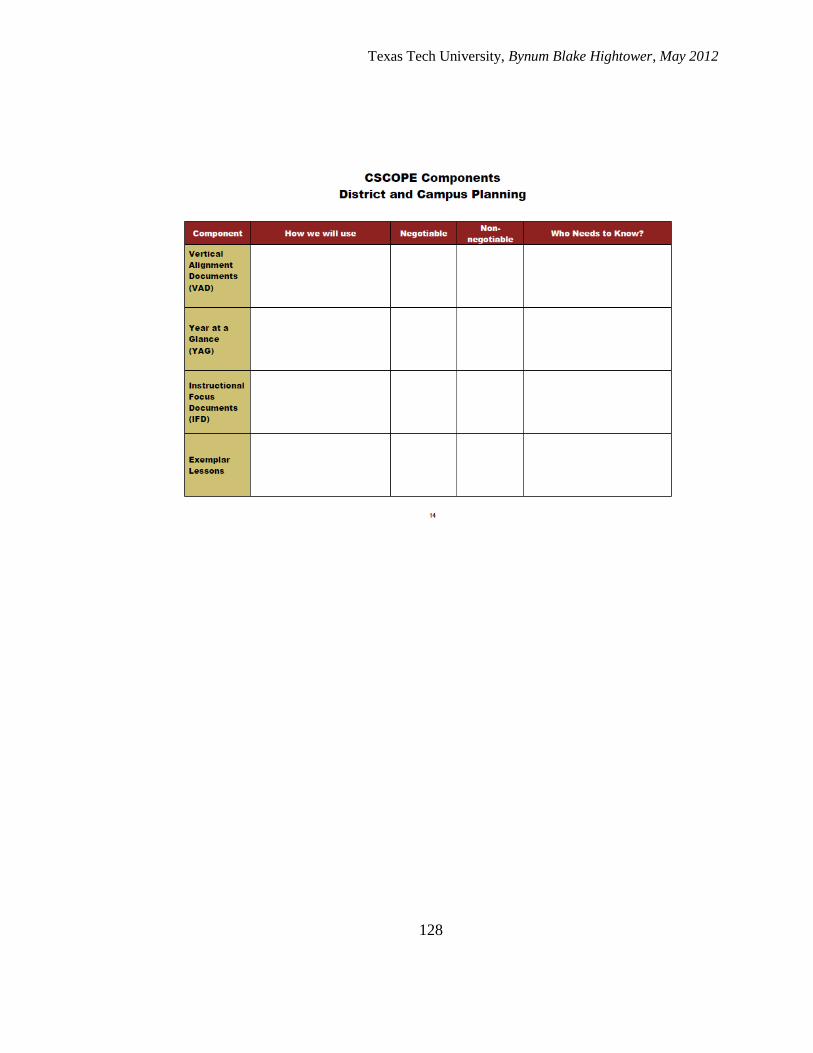
Texas Tech University, Bynum Blake Hightower, May 2012
128
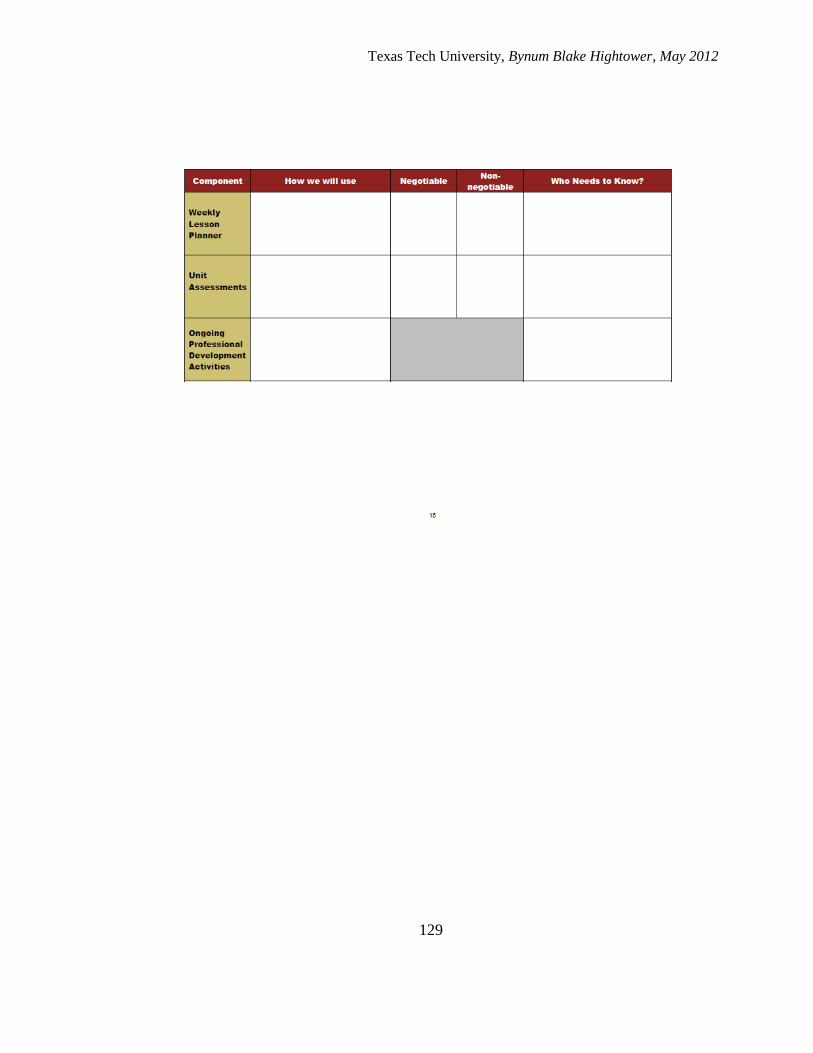
Texas Tech University, Bynum Blake Hightower, May 2012
129
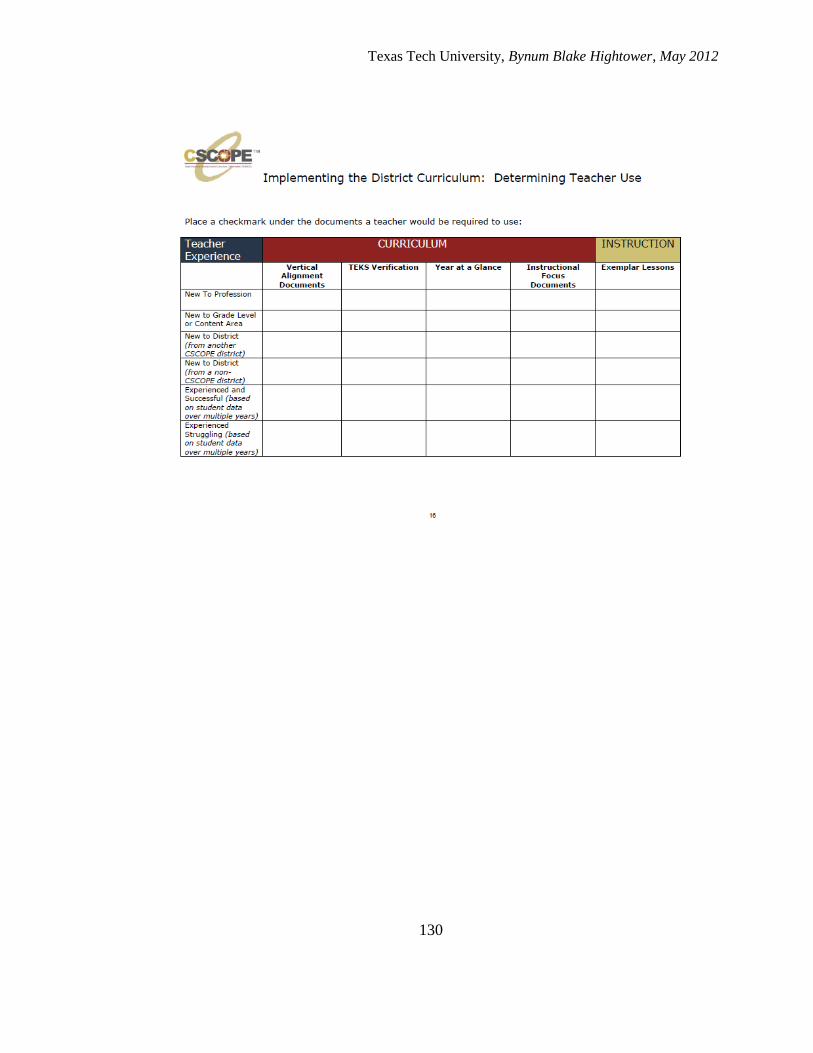
Texas Tech University, Bynum Blake Hightower, May 2012
130
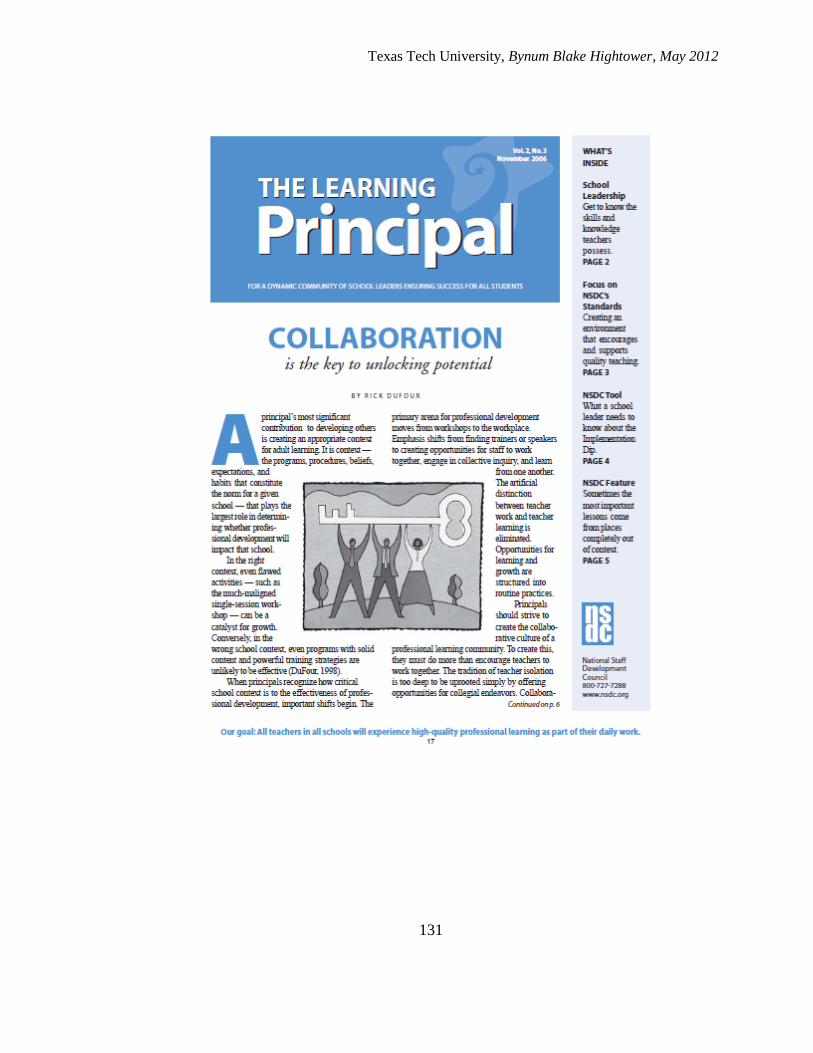
Texas Tech University, Bynum Blake Hightower, May 2012
131

Texas Tech University, Bynum Blake Hightower, May 2012
132
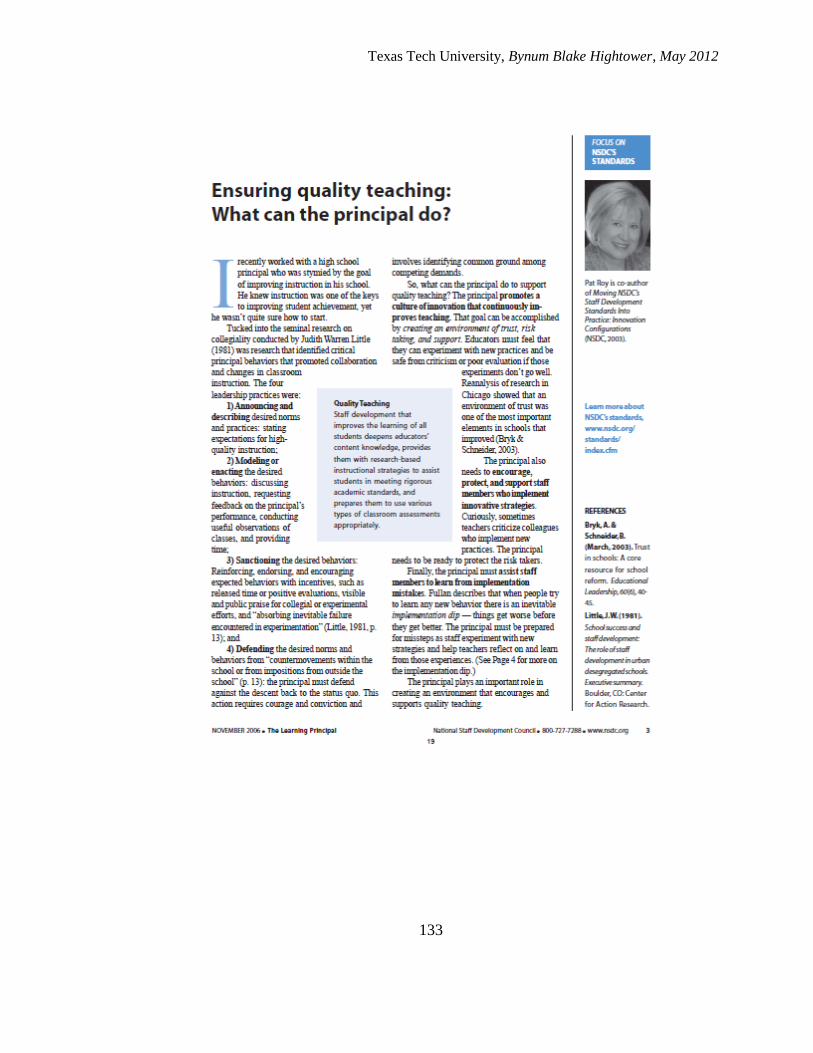
Texas Tech University, Bynum Blake Hightower, May 2012
133
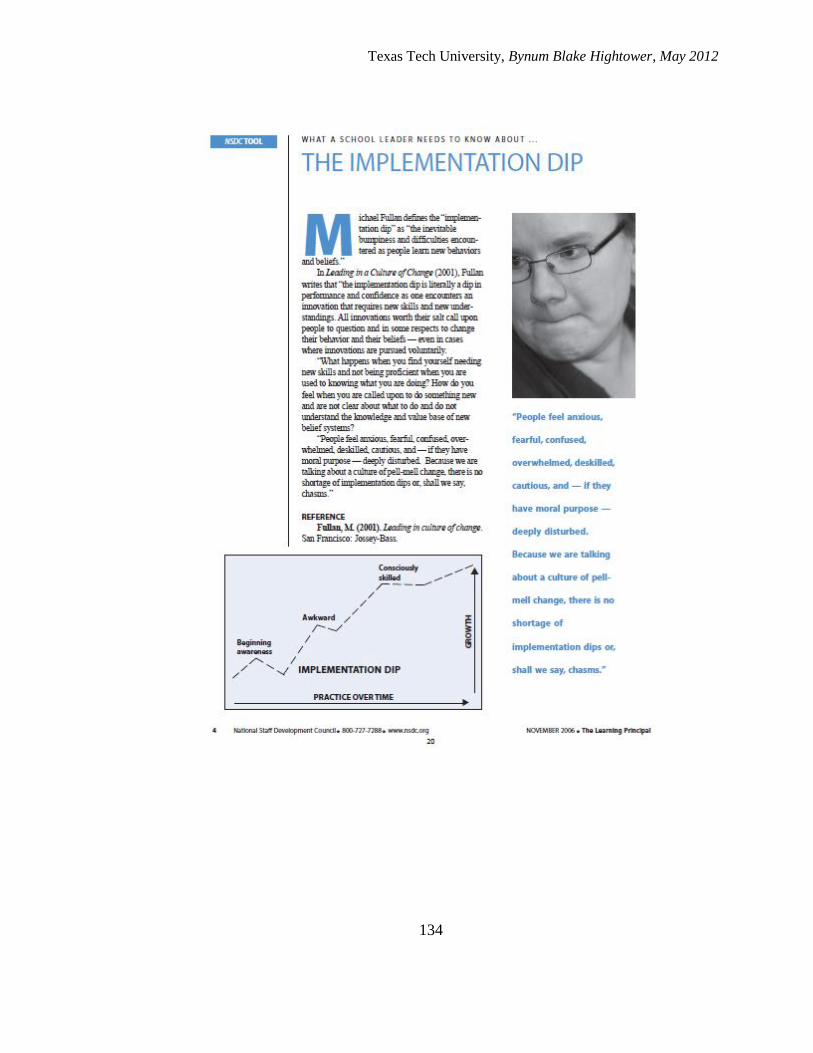
Texas Tech University, Bynum Blake Hightower, May 2012
134
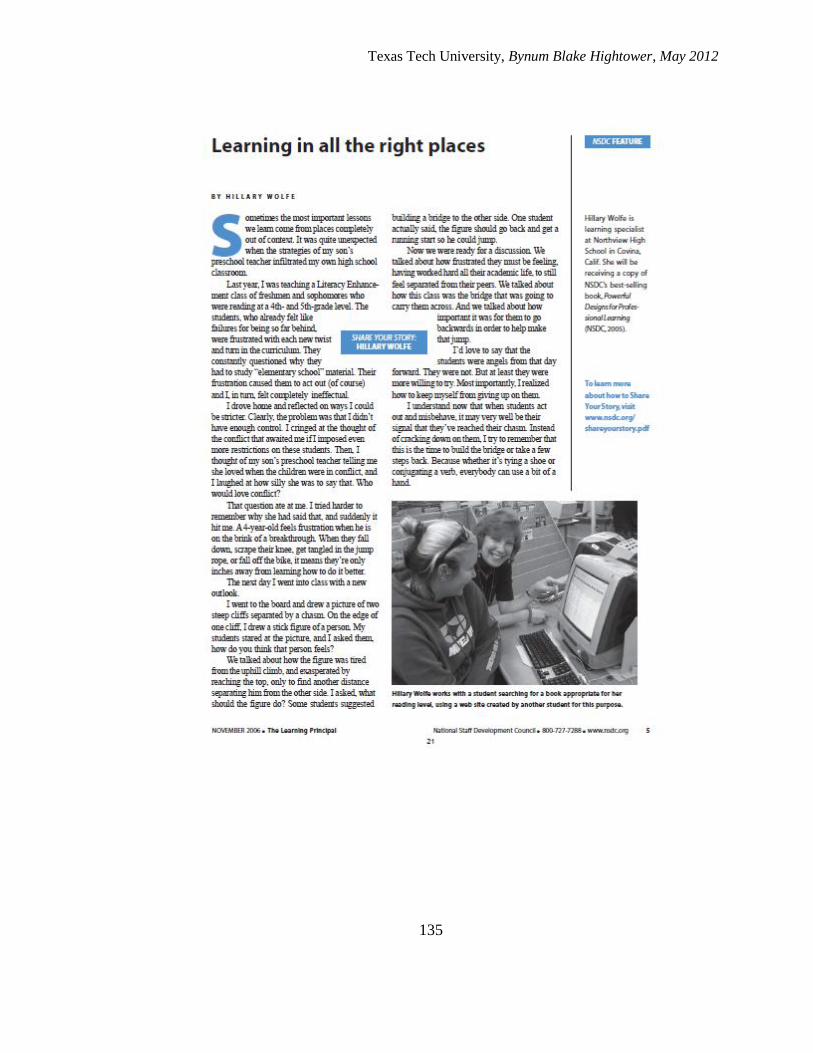
Texas Tech University, Bynum Blake Hightower, May 2012
135
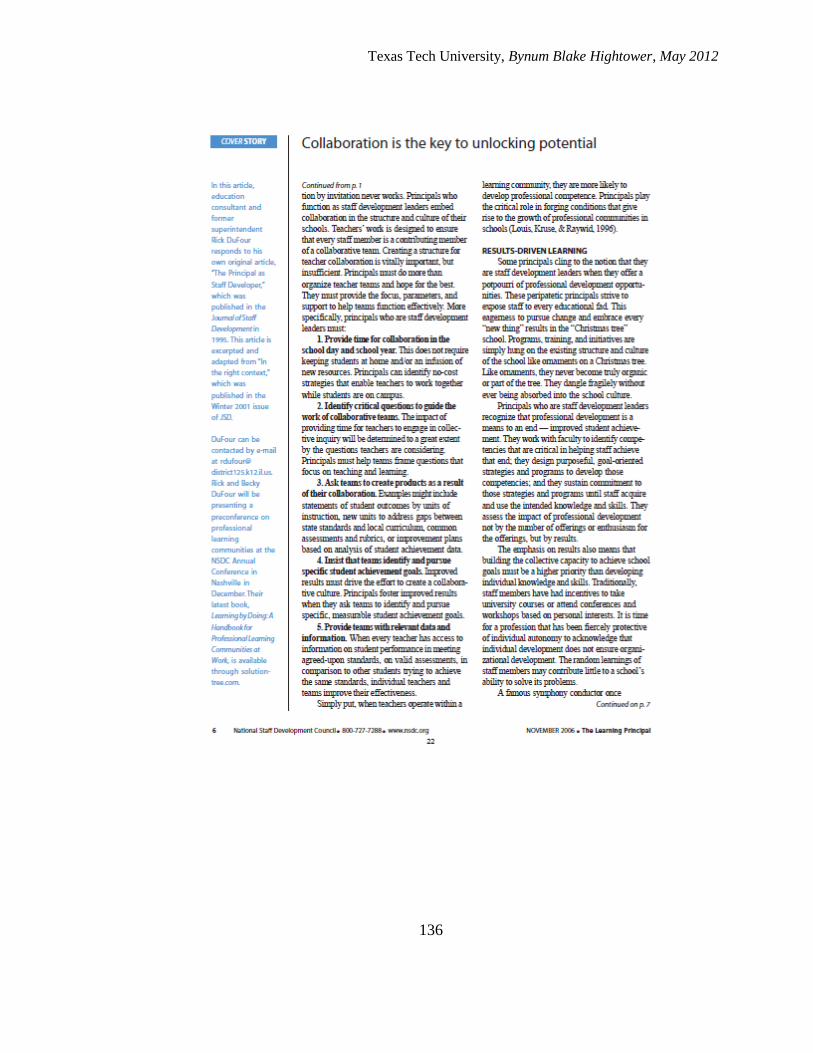
Texas Tech University, Bynum Blake Hightower, May 2012
136
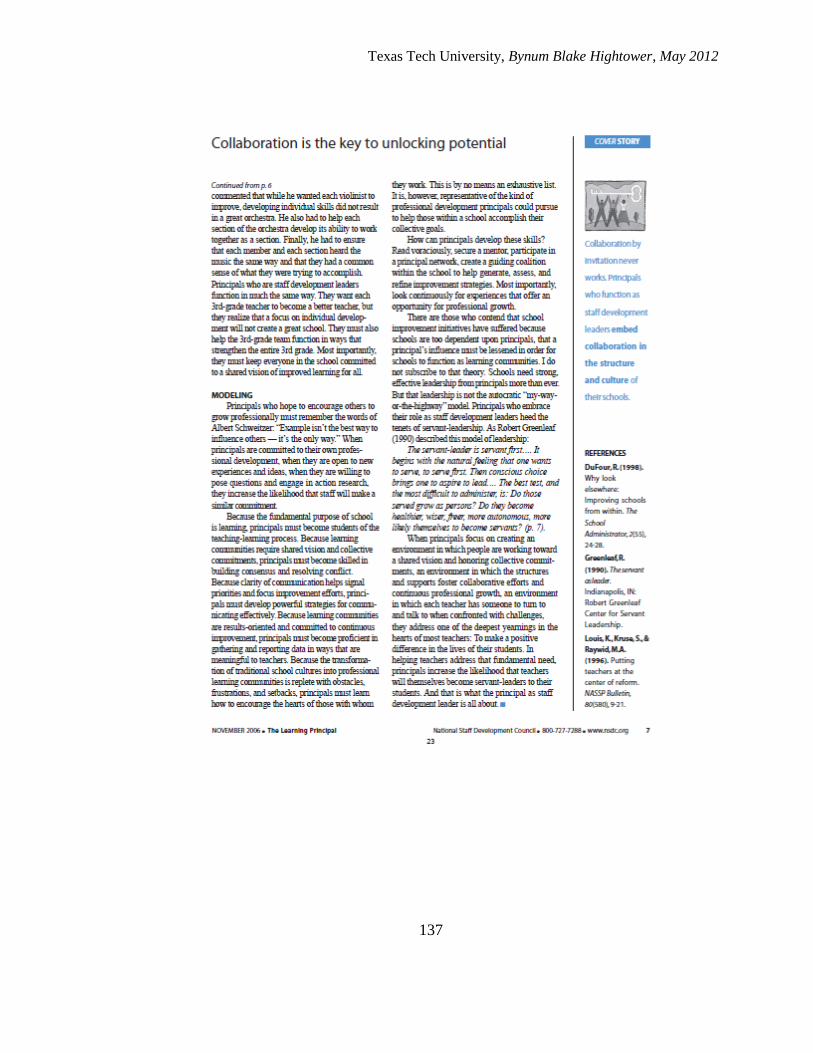
Texas Tech University, Bynum Blake Hightower, May 2012
137
Texas Tech University, Bynum Blake Hightower, May 2012
138

Texas Tech University, Bynum Blake Hightower, May 2012
139
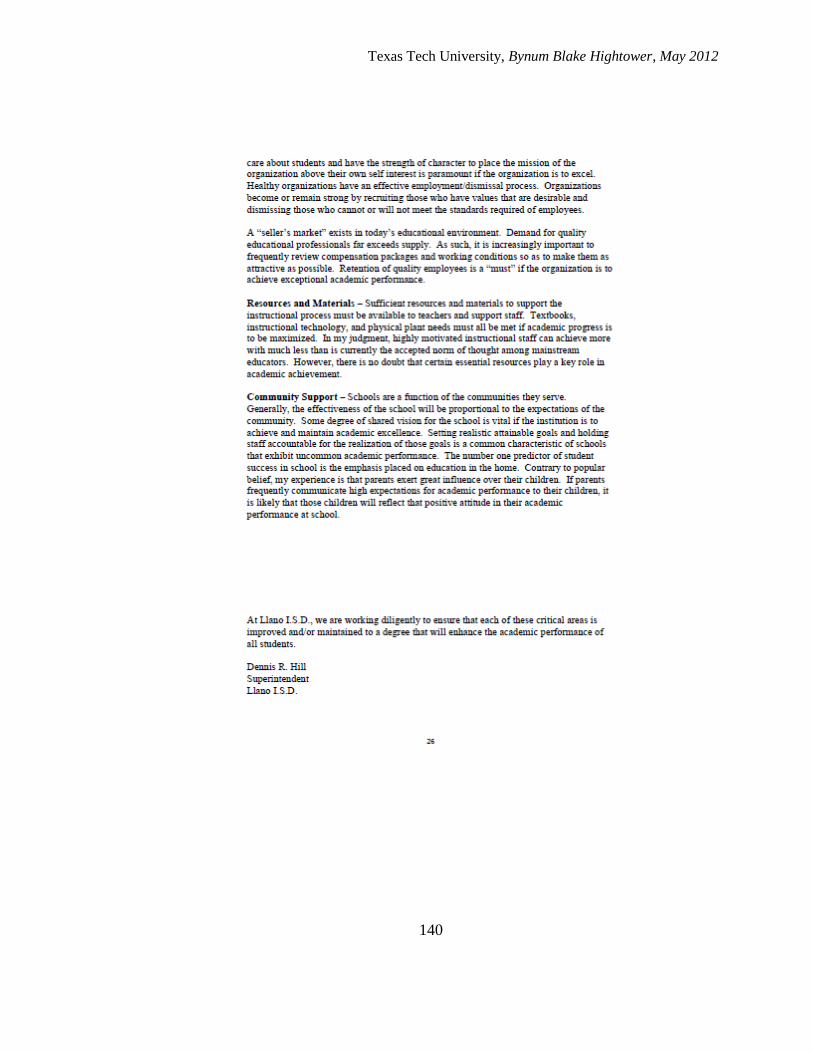
Texas Tech University, Bynum Blake Hightower, May 2012
140
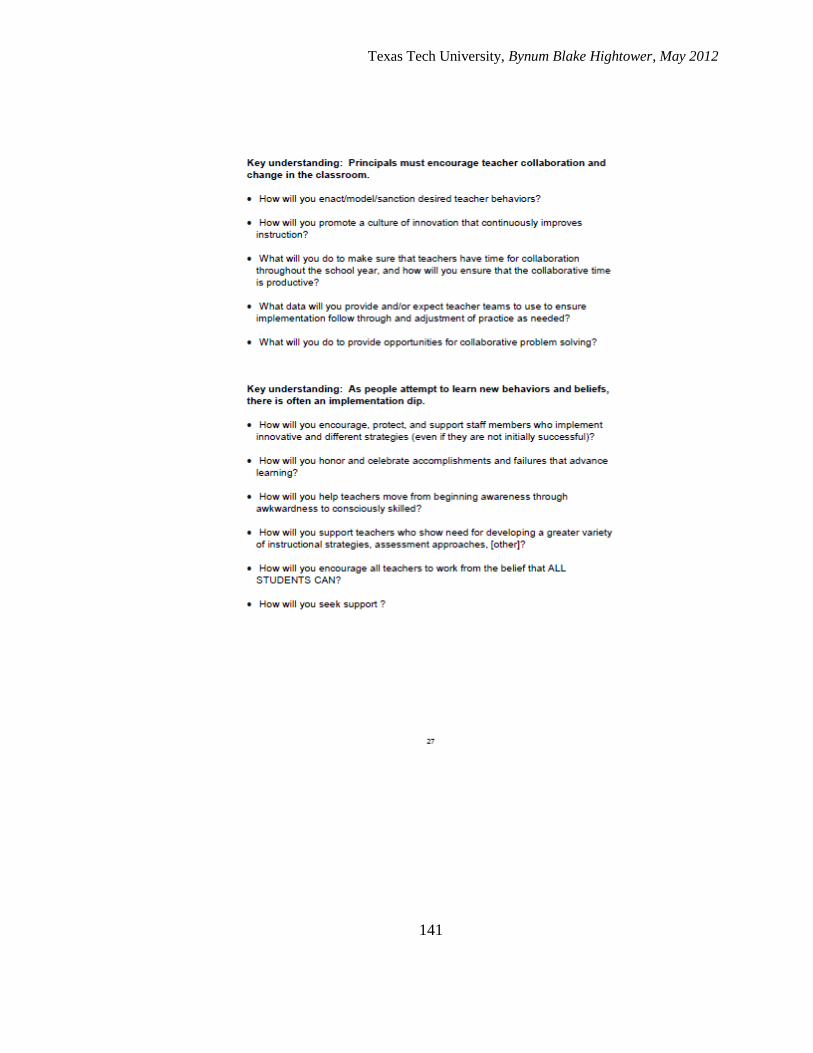
Texas Tech University, Bynum Blake Hightower, May 2012
141
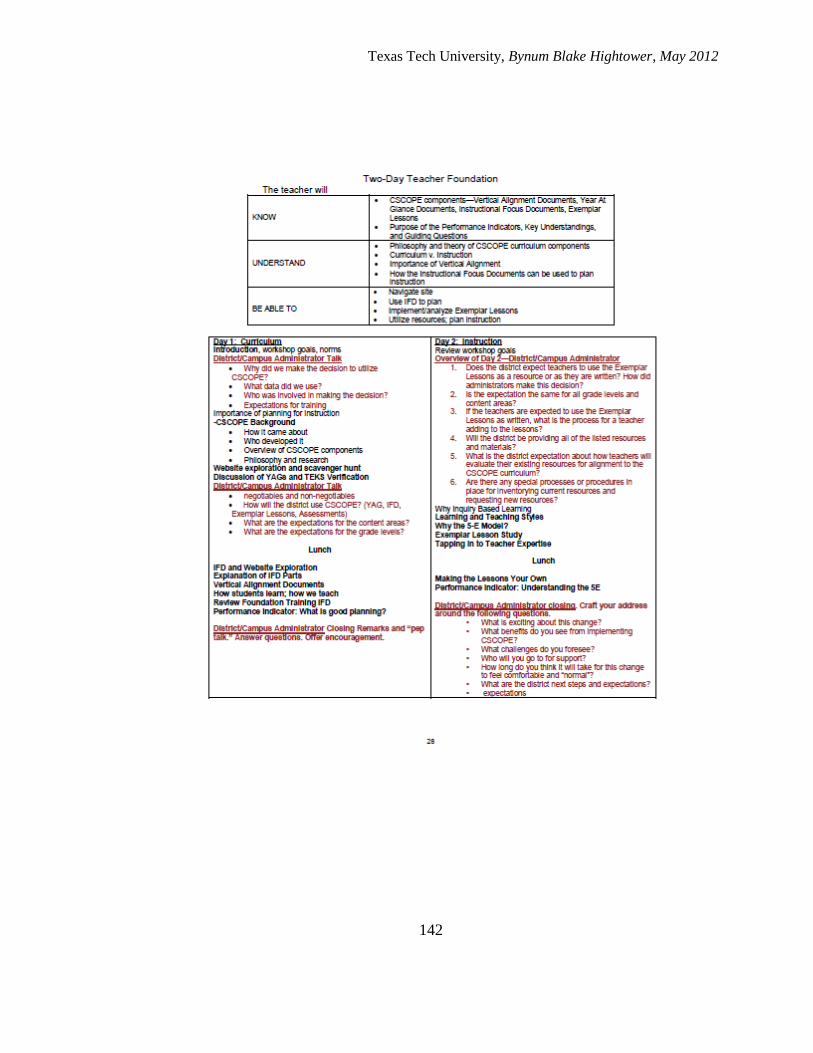
Texas Tech University, Bynum Blake Hightower, May 2012
142
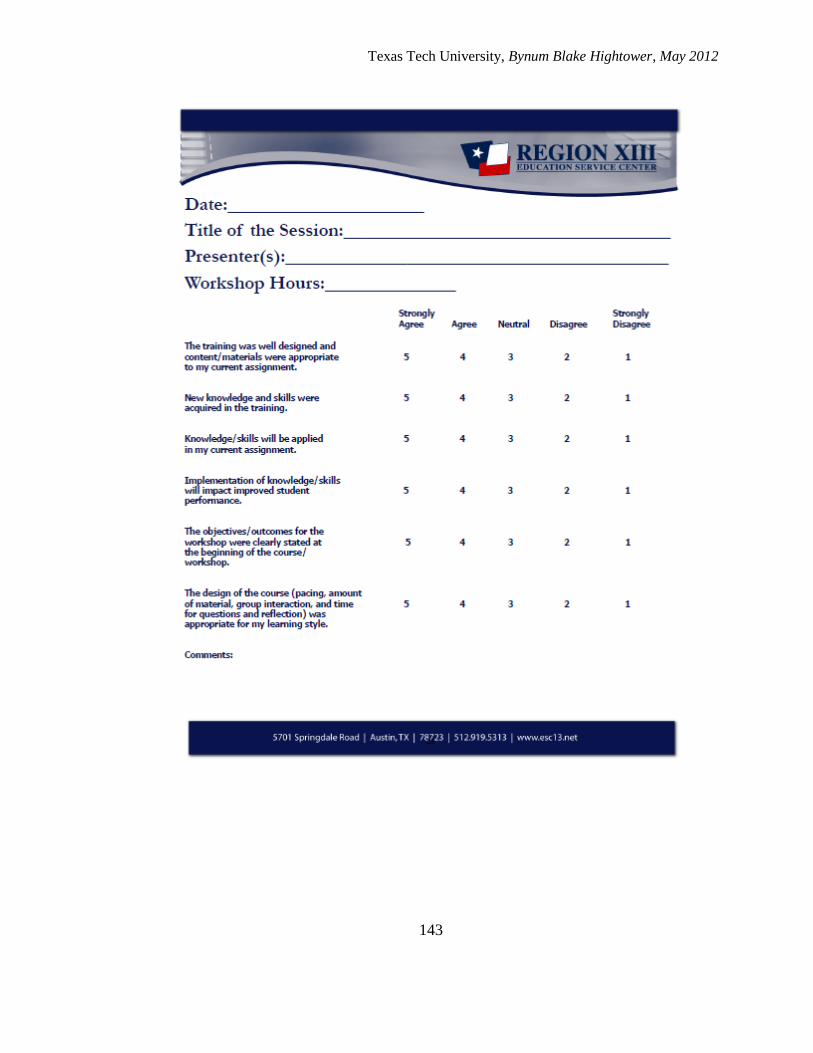
Texas Tech University, Bynum Blake Hightower, May 2012
143
Related Documents