Copyright © 2011 Pearson Prentice Hall. All rights reserved. Chapter 11 Optimal Portfolio Choice and the Capital Asset Pricing Model

Welcome message from author
This document is posted to help you gain knowledge. Please leave a comment to let me know what you think about it! Share it to your friends and learn new things together.
Transcript

Copyright © 2011 Pearson Prentice Hall. All rights reserved.
Chapter 11
Optimal Portfolio Choice and the Capital Asset Pricing Model

Lesson Outline
From Text
11.1 The Expected Return of a Portfolio
11.2 The Volatility of a Two-Stock Portfolio
11.3 The Volatility of a Large Portfolio
11.4 Risk Versus Return: Choosing an Efficient Portfolio
From Notes
Theory of Choice
6-2
11.1 The Expected Return of a Portfolio
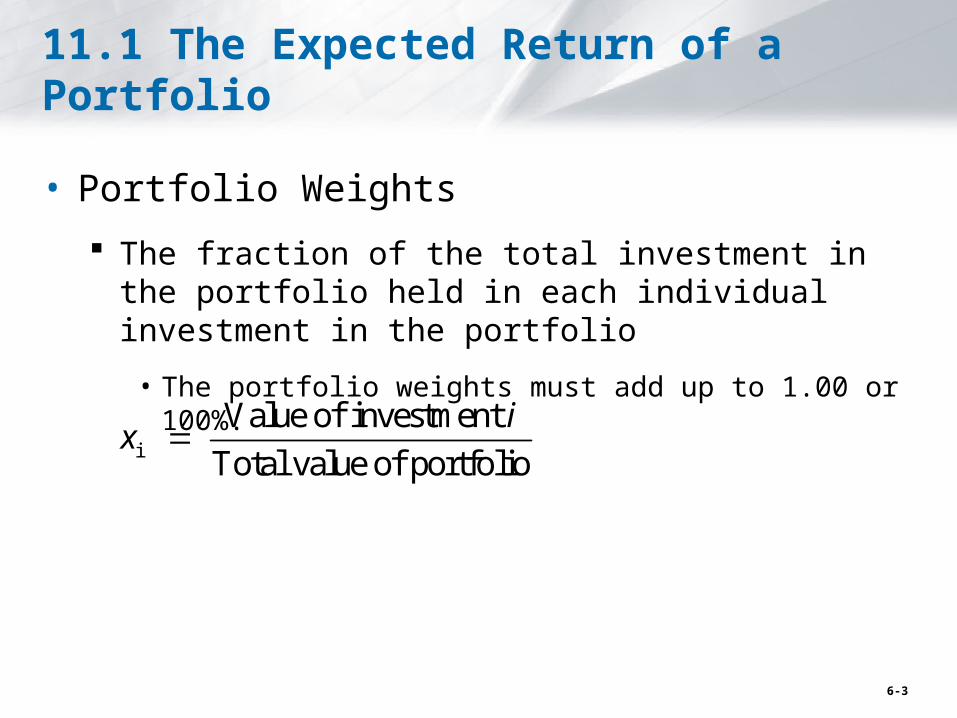
• Portfolio Weights
The fraction of the total investment in the portfolio held in each individual investment in the portfolio
• The portfolio weights must add up to 1.00 or 100%.
i
Value of investment
Total value of portfolio
ix
6-3

11.1 The Expected Return of a Portfolio (cont'd)
• Then the return on the portfolio, Rp , is the weighted average of the returns on the investments in the portfolio, where the weights correspond to portfolio weights.
1 1 2 2 P n n i iiR x R x R x R x R
6-4

Chapter 11, problem 1
You are considering how to invest part of your retirement savings. You have decided to put $200,000 into three stocks: 50% of the money in GoldFinger (currently $25/share), 25% of the money in Moosehead (currently $80/share), and the remainder in Venture Associates (currently $2/share). If GoldFinger stock goes up to $30/share. Moosehead stock drops to $60 share, and Venture Associates stock rises to $3 per share,a.What is the new value of the portfoliob.What return did the portfolio earnc.I you don’t buy or sell shares after the price change, what are you new portfolio weights.
6-5
11.1 The Expected Return of a Portfolio (cont'd)
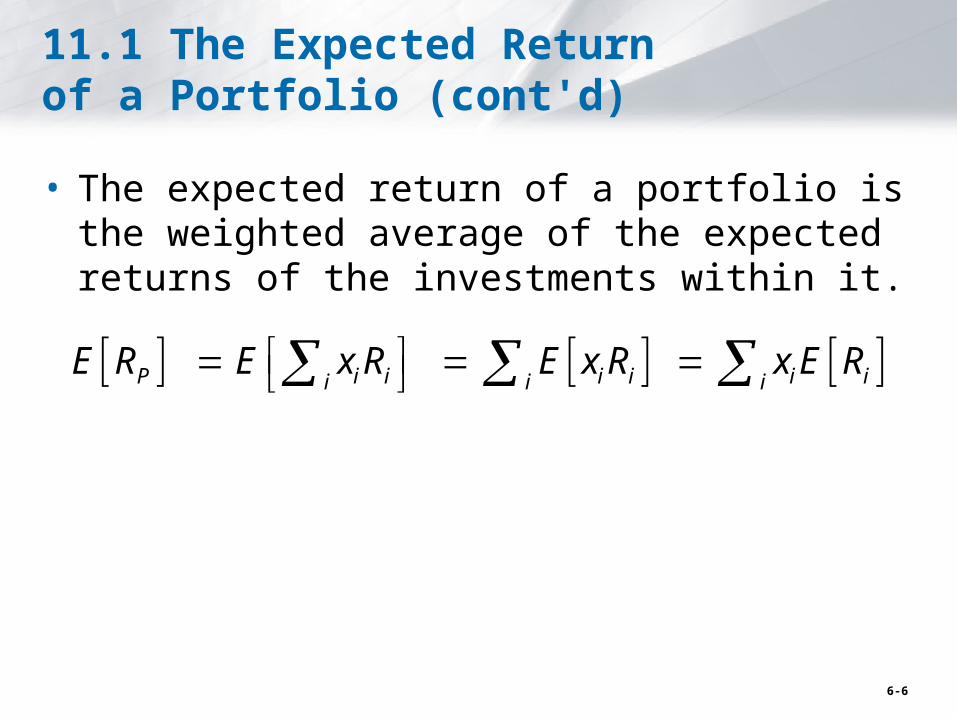
• The expected return of a portfolio is the weighted average of the expected returns of the investments within it.
P i i i i i ii i iE R E x R E x R x E R
6-6

• Problem
Assume your portfolio consists of $25,000 of Intel stock and $35,000 of ATP Oil and Gas.
Your expected return is 18% for Intel and 25% for ATP Oil and Gas.
What is the expected return for your portfolio?
6-7

11.2 The Volatility of a Two-Stock Portfolio
• Combining Risks
6-8

Determining Covariance and Correlation (cont'd)
• Covariance The expected product of the deviations of two returns from
their means
Covariance between Returns Ri and Rj
Estimate of the Covariance from Historical Data
• If the covariance is positive, the two returns tend to move together.• If the covariance is negative, the two returns tend to move in
opposite directions.
( , ) [( [ ]) ( [ ])] i j i i j jCov R R E R E R R E R
, ,
1( , ) ( ) ( )
1
i j i t i j t jtCov R R R R R R
T
6-9
Determining Covariance and Correlation (cont'd)
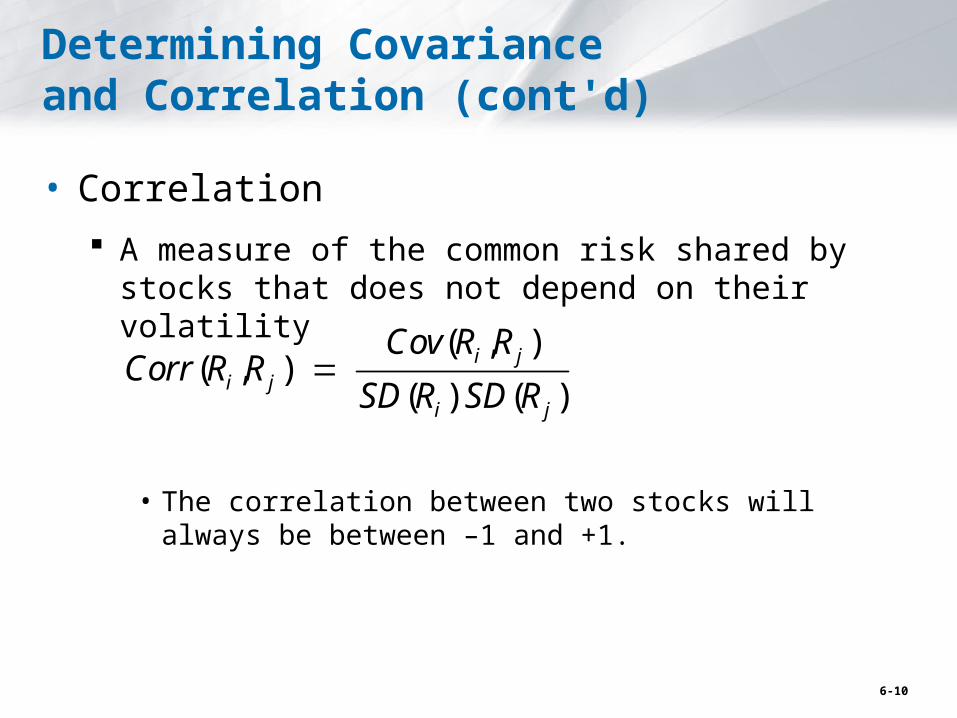
• Correlation
A measure of the common risk shared by stocks that does not depend on their volatility
• The correlation between two stocks will always be between –1 and +1.
( , )( , )
( ) ( )i j
i ji j
Cov R RCorr R R
SD R SD R
6-10

Figure 11.1 Correlation
6-11

Table 11.2
6-12

Question
Using the data in the following table, estimate (a) the average return and volatility for each stock, (b) the covariance between the stocks, and (c) the correlation between these two stocks.
Realized Returns
Year Stock A Stock B
1998 -10% 21%
1999 20% 30%
2000 5% 7%
2001 -5% -3%
2002 2% -8%
2003 9% 25%
Solution
6-13
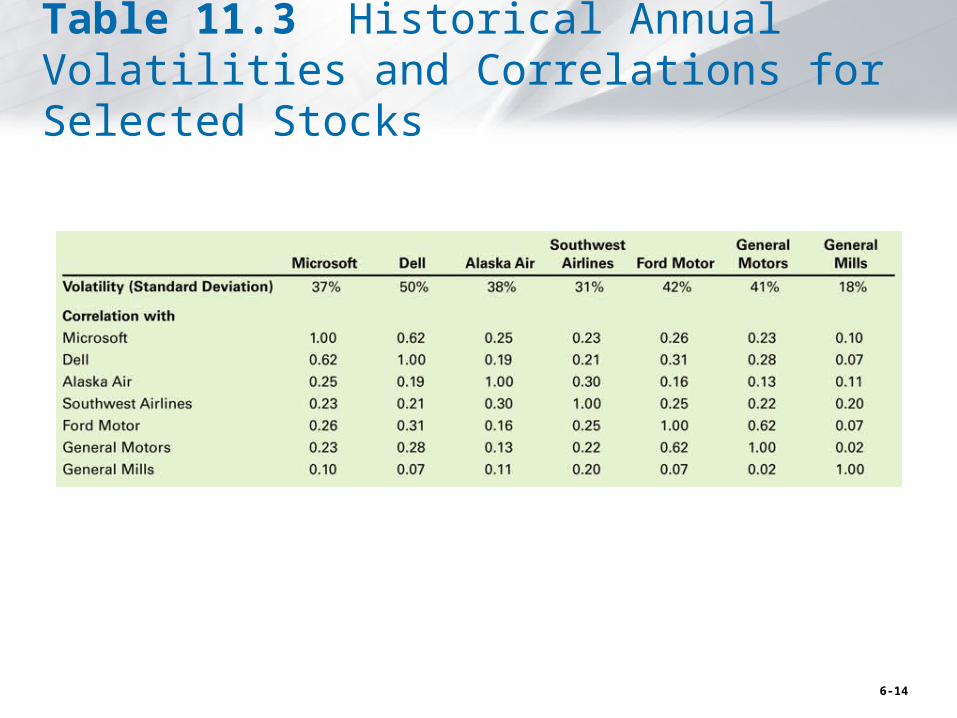
Table 11.3 Historical Annual Volatilities and Correlations for Selected Stocks
6-14

Computing a Portfolio’s Variance and Volatility
• For a two security portfolio:
The Variance of a Two-Stock Portfolio
1 1 2 2 1 1 2 2
1 1 1 1 1 2 1 2 2 1 2 1 2 2 2 2
( ) ( , )
( , )
( , ) ( , ) ( , ) ( , )
P P PVar R Cov R R
Cov x R x R x R x R
x x Cov R R x x Cov R R x x Cov R R x x Cov R R
2 21 1 2 2 1 2 1 2( ) ( ) ( ) 2 ( , ) PVar R x Var R x Var R x x Cov R R
6-15

Alternative Example 11.6
• Problem
Assume your portfolio consists of $25,000 of Intel stock and $35,000 of ATP Oil and Gas.
Assume the annual standard deviation of returns is 43% for Intel and 68% for ATP Oil and Gas.
If the correlation between Intel and ATP is .49, what is the standard deviation of your portfolio?
6-16

11.3 The Volatility of a Large Portfolio
• The variance of a portfolio is equal to the weighted average covariance of each stock with the portfolio:
which reduces to:
( ) ( , ) , ( , ) P P P i i P i i Pi iVar R Cov R R Cov x R R xCov R R
j( ) ( , ) ( , )
( , )
P i i P i i j ji i
i j i ji j
Var R xCov R R xCov R x R
x x Cov R R
6-17

Diversification with an Equally Weighted Portfolio of Many Stocks
• Equally Weighted Portfolio A portfolio in which the same amount is invested in
each stock
• Variance of an Equally Weighted Portfolio of n Stocks
1( ) (Average Variance of the Individual Stocks)
1 1 (Average Covariance between the Stocks)
PVar Rn
n
6-18

Figure 11.2 Volatility of an Equally Weighted Portfolio Versus the Number of Stocks
6-19

Chapter 11, problem 16
What is the volatility (standard deviation) of a very large portfolio of equally weighted stocks within an industry in which the stocks have a volatility of 50% and a correlation of 40%?
6-20

Diversification with General Portfolios
• For a portfolio with arbitrary weights, the standard deviation is calculated as: Volatility of a Portfolio with Arbitrary Weights
• Unless all of the stocks in a portfolio have a perfect positive correlation of +1 with one another, the risk of the portfolio will be lower than the weighted average volatility of the individual stocks:
Security ’s contribution to thevolatility of the portfolio
Amount Total Fraction of ’of held Risk of
( ) ( ) ( , )
i
P i i i pi
ii i
SD R x SD R Corr R R
srisk that is
common to
P
( ) ( ) ( , ) ( ) P i i i p i ii iSD R x SD R Corr R R x SD R
6-21

11.4 Risk Versus Return: Choosing an Efficient Portfolio
• Efficient Portfolios with Two Stocks Recall from Chapter 10, in an efficient portfolio there
is no way to reduce the volatility of the portfolio without lowering its expected return.
In an inefficient portfolio, it is possible to find another portfolio that is better in terms of both expected return and volatility.
6-22

11.4 Risk Versus Return: Choosing an Efficient Portfolio (cont'd)
• Efficient Portfolios with Two Stocks Consider a portfolio of Intel and Coca-Cola
6-23

Figure 11.3 Volatility Versus Expected Return for Portfolios of Intel and Coca-Cola Stock
6-24

Example 11.9
6-25

Figure 11.4 Effect on Volatility and Expected Return of Changing the Correlation between Intel and Coca-Cola Stock
6-26

Short Sales
• Long Position A positive investment in a security
• Short Position A negative investment in a security
In a short sale, you sell a stock that you do not own and then buy that stock back in the future.
Short selling is an advantageous strategy if you expect a stock price to decline in the future.
6-27
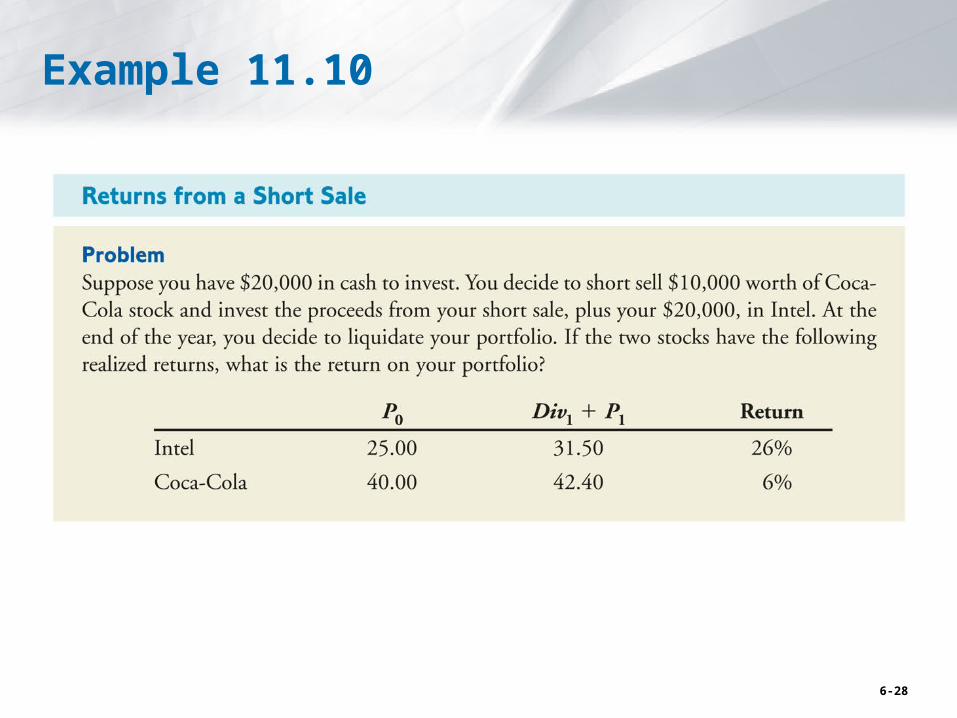
Example 11.10
6-28

Example
6-29

Figure 11.5 Portfolios of Intel and Coca-Cola Allowing for Short Sales
6-30

Risk Versus Return: Many Stocks
• Consider adding Bore Industries to the two stock portfolio:
• Although Bore has a lower return and the same volatility as Coca-Cola, it still may be beneficial to add Bore to the portfolio for the diversification benefits.
6-31

Figure 11.6 Expected Return and Volatility for Selected Portfolios of Intel, Coca-Cola, and Bore Industries Stocks
6-32

Figure 11.7 The Volatility and Expected Return for All Portfolios of Intel, Coca-Cola, and Bore Stock
6-33
Risk Versus Return: Many Stocks (cont'd)
• The efficient portfolios, those offering the highest possible expected return for a given level of volatility, are those on the northwest edge of the shaded region, which is called the efficient frontier for these three stocks.
In this case none of the stocks, on its own, is on the efficient frontier, so it would not be efficient to put all our money in a single stock.
6-34
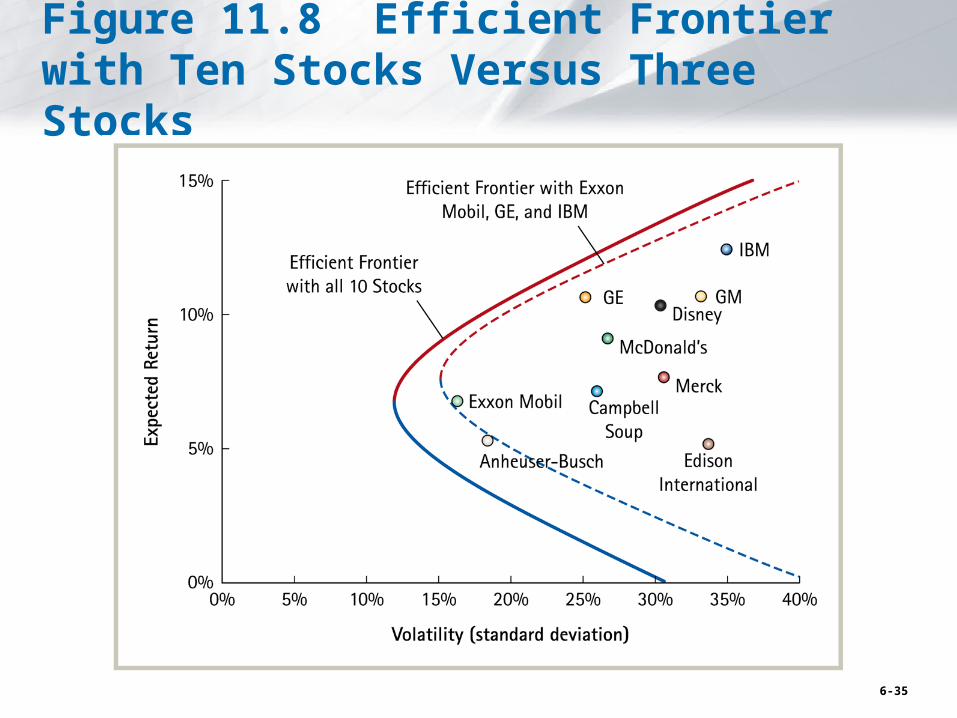
Figure 11.8 Efficient Frontier with Ten Stocks Versus Three Stocks
6-35

Problem
Using the data from slide 11-31 but assuming that Coca-Cola and Intel stocks are perfectly negatively correlated (their correlation is -1).
a.Calculate the portfolio weights that remove all risk (note that Intel’s volatility is twice that of Coca-Cola).
b.What is the risk-free rate of interest in this economy?
6-36

Problem
Suppose Johnson & Johnson and the Walgreen Company have expected returns and volatilities shown below, with a correlation of 22%.
1. Calculate (a) the expected return and (b) the volatility (standard deviation) of a portfolio that is equally invested in Johnson & Johnson and Walgreen’s stock.
2. Calculate (a) the expected return and (b) the volatility (standard deviation) of a portfolio that consists of a long position of $10,000 in Johnson & Johnson and a short position of $2,000 in Walgreen’s.
E(R) SD(R)
Johnson & Johnson 7% 16%
Walgreen Company 10% 20%
6-37
Related Documents