Copyright © 2011 Cengage Learning 4 4 The Market Forces of Supply and Demand

Copyright © 2011 Cengage Learning 4 The Market Forces of Supply and Demand.
Dec 21, 2015
Welcome message from author
This document is posted to help you gain knowledge. Please leave a comment to let me know what you think about it! Share it to your friends and learn new things together.
Transcript

Copyright © 2011 Cengage Learning
44The Market Forces of Supply and Demand

Copyright © 2010 Cengage Learning
Figure 1 Sabine’s Demand Schedule and Demand Curve
Copyright © 2011 Cengage Learning

Copyright © 2010 Cengage Learning
Figure 2 Market Demand as the Sum of Individual Demands
Copyright © 2011 Cengage Learning

Figure 3 Shifts in the Demand Curve
Price ofice cream
cornets
Quantity ofice cream cornets
Increasein demand
Decreasein demand
Demand curve, D3
Demandcurve, D1
Demandcurve, D2
0
Copyright © 2011 Cengage Learning

Table 1 Variables That Influence Buyers
Copyright © 2011 Cengage Learning

Copyrigt©2010 CengageCopyright © 2011 Cengage
Figure 4 Shifts in the Demand Curve versus Movements Along the Demand Curve
Copyright © 2011 Cengage Learning

Copyrigt©2010 CengageCopyright © 2011 Cengage
Figure 5 Häagen’s Supply Schedule and Supply Curve
Copyright © 2011 Cengage Learning

Copyrigt©2010 CengageCopyright © 2011 Cengage
Figure 6 Market Supply as the Sum of Individual Supplies
Copyright © 2011 Cengage Learning

Figure 7 Shifts in the Supply Curve
Price ofice cream
cornets
Quantity ofice cream cornets
0
Increasein supply
Decreasein supply
Supply curve, S3
curve, Supply
S1Supply
curve, S2
Copyright © 2011 Cengage Learning
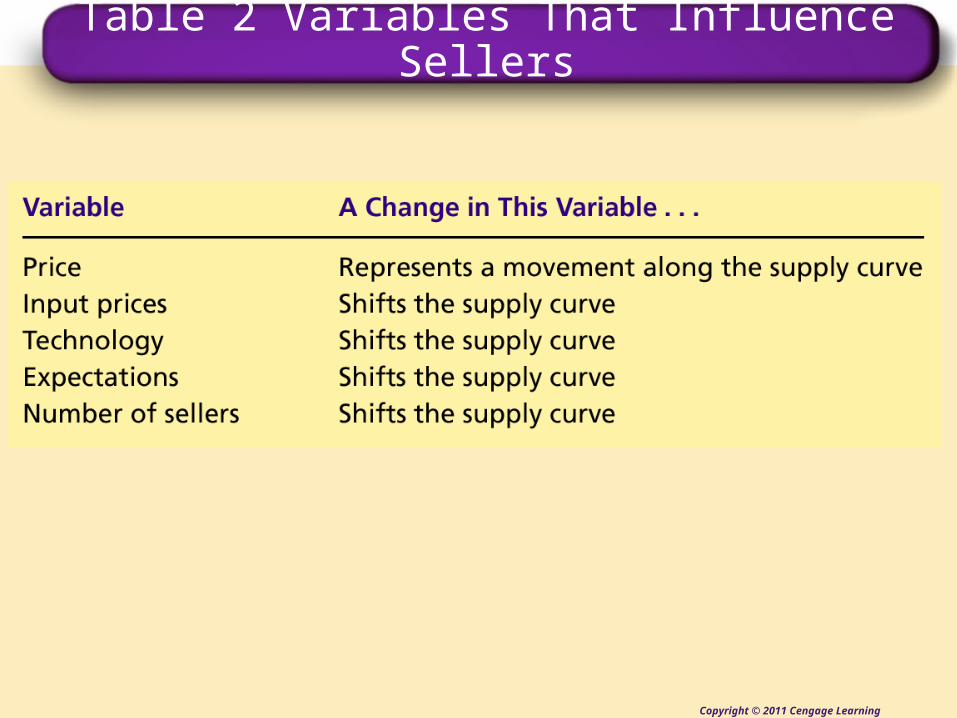
Table 2 Variables That Influence Sellers
Copyright © 2011 Cengage Learning

Figure 8 The Equilibrium of Supply and Demand
Price ofice cream
cornets
0 1 2 3 4 5 6 7 8 9 10 11 12Quantity of ice cream cornets
13
Equilibriumquantity
Equilibrium price Equilibrium
Supply
Demand
€ 2.00
Copyright © 2011 Cengage Learning

Figure 9 Markets Not in Equilibrium (1)
Price ofice cream
cornets
0
Supply
Demand
(a) Excess supply
Quantitydemanded
Quantitysupplied
Surplus
Quantity ofice cream
cornets
4
€ 2.50
10
2.00
7
Copyright © 2011 Cengage Learning

Figure 9 Markets Not in Equilibrium (2)
Shortage
Price ofice cream
cornets
0
Supply
Demand
(b) Excess demand
Quantitysupplied
Quantitydemanded
Quantity ofice cream
cornets
4
€ 2.00
10
1.50
7
Copyright © 2011 Cengage Learning

Copyright © 2010 Cengage Learning
Equilibrium
• Surplus• When price > equilibrium price, then quantity
supplied > quantity demanded. • There is excess supply or a surplus.
• Suppliers will lower the price to increase sales, thereby moving toward equilibrium.
Copyright © 2011 Cengage Learning

Table 3 A Three-Step Programme for Analysing Changes in Equilibrium
Copyright © 2011 Cengage Learning

Figure 10 How an Increase in Demand Affects the Equilibrium
Price ofice cream
cornets
0 Quantity of ice cream cornets
Supply
Initialequilibrium
D
D
3. . . . and a higherquantity sold.
2. . . . resultingin a higherprice . . .
1. Hot weather increasesthe demand for ice cream . . .
2.00
7
New equilibrium€ 2.50
10
Copyright © 2011 Cengage Learning

Figure 11 How a Decrease in Supply Affects the Equilibrium
Price ofice cream
Cone
0 Quantity of ice cream Cones
Demand
Newequilibrium
Initial equilibrium
S1
S2
2. . . . resultingin a higherprice of icecream . . .
1. An increase in theprice of sugar reducesthe supply of ice cream. . .
3. . . . and a lowerquantity sold.
2.00
7
€ 2.50
4
Copyright © 2011 Cengage Learning

Copyright © 2010 Cengage Learning
Figure 12 A Shift in Both Supply and Demand (i) (1)
Copyright © 2011 Cengage Learning

Copyright © 2010 Cengage Learning
Figure 12 A Shift in Both Supply and Demand (i) (2)
Copyright © 2011 Cengage Learning

Copyright © 2010 Cengage Learning
Figure 13 A Shift in Both Supply and Demand (ii) (1)
Copyright © 2011 Cengage Learning

Copyright © 2010 Cengage Learning
Figure 13 A Shift in Both Supply and Demand (ii) (2)
Copyright © 2011 Cengage Learning

Copyright © 2010 Cengage Learning
Figure 13 A Shift in Both Supply and Demand (ii) (3)
Copyright © 2011 Cengage Learning

Table 4 What Happens to Price and Quantity When Supply or Demand Shifts?
Copyright © 2011 Cengage Learning
Related Documents