Copyright © 2007 Prentice-Hall. All rights reserved 1 Activity-Based Costing Activity-Based Costing and Other Cost and Other Cost Management Tools Management Tools Chapter 24

Copyright © 2007 Prentice-Hall. All rights reserved 1 Activity-Based Costing and Other Cost Management Tools Chapter 24.
Dec 20, 2015
Welcome message from author
This document is posted to help you gain knowledge. Please leave a comment to let me know what you think about it! Share it to your friends and learn new things together.
Transcript
Copyright © 2007 Prentice-Hall. All rights reserved 1
Activity-Based CostingActivity-Based Costingand Other Costand Other Cost
Management ToolsManagement Tools
Activity-Based CostingActivity-Based Costingand Other Costand Other Cost
Management ToolsManagement ToolsChapter 24
Copyright © 2007 Prentice-Hall. All rights reserved 2
Objective 1Objective 1Objective 1Objective 1
Develop activity-based costs (ABC)

Copyright © 2007 Prentice-Hall. All rights reserved 3
Activity-Based CostingActivity-Based CostingActivity-Based CostingActivity-Based Costing
• A way to allocate indirect cost to production
• Focus – on activities and cost of activities
• Each activity has its own cost driver (factors that cause you to incur expenses)
• Uses a separate allocation rate for each activity
Traditionally indirect costs were allocated to production as an overall rate. As indirect manufacturing costs increase because of automation, using an overall rate is not an adequate way of determining the cost of a product

Copyright © 2007 Prentice-Hall. All rights reserved 4
Activity-Based CostingActivity-Based CostingActivity-Based CostingActivity-Based Costing
Steps:1. Identify each activity and estimate its
total indirect cost2. Identify cost driver for each activity
and estimated total quantity of each driver’s allocation base
3. Compute cost allocation rate for each activity
4. Allocate indirect costs to cost object

Copyright © 2007 Prentice-Hall. All rights reserved 5
Cost Drivers - ExamplesCost Drivers - ExamplesCost Drivers - ExamplesCost Drivers - Examples
Activities: Cost Drivers:
Material purchasing # of purchase orders
Material handling # of parts
Production scheduling # of batches
Quality inspections # of inspections
Photocopying # of pages copied
Warranty service # of service calls
Copyright © 2007 Prentice-Hall. All rights reserved 6
E24-13E24-13E24-13E24-13
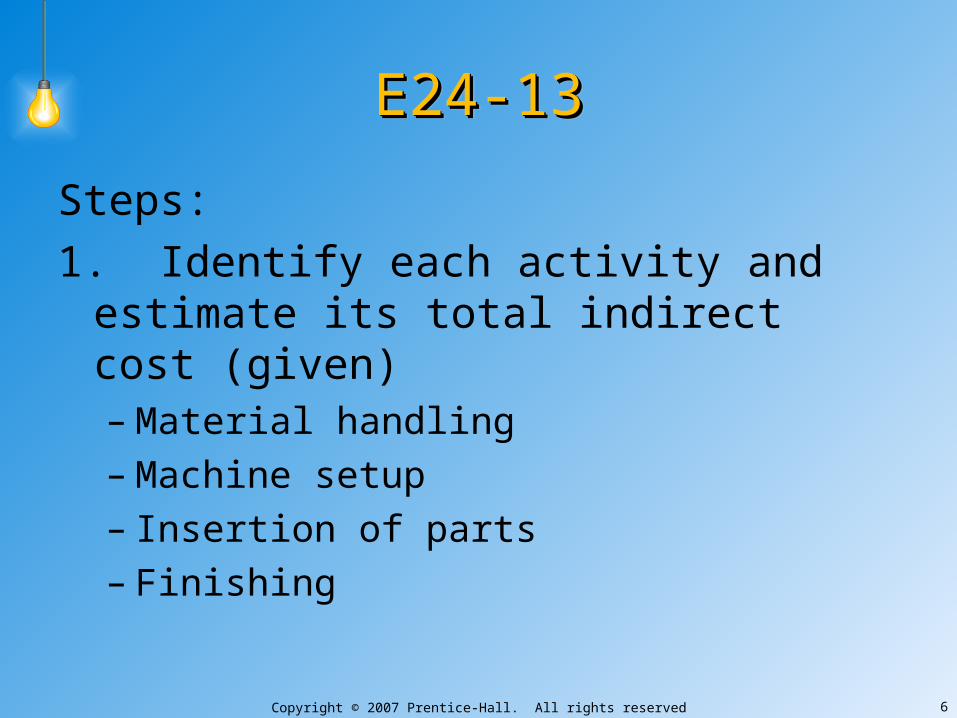
Steps:
1. Identify each activity and estimate its total indirect cost (given)– Material handling– Machine setup– Insertion of parts– Finishing

Copyright © 2007 Prentice-Hall. All rights reserved 7
E24-13E24-13E24-13E24-13Steps:
2. Identify cost driver for each activity and estimated total quantity of each driver’s allocation base (given)
Activity Budgeted cost Allocation base
Material handling $9,000 # of parts
Machine setup 3,400 # of setups
Insertion of parts 48,000 # of parts
Finishing 80,000 # finished direct labor hours
Total $140,400
Copyright © 2007 Prentice-Hall. All rights reserved 8
E24-13E24-13E24-13E24-13
Steps:
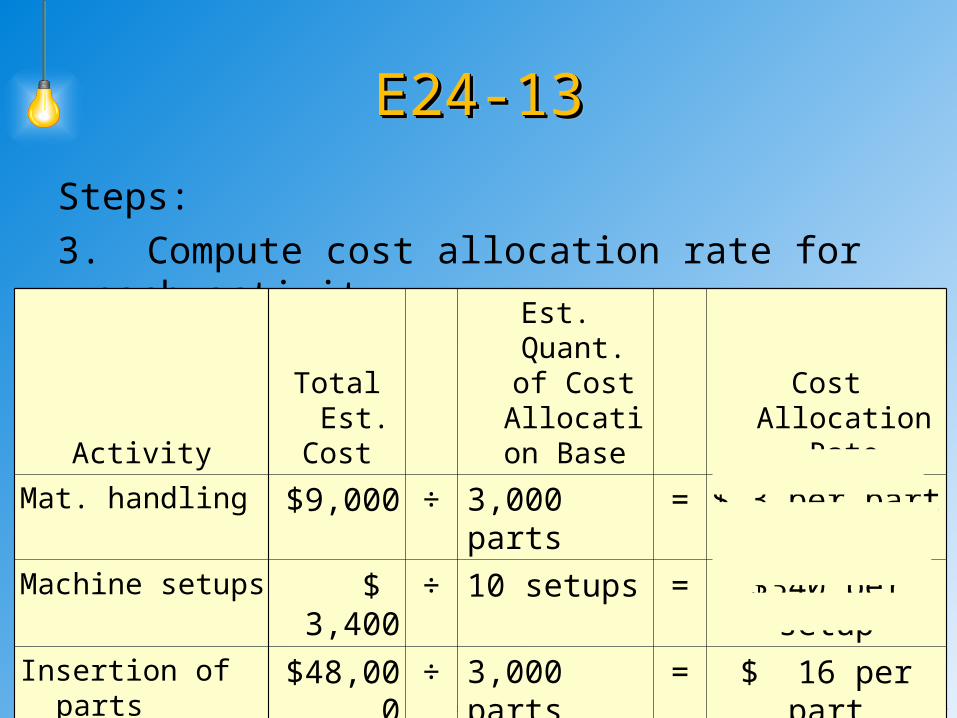
3. Compute cost allocation rate for each activity
ActivityTotal Est.
Cost
Est. Quant. of Cost
Allocation Base
Cost Allocation Rate
Mat. handling $9,000 ÷ 3,000 parts = $ 3 per part
Machine setups $ 3,400 ÷ 10 setups = $340 per setup
Insertion of parts $48,000 ÷ 3,000 parts = $ 16 per part
Finishing $80,000 ÷ 2,000 hrs = $ 40 per hour
Copyright © 2007 Prentice-Hall. All rights reserved 9
E24-13E24-13E24-13E24-13
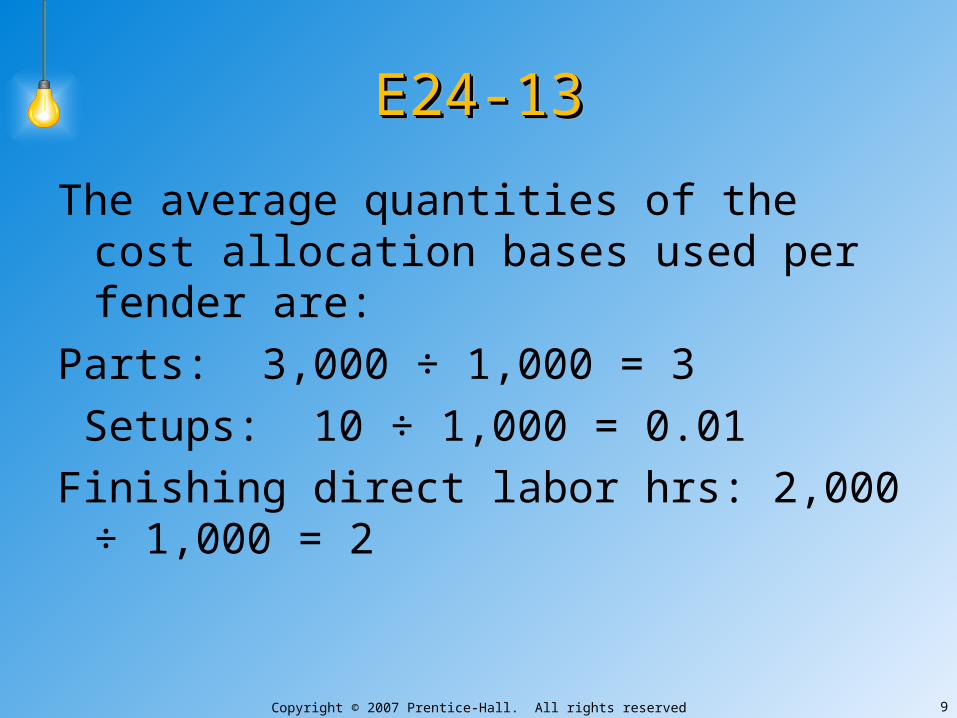
The average quantities of the cost allocation bases used per fender are:
Parts: 3,000 ÷ 1,000 = 3
Setups: 10 ÷ 1,000 = 0.01
Finishing direct labor hrs: 2,000 ÷ 1,000 = 2
Copyright © 2007 Prentice-Hall. All rights reserved 10
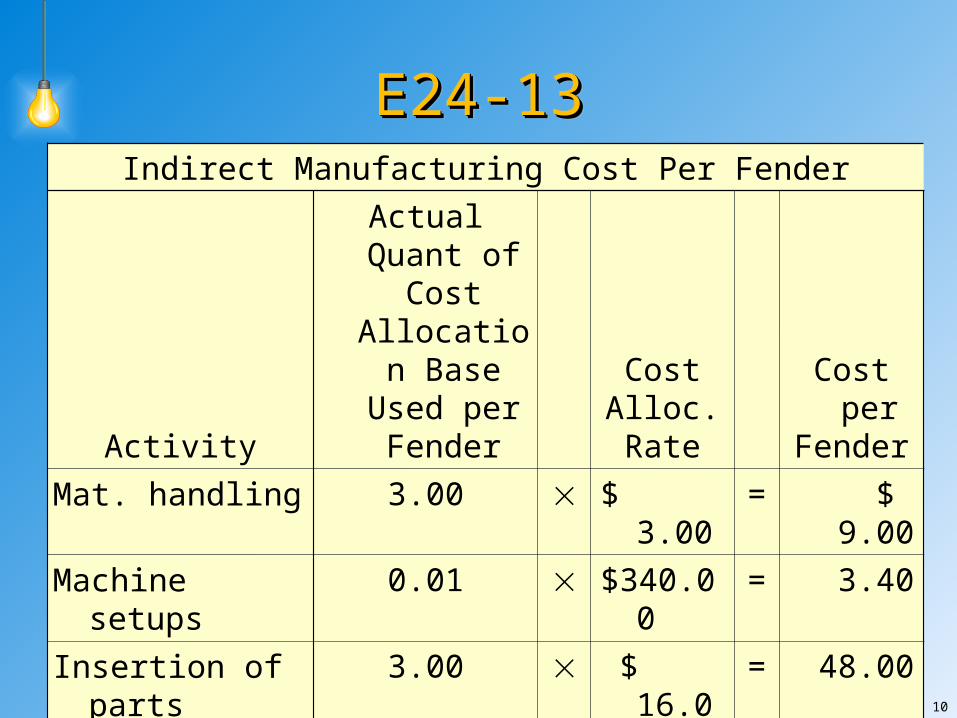
E24-13E24-13E24-13E24-13Indirect Manufacturing Cost Per Fender
Activity
Actual Quant of Cost
Allocation Base Used per Fender
CostAlloc.Rate
Cost perFender
Mat. handling 3.00 $ 3.00 = $ 9.00
Machine setups 0.01 $340.00 = 3.40
Insertion of parts 3.00 $ 16.00 = 48.00
Finishing 2.00 $ 40.00 = 80.00
Total indirect cost $140.40

Copyright © 2007 Prentice-Hall. All rights reserved 11
E24-15E24-15E24-15E24-15Total Budgeted Indirect Manufacturing Cost
Activity
Actual Quant of Cost
Allocation Base Used per Fender
CostAlloc.Rate Total
Mat. handling 10,000 $ 3.00 = $30,000
Machine setups 30 $300.00 = 9,000
Insertion of parts 10,000 $ 24.00 = 240,000
Finishing 3,500 $ 50.00 = 175,000
Total budgeted indirect cost
$454,000
Total parts for the year:
(4 x 1,000) + (6 x 1,000) = 10,000Total machine setups: 15 + 15Finishing:
(1 x 1,000) + (2.5 x 1,000) = 3,500

Copyright © 2007 Prentice-Hall. All rights reserved 12
E24-15E24-15E24-15E24-15Indirect Manufacturing Cost Per Rim - Standard
ActivityCost Allocation
Rate
Quant of Cost Alloc. Base Used
Cost perRim
Mat. handling $3.00 4 = $ 12.00
Machine setups $300 .015 = 4.50
Insertion of parts $24 4 = 96.00
Finishing $50 x 1 = 50.00
Total indirect cost $162.50
Machine setups: 15/1,000 rims = .015

Copyright © 2007 Prentice-Hall. All rights reserved 13
E24-15E24-15E24-15E24-15Indirect Manufacturing Cost Per Rim - Deluxe
ActivityCost Allocation
Rate
Quant of Cost Alloc. Base Used
Cost perRim
Mat. handling $3.00 6 = $ 18.00
Machine setups $300 .015 = 4.50
Insertion of parts $24 6 = 144.00
Finishing $50 x 2.5 = 125.00
Total indirect cost $291.50
Copyright © 2007 Prentice-Hall. All rights reserved 14
E24-15E24-15E24-15E24-15
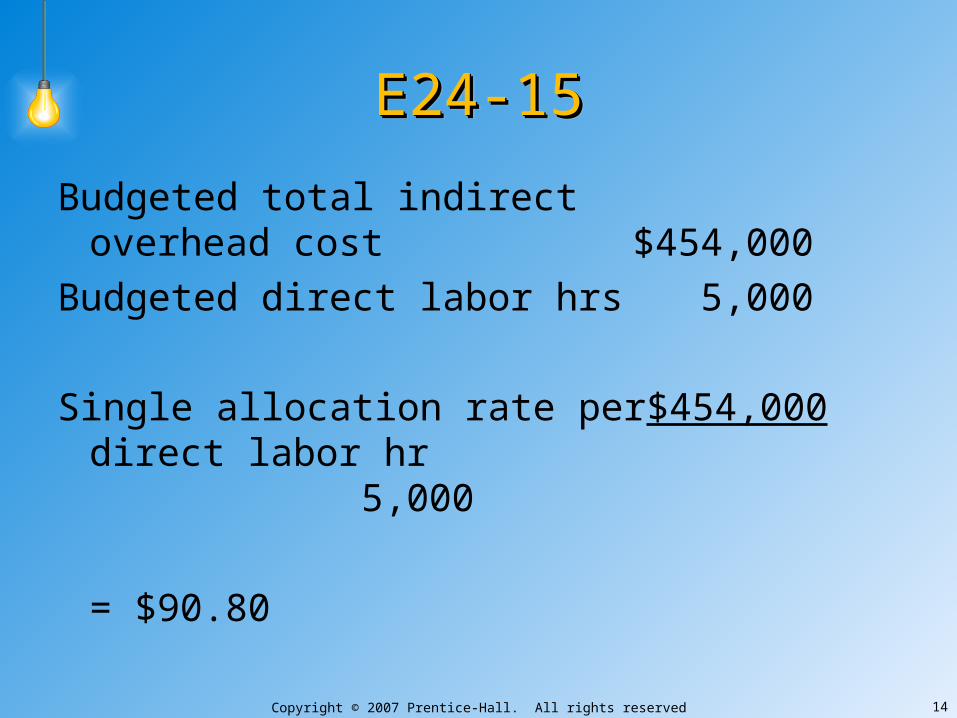
Budgeted total indirect overhead cost $454,000
Budgeted direct labor hrs 5,000
Single allocation rate per $454,000direct labor hr 5,000
= $90.80

Copyright © 2007 Prentice-Hall. All rights reserved 15
E24-15E24-15E24-15E24-15
Indirect manufacturing cost per wheel:
Standard model:
2 $92.30 = $184.60
Deluxe model:
3 $92.30 = $276.90
Compare these allocations with the $162.50 and $291.50 for the standard and deluxe
rims respectively

Copyright © 2007 Prentice-Hall. All rights reserved 16
Objective 2Objective 2Objective 2Objective 2
Use activity-based management (ABM)
Copyright © 2007 Prentice-Hall. All rights reserved 17
E24-16E24-16E24-16E24-16
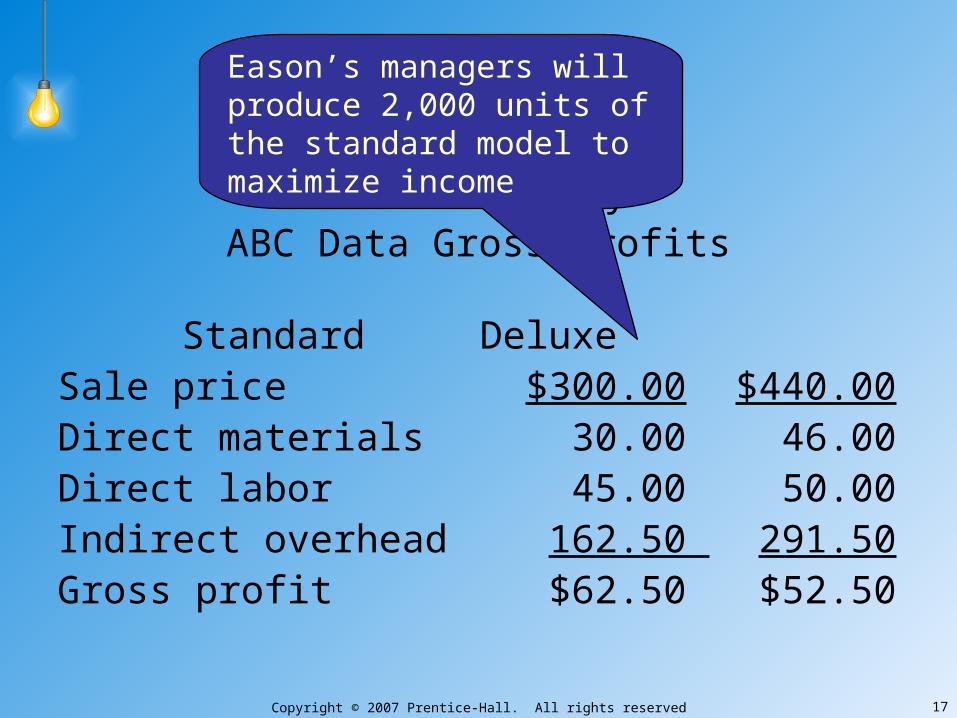
Eason CompanyABC Data Gross Profits
Standard DeluxeSale price $300.00 $440.00Direct materials 30.00 46.00Direct labor 45.00 50.00Indirect overhead 162.50 291.50 Gross profit $62.50 $52.50
Eason’s managers will produce 2,000 units of the standard model to maximize income
Copyright © 2007 Prentice-Hall. All rights reserved 18
E24-16E24-16E24-16E24-16
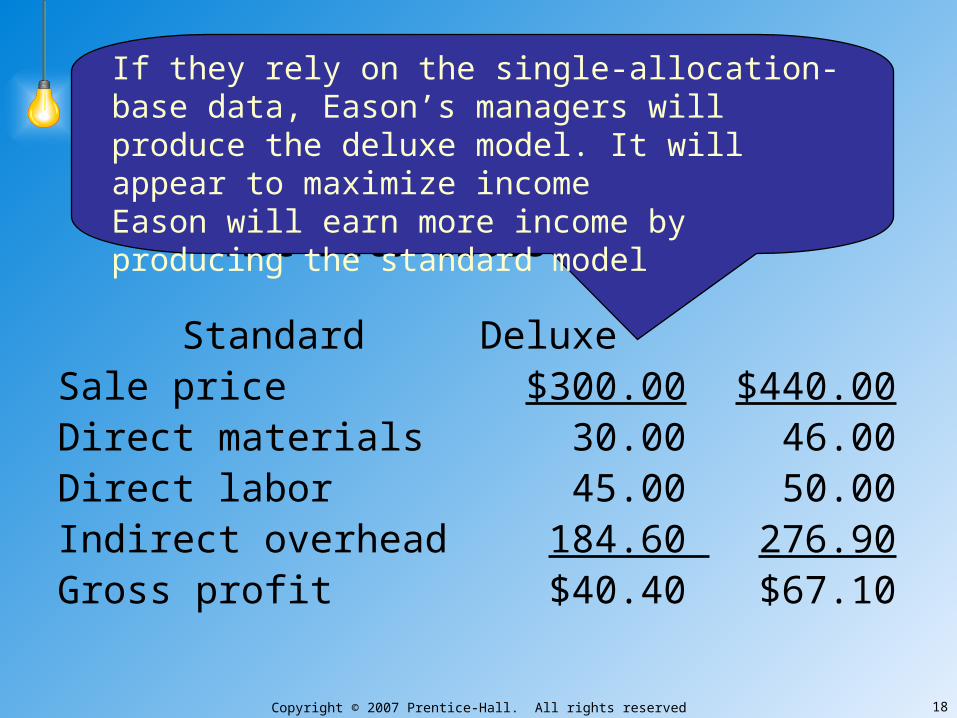
Eason CompanyABC Data Gross Profits
Standard DeluxeSale price $300.00 $440.00Direct materials 30.00 46.00Direct labor 45.00 50.00Indirect overhead 184.60 276.90 Gross profit $40.40 $67.10
If they rely on the single-allocation-base data, Eason’s managers will produce the deluxe model. It will appear to maximize incomeEason will earn more income by producing the standard model
Copyright © 2007 Prentice-Hall. All rights reserved 19
E24-17E24-17E24-17E24-17
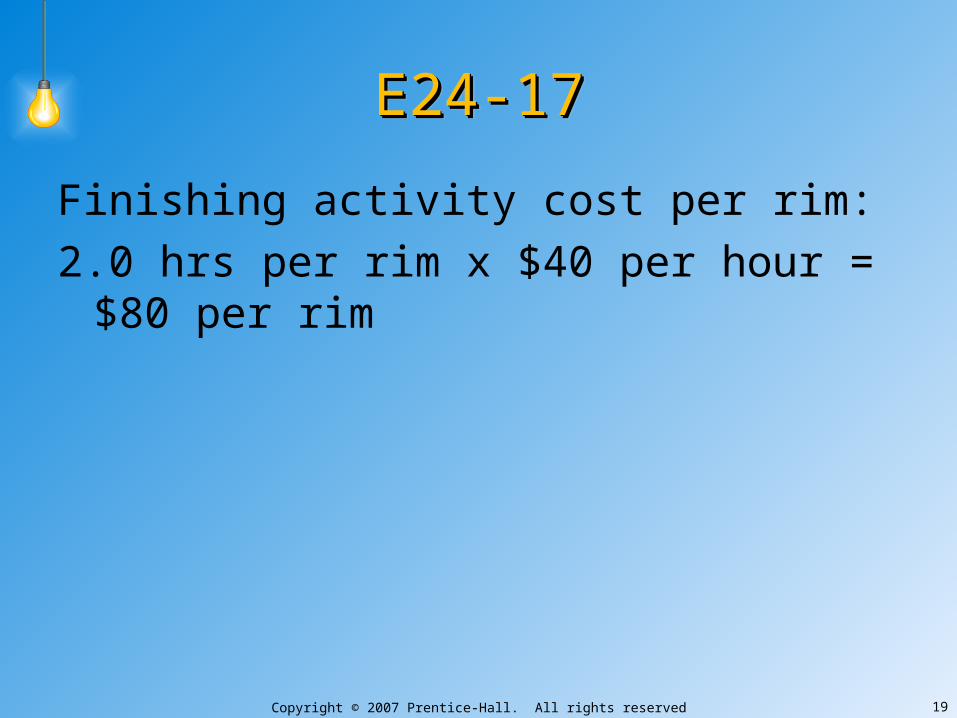
Finishing activity cost per rim:
2.0 hrs per rim x $40 per hour = $80 per rim

Copyright © 2007 Prentice-Hall. All rights reserved 20
E24-17E24-17E24-17E24-17
New cost of deluxe rim:Direct materials $46.00Direct labor 50.00Indirect costs:
Materials handling 18.00Machine setups 4.50Insertion parts 144.00Finishing 80.00
Total $342.50
Yes, the value engineering recommendation for the finishing process would reduce the cost of the deluxe model to $342.50, which is below the target cost of $350
Copyright © 2007 Prentice-Hall. All rights reserved 21
Objective 4Objective 4Objective 4Objective 4
Describe a just-in-time (JIT) production system, and record its
transactions
Copyright © 2007 Prentice-Hall. All rights reserved 22
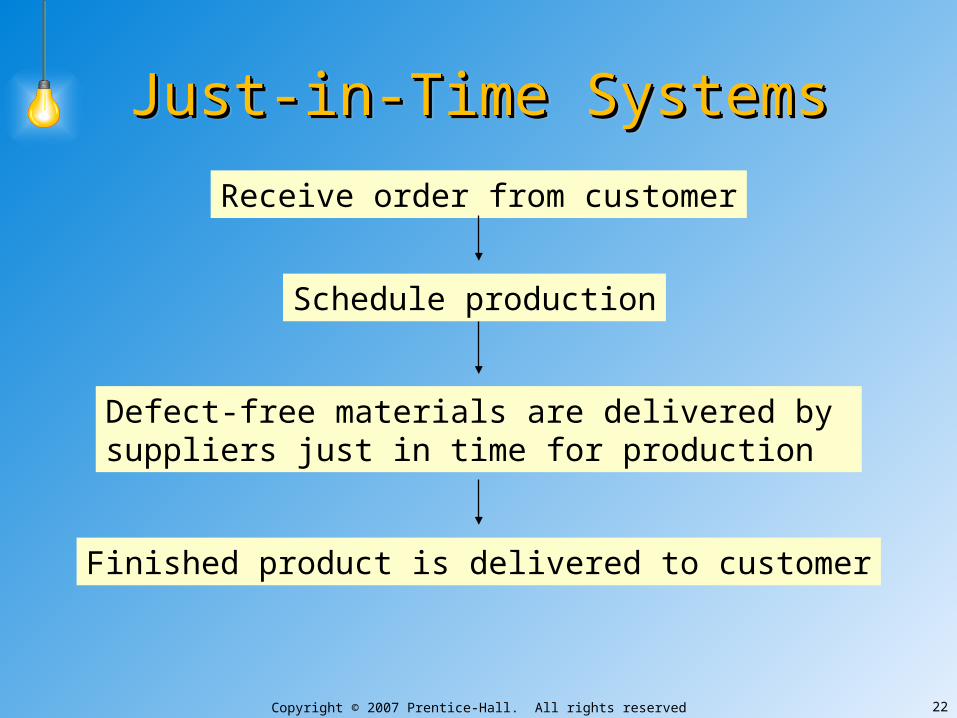
Just-in-Time SystemsJust-in-Time SystemsJust-in-Time SystemsJust-in-Time Systems
Receive order from customer
Schedule production
Defect-free materials are delivered by suppliers just in time for production
Finished product is delivered to customer

Copyright © 2007 Prentice-Hall. All rights reserved 23
Just-in-Time SystemsJust-in-Time SystemsJust-in-Time SystemsJust-in-Time Systems
cutting
shapingsmoothing
grinding Finished Goods
Work in process is not transferred from one department to another. All equipment needed to produce the product is contained in the cell. No time is wasted on moving inventory. Employees are cross-trained and work as a team with little supervision. They are responsible for quality control throughout the process
Copyright © 2007 Prentice-Hall. All rights reserved 24
Just-in-Time CostingJust-in-Time CostingJust-in-Time CostingJust-in-Time Costing
• “Backflush costing”
• Standard costing system that begins with output completed and then assigns manufacturing cost to units sold and to inventories

Copyright © 2007 Prentice-Hall. All rights reserved 25
Just-in-Time CostingJust-in-Time CostingJust-in-Time CostingJust-in-Time Costing
• Record cost of production when units are completed
• Inventory accounts – only two– Raw and In-Process Inventory– Finished Goods Inventory
• Manufacturing costs – only two– Direct materials– Conversion
Copyright © 2007 Prentice-Hall. All rights reserved 26
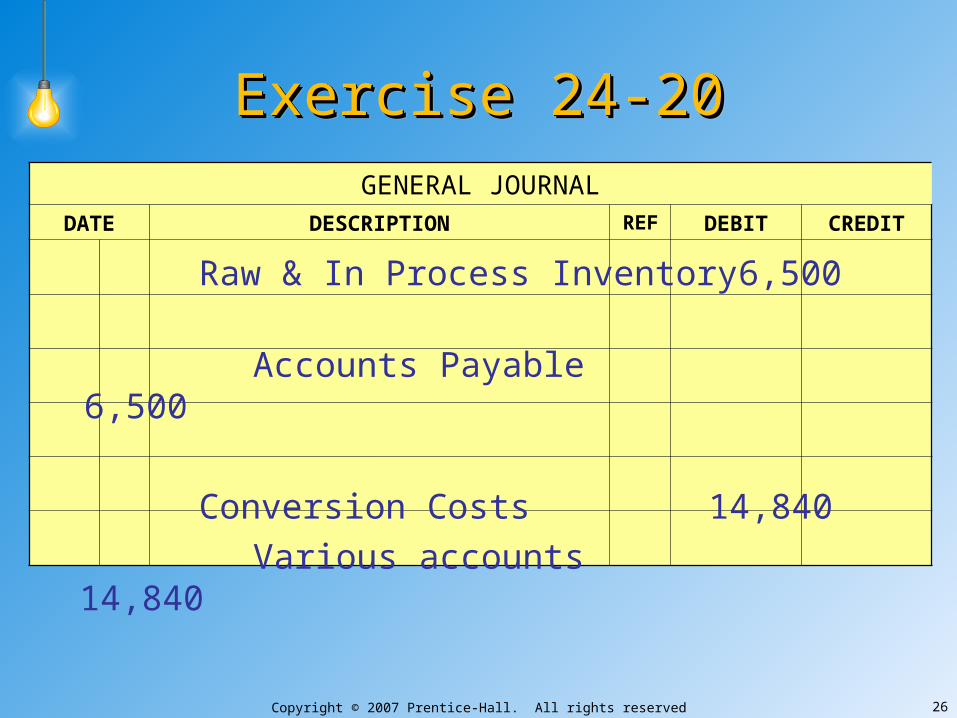
Exercise 24-20Exercise 24-20Exercise 24-20Exercise 24-20GENERAL JOURNAL
DATE DESCRIPTION REF DEBIT CREDIT
Raw & In Process Inventory 6,500
Accounts Payable6,500
Conversion Costs 14,840
Various accounts14,840

Copyright © 2007 Prentice-Hall. All rights reserved 27
Exercise 24-20Exercise 24-20Exercise 24-20Exercise 24-20GENERAL JOURNAL
DATE DESCRIPTION REF DEBIT CREDIT
Finished Goods Inventory 17,600
Raw and In Process Inventory (200x$24)
4,800
Conversion Costs(200x$64)12,800
Cost of Goods Sold ($88x196) 17,248
Finished Goods Inventory17,248
Cost per unit = $17,600 / 200 units = $88 per unit

Copyright © 2007 Prentice-Hall. All rights reserved 28
Exercise 24-20Exercise 24-20Exercise 24-20Exercise 24-20
GENERAL JOURNALDATE DESCRIPTION REF DEBIT CREDIT
Cost of Goods Sold 2,040
Conversion Costs2,040
Conversion Costs
14,840 12,800
Bal. 2,040
Copyright © 2007 Prentice-Hall. All rights reserved 29
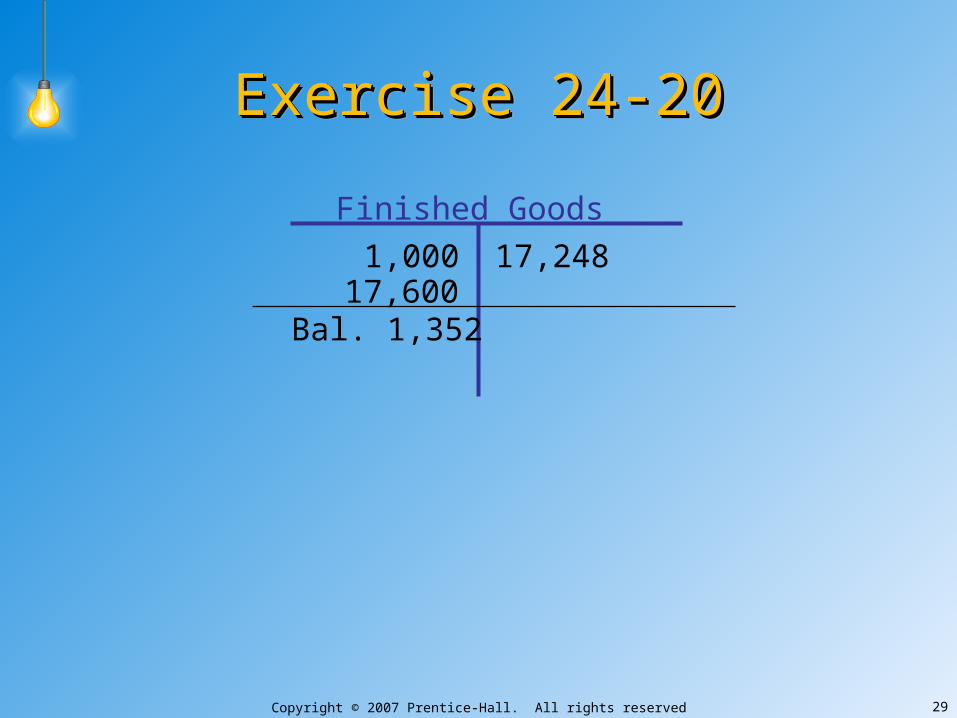
Exercise 24-20Exercise 24-20Exercise 24-20Exercise 24-20
Finished Goods
1,000 17,248
Bal. 1,35217,600
Copyright © 2007 Prentice-Hall. All rights reserved 30
Objective 5Objective 5Objective 5Objective 5
Use the four types of
quality costs to make decisions
Copyright © 2007 Prentice-Hall. All rights reserved 31
Total Quality ManagementTotal Quality ManagementTotal Quality ManagementTotal Quality Management
Goals
• To provide customers with superior products and services
• Continuous improvement– Improve quality– Eliminate defects and waste
Copyright © 2007 Prentice-Hall. All rights reserved 32
Types of Quality CostsTypes of Quality CostsTypes of Quality CostsTypes of Quality Costs
• Prevention costs – avoid poor quality goods or services– Employee training– Improved materials– Preventive maintenance
Copyright © 2007 Prentice-Hall. All rights reserved 33
Types of Quality CostsTypes of Quality CostsTypes of Quality CostsTypes of Quality Costs
• Appraisal costs – detect poor quality goods or services– Inspection throughout production– Inspection of final product– Product testing

Copyright © 2007 Prentice-Hall. All rights reserved 34
Types of Quality CostsTypes of Quality CostsTypes of Quality CostsTypes of Quality Costs
• Internal failure costs – avoid poor quality goods or services before delivery to customers– Production loss caused by downtime– Rejected product units

Copyright © 2007 Prentice-Hall. All rights reserved 35
Types of Quality CostsTypes of Quality CostsTypes of Quality CostsTypes of Quality Costs
• External failure costs – when poor quality products are delivered to customers and company has to make things right with customer– Lost profits from lost customers– Warranty costs– Service costs at customer sites– Sales returns due to quality problems
Copyright © 2007 Prentice-Hall. All rights reserved 36
E24-22E24-22E24-22E24-22
Prevention costs:
• Training employees in TQM
• Training suppliers in TQM
• Identifying preferred suppliers who commit to on-time delivery of perfect quality materials
Copyright © 2007 Prentice-Hall. All rights reserved 37
E24-22E24-22E24-22E24-22
Appraisal costs:
• Strength testing one item from each batch of panels
• Avoid inspection of raw materials
Internal failure costs:
• Avoid rework and spoilage
Copyright © 2007 Prentice-Hall. All rights reserved 38
E24-22E24-22E24-22E24-22
External failure costs:
• Avoid lost profits from lost sales due to disappointed customers
• Avoid warranty costs

Copyright © 2007 Prentice-Hall. All rights reserved 39
E24-22E24-22E24-22E24-22Costs of Adopting New Quality Program:
Prevention costs:
Training employees in TQM $ 30,000
Training suppliers in TQM 40,000
Identifying preferred suppliers who commit to on-time delivery of perfect quality materials 60,000
Appraisal costs:
Strength testing one item from each batch of panels
70,000
Total costs of adopting new quality program $200,000
Copyright © 2007 Prentice-Hall. All rights reserved 40
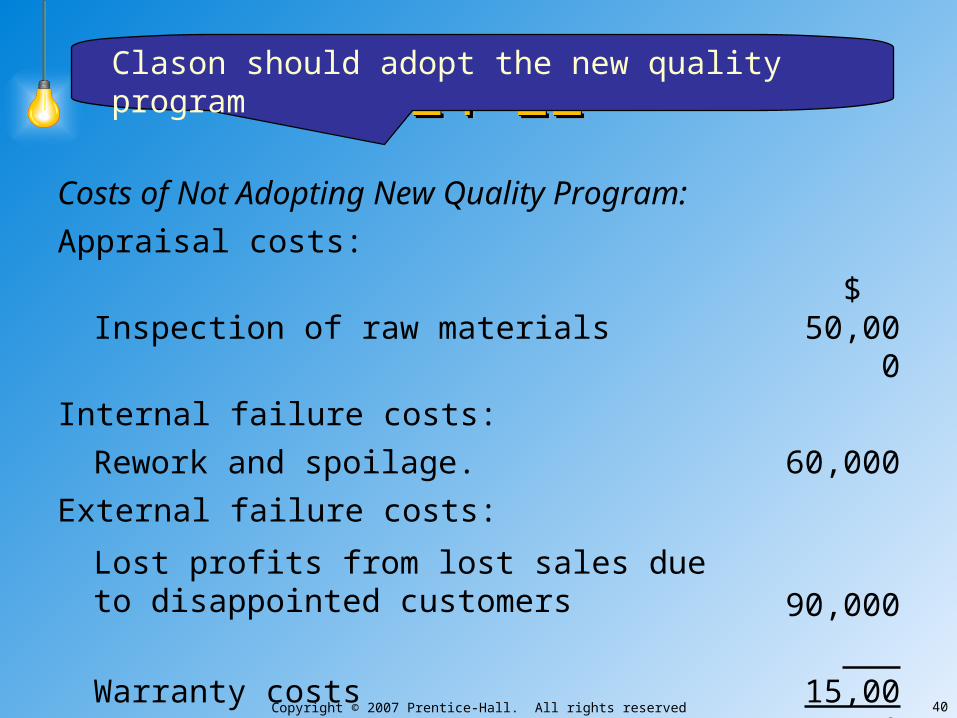
E24-22E24-22E24-22E24-22
Costs of Not Adopting New Quality Program:
Appraisal costs:
Inspection of raw materials $ 50,000
Internal failure costs:
Rework and spoilage. 60,000
External failure costs:
Lost profits from lost sales due to disappointed customers 90,000
Warranty costs 15,000
Total costs of not adopting new quality program $215,000
Clason should adopt the new quality program
Copyright © 2007 Prentice-Hall. All rights reserved 41
End of Chapter 24End of Chapter 24End of Chapter 24End of Chapter 24
Related Documents