Copyright © 2003 by Thomson Learning, Inc. A Lecture Presentation in PowerPoint to accompany Essentials of Economics by Robert L. Sexton Copyright © 2003 Thomson Learning, Inc. Thomson Learning™ is a trademark used herein under license. ALL RIGHTS RESERVED. Instructors of classes adopting EXPLORING ECONOMICS, Second Edition by Robert L. Sexton as an assigned textbook may reproduce material from this publication for classroom use or in a secure electronic network environment that prevents downloading or reproducing the copyrighted material. Otherwise, no part of this work covered by the copyright hereon may be reproduced or used in any form or by any means—graphic, electronic, or mechanical, including, but not limited to, photocopying, recording, taping, Web distribution, information networks, or information storage and retrieval systems—without the written permission of the publisher. Printed in the United States of America ISBN 0030342333

Welcome message from author
This document is posted to help you gain knowledge. Please leave a comment to let me know what you think about it! Share it to your friends and learn new things together.
Transcript

Copyright © 2003 by Thomson Learning, Inc.
A Lecture Presentation in PowerPoint
to accompany
Essentials of Economics
by Robert L. Sexton
Copyright © 2003 Thomson Learning, Inc. Thomson Learning™ is a trademark used herein under license.
ALL RIGHTS RESERVED. Instructors of classes adopting EXPLORING ECONOMICS, Second Edition by Robert L. Sexton as an assigned textbook may reproduce material from this publication for classroom use or in a secure electronic
network environment that prevents downloading or reproducing the copyrighted material. Otherwise, no part of this work covered by the copyright hereon may be reproduced or used in any form or by any means—graphic, electronic, or
mechanical, including, but not limited to, photocopying, recording, taping, Web distribution, information networks, or information storage and retrieval systems—without the written permission of the publisher.
Printed in the United States of America ISBN 0030342333

Copyright © 2003 by Thomson Learning, Inc.
Chapter 11Introduction to the
Macroeconomy

Copyright © 2003 by Thomson Learning, Inc.
11.1 Macroeconomic Goals
Three major macroeconomic goals maintain unemployment of human
resources at a low level meaning that jobs are relatively plentiful and financial suffering from lack of work is relatively
uncommon maintain relatively stable price level,
so that consumers and producers can make better decisions; and
achieve a high rate of economic growth, with growth in real, per-capita total output over
time.

Copyright © 2003 by Thomson Learning, Inc.
11.1 Macroeconomic Goals
We use the term real gross domestic product (RGDP) to measure output or production.
It is the total value of all final goods and services produced in a given time period.
The term real is used to indicate that the output is adjusted for the general increases in prices over time.

Copyright © 2003 by Thomson Learning, Inc.
8
7
6
5
4
3
2
1
0
Year
1997–2000
Economic Growth, Unemployment Rates and Inflation Rates, 1991–2000
1994–19961991–1993
Per
cent
Core Inflation
Growth in Real GDP
Unemployment Rate

Copyright © 2003 by Thomson Learning, Inc.
11.1 Macroeconomic Goals
In addition to these primary goals, concern has been expressed at various times and places about other economic issues: the "quality of life," reducing “bads” such as pollution, fairness in the distribution of income or
wealth, or becoming self‑sufficient in the production
of certain goods or services.

Copyright © 2003 by Thomson Learning, Inc.
11.1 Macroeconomic Goals
Individuals differ considerably in evaluating the issues, or whether certain "problems" are really problems. Economic growth is viewed positively by
most people but negatively by some. Some think the income distribution is about
right; others think the poorer members of society have insufficient incomes.
Others think confiscation of the income of the relatively rich reduces incentives to income-producing activities.

Copyright © 2003 by Thomson Learning, Inc.
11.1 Macroeconomic Goals
Many economic problems are pressing concerns for the U.S. government, particularly unemployment, price instability, and economic stagnation.

Copyright © 2003 by Thomson Learning, Inc.
11.2 Employment and Unemployment
The concern over both unemployment and price instability led to the passage of the Employment Act of 1946, in which the United States committed itself to policies designed to reduce unemployment in a manner consistent with price stability. The government was holding itself responsible for short-run economic fluctuations.

Copyright © 2003 by Thomson Learning, Inc.
11.2 Employment and Unemployment
Nearly everyone agrees that it is unfortunate when a person who wants a job cannot find one.
A loss of a job can mean financial insecurity and a great deal of anxiety.
High rates of unemployment in a society can lead to increased tensions and despair.

Copyright © 2003 by Thomson Learning, Inc.
11.2 Employment and Unemployment
Society loses some potential output of goods when some of its productive resources—human or non‑human— remain idle, and potential consumption is also reduced.
Clearly, there is a loss in efficiency when people are willing to work but productive equipment remains idle.

Copyright © 2003 by Thomson Learning, Inc.
11.2 Employment and Unemployment
Hence, other things equal, relatively high rates of unemployment are almost universally viewed as bad.
The unemployment rate is one measure of labor market conditions.
The unemployment rate is the number of people officially unemployed divided by the labor force.

Copyright © 2003 by Thomson Learning, Inc.
11.2 Employment and Unemployment
Official unemployment measures those over the age of 16 who are able for employment, but are unable to obtain a job.
The labor force is the number of people over the age of 16 who are either employed or unemployed.

Copyright © 2003 by Thomson Learning, Inc.
11.2 Employment and Unemployment
The civilian labor force figure excludes those in the armed services, prison or mental hospitals, as well homemakers, retirees, and full-time students because
they are not considered currently available for employment.

Copyright © 2003 by Thomson Learning, Inc.
The U.S. Labor Force, 2002
Labor Force (Employed + Unemployed)
142 Million
Civilians Employed(133.9 million)
Civilians Employed(133.9 million)
Unemployed(8.1 million)
Unemployed(8.1 million)
Out ofLabor Force(71.3 million)
Out ofLabor Force(71.3 million)
Total Adult Population213.3 Million

Copyright © 2003 by Thomson Learning, Inc.
11.2 Employment and Unemployment
By far the worst employment downturn in U.S. history was the Great Depression, which began in late 1929 and continued until 1941. Unemployment fell from only 3.2 percent of
the labor force in 1929 to more than 20 percent in the early 1930s, and
double-digit unemployment persisted through 1941.

Copyright © 2003 by Thomson Learning, Inc.
11.2 Employment and Unemployment
The debilitating impact of having millions of productive persons out of work led Americans (and people in other countries too) to say "Never again."

Copyright © 2003 by Thomson Learning, Inc.
11.2 Employment and Unemployment
Some economists would argue that modern macroeconomics, with its emphasis on the determinants of unemployment and its elimination, truly began in the 1930s.

Copyright © 2003 by Thomson Learning, Inc.
11.2 Employment and Unemployment
Unemployment since 1960 has ranged from a low of 3.5 percent in 1969 to a high of 9.7 percent in 1982.
Unemployment in the worst years is twice or more what it is in good years.
Before 1960, variations tended to be even more pronounced.

Copyright © 2003 by Thomson Learning, Inc.
Unemployment Rates, 1960–2002

Copyright © 2003 by Thomson Learning, Inc.
11.2 Employment and Unemployment
In periods of prolonged recession, some individuals feel that the chances of landing a job are so bleak that they quit looking.
These "discouraged workers," who have not actively sought work for four weeks, are not counted as unemployed; instead they fall out of the labor force.

Copyright © 2003 by Thomson Learning, Inc.
11.2 Employment and Unemployment
Also, people looking for full-time work who grudgingly settle for a part-time job are counted as “fully” employed, yet they are only “partly” employed.

Copyright © 2003 by Thomson Learning, Inc.
11.2 Employment and Unemployment
However, at least partially balancing these biases in government employment statistics is the number of people who are overemployed—that is, working overtime or extra jobs.
Also, there are a number of jobs in the underground economy that are not reported at all.

Copyright © 2003 by Thomson Learning, Inc.
11.2 Employment and Unemployment
In addition, there may be many people who claim they are actually seeking work when, in fact, they may just be going through the motions so that they can continue to collect unemployment compensation or receive other government benefits.

Copyright © 2003 by Thomson Learning, Inc.
11.2 Employment and Unemployment
Unemployment usually varies greatly between different segments of the population and over time. unemployment rate is significantly lower for
college graduates than those without a high-school diploma across sex
and race, or for those with some college education, but who
have not completed a bachelor’s degree.

Copyright © 2003 by Thomson Learning, Inc.
11.2 Employment and Unemployment
Unemployment tends to be greater among the very young, blacks and other minorities, less-skilled workers.
Adult female unemployment tends to be higher than adult male unemployment.

Copyright © 2003 by Thomson Learning, Inc.
11.2 Employment and Unemployment
Considering the great variations in unemployment for different groups in the population, we calculate separate unemployment rates for groups classified by sex, age, race, family status, and type of occupation.

Copyright © 2003 by Thomson Learning, Inc.
Unemployment in the United States by Age, Sex, and Race

Copyright © 2003 by Thomson Learning, Inc.
11.2 Employment and Unemployment
There are four main categories of unemployed workers job losers (temporarily laid off or fired), job leavers (quit), re-entrants (worked before and now
reentering labor force) new entrants (entering the labor force for
first time—primarily teenagers).

Copyright © 2003 by Thomson Learning, Inc.
11.2 Employment and Unemployment
Job losers typically account for 50 to 60 percent of the unemployed, but sizeable fractions are also due to job leavers, new entrants, and re-entrants.

Copyright © 2003 by Thomson Learning, Inc.
Reasons for Unemployment, 2002
Re-entrants30.3%
New Entrants 6.8%
Job losers52.3%
Job Leavers 10.6%

Copyright © 2003 by Thomson Learning, Inc.
11.2 Employment and Unemployment
While unemployment is painful, reducing unemployment is not costless. In the short run, reducing unemployment
may generate a higher inflation rate, especially if resources are fully employed.
Matching employees with jobs quickly may lead to mismatches between the worker’s skill level and that required for a job.
The skills of the employee may be higher than that necessary for the job, resulting in underemployment.

Copyright © 2003 by Thomson Learning, Inc.
11.2 Employment and Unemployment
The duration of unemployment is equally as important as the amount of unemployment in determining its financial consequences.
Therefore, it is useful to look at the average duration of unemployment.

Copyright © 2003 by Thomson Learning, Inc.
11.2 Employment and Unemployment
The duration of unemployment tends to be greater when the amount of
unemployment is high, and be smaller when the amount of
unemployment is low. Unemployment of any duration, of
course, means a potential loss of output that is permanent; it is not made up when unemployment starts falling again.

Copyright © 2003 by Thomson Learning, Inc.
Duration of Unemployment, 2002
Less than 5 weeks 37.6%
5 to 14 weeks 29.5
15 to 26 weeks 16.6
27 weeks and over 16.3
Duration Percent Unemployed

Copyright © 2003 by Thomson Learning, Inc.
11.2 Employment and Unemployment
The percentage of the population that is in the labor force is called the labor force participation rate. Since 1950 it has increased from 59.2
percent to 67.1 percent, mostly between 1970 and 1990.
The increase can be attributed in large part to the entry of the baby boom into the labor force and a 14.2 percentage point increase in women’s labor force participation rate.

Copyright © 2003 by Thomson Learning, Inc.
11.2 Employment and Unemployment
Total 59.2% 59.4% 60.4% 63.8% 66.4% 66.6%Men 86.4 83.3 79.7 77.4 76.1 73.8Women 33.9 37.7 43.3 51.5 57.5 59.8
SOURCE: U.S. Department of Labor Statistics
1950 1960 1970 1980 1990 2002

Copyright © 2003 by Thomson Learning, Inc.
11.3 Different Types of Unemployment
Types of unemployment. Frictional unemployment
people are temporarily between jobs is short term and results from the normal
turnover in the labor market Structural unemployment
people lack the necessary skills for available jobs
Cyclical unemployment results from short-term cyclical fluctuations in
the economy

Copyright © 2003 by Thomson Learning, Inc.
11.3 Different Types of Unemployment
With frictional unemployment, geographic and occupational mobility are considered good for the economy, generally leading human resources from activities of relatively low productivity or value to areas of higher productivity, increasing output in society as well as the wage income of the mover.

Copyright © 2003 by Thomson Learning, Inc.
11.3 Different Types of Unemployment
Hence, frictional unemployment, while not good in itself, is a byproduct of a healthy phenomenon, and because it is short-lived, it is therefore not generally viewed as a serious problem.

Copyright © 2003 by Thomson Learning, Inc.
11.3 Different Types of Unemployment
It is unusual for it to be much less than 2 percent of the labor force.
It tends to be somewhat greater in periods of low unemployment, when job opportunities are plentiful.

Copyright © 2003 by Thomson Learning, Inc.
11.3 Different Types of Unemployment
Structural employment makes it wise to look at both unemployment and job vacancy statistics in assessing labor market conditions.
Like frictional unemployment, it reflects the dynamic dimension of a changing economy.
Over time, new jobs open up that require new skills, while old jobs that required different skills disappear.

Copyright © 2003 by Thomson Learning, Inc.
11.3 Different Types of Unemployment
Many persons advocate government-subsidized retraining programs as a means of reducing structural unemployment.
The dimensions of structural unemployment are debatable, in part because of the difficulty in precisely defining the term in an operational sense. Structural unemployment varies considerably.

Copyright © 2003 by Thomson Learning, Inc.
11.3 Different Types of Unemployment
To a considerable extent, one can view both frictional and structural unemployment as phenomena resulting from imperfections in the labor market.

Copyright © 2003 by Thomson Learning, Inc.
11.3 Different Types of Unemployment
If individuals seeking jobs and employers seeking workers had better information about each other, the amount of frictional unemployment would be considerably lower.
But because information and job search are costly, the bringing of demanders and suppliers of labor services together does not occur instantaneously.

Copyright © 2003 by Thomson Learning, Inc.
11.3 Different Types of Unemployment
In years of relatively high unemployment, cyclical unemployment may result from the short-term cyclical fluctuations in the economy.
During a recession, or whenever the unemployment rate is greater than the natural rate, there is cyclical unemployment.

Copyright © 2003 by Thomson Learning, Inc.
11.3 Different Types of Unemployment
Given its volatility and dimensions, governments have viewed unemployment resulting from inadequate demand to be especially correctable through government policies.
Most attempts to solve the unemployment problem have placed an emphasis on increasing aggregate demand.

Copyright © 2003 by Thomson Learning, Inc.
11.3 Different Types of Unemployment
The median, or typical annual unemployment rate has been at or slightly above 5 percent. Some economists call this the natural rate
of unemployment. When unemployment rises well above 5
percent, we have abnormally high unemployment; when it falls below 5 percent, we have abnormally low unemployment.

Copyright © 2003 by Thomson Learning, Inc.
11.3 Different Types of Unemployment
The 5 percent natural rate of unemployment roughly equals the sum of frictional and structural unemployment at a maximum. Thus, unemployment rates below the
natural rate reflect a below-average level of frictional and structural unemployment.
Unemployment above the natural rate, however, reflects cyclical unemployment.

Copyright © 2003 by Thomson Learning, Inc.
11.3 Different Types of Unemployment
Today, economists, for the most part, have come to accept a current range somewhere between 4.5 and 5.5 percent for the natural rate of unemployment.
The natural rate of unemployment may change over time as technological, demographic, institutional, and other conditions vary.

Copyright © 2003 by Thomson Learning, Inc.
11.3 Different Types of Unemployment
When all of the economy’s labor resources, and other resources like capital are fully employed, the economy is said to be producing at its potential level of output.
That is, at the natural rate of unemployment, all resources are fully employed and the economy is producing its potential output.

Copyright © 2003 by Thomson Learning, Inc.
11.3 Different Types of Unemployment
When the economy is experiencing cyclical unemployment, unemployment rate > the natural rate.
The economy can also temporarily exceed potential output as workers take on overtime or moonlight by taking on extra employment.

Copyright © 2003 by Thomson Learning, Inc.
11.4 Inflation
Overall stable price level increases security. Inflation is a continuing rise in the overall
price level. Deflation is a falling overall price level. In both cases, a country’s currency unit
changes in purchasing power. Without price stability, consumers and
producers will experience more difficulty in coordinating their plans and decisions.

Copyright © 2003 by Thomson Learning, Inc.
11.4 Inflation
In general, the only thing that can cause a sustained increase in the rate of inflation is a high rate of growth in money.
Unanticipated and sharp price changes are almost universally considered to be a "bad" thing that needs to be remedied by some policy.

Copyright © 2003 by Thomson Learning, Inc.
11.4 Inflation
The Consumer Price Index is the standard measure of inflation.
The CPI from 1914 to 2002 is presented in the next slide.

Copyright © 2003 by Thomson Learning, Inc.
The Price Level in the United States, 1914–2002

Copyright © 2003 by Thomson Learning, Inc.
11.4 Inflation
Effects of Inflation Erodes the purchasing power of retirees on
fixed pensions, creditors, and those whose incomes are tied to long-term contracts.
Debtors and those who can quickly raise the prices on their goods can gain from inflation.
Wage earners can lose if wages rise more slowly than the price level.
Inflation’s uncertainties discourages investment and economic growth.

Copyright © 2003 by Thomson Learning, Inc.
11.4 Inflation
Inflation brings about changes in real incomes of persons, and these changes may be either desirable or undesirable.
The redistributional impact of inflation is not the result of conscious public policy; it just happens.

Copyright © 2003 by Thomson Learning, Inc.
11.4 Inflation
Inflation can raise one nation's price level relative to price levels in other countries, which can lead to difficulties in financing the purchase of
foreign goods or to a decline in the value of the national
currency relative to that of other countries.

Copyright © 2003 by Thomson Learning, Inc.
11.4 Inflation
In its extreme form, inflation can lead to a complete erosion in faith in the value of money. as in Germany after both world wars,
or hyperinflation, as in Argentina in the 1980s and Brazil in the 1990s.

Copyright © 2003 by Thomson Learning, Inc.
11.4 Inflation
In periods of high and variable inflation, households and firms have a difficult time distinguishing changes in relative prices from changes in the general price level, distorting the information that flows from price signals.
This undermines good decision-making.

Copyright © 2003 by Thomson Learning, Inc.
11.4 Inflation
Another cost of inflation is the cost that firms incur as a result of being forced to change their prices more often. menu costs—the costs of changing posted
prices shoe-leather costs—the costs of checking
on your assets. These costs are modest with low
inflation rates, but can be quite large where inflation is substantial.

Copyright © 2003 by Thomson Learning, Inc.
11.4 Inflation
The real interest rate equals the nominal interest rate minus the inflation rate. Real interest rate—the increase in
purchasing power per year Nominal interest rate—the amount you
have to pay in dollars and cents

Copyright © 2003 by Thomson Learning, Inc.
11.4 Inflation
If people correctly anticipate inflation, they will behave in a manner that will largely protect them against loss.
To protect themselves, creditors will demand a rate of interest that is large enough to compensate for the deteriorating value of the dollar.
Copyright © 2003 by Thomson Learning, Inc.
11.4 Inflation
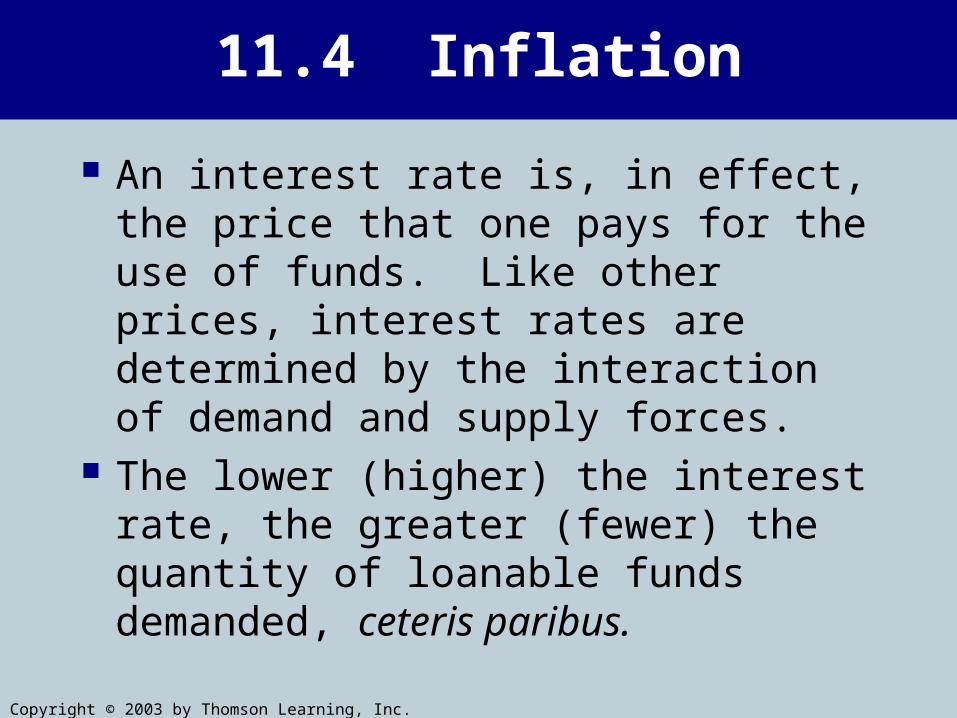
An interest rate is, in effect, the price that one pays for the use of funds. Like other prices, interest rates are determined by the interaction of demand and supply forces.
The lower (higher) the interest rate, the greater (fewer) the quantity of loanable funds demanded, ceteris paribus.

Copyright © 2003 by Thomson Learning, Inc.
r1
r0
Quantity of Loanable Funds
S1
D1
S0
0
Nominal Interest Rates
D0
No
min
al I
nte
rest
s R
ate

Copyright © 2003 by Thomson Learning, Inc.
11.4 Inflation
The higher (lower) the interest rate, the greater (fewer) the quantity of loanable funds supplied by individuals and institutions like banks, ceteris paribus.
The equilibrium price, or interest rate, will be where the quantity demanded equals the quantity supplied.

Copyright © 2003 by Thomson Learning, Inc.
11.4 Inflation
When people start expecting future inflation, creditors become less willing to lend funds at any given interest rate because they fear they will be repaid in dollars of lesser value than those they loaned.
This is depicted by a leftward shift in the supply curve of loanable funds (a decrease in supply).

Copyright © 2003 by Thomson Learning, Inc.
11.4 Inflation
Likewise, demanders of funds (borrowers) are more anxious to borrow because they think they will pay their loans back in dollars of lesser purchasing power than the dollars they borrowed. Thus, the demand for funds increases.

Copyright © 2003 by Thomson Learning, Inc.
11.4 Inflation
Both the decrease in supply and the increase in demand push up the interest rate to a new, higher equilibrium level.
Whether the equilibrium quantity of loanable funds will increase or decrease depends on the relative sizes of the shifts in the respective curves.

Copyright © 2003 by Thomson Learning, Inc.
11.4 Inflation
Often, lenders are able to anticipate inflation with reasonable accuracy.
If the inflation rate is accurately anticipated, new creditors do not lose, nor do debtors gain, from inflation.

Copyright © 2003 by Thomson Learning, Inc.
11.4 Inflation
Nominal interest rates and real interest rates do not always move together. In periods of high unexpected inflation, the
nominal interest rates can be very high while the real interest rates are low or even negative.

Copyright © 2003 by Thomson Learning, Inc.
11.4 Inflation
Increasingly, laborers, pensioners, etc. try to protect themselves from inflation by using cost-of-living clauses in contracts.Personal income taxes are also now indexed for inflation.

Copyright © 2003 by Thomson Learning, Inc.
11.4 Inflation
Some have argued that we should go one step further and index everything. All contractual arrangements would be
adjusted frequently to take account of changing prices.
Such an arrangement might reduce the impact of inflation, but it would also entail additional contracting costs (and not every good—notably currency—can be indexed).

Copyright © 2003 by Thomson Learning, Inc.
11.4 Inflation
Approaches to try to stop inflation include various policies relating to the amount of
government spending, tax rates, or the amount of money created,
as well as wage and price controls— legislation limiting wage and price increases.

Copyright © 2003 by Thomson Learning, Inc.
11.5 Economic Fluctuations
Business cycles refer to the short‑term fluctuations in economic activity, not to the long‑term trend in output, which in modern times has usually been upward.

Copyright © 2003 by Thomson Learning, Inc.
Time0
Business Cycles and Economic Growth
Rea
l G
DP
per
Yea
r
Growth
Trend

Copyright © 2003 by Thomson Learning, Inc.
11.5 Economic Fluctuations
A business cycle has four phases: expansion, peak, contraction, and trough.

Copyright © 2003 by Thomson Learning, Inc.
Time0
Four Phases of a Business Cycle
Rea
l G
DP
per
Yea
r
Growth
Trend
RecoveryRecession
Peak
Peak
Trough
Exp
ansi
on
Contraction

Copyright © 2003 by Thomson Learning, Inc.
11.5 Economic Fluctuations
Expansion phase Usually is longer than the contraction. In a growing economy, output (real GDP)
will rise from one business cycle peak to the next.
When output is rising significantly, unemployment is falling and both consumer and business confidence is high.
Investment is rising, as well as expenditures for expensive durable consumer goods, such as automobiles and household appliances.

Copyright © 2003 by Thomson Learning, Inc.
11.5 Economic Fluctuations
Peak when the expansion comes to an end when output is at the highest point in the
cycle. Contraction
a period of falling real output rising unemployment and declining
business and consumer confidence investment spending and consumer
durable expenditures fall sharply

Copyright © 2003 by Thomson Learning, Inc.
11.5 Economic Fluctuations
Contraction phase can also be called a recession.
Usually a recession is said to occur if there are two quarters of declining real GDP.

Copyright © 2003 by Thomson Learning, Inc.
11.5 Economic Fluctuations
Trough the point in time when output stops
declining the moment when business activity is at its
lowest point in the cycle Unemployment is relatively high at the
trough, although the actual maximum amount of unemployment may not occur exactly at the trough.

Copyright © 2003 by Thomson Learning, Inc.
11.5 Economic Fluctuations
Often, unemployment remains fairly high well into the expansion phase.
There is no uniformity to a business cycle's length. In both the 1980s and 1990s, the expansions were quite long by historical standards.

Copyright © 2003 by Thomson Learning, Inc.
11.5 Economic Fluctuations
The contraction phase is one of recession, a decline in business activity.
Severe recessions are called depressions. Likewise, a prolonged expansion in economic activity is sometimes called a boom.
Contractions seem to be getting shorter over time.
Copyright © 2003 by Thomson Learning, Inc.
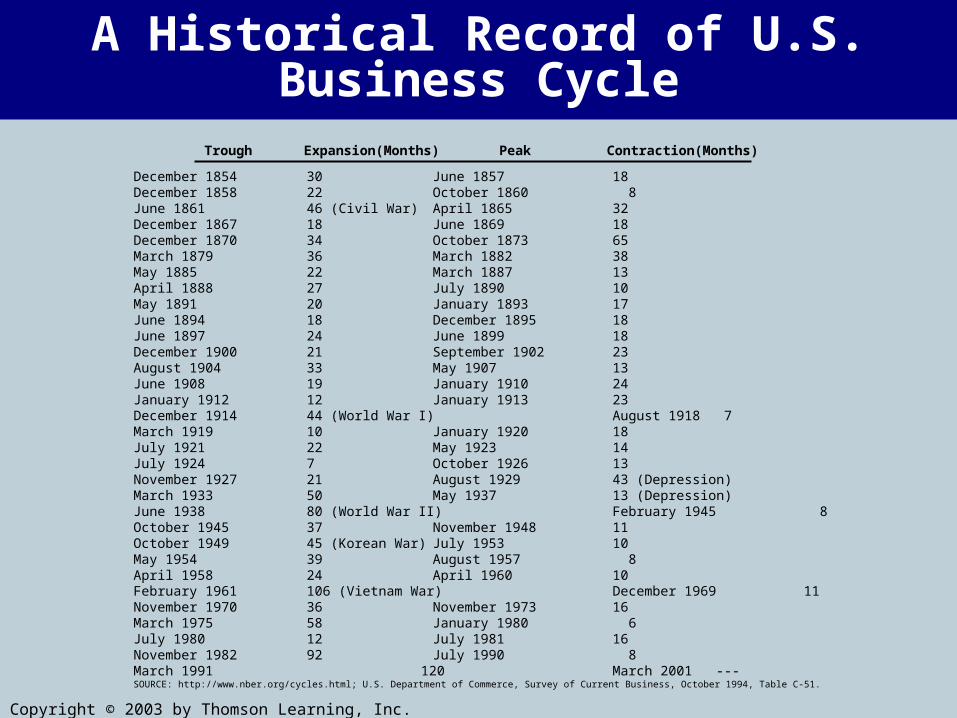
A Historical Record of U.S. Business Cycle
December 1854 30 June 1857 18December 1858 22 October 1860 8June 1861 46 (Civil War) April 1865 32December 1867 18 June 1869 18December 1870 34 October 1873 65March 1879 36 March 1882 38May 1885 22 March 1887 13April 1888 27 July 1890 10May 1891 20 January 1893 17June 1894 18 December 1895 18June 1897 24 June 1899 18December 1900 21 September 1902 23August 1904 33 May 1907 13June 1908 19 January 1910 24January 1912 12 January 1913 23December 1914 44 (World War I) August 1918 7March 1919 10 January 1920 18July 1921 22 May 1923 14July 1924 7 October 1926 13November 1927 21 August 1929 43 (Depression)March 1933 50 May 1937 13 (Depression)June 1938 80 (World War II) February 1945 8October 1945 37 November 1948 11October 1949 45 (Korean War) July 1953 10May 1954 39 August 1957 8April 1958 24 April 1960 10February 1961 106 (Vietnam War) December 1969 11November 1970 36 November 1973 16March 1975 58 January 1980 6July 1980 12 July 1981 16November 1982 92 July 1990 8March 1991 120 March 2001 ---SOURCE: http://www.nber.org/cycles.html; U.S. Department of Commerce, Survey of Current Business, October 1994, Table C-51.
Trough Expansion(Months) Peak Contraction(Months)

Copyright © 2003 by Thomson Learning, Inc.
11.5 Economic Fluctuations
Some fluctuation in economic activity also reflects seasonal patterns. Business activity tends to be high in the
two months before the winter holidays, and somewhat lower in summertime, when many families are on vacation.
Within individual industries, of course, seasonal fluctuations in output often are extremely pronounced, agriculture being the best example.

Copyright © 2003 by Thomson Learning, Inc.
11.5 Economic Fluctuations
Often, key economic statistics, like unemployment rates, are seasonally adjusted, meaning the numbers are modified to take account of normal seasonal fluctuations.

Copyright © 2003 by Thomson Learning, Inc.
11.5 Economic Fluctuations
Thus, seasonally adjusted unemployment rates in summer months are below actual unemployment rates because unemployment is normally high in summertime as a result of the inflow of school-age workers into the labor force.

Copyright © 2003 by Thomson Learning, Inc.
11.5 Economic Fluctuations
Studies have shown a strong correlation between economic performance and an incumbent’s bid for re-election. The incumbent might do everything in his
power to stimulate the economy in the period leading up to the election.
pressure the Federal Reserve System to lower the interest rate
press Congress to cut taxes or increase government spending
anything that might generate more spending and thus greater employment

Copyright © 2003 by Thomson Learning, Inc.
11.5 Economic Fluctuations
Of course, the negative side to all of this is that although the incumbent may get re-elected, the economy may have been overstimulated, causing inflationary problems.

Copyright © 2003 by Thomson Learning, Inc.
11.5 Economic Fluctuations
Businesses, government agencies, and to a lesser extent, consumers, rely on economic forecasts to learn of forthcoming developments in the business cycles.

Copyright © 2003 by Thomson Learning, Inc.
11.5 Economic Fluctuations
Economists gather statistics on economic activity in the immediate past, and use past historical relationships between these factors and the overall level of economic activity (which form the basis of the economic theories used) to formulate econometric models.
Statistics from the immediate past are plugged into the models and forecasts are made.

Copyright © 2003 by Thomson Learning, Inc.
11.5 Economic Fluctuations
Because human behavior changes, we cannot correctly make assumptions
about certain future developments, economists’ numbers are imperfect and econometric forecasts are not always
accurate. But while they are not perfect, they are
helpful.

Copyright © 2003 by Thomson Learning, Inc.
11.5 Economic Fluctuations
One less sophisticated but very useful forecasting tool is watching trends in leading economic indicators, which tend to change before the economy as a whole changes.
Copyright © 2003 by Thomson Learning, Inc.
11.5 Economic Fluctuations
There are about a dozen such leading indicators, which are compiled into an index of leading indicators.
If the index rises sharply for two or three months, it is likely (but not certain) that increases in the overall level of activity will follow.

Copyright © 2003 by Thomson Learning, Inc.
11.5 Economic Fluctuations
Since the development of the index of leading economic indicators, it has never failed to give some warning of an economic downturn.
Unfortunately, the lead time has varied widely, which makes it less accurate and can cause timing and expectation problems with policy.

Copyright © 2003 by Thomson Learning, Inc.
11.5 Economic Fluctuations
While the economic indicators do provide a warning of a likely downturn, they do not provide accurate information on the depth or duration of the downturn.
Related Documents


