Copyright © 2002 by The McGraw-Hill Companies, Inc. All rights reserved. 12-1 CHAPTER 12 The Phillips Curve and Expectations

Copyright © 2002 by The McGraw-Hill Companies, Inc. All rights reserved. 12-1 CHAPTER 12 The Phillips Curve and Expectations.
Dec 24, 2015
Welcome message from author
This document is posted to help you gain knowledge. Please leave a comment to let me know what you think about it! Share it to your friends and learn new things together.
Transcript

Copyright © 2002 by The McGraw-Hill Companies, Inc. All rights reserved.12-1
CHAPTER 12
The Phillips Curve and Expectations

Copyright © 2002 by The McGraw-Hill Companies, Inc. All rights reserved.12-2
Questions• What is the Phillips curve?• How has the natural rate of
unemployment changed in the U.S. over the past two generations?
• What determines the expected rate of inflation?
• How can we tell how expectations of inflation are formed--whether they are static, adaptive, or rational?

Copyright © 2002 by The McGraw-Hill Companies, Inc. All rights reserved.12-3
Questions• How useful is the aggregate demand-
aggregate supply framework--the IS-LM model and the Phillips curve--for understanding macroeconomic events in the U.S. over the past two generations?
• How do we connect up the sticky-price model with the flexible-price model?

Copyright © 2002 by The McGraw-Hill Companies, Inc. All rights reserved.12-4
Okun’s Law• Okun’s law shows the relationship
between the unemployment rate and real GDP
*Y*Y-Y
-0.4u*-u
u*)-(u-2.5*Y
*Y-Y
• or

Copyright © 2002 by The McGraw-Hill Companies, Inc. All rights reserved.12-5
The Three Faces of Aggregate Supply
• Aggregate supply relates the price level to the level of real GDP
• Aggregate supply can also relate the inflation rate to the level of real GDP
• Using Okun’s law, aggregate supply can also relate the inflation rate to the unemployment rate– this relationship is known as a Phillips
curve

Copyright © 2002 by The McGraw-Hill Companies, Inc. All rights reserved.12-6
The Phillips Curve• Aggregate supply can relate the
inflation rate to the level of real GDP
)-(*Y
*Y-Y e
• The right-hand side of this equation can be substituted into Okun’s Law
)-(u*)-(u2.5- e
u*)-(u2.5
-e

Copyright © 2002 by The McGraw-Hill Companies, Inc. All rights reserved.12-7
The Phillips Curve• Letting =2.5/, we get the Phillips
curve
• To allow for supply shocks, we will add an extra term to the Phillips curve (s)
u*)-(u-e
se u*)-(u-

Copyright © 2002 by The McGraw-Hill Companies, Inc. All rights reserved.12-8
Figure 12.1 - The Phillips Curve

Copyright © 2002 by The McGraw-Hill Companies, Inc. All rights reserved.12-9
Figure 12.2 - Three Faces of Aggregate Supply

Copyright © 2002 by The McGraw-Hill Companies, Inc. All rights reserved.12-10
The Phillips Curve• The slope of the Phillips curve
depends on how sticky prices and wages are– the stickier are wages and prices, the
smaller is parameter , and the flatter is the Phillips curve
• When the Phillips curve is flat, even large changes in the unemployment rate have little effect on the price level

Copyright © 2002 by The McGraw-Hill Companies, Inc. All rights reserved.12-11
The Phillips Curve
• Whenever unemployment is equal to its natural rate, inflation is equal to expected inflation– the position of the Phillips curve can be
determined if we know the natural rate of unemployment and the expected inflation rate

Copyright © 2002 by The McGraw-Hill Companies, Inc. All rights reserved.12-12
The Phillips Curve• The Phillips curve shifts if either
expected inflation or the natural rate of unemployment changes or if a supply shock occurs– a higher natural rate moves the Phillips
curve to the right– higher expected inflation moves the
Phillips curve up– adverse supply shocks move the Phillips
curve up

Copyright © 2002 by The McGraw-Hill Companies, Inc. All rights reserved.12-13
Figure 12.3 - Shifts in the Phillips Curve

Copyright © 2002 by The McGraw-Hill Companies, Inc. All rights reserved.12-14
Aggregate Demand• The aggregate demand function
developed in Chapter 11 shows how real GDP relates to the inflation rate
)'('-YY 0
• We can use Okun’s Law to develop an aggregate demand equation with unemployment on the left-hand side
)'(-uu 0

Copyright © 2002 by The McGraw-Hill Companies, Inc. All rights reserved.12-15
Aggregate Demand
• The parameter is the product of three things– how much the central bank raises the real
interest rate in response to inflation– how much real GDP changes in response
to a change in the real interest rate– how large a change in unemployment is
produced by a change in real GDP
)'(-uu 0

Copyright © 2002 by The McGraw-Hill Companies, Inc. All rights reserved.12-16
Equilibrium Levels of Inflation and Unemployment• Together, the unemployment form of
the aggregate demand relationship and the Phillips curve equation allow us to determine what the inflation and unemployment rates will be in the economy– the economy’s equilibrium is where the
two curves cross

Copyright © 2002 by The McGraw-Hill Companies, Inc. All rights reserved.12-17
Figure 12.4 - Equilibrium Levels of Unemployment and Inflation

Copyright © 2002 by The McGraw-Hill Companies, Inc. All rights reserved.12-18
Equilibrium• The economy’s equilibrium inflation
and unemployment rates depend on– the natural rate of unemployment (u*)– the expected rate of inflation (e)– supply shocks (s)– the level of unemployment when the real
interest rate is at what the central bank thinks is its long-run average (u0)
– the central bank’s target level of inflation (’)

Copyright © 2002 by The McGraw-Hill Companies, Inc. All rights reserved.12-19
Solving for Equilibrium• To solve for the equilibrium
unemployment rate, substitute the Phillips curve equation into the monetary policy reaction function
se
1)'(
1*u
1u
11
u 0

Copyright © 2002 by The McGraw-Hill Companies, Inc. All rights reserved.12-20
Solving for Equilibrium• To solve for the equilibrium inflation
rate, substitute the monetary policy reaction function into the Phillips curve
se
1
1)u*u(
1'
111
0

Copyright © 2002 by The McGraw-Hill Companies, Inc. All rights reserved.12-21
A Decrease in Exports• If export demand falls, and the central
bank does nothing, u0 will rise by u0
• The effect on the equilibrium level of unemployment will be
• The effect on the equilibrium level of inflation will be
0u1
1u
0u1
-

Copyright © 2002 by The McGraw-Hill Companies, Inc. All rights reserved.12-22
Figure 12.5 - Effects of a Fall in Exports
Copyright © 2002 by The McGraw-Hill Companies, Inc. All rights reserved.12-23
The Natural Rate of Unemployment
• Unemployment cannot be reduced below its natural rate without accelerating inflation
• If the natural rate of unemployment is high, expansionary fiscal and monetary policy are largely ineffective as tools to reduce unemployment
• Most estimates of the current natural rate in the U.S. lie between 4.5 and 5.0 percent

Copyright © 2002 by The McGraw-Hill Companies, Inc. All rights reserved.12-24
Figure 12.6 - Fluctuations in Unemployment and the Natural Rate
Copyright © 2002 by The McGraw-Hill Companies, Inc. All rights reserved.12-25
The Natural Rate of Unemployment
• Four sets of factors influence the natural rate of unemployment– demography
• the relative age and educational distribution of the labor force
– institutions• labor unions, worker mobility, taxes
– productivity growth• wage growth
– past levels of unemployment

Copyright © 2002 by The McGraw-Hill Companies, Inc. All rights reserved.12-26
Figure 12.7 - Real Wage Growth Aspirations and Productivity
Copyright © 2002 by The McGraw-Hill Companies, Inc. All rights reserved.12-27
Expected Inflation• The natural rate of unemployment and
expected inflation together determine the position of the Phillips curve– higher expected inflation moves the
Phillips curve upward

Copyright © 2002 by The McGraw-Hill Companies, Inc. All rights reserved.12-28
Expected Inflation• There are three basic scenarios for
how inflation expectations are formed– static expectations
• prevail when people ignore the fact that inflation can change
– adaptive expectations• prevail when people assume the future will be
like the recent past
– rational expectations• prevail when people use all the information
they have as best they can

Copyright © 2002 by The McGraw-Hill Companies, Inc. All rights reserved.12-29
The Phillips Curve under Static Expectations
• If inflation expectations are static, expected inflation never changes– the trade-off between inflation and
unemployment will not change from year to year
• If inflation has been low and stable, businesses will probably hold static inflation expectations

Copyright © 2002 by The McGraw-Hill Companies, Inc. All rights reserved.12-30
Figure 12.9 - Static Expectations of Inflation
Copyright © 2002 by The McGraw-Hill Companies, Inc. All rights reserved.12-31
Static Expectations of Inflation in the 1960s
• In the 1960s, the Phillips curve did not shift up or down in response to changes in expected inflation– when unemployment was above 5.5%,
inflation was below 1.5%– when unemployment was below 4%,
inflation was above 4%
• The economy moved along a stable Phillips curve

Copyright © 2002 by The McGraw-Hill Companies, Inc. All rights reserved.12-32
Figure 12.10 - Static Expectations and the Phillips Curve, 1960-1968
Copyright © 2002 by The McGraw-Hill Companies, Inc. All rights reserved.12-33
The Phillips Curve under Adaptive Expectations
• If the inflation rate varies too much for workers and businesses to ignore it and if last year’s inflation rate is a good guide to inflation this year, individuals are likely to hold adaptive expectations– inflation will be forecasted by assuming
that this year will be like last year– forecast will be good only if inflation
changes slowly

Copyright © 2002 by The McGraw-Hill Companies, Inc. All rights reserved.12-34
The Phillips Curve under Adaptive Expectations
• The Phillips curve can be writtenst
*tt1-tt )u-(u-
• The Phillips curve will shift up and down depending on whether last year’s inflation was higher or lower than the previous year’s– inflation accelerates when unemployment is less than the natural rate

Copyright © 2002 by The McGraw-Hill Companies, Inc. All rights reserved.12-35
Adaptive Expectations• Example
– the government pushes the unemployment rate down 2 percentage points below the natural rate
=1/2– last year’s inflation rate = 4%
2-1-tt
This year’s inflation rate = 4+1/22=5Next year’s inflation rate = 5+1/22=6And so on

Copyright © 2002 by The McGraw-Hill Companies, Inc. All rights reserved.12-36
Figure 12.11 - Accelerating Inflation

Copyright © 2002 by The McGraw-Hill Companies, Inc. All rights reserved.12-37
Adaptive Expectations and the Volcker Disinflation
• At the end of the 1970s, expected inflation gave the U.S. an unfavorable short-run Phillips curve trade-off
• Between 1979 and the mid-1980s, Fed chairman Paul Volcker reduced inflation from 9 to 3 percent per year
• The fall in inflation triggered a fall in expected inflation– the Phillips curve shifted down

Copyright © 2002 by The McGraw-Hill Companies, Inc. All rights reserved.12-38
Figure 12.12 - The Phillips Curve before and after the Volcker Disinflation

Copyright © 2002 by The McGraw-Hill Companies, Inc. All rights reserved.12-39
The Phillips Curve under Rational Expectations
• If the economy is changing rapidly enough that adaptive expectations lead to large errors, individuals will switch to rational expectations– People form their forecasts of future
inflation not by looking backward but by looking forward• they look at what current and expected
government policies tell us about what inflation will be

Copyright © 2002 by The McGraw-Hill Companies, Inc. All rights reserved.12-40
The Phillips Curve under Rational Expectations
• The Phillips curve will shift as rapidly as changes in economic policy that affect aggregate demand
• Anticipated changes in economic policy turn out to have no effect on the level of production or employment

Copyright © 2002 by The McGraw-Hill Companies, Inc. All rights reserved.12-41
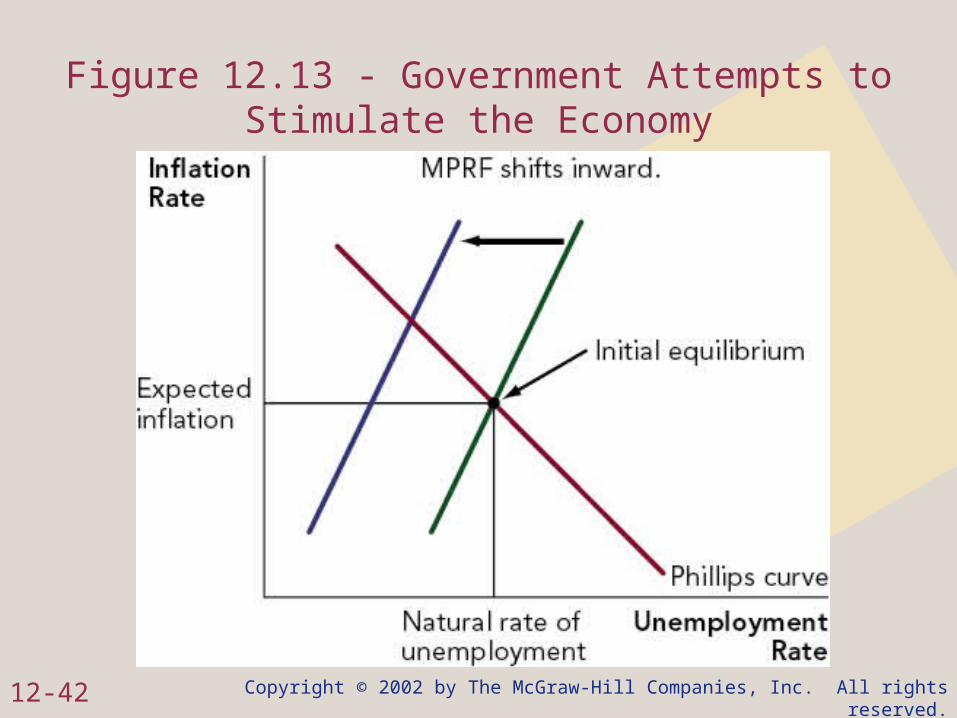
Government Policy to Stimulate the Economy
• Suppose that the unemployment rate is equal to its natural rate and inflation is equal to expected inflation
• The government takes steps to stimulate the economy by cutting taxes and raising government spending to reduce the unemployment rate below the natural rate
Copyright © 2002 by The McGraw-Hill Companies, Inc. All rights reserved.12-42
Figure 12.13 - Government Attempts to Stimulate the Economy

Copyright © 2002 by The McGraw-Hill Companies, Inc. All rights reserved.12-43
Government Policy to Stimulate the Economy
• If the policy comes as a surprise, the economy moves up and to the left along the Phillips curve in response to the change in government policy
• Unemployment will be lower, production will be higher, and the rate of inflation will be higher

Copyright © 2002 by The McGraw-Hill Companies, Inc. All rights reserved.12-44
Figure 12.14 - Results if the Shift in Policy Comes as a Surprise

Copyright © 2002 by The McGraw-Hill Companies, Inc. All rights reserved.12-45
Government Policy to Stimulate the Economy
• If the policy is anticipated, individuals will take the policy into account when they form their expectations of inflation
• The Phillips curve will shift up• There will be no effect on
unemployment or output• The rate of inflation will rise

Copyright © 2002 by The McGraw-Hill Companies, Inc. All rights reserved.12-46
Figure 12.15 - Results if the Shift in Policy Is Anticipated
Copyright © 2002 by The McGraw-Hill Companies, Inc. All rights reserved.12-47
What Kind of Expectations Do We Have?
• If inflation is low and stable, expectations are probably static
• If inflation is moderate and fluctuates slowly, expectations are probably adaptive
• When shifts in inflation are clearly related to changes in monetary policy, swift to occur, and large enough to seriously affect profitability, expectations are probably rational

Copyright © 2002 by The McGraw-Hill Companies, Inc. All rights reserved.12-48
From the Short Runto the Long Run
• In the case of an anticipated shift in economic policy under rational expectations, the long run is now
• In the absence of supply shocksu*)-(u- e
• If expectations are rational and changes in policy foreseen, expected inflation will be equal to actual inflation and unemployment will be at its natural rate

Copyright © 2002 by The McGraw-Hill Companies, Inc. All rights reserved.12-49
Figure 12.16 - Rational Expectations: The Long Run Is Now

Copyright © 2002 by The McGraw-Hill Companies, Inc. All rights reserved.12-50
From the Short Runto the Long Run
• If expectations are adaptive, the economy will approach the long run gradually– an expansionary shock will lower
unemployment, increase real GDP, and lead to an increase in the inflation rate
– individuals will raise their expectations of inflation in the next periods
– as time passes, the gaps between actual unemployment and its natural rate and actual and expected inflation will shrink to zero

Copyright © 2002 by The McGraw-Hill Companies, Inc. All rights reserved.12-51
Figure 12.17 - Adaptive Expectations Convergence to the Longer Run

Copyright © 2002 by The McGraw-Hill Companies, Inc. All rights reserved.12-52
From the Short Runto the Long Run
• Under static expectations, the long run never arrives– the gap between expected and actual
inflation can grow arbitrarily large as different shocks hit the economy• if the gap between actual and expected
inflation becomes large, individuals will not remain so foolish as to retain static expectations

Copyright © 2002 by The McGraw-Hill Companies, Inc. All rights reserved.12-53
Chapter Summary• The location of the Phillips curve is
determined by the expected rate of inflation and the natural rate of unemployment (and possibly by current, active supply shocks)– in the absence of current, active supply
shocks, the Phillips curve passes through the point at which inflation is equal to its expected value and unemployment is equal to its natural rate

Copyright © 2002 by The McGraw-Hill Companies, Inc. All rights reserved.12-54
Chapter Summary• The slope of the Phillips curve is
determined by the degree of price stickiness in the economy– the more sticky are prices, the flatter is
the Phillips curve
• The natural rate of unemployment in the U.S. has exhibited moderate swings in the past two generations

Copyright © 2002 by The McGraw-Hill Companies, Inc. All rights reserved.12-55
Chapter Summary• Three significant supply shocks have
affected the rate of inflation over the past two generations– the oil price increases of 1973 and 1979
and the oil price decrease of 1986

Copyright © 2002 by The McGraw-Hill Companies, Inc. All rights reserved.12-56
Chapter Summary• The principal determinant of the
expected rate of inflation is the past behavior of inflation– if inflation has been low and steady,
expectations are probably static– if inflation has been variable but moderate,
expectations are probably adaptive– if inflation has been high or has varied
rapidly, expectations are probably rational

Copyright © 2002 by The McGraw-Hill Companies, Inc. All rights reserved.12-57
Chapter Summary• The best way to gauge how
expectations are formed is to consider the past history of inflation– would adaptive expectations have
provided a significant edge over static ones?
– would rational expectations have provided a significant edge over adaptive ones?

Copyright © 2002 by The McGraw-Hill Companies, Inc. All rights reserved.12-58
Chapter Summary• How fast the flexible price model becomes relevant depends
on the type of inflation expectations in the economy– under static expectations, the flexible-price model never becomes
relevant– under adaptive expectations, the flexible-price model becomes
relevant gradually– under rational expectations, the flexible-price model is relevant
always
Related Documents