Copyright © 1998 Wanda Ku nkle C omputer Organization 1 Chapter 2.5 Comparing and Summarizing Performance

Welcome message from author
This document is posted to help you gain knowledge. Please leave a comment to let me know what you think about it! Share it to your friends and learn new things together.
Transcript

Copyright © 1998 Wanda Kunkle Computer Organization
1
Chapter 2.5
Comparing and Summarizing Performance

2
Response Time or Throughput
• In addition to choosing programs to use as benchmarks, we must also decide what we want to measure:
1) Response time
or
2) Throughput
3
Summarizing the Performance of a Group of
Benchmarks• Now that all other necessary decisions have
been made, we must decide how to summarize the performance of a group of benchmarks.
• Marketers and users often prefer to have a single number to compare performance, in spite of the fact that a single value provides less information regarding the performance measurements made.

4
Computing Performance• The simplest approach to summarizing
relative performance is to use the total amount of time it took to execute the group of programs on each machine.
• Using the example on page 70:– Computer B appears to be the faster machine
since it has the lower total execution time.
– Therefore:
1.9110
1001
B
A
A
B
timeExecution
timeExecution
ePerformanc
ePerformanc

5
Summarizing Performance• Thus, if the workload consists of running programs 1 and
2 an equal number of times, the statement “B is 9.1 times faster than A for programs 1 and 2 together.” would predict the relative execution times for this workload on each machine.
• This summary is directly proportional to the execution time.
• This relationship does not hold, however, if the programs in the workload are not each run the same number of times.

6
Summarizing Performance• Another way that a factor of 9.1 could
have been arrived at would have been by computing the ratio of the average execution times for machines A and B:
1.9
55
5.500
100*5.010*5.0
1000*5.01*5.0
B
A
timeexecutionAverage
timeexecutionAverage

7
Summarizing Performance
• It is a variation on this latter method of computation that must be used when the programs comprising the workload are not each run the same number of times.
• The next slide shows how relative performance would be computed if runs of program 1 made up 20% of the workload, and runs of program 2 made up 80% of the workload.
8
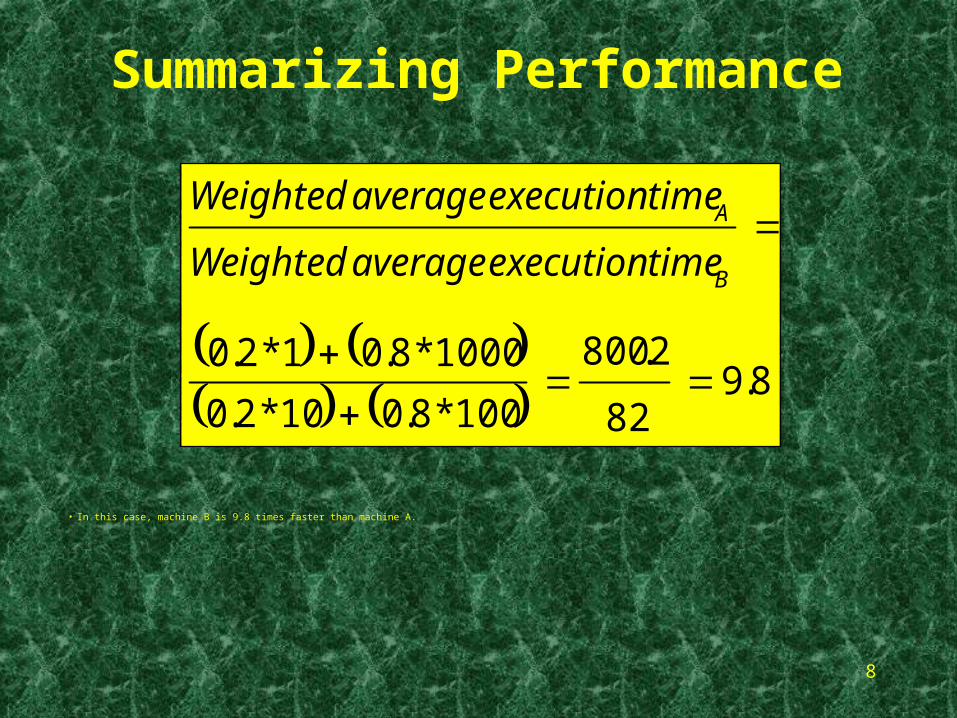
Summarizing Performance
• In this case, machine B is 9.8 times faster than machine A.
8.9
82
2.800
100*8.010*2.0
1000*8.01*2.0
B
A
timeexecutionaverageWeighted
timeexecutionaverageWeighted

Copyright © 1998 Wanda Kunkle Computer Organization
9
Chapter 2.6
Real Stuff: The SPEC95 Benchmarks and
Performance of Recent Processors
10
The SPEC Suite of Benchmarks
• SPEC is short for “System Performance Evaluation Cooperative”.
• It is one of the most popular and comprehensive sets of CPU benchmarks available.
• SPEC was created by a set of computer companies in 1989 (1988?) to improve the measurement and reporting of CPU performance through:– A better controlled measurement process– The use of more realistic benchmarks
11
The SPEC95 Suite of Benchmarks
• SPEC95 is composed of two suites of benchmarks: – SPECint95:
a set of eight compute-intensive integer/non-floating point programs
– SPECfp95: a set of 10 compute-intensive floating point programs
• Note: The programs that make up the suite are listed on page 72 of your text.

12
The SPECratio• The SPECratio is a measure of how fast a given
system might be. • The "SPECratio" is calculated by taking the elapsed
time that was measured for a system to complete a specified job, and dividing that into the reference time (the elapsed time that job took on a standardized reference machine).
• This measures how quickly, or more specifically: how many times faster than a particular reference machine, one system can perform a specified task.
• "SPECratios" are one style of metric from the SPEC CPU benchmarks; the other are SPECrates.

13
Summary Measurements
• A SPECint95 or SPECfp95 summary measurement is obtained by taking the geometric mean of the SPEC ratios.

14
Factors That Can Result in Improved CPU Performance
• Increases in clock rate• Improvements in processor
organization that lower the CPI• Compiler enhancements that lower
the instruction count or generate instructions with a lower average CPI (e.g., simpler instructions)

15
Observations Based on Performance Measurements for the Pentium and Pentium
Pro Processors• Enhancing the processor organization
without increasing the clock rate can result in improved CPU performance.
• Increasing the clock rate by a certain factor increases CPU performance by a lower factor.– This occurs because the speed of main
memory has not increased.

Copyright © 1998 Wanda Kunkle Computer Organization
16
Chapter 2.7
Fallacies and Pitfalls
17
Amdahl’s Law, or the Law of Diminishing Returns
• A pitfall that has ensnared many computer designers is:– Expecting the improvement of one aspect of
a machine to increase performance by an amount proportional to the size of the improvement
• The reality of the situation:– The performance enhancement possible with
a given improvement is limited by the amount that the improved feature is used.
– This is referred to as Amdahl’s Law, or the Law of Diminishing Returns.

18
A Corollary of Amdahl’s Law
• Make the common case fast.
19
A Fallacy
• Hardware-independent metrics predict performance.– Designers have, in the past, attempted
to assess performance using code size, instead of execution time.
– It has been determined that there is no direct relationship between code size and execution time.
– Code size is, therefore, an unreliable measure of computer performance.

20
Another Fallacy
• Synthetic benchmarks predict performance.– Since they are not real programs, they only
reflect the behavior considered when they were created.
– No user would ever run one as an application because a synthetic benchmark doesn’t compute anything of interest to a user.
– Compiler and hardware optimizations can inflate performance of these benchmarks.

Copyright © 1998 Wanda Kunkle Computer Organization
21
Chapter 2.8
Concluding Remarks

22
Important Points
• Execution time is the only reliable measure of performance.
• Any measure that summarizes performance should reflect execution time.
• All computer designers must balance performance and cost.
• The art of computer design lies in accurately determining how design alternatives will affect performance and cost.
Related Documents