ORIGINAL PAPER Copenhagen – a significant source of birch (Betula) pollen? Carsten Ambelas Skjøth & Janne Sommer & Jørgen Brandt & Martin Hvidberg & Camilla Geels & Kaj Mantzius Hansen & Ole Hertel & Lise M. Frohn & Jesper H. Christensen Received: 5 September 2007 / Revised: 29 November 2007 / Accepted: 30 November 2007 / Published online: 20 December 2007 # ISB 2007 Abstract Current aerobiological research applies the hypoth- esis that the main source of atmospheric birch (Betula) pollen is forest trees. Our results indicate that the measured levels in Copenhagen are not only due to birch trees in Danish forests but that the urban areas also seem to be a significant source of birch pollen. A number of episodes in 2003 with enhanced pollen levels in Copenhagen seem to be associated with parks and gardens inside and just outside the city. Our results also indicate one long-range transport episode from remote sources in Poland and Germany. Finally, our results show that the pollen levels vary considerably over the day and geographically between Copenhagen and the city of Roskilde, 40 km away. We suggest, that these differences in time and space in the pollen levels are mapped using an integrated monitoring strategy. Keywords Back-trajectory analysis . Modelling . Denmark . Local and regional sources Introduction Measured atmospheric pollen concentrations may be related to both local and remote sources (Stach et al. 2007). In Denmark, remote sources for birch pollen include Germany, Poland (Skjøth et al. 2007) and most likely also Sweden. Research on atmospheric transport of birch pollen is based on the assumption that the most important sources of atmospheric birch pollen in Europe are the forests in Russia, Belarus, and Baltic and Nordic countries (Ranta et al. 2006; Sofiev et al. 2006). However, long-range transport of birch pollen is an episodic phenomenon (Hjelmroos 1991, 1992; Ranta et al. 2006; Skjøth et al. 2007). It is therefore likely that most of the observed birch pollen in Denmark is related to Danish birch trees. In Denmark, the most frequent forest trees are Norway spruce (Picea abies), beech Fagus sylvatica) and oak (Quercus robur) (Larsen and Johannsen 2002), in comparison with birch, which is not accounted for separately. The Danish forest inventory includes 12 categories, where birch, due to limited frequency, is included in a residual group for other deciduous trees. Danish forests cover about 11% of the land area of the country (Larsen and Johannsen 2002) compared to 7% of the urban area (Nielsen et al. 2000). Urban areas may contain trees in considerable numbers (Konijnendijk et al. 2005). The amount of urban trees in Denmark is unknown, but an inventory from Munich in southern Germany has shown that the area covered by trees may be 20–30% for areas with housing estates, parks and cemeteries (Pauleit and Duhme 2000). Since the surface area covered by trees and the production of pollen correlate strongly (Galan 2007; Molina et al. 1996), the urban areas are most likely a significant source of tree pollen. A pilot study has shown that the eight most common road and park trees in Northern Europe include the two birch taxa Betula pubescens and B. pendula (Konijnendijk et al. 2005; Pauleit et al. 2002). Due to the small fraction of birch in Danish forests, it is likely that a large fraction of the observed birch pollen in Denmark is associated with trees in the urban Int J Biometeorol (2008) 52:453–462 DOI 10.1007/s00484-007-0139-y C. A. Skjøth (*) : J. Brandt : M. Hvidberg : C. Geels : K. M. Hansen : O. Hertel : L. M. Frohn : J. H. Christensen National Environmental Research Institute, University of Aarhus, P.O. Box 358, Frederiksborgvej 399, 4000 Roskilde, Denmark e-mail: [email protected] J. Sommer The Asthma and Allergy Association, Universitetsparken 4, 4000 Roskilde, Denmark

Welcome message from author
This document is posted to help you gain knowledge. Please leave a comment to let me know what you think about it! Share it to your friends and learn new things together.
Transcript

ORIGINAL PAPER
Copenhagen – a significant source of birch (Betula) pollen?
Carsten Ambelas Skjøth & Janne Sommer &
Jørgen Brandt & Martin Hvidberg & Camilla Geels &
Kaj Mantzius Hansen & Ole Hertel & Lise M. Frohn &
Jesper H. Christensen
Received: 5 September 2007 /Revised: 29 November 2007 /Accepted: 30 November 2007 /Published online: 20 December 2007# ISB 2007
Abstract Current aerobiological research applies the hypoth-esis that the main source of atmospheric birch (Betula) pollenis forest trees. Our results indicate that the measured levels inCopenhagen are not only due to birch trees in Danish forestsbut that the urban areas also seem to be a significant sourceof birch pollen. A number of episodes in 2003 withenhanced pollen levels in Copenhagen seem to be associatedwith parks and gardens inside and just outside the city. Ourresults also indicate one long-range transport episode fromremote sources in Poland and Germany. Finally, our resultsshow that the pollen levels vary considerably over the dayand geographically between Copenhagen and the city ofRoskilde, 40 km away. We suggest, that these differences intime and space in the pollen levels are mapped using anintegrated monitoring strategy.
Keywords Back-trajectory analysis .Modelling . Denmark .
Local and regional sources
Introduction
Measured atmospheric pollen concentrations may be relatedto both local and remote sources (Stach et al. 2007). In
Denmark, remote sources for birch pollen include Germany,Poland (Skjøth et al. 2007) and most likely also Sweden.Research on atmospheric transport of birch pollen is basedon the assumption that the most important sources ofatmospheric birch pollen in Europe are the forests inRussia, Belarus, and Baltic and Nordic countries (Ranta etal. 2006; Sofiev et al. 2006). However, long-range transportof birch pollen is an episodic phenomenon (Hjelmroos1991, 1992; Ranta et al. 2006; Skjøth et al. 2007). It istherefore likely that most of the observed birch pollen inDenmark is related to Danish birch trees. In Denmark, themost frequent forest trees are Norway spruce (Picea abies),beech Fagus sylvatica) and oak (Quercus robur) (Larsenand Johannsen 2002), in comparison with birch, which isnot accounted for separately. The Danish forest inventoryincludes 12 categories, where birch, due to limitedfrequency, is included in a residual group for otherdeciduous trees. Danish forests cover about 11% of theland area of the country (Larsen and Johannsen 2002)compared to 7% of the urban area (Nielsen et al. 2000).Urban areas may contain trees in considerable numbers(Konijnendijk et al. 2005). The amount of urban trees inDenmark is unknown, but an inventory from Munich insouthern Germany has shown that the area covered by treesmay be 20–30% for areas with housing estates, parks andcemeteries (Pauleit and Duhme 2000). Since the surfacearea covered by trees and the production of pollen correlatestrongly (Galan 2007; Molina et al. 1996), the urban areasare most likely a significant source of tree pollen. A pilotstudy has shown that the eight most common road and parktrees in Northern Europe include the two birch taxa Betulapubescens and B. pendula (Konijnendijk et al. 2005; Pauleitet al. 2002). Due to the small fraction of birch in Danishforests, it is likely that a large fraction of the observed birchpollen in Denmark is associated with trees in the urban
Int J Biometeorol (2008) 52:453–462DOI 10.1007/s00484-007-0139-y
C. A. Skjøth (*) : J. Brandt :M. Hvidberg : C. Geels :K. M. Hansen :O. Hertel : L. M. Frohn : J. H. ChristensenNational Environmental Research Institute, University of Aarhus,P.O. Box 358, Frederiksborgvej 399,4000 Roskilde, Denmarke-mail: [email protected]
J. SommerThe Asthma and Allergy Association,Universitetsparken 4,4000 Roskilde, Denmark

areas, sources outside Danish forests and remote sourcessuch as Germany, Poland and Sweden.
We have therefore formulated following hypothesis: “asignificant part of the observed birch pollen in Copenhagenis related to trees outside the Danish forests”.
This hypothesis is tested by analysis of pollen countsfrom two pollen traps. In the analysis of the measurements,we use trajectory analysis, calculated distributions of birchtrees in Danish and foreign forests as well as maps ofpotential pollen sources in and outside Denmark.
Materials and methods
Sites and observation methods
The observations in this study were obtained from two siteson Zealand: Roskilde and Copenhagen (Fig. 1). Thesurroundings of the pollen trap in Copenhagen are of urbancharacter, and the coastline is about 1 km east of the site.Continuous monitoring of pollen content in the air has beencarried out using a Burkhard volumetric spore trap of theHirst design (Hirst 1952) in Copenhagen since 1977 and inRoskilde for the year 2003. We investigated the entire 2003birch pollen season by both diurnal samples and 2-h samples
from pollen traps in Copenhagen and Roskilde. In Copenha-gen, sampling is performed from the roof of the DanishMeteorological Institute (55°43 N, 12°34 E) 15 m above sealevel. Roskilde is situated about 40 km west of Copenhagen,south of the Roskilde Fjord. The surroundings of Roskildeare agricultural but also include large deciduous forests,especially west and south-west of the city. The pollen trap inRoskilde in 2003 was placed on top of the county building(55°38′N, 12°05′E) 15 m above ground level. Daily anddiurnal variations in birch pollen counts are expressed asgrains/m3. Collection of pollen and preparation of slideswas performed according to the procedures described inSommer and Rasmussen (2006). Pollen was counted at640× magnification on 12 transverse strips for every 2 h,according to Käpyla and Penttinen (1981). Pollen frombirch was identified to generic genus.
The time period selected for detailed investigation wasdetermined by threshold analysis. The thresholds used in thisstudy were the thresholds for birch pollen forecasts inDenmark, which are indicated by three classes: few, moderateand high, corresponding to below 30, from 30 to 100 and above100 birch pollen grains/m3, respectively. These thresholds arebased on clinical thresholds defined by Petersen and Munch(1981) and Weeke (1981) and subsequently used in thresholdstudies as in Skjøth et al. (2007).
Fig. 1 Location of pollen traps(red) and meteorological sta-tions (blue) in Copenhagen andRoskilde, respectively
454 Int J Biometeorol (2008) 52:453–462
Meteorological observations have been obtained fromtwo sites close to the pollen traps (Fig. 1): Lille Valby (55°41′N, 12°07′E) and on the roof of the H.C. Ørsted InstituteBuilding (55°42′N, 12°34′E), Copenhagen University. Bothmasts are operated by National Environmental ResearchInstitute (NERI) and provide meteorological data on a half-hourly basis for use in the integrated monitoring of airquality in Denmark (Hertel et al. 2007).
Source location maps
In order to evaluate potential sources for the pollen levelsobserved in Roskilde and Copenhagen, maps of potentialsource areas such as forest and urban areas have beencompiled on local and regional scales. Forest and nature areasin the immediate vicinity of Copenhagen have been investi-gated in detail using printed local forest maps (see http://www.skovognatur.dk/Emne/Skov/Statsskovene/Skovkort/ for theonline version).
The regional scale map of potential birch pollen sourcesare based on Danish (National Environmental ResearchInstitute 2004), Swedish (Lantmäteriet 2004), German(Umweltbundesamt- DLR 2005) and Polish (GIOS 2004)land use information. This land use information is producedwithin the CORINE cooperation “The CORINE LandCover Classification” (European Commission 2005). Theresulting classification of the land surface is provided asirregular polygons with a minimum width of 100 m foreach country in the European Union. The entire classifica-tion contains 44 classes, including deciduous forest, mixedforest, coniferous forest, and low built-up area. It isassumed that areas classified as agricultural areas andconiferous forest will not produce birch pollen, whereasareas classified as forest and scrub, deciduous forest, mixedforest and built-up areas are considered as potential birchpollen sources.
The national forest inventories from Germany (Bundes-ministerium für Ernährung 2004), Poland (Budna et al.2005), and Sweden (http://www.nfi.slu.se) were used forcalculating the resulting birch tree densities in the forestareas surrounding Denmark. For the Danish area, it is onlypossible to calculate the maximum birch tree density for theclass “other deciduous trees”. In reality, this figure is anupper limit that is only valid if these areas are totallycovered by birch trees and do not contain other trees likealder (Alnus) or willow (Salix).
Back trajectory calculations
Trajectory calculations are based on meteorological calcu-lations from the operational THOR weather and airpollution forecast system (Brandt et al. 2001a,b,c) usingthe Eta weather forecast model (Janjic 1990, 1994;
Nickovic et al. 1998) and a flexible trajectory model(Skjøth et al. 2002). In the trajectory analysis, backwardtrajectories are used as an indicator of potential source areasaccording to Stach et al. (2007) and Skjøth et al. (2007).
Results
Pollen counts
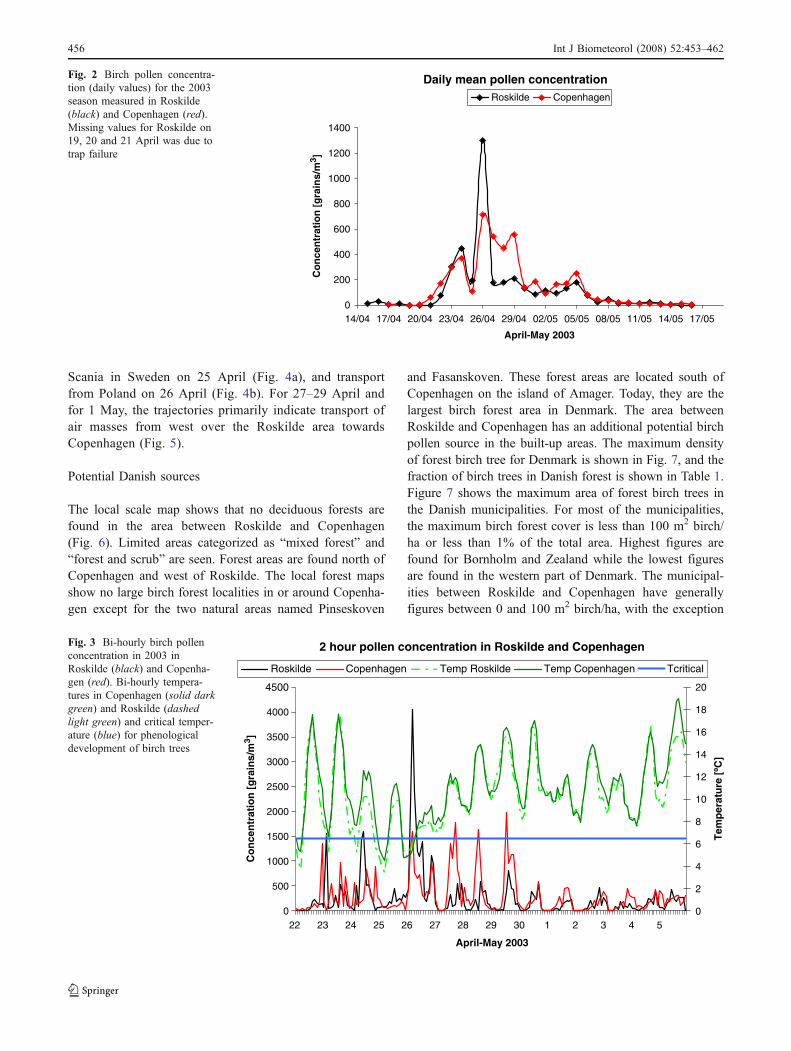
The birch pollen season 2003 started on 22 April and endedon 8 May (Fig. 2) using the 2.5% accumulation method(Goldberg et al. 1988). The concentrations peaked between22 April and 5 May when the daily mean value exceeded100 pollen/m3. The highest concentrations were measuredon 26 April, when diurnal mean values reach 710 and 1,300pollen/m3 in Copenhagen and Roskilde, respectively. The2-h concentration varied with short-term peaks during theperiod 22–24 April (Fig. 3). Concentrations were lowduring most of 25 April, and the peak was during the nightof 26 April with 4,050 pollen/m3 in Roskilde. During theperiod 27–29 April the concentration during the night wasin general very low. Day concentrations were about a factorof two higher in Copenhagen (1,000–2,000 pollen/m3) thanin Roskilde (500–750 pollen/m3). The day concentrationreached a level about 500 pollen/m3 and was generally lowat night during the period 30 April to 5 May. On 1 May, thepollen concentration was approximately a factor of twohigher in Copenhagen (500 pollen/m3) than in Roskilde(200 pollen/m3).
Temperatures
Temperatures were high on 22 and 23 April when theday temperatures peaked at 18°C (Fig. 3). On 24–26April , temperatures were generally low with a minimumbelow 4°C during the night of 25/26 April. This is belowthe critical temperature (marked in blue on Fig. 3) forphenological development of birch trees around the startof the season (Rasmussen 2002; Spieksma et al. 1995). On27 April the temperature increased and during the period27 April to 5 May the day temperature was between 12°Cand 18°C and during the night down to 8°C.
Back trajectory analysis
The main season has been analysed using backwardtrajectories. Here, we show trajectories for the day withthe lowest concentrations (25 April), the highest concen-trations (26 April) and those days where the concen-trations in Copenhagen are about twice the concentrationin Roskilde (daytimes 27–29 April and 1 May). Thebackward trajectories indicate transport from the southern
Int J Biometeorol (2008) 52:453–462 455
Scania in Sweden on 25 April (Fig. 4a), and transportfrom Poland on 26 April (Fig. 4b). For 27–29 April andfor 1 May, the trajectories primarily indicate transport ofair masses from west over the Roskilde area towardsCopenhagen (Fig. 5).
Potential Danish sources
The local scale map shows that no deciduous forests arefound in the area between Roskilde and Copenhagen(Fig. 6). Limited areas categorized as “mixed forest” and“forest and scrub” are seen. Forest areas are found north ofCopenhagen and west of Roskilde. The local forest mapsshow no large birch forest localities in or around Copenha-gen except for the two natural areas named Pinseskoven
and Fasanskoven. These forest areas are located south ofCopenhagen on the island of Amager. Today, they are thelargest birch forest area in Denmark. The area betweenRoskilde and Copenhagen has an additional potential birchpollen source in the built-up areas. The maximum densityof forest birch tree for Denmark is shown in Fig. 7, and thefraction of birch trees in Danish forest is shown in Table 1.Figure 7 shows the maximum area of forest birch trees inthe Danish municipalities. For most of the municipalities,the maximum birch forest cover is less than 100 m2 birch/ha or less than 1% of the total area. Highest figures arefound for Bornholm and Zealand while the lowest figuresare found in the western part of Denmark. The municipal-ities between Roskilde and Copenhagen have generallyfigures between 0 and 100 m2 birch/ha, with the exception
Daily mean pollen concentration
0
200
400
600
800
1000
1200
1400
14/04 17/04 20/04 23/04 26/04 29/04 02/05 05/05 08/05 11/05 14/05 17/05
April-May 2003
Co
nce
ntr
atio
n [
gra
ins/
m3 ]
Roskilde Copenhagen
Fig. 2 Birch pollen concentra-tion (daily values) for the 2003season measured in Roskilde(black) and Copenhagen (red).Missing values for Roskilde on19, 20 and 21 April was due totrap failure
2 hour pollen concentration in Roskilde and Copenhagen
0
500
1000
1500
2000
2500
3000
3500
4000
4500
22 23 24 25 26 27 28 29 30 1 2 3 4 5
April-May 2003
Co
nce
ntr
atio
n [
gra
ins/
m3 ]
0
2
4
6
8
10
12
14
16
18
20
Tem
per
atu
re [ºC
]
Roskilde Copenhagen Temp Roskilde Temp Copenhagen Tcritical
Fig. 3 Bi-hourly birch pollenconcentration in 2003 inRoskilde (black) and Copenha-gen (red). Bi-hourly tempera-tures in Copenhagen (solid darkgreen) and Roskilde (dashedlight green) and critical temper-ature (blue) for phenologicaldevelopment of birch trees
456 Int J Biometeorol (2008) 52:453–462

of the municipality containing mixed forest and forest andshrub, where the density is between 100 and 150 m2 birch/ha.
Potential sources outside Denmark
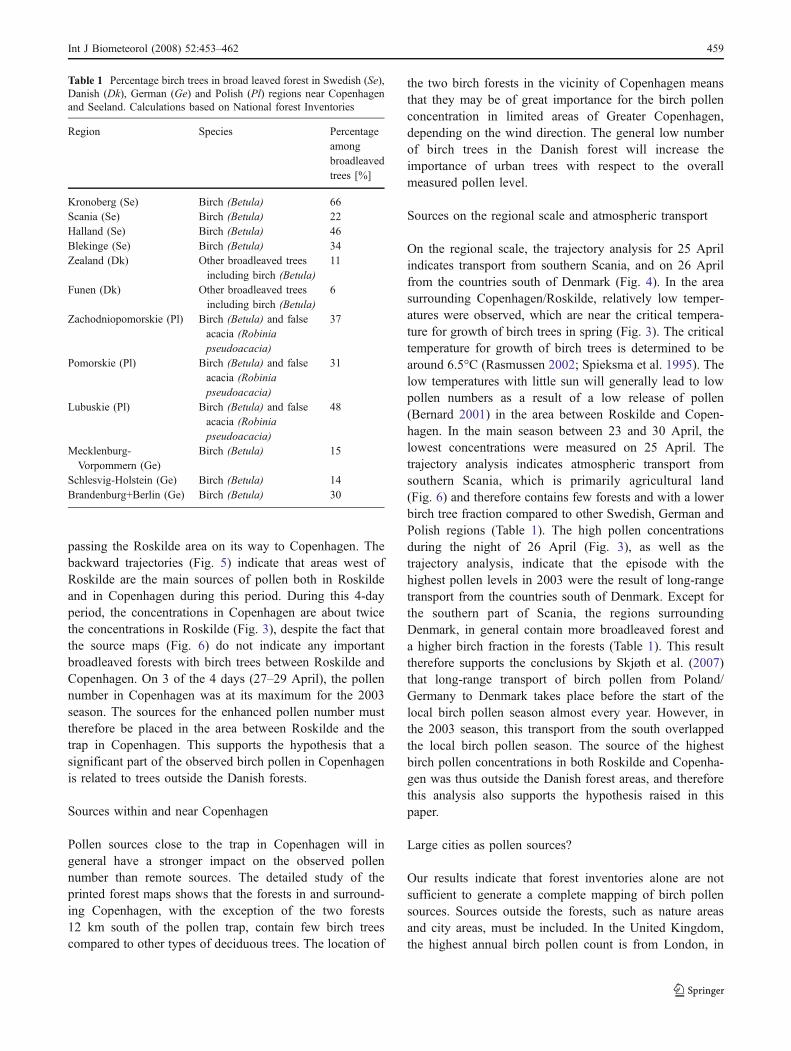
On the regional scale (Fig. 6), broadleaved forests are locatedin Sweden, Germany and Poland. The southern part of Scaniais agricultural land and contains fewer broadleaved forestareas compared to other Swedish regions (Table 1). Thebroadleaved forests in this area also contain fewer birch treescompared to other Swedish regions, as the most commonbroadleaved tree is beech. The deciduous forests on Zealandand Funen contain a relatively small amount of birchcompared to many of the regions in Sweden and Poland.
Discussion and conclusion
Our investigations support the hypothesis that a significantpart of the measured birch pollen in Copenhagen is relatedto sources outside the Danish forests. Furthermore, it isvery likely that a significant part of the measured birchpollen concentrations in Copenhagen can be attributed tosources within the city.
Increased atmospheric pollen concentrations from Roskildeto Copenhagen
On local scale, 4 days (27 April 27 to 1 May) in the mainseason had air mass transport coming from west and
Fig. 4 Possible source areas and back trajectories for 25 (a) and 26 (b) April. Black trajectories have receptor points in Roskilde and red inCopenhagen; 24 trajectories are shown for each location for every hour (0000–2300 hours UTC)
Fig. 5 Possible source areasand back trajectories to thepollen traps in Roskilde (black)and Copenhagen (red). Backtrajectories are shown with ar-rival times at 1000, 1100, 1200,1300, 1400, 1500, 1600, 1700,and 1800 hours UTC, respec-tively for 27, 28 and 29 Apriland 1 May
Int J Biometeorol (2008) 52:453–462 457

Fig. 6 Possible birch pollensource areas in selected areas ofDenmark, Sweden, Poland andGermany
0102030405060708090
100
0-25 26-50 51-75 76-100 101-150 151-200 201-400
Maximum birch forest cover [m2/ha]
Nu
mb
er o
f m
un
icip
alit
ies
Fig. 7 Maximum forest birch cover in Denmark on municipality level for the year 2000
458 Int J Biometeorol (2008) 52:453–462
passing the Roskilde area on its way to Copenhagen. Thebackward trajectories (Fig. 5) indicate that areas west ofRoskilde are the main sources of pollen both in Roskildeand in Copenhagen during this period. During this 4-dayperiod, the concentrations in Copenhagen are about twicethe concentrations in Roskilde (Fig. 3), despite the fact thatthe source maps (Fig. 6) do not indicate any importantbroadleaved forests with birch trees between Roskilde andCopenhagen. On 3 of the 4 days (27–29 April), the pollennumber in Copenhagen was at its maximum for the 2003season. The sources for the enhanced pollen number musttherefore be placed in the area between Roskilde and thetrap in Copenhagen. This supports the hypothesis that asignificant part of the observed birch pollen in Copenhagenis related to trees outside the Danish forests.
Sources within and near Copenhagen
Pollen sources close to the trap in Copenhagen will ingeneral have a stronger impact on the observed pollennumber than remote sources. The detailed study of theprinted forest maps shows that the forests in and surround-ing Copenhagen, with the exception of the two forests12 km south of the pollen trap, contain few birch treescompared to other types of deciduous trees. The location of
the two birch forests in the vicinity of Copenhagen meansthat they may be of great importance for the birch pollenconcentration in limited areas of Greater Copenhagen,depending on the wind direction. The general low numberof birch trees in the Danish forest will increase theimportance of urban trees with respect to the overallmeasured pollen level.
Sources on the regional scale and atmospheric transport
On the regional scale, the trajectory analysis for 25 Aprilindicates transport from southern Scania, and on 26 Aprilfrom the countries south of Denmark (Fig. 4). In the areasurrounding Copenhagen/Roskilde, relatively low temper-atures were observed, which are near the critical tempera-ture for growth of birch trees in spring (Fig. 3). The criticaltemperature for growth of birch trees is determined to bearound 6.5°C (Rasmussen 2002; Spieksma et al. 1995). Thelow temperatures with little sun will generally lead to lowpollen numbers as a result of a low release of pollen(Bernard 2001) in the area between Roskilde and Copen-hagen. In the main season between 23 and 30 April, thelowest concentrations were measured on 25 April. Thetrajectory analysis indicates atmospheric transport fromsouthern Scania, which is primarily agricultural land(Fig. 6) and therefore contains few forests and with a lowerbirch tree fraction compared to other Swedish, German andPolish regions (Table 1). The high pollen concentrationsduring the night of 26 April (Fig. 3), as well as thetrajectory analysis, indicate that the episode with thehighest pollen levels in 2003 were the result of long-rangetransport from the countries south of Denmark. Except forthe southern part of Scania, the regions surroundingDenmark, in general contain more broadleaved forest anda higher birch fraction in the forests (Table 1). This resulttherefore supports the conclusions by Skjøth et al. (2007)that long-range transport of birch pollen from Poland/Germany to Denmark takes place before the start of thelocal birch pollen season almost every year. However, inthe 2003 season, this transport from the south overlappedthe local birch pollen season. The source of the highestbirch pollen concentrations in both Roskilde and Copenha-gen was thus outside the Danish forest areas, and thereforethis analysis also supports the hypothesis raised in thispaper.
Large cities as pollen sources?
Our results indicate that forest inventories alone are notsufficient to generate a complete mapping of birch pollensources. Sources outside the forests, such as nature areasand city areas, must be included. In the United Kingdom,the highest annual birch pollen count is from London, in
Table 1 Percentage birch trees in broad leaved forest in Swedish (Se),Danish (Dk), German (Ge) and Polish (Pl) regions near Copenhagenand Seeland. Calculations based on National forest Inventories
Region Species Percentageamongbroadleavedtrees [%]
Kronoberg (Se) Birch (Betula) 66Scania (Se) Birch (Betula) 22Halland (Se) Birch (Betula) 46Blekinge (Se) Birch (Betula) 34Zealand (Dk) Other broadleaved trees
including birch (Betula)11
Funen (Dk) Other broadleaved treesincluding birch (Betula)
6
Zachodniopomorskie (Pl) Birch (Betula) and falseacacia (Robiniapseudoacacia)
37
Pomorskie (Pl) Birch (Betula) and falseacacia (Robiniapseudoacacia)
31
Lubuskie (Pl) Birch (Betula) and falseacacia (Robiniapseudoacacia)
48
Mecklenburg-Vorpommern (Ge)
Birch (Betula) 15
Schlesvig-Holstein (Ge) Birch (Betula) 14Brandenburg+Berlin (Ge) Birch (Betula) 30
Int J Biometeorol (2008) 52:453–462 459
comparison with other cities (Corden et al. 2000). Cordenet al. (2000), speculate on whether the magnitude of theresidential areas in the cities may be a factor of importancefor the pollen level. Corden et al. (2000) did not haveaccess to measurements outside the city and they did notuse trajectories in the analyses of their observations. Thepresent investigation and the investigations of Corden et al.(2000) indicate that urban areas may be a significant sourceof birch pollen, especially if the amount of forest area on aregional scale and/or density of birch trees in the forests islow.
Diurnal variations in the pollen load
Our investigation shows large variations over the day in thepollen level. Concentrations at night may be below 50 pollen/m3 and day time concentrations exceed 1,000 pollen/m3. Theyear 2003 had relatively low pollen levels (Sommer andRasmussen 2006). The measured level of 1,000 pollen/m3
has been exceeded other years, since the variations in pollenlevel may be large between years (Sommer and Rasmussen2006). However, the diurnal variation in the pollen numberdoes not follow a fixed pattern. Pollen released in Poland12 h earlier will arrive during the night—like the episodeobserved on 26 April. Such factors may be handled byuse of atmospheric transport models. Current transportmodels may be easily adapted to handle pollen (Helbig etal. 2004; Pasken and Pietrowicz 2005; Schueler andSchlünzen 2006; Sofiev et al. 2006) including prognosesfor the pollen concentration several days ahead. Aconstraint on obtaining realistic results with the transportmodels is that the pollen release must be correctlydescribed both locally and regionally. Our results indicatethat in Denmark this pollen release should include forestinventories as well as sources outside the forests—including nature areas with considerable tree growth andurban areas including parks and gardens.
Uncertainty in the analyses of source areas and air masstransport
The source maps are based on the Landsat ETM+ satelliteimages. This is considered the best satellite based mappingof potential source areas of birch pollen on a national scale.ETM+ has a resolution of 30 m and the resulting Corineclassification of the surface is 100-m resolution (EuropeanCommision 2005). The classification therefore has thelimitation that smaller groups of trees will not be included.Furthermore, the ETM+ will only distinguish betweendeciduous forest and coniferous forest, and not betweensingle tree species like birch and beech. Additional methods
must therefore be included to quantify birch pollen sourcesin urban areas. This is necessary in order to quantify localdifferences in pollen concentrations. The national forestinventory has other limitations. It only considers areaslarger than 0.5 ha and not small groups of trees and singletrees. Furthermore, the Danish forest statistics may only beused to provide the maximum birch tree density. The actualbirch tree density is most likely to be smaller, which furthersupports the hypothesis of a significant influence fromsources outside the Danish forest areas.
Backward trajectories have been used in the analyses. Asingle trajectory has a considerable uncertainty with atypical error of about 20% of the transport distance (Stohl1998). Groups of trajectories are therefore often applied,see, e.g., Borge et al. (2007), which has also been used inthis analysis. Furthermore, the transport distance betweenRoskilde and Copenhagen is only about 40 km, and theerror due to transport distance is therefore of minorimportance. For the analysis of 25 and 26 April, the trans-port distance to Poland and Sweden makes the importanceof the error on the trajectories larger. Since the mostimportant conclusions relate to the measurements atRoskilde and Copenhagen we do not consider thisuncertainty on the trajectories as being of high importance.
Combined measurements and model results: Integratedmonitoring
Our results indicate that the governing processes for thepollen level may be analysed in a similar way to chemicalair pollution. In Denmark, NERI performs IntegratedMonitoring (IM) of chemical air pollution in order toexplain and understand the pollution levels (Hertel et al.2007). In IM, data for the regional, urban background andlocal street levels are used to distinguish between con-tributions from local and remote sources. Atmospherictransport models are used to understand the governingprocesses and provide data for sites that are not coveredwith the measurements. This will provide the opportunity tomap regional and local variations in pollen levels both innowcasting and forecasting. The mapping will have greatuse for patients suffering from allergic rhinitis, and providebetter possibilities for relating illnesses to exposure of highpollen levels.
Future work
The presented analyses indicate that there are significantvariations in the pollen concentrations in time and spaceover the Danish area. Analyses from Germany show onlylimited correlation between development of the pollen
460 Int J Biometeorol (2008) 52:453–462
season and local phenological development (Estrella et al.2006). It is therefore likely that similar variations for otherpollen types, such as grasses (Poacea), mugwort (Artemisia),alder (Alnus) and hasel (Corylus), will be observed. Theanalyses are, however, insufficient for a full understandingand description of the variations in the pollen level onregional and local scales. The analyses should therefore besupplemented with more series of measurements in the urbanareas, carried out in dedicated campaigns that will supportthe further development of the Danish pollen monitoringprogramme supplemented by calculations with atmospherictransport models and very detailed land use data.
Acknowledgements This study was partly funded by the CopenhagenGlobal Change Initiative (COGCI) Research School (www.cogci.dk),and the National Board of Health Project: “Country-wide pollenforecasts”.
References
Bernard C (2001) Airborne birch pollen in Neuchatel (Switzerland):onset, peak and daily patterns. Aerobiologia V17:25–29
Borge R, Lumbreras J, Vardoulakis S, Kassomenos P, Rodriguez E(2007) Analysis of long-range transport influences on urbanPM10 using two-stage atmospheric trajectory clusters. AtmosEnviron 41:4434–4450
Brandt J, Christensen JH, Frohn LM, Berkowicz R (2001a) Opera-tional air pollution forecasts from regional scale to urban streetscale. Part 1: System description. Phys Chem Earth Part BHydrol Oceans Atmos 26:781–786
Brandt J, Christensen JH, Frohn LM, Berkowicz R (2001b)Operational air pollution forecasts from regional scale to urbanstreet scale. Part 2: Performance evaluation. Phys Chem EarthPart B Hydrol Oceans Atmos 26:825–830
Brandt J, Christensen JH, Frohn LM, Palmgren F, Berkowicz R,Zlatev Z (2001c) Operational air pollution forecasts fromEuropean to local scale. Atmos Environ 35:S91–S98
Budna E, Grzybowska L, Zytecka-Karolak M (2005) Forestry 2005.Statistical Publishing Establishment, Warsaw (In Polish: Lesnic-tiwo 2005)
Bundesministerium für Ernährung (2004) L. u. V. Die zweiteBundeswaldinventur - BWI2 - Das wichtichste in Kürze.Bundesministerium für Ernährung, Landwirtsaft und Verbrau-cherschutz, Berlin, Germany
Corden J, Millington W, Bailey J, Brookes M, Caulton E, Emberlin J,Mullins J, Simpson C, Wood A (2000) UK regional variations inBetula pollen (1993–1997). Aerobiologia 16:227–232
Estrella N, Menzel A, Krämer U, Behrendt H (2006) Integration offlowering dates in phenology and pollen counts in aerobiology:analysis of their spatial and temporal coherence in Germany(1992–1999). Int J Biometeorol 51:49–59
European Commision (2005) Image2000 and CLC2000 Products andMethods. 1–152. European Commision, Joint Research Center(DG JRC), Institute for Environment and Sustainability, LandManagement Unit, I-21020 Ispra (VA), Italy
Galan C (2007) Pollen production, potential sources in AerotopWorkshop, Phenology, Forecasting & Airborne Allergens, 18th-
20th May 2007. In: Stach A (ed) Laboratory of Aeropalynology,Institute of Environmental Biology. AdamMickiewicz University,Poznan, Poland
GIOS (2004) Corine land cover, Poland. http://dataservice.eea.europa.eu/dataservice/metadetails.asp?id=667
Goldberg C, Buch H, Moseholm L, Weeke ER (1988) Airborne PollenRecords in Denmark, 1977–1986. Grana 27:209–217
Helbig N, Vogel B, Vogel H, Fiedler F (2004) Numerical model-ling of pollen dispersion on the regional scale. Aerobiologia20:3–19
Hertel O, Ellermann T, Berkowicz R, Løfstrøm P, Frohn LM, Geels C,Skjøth CA, Brandt J, Christensen J, Kemp K, Ketzel M (2007)Integrated air quality monitoring: environmental chemistry.Environ Chem 4:65–74
Hirst JM (1952) An automatic vlumetric spore trap. Ann Appl Biol39:257–265
Hjelmroos M (1991) Evidence of Long-Distance Transport of BetulaPollen. Grana 30:215–228
Hjelmroos M (1992) Long-distance transport of Betula pollen grainsand allergic symptons. Aerobiologia 8:231–236
Janjic ZI (1990) The step-mountain coordinate: Physical package.Monthly Weather Review 118:1429–1443
Janjic ZI (1994) The step-mountain Eta coordinate model: Furtherdevelopments of the convection, viscous sublayer, andturbulence closure schemes. Monthly Weather Review122:927–945
Käpyla M, Penttinen A (1981) An evaluation of the microscopialcounting methods of the tape in Hirst-Burkard pollen and sporetrap. Grana 20:131–141
Konijnendijk CC, Nilsson K, Randrup TB, Schipperin J (2005) UrbanForest and Trees. Springer pp 1–520
Lantmäteriet (2004) Corine land cover,Sweden. http://dataservice.eea.europa.eu/dataservice/metadetails.asp?id=667
Larsen PH, Johannsen VK (2002) Forest and Plantations 2000 (InDanish: Skove og Plantager 2000): Danmarks Statistik,Sejrøgade 11, 2100 København Ø, Danmark.1–171
Molina RT, Rodriguez AM, Palacios IS, Lopez FG (1996) Pollenproduction in anemophilous trees. Grana 35:38–46
National Environmental Research Institute (2004) D. Corine landcover - Denmark. http://dataservice.eea.europa.eu/dataservice/metadetails.asp?id=667
Nickovic S, Mikhailovic B, Rajkovic B, Papdoupulus A (1998) TheWeather Forecasting System SKIRON II. University of Athens,Greece, pp 1–228
Nielsen K, Stjernholm M, Müller-Wohlfeil DI, Madsen IL, KjeldgaardA, Groom G, Hansen HS, Rolev AM, Hermansen B, Skov-Ptersen H, Johannsen VK, Hvidberg M, Jensen JE, Bacher V,Larsen H (2000) Area Information System - AIS DanmarksMIljøundersøgelser, Silkeborg, Denmark
Pasken R, Pietrowicz JA (2005) Using dispersion and mesoscalemeteorological models to forecast pollen concentrations. AtmosEnviron 39:7689–7701
Pauleit S, Duhme F (2000) Assessing the environmental performanceof land cover types for urban planning. Landscape UrbanPlanning 52:1–20
Pauleit S, Jones N, Garcia-Martin G, Garcia-Valdecantos JL, RiviereLM, Vidal-Beaudet L, Bodson M, Randrup TB (2002) Treeestablishment practice in towns and cities - Results from aEuropean survey. Urban For Urban Greening 1:83–96
Petersen N, Munch E (1981) Anvendelsen af aerobiologiske data. In:Weeke E, Petersen NB (eds) Pollen og Skimmelsvampesporer.Symposium om pollen og skimmelsvampesporers betydning vedallergiske sygdomme. Scanticon, Århus, Denmark
Int J Biometeorol (2008) 52:453–462 461
Ranta H, Kubin E, Siljamo P, Sofiev M, Linkosalo T, Oksanen A,Bondestam K (2006) Long distance pollen transport cause problemsfor determining the timing of birch pollen season in Fennoscandiaby using phenological observations. Grana 45:297–304
Rasmussen A (2002) The effects of climate change on the birch pollenseason in Denmark. Aerobiologia 18:253–265
Schueler S, Schlünzen K (2006) Modeling of oak pollen dispersal onthe landscape level with a mesoscale atmospheric model. EnvironModel Assess 11:179–194
Skjøth CA, Hertel O, Ellermann T (2002) Use of the ACDEPtrajectory model in the Danish nation-wide Background Moni-toring Programme. Phys Chem Earth 27:1469–1477
Skjøth CA, Sommer J, Stach A, Smith M, Brandt J (2007) The longrange transport of birch (Betula) pollen from Poland andGermany causes significant pre-season concentrations in Den-mark. Clin Exp Allergy 37:1204–1212
Sofiev M, Siljamo P, Ranta H, Rantio-Lehtimaki A (2006) Towardsnumerical forecasting of long-range air transport of birch pollen:theoretical considerations and a feasibility study. Int J Biometeorol50:392–402
Sommer J, Rasmussen A (2006) Measurements of pollen and spores inDenmark 2006 (In Danish: Pollen- og sporemålinger i Danmarksæsonen 2006). 1–50
Spieksma FTM, Emberlin JC, Hjelmroos M, Jager S, Leuschner RM(1995) Atmospheric Birch (Betula) Pollen in Europe - Trends andFluctuations in Annual Quantities and the Starting Dates of theSeasons. Grana 34:51–57
Stach A, Smith M, Skjøth CA, Brandt J (2007) Examining Ambrosiapollen episodes at Poznañ (Poland) using back-trajectory analysis.Int J Biometeorol 51:275–286
Stohl A (1998) Computation, accuracy and applications of trajectories -A review and bibliography. Atmos Environ 32:947–966
Umweltbundesamt- DLR (2005) CORINE Land Cover 2000 Germany.Final report. http://dataservice.eea.europa.eu/dataservice/metadetails.asp?id=667, 1–80
Weeke E (1981) Behandling af pollen- og skimmelssporeallergi.In: Weeke E, Petersen NB (eds) Pollen og Skimmelsvam-pesporer. Symposium om pollen og skimmelsvampesporersbetydning ved allergiske sygdomme. Scanticon, Århus,Denmark
462 Int J Biometeorol (2008) 52:453–462
Related Documents