Coordinated Assessments Data Exchange Standard Version 20160527 Effective Date: May 27, 2016 Prepared by: Pacific States Marine Fisheries Commission StreamNet Project for Pacific Northwest Coordinated Assessments Data Exchange Standard Development Team

Welcome message from author
This document is posted to help you gain knowledge. Please leave a comment to let me know what you think about it! Share it to your friends and learn new things together.
Transcript

Coordinated Assessments Data Exchange Standard
Version 20160527
Effective Date: May 27, 2016
Prepared by:Pacific States Marine Fisheries Commission
StreamNet Project
for
Pacific Northwest Coordinated Assessments Data Exchange Standard Development Team

List of "indicators" described in this documentThis document contains data structures for sharing information about several "high level indicators". You can use the table below to find which data table in the document contains the indicator of interest to you.
Indicator Rearing Type Description Table
Spawner abundance Natural origin Number of natural origin fish that actually spawn, not necessarily the number of fish returning to a spawning area. NOSA (A1)
Presmolt abundance Natural origin Number of natural origin juvenile fish in a population. Usually late summer parr, but may be any time and stage.
PresmoltAbundance (A6)
Number of outmigrants Natural origin Number of fish passing a defined point as they migrate downstream.
JuvenileOutmigrants (A4)
Smolt to adult ratio (percentage) Natural origin100 X the point estimate of the number of returning natural origin adults, divided by the point estimate of the number of smolts that produced those returning adults.
SAR (A2)
Smolt to adult ratio (percentage) Hatchery origin100 X the point estimate of the number of returning hatchery origin adults, divided by the point estimate of the number of smolts that produced those returning adults.
SAR_hatchery (B4)
Recruits per spawner: adults Natural origin Recruit per spawner ratios are specific to the locations and seasons described in each record of data. The number of "recruits" can be defined at any life stage.
RperS (A3)Recruits per spawner: juveniles Natural origin
Recruits per spawner: adults Hatchery originRecruit per spawner ratios are specific to the locations and seasons described in each record of data. The number of "recruits" can be defined only for adults at this time.
RperS_hatchery (B5)
Number of fish spawned in a hatchery under a hatchery program
Indicators for evaluating the success of hatchery programs. HatcherySpawning (B1)Proportion of broodstock actually spawned in a hatchery that are natural origin fishEgg take
Proportionate natural influence (PNI) of supplementation hatcheries
Estimate of the relative selection pressure of the natural environment on hatchery origin fish in an integrated natural / hatchery population.
PNI (B2)
Egg to release survival rates for hatchery programs Hatchery origin These survival rates are specific to a production group. EggToRelease (B3)
Coordinated Assessments Data Exchange Standard 20160527 Page 2 of 83

Table Of Contents
List of "indicators" described in this document---------------------2I. Introduction-------------------------------------------------------------------4II. Data Tables-------------------------------------------------------------------5
Section A: Indicators for Populations of Natural Origin Fishes.............5A1. NOSA Table...................................................................................5A2. SAR Table....................................................................................13A3. RperS Table.................................................................................20A4. JuvenileOutmigrants Table...........................................................27A5. JuvenileOutmigrantsDetail Table..................................................33A6. PresmoltAbundance Table...........................................................36
Section B: Indicators for Hatchery Programs and Populations of Hatchery Origin Fishes 42B1. HatcherySpawning Table.............................................................42B2. PNI Table.....................................................................................49B3. EggToRelease Table....................................................................54B4. SAR_Hatchery Table....................................................................60B5. RperS_Hatchery Table.................................................................66
III. Appendices----------------------------------------------------------------73Appendix A. Fields included in every table by reference......................73Appendix B. Glossary..............................................................................74Appendix C. Recovery Domains, Species, ESUs, MPGs, and Populations Defined by NMFS and NPCC/CBFWA/CRITFC 74Appendix D. Names of Populations Defined by NPCC / CBFWA / CRITFC (from Subbasin Planning) 75
Chinook salmon...................................................................................75Chum salmon.......................................................................................76Coho salmon........................................................................................76Kokanee...............................................................................................77Sockeye salmon..................................................................................77Steelhead.............................................................................................77
Appendix E. Defining New Populations and "Superpopulations"........79Appendix E1. Populations Table.........................................................80Appendix E2. SuperPopulations Table...............................................81
Appendix F. MS-Access 2010 Data Types.................................................82
Coordinated Assessments Data Exchange Standard 20160527 Page 3 of 83

I. Introduction
This document contains the Coordinated Assessments Data Exchange Standard. It includes 1) the names and purposes of tables, 2) relationships among tables, and 3) the names, purposes, and properties of fields within tables. This data exchange standard was created by Pacific Northwest United States representatives from state and federal and tribal fisheries management and regulatory agencies, private consultants, and federal funding agencies.
This document has three main divisions: this introduction; the descriptions of the data tables; and appendices. Sections within the data tables division describe tables that have a common theme: the first section contains the tables for indicators meant to characterize the status of naturally-spawning fish populations; the second section contains the tables meant to characterize the success of hatchery programs and the status of hatchery populations.
The tables in this document represent data tables in a computer file. The tables in this document are comprised of 4 columns. Field Name is the name of the field in the data table. Underlined field names indicate primary key designations; multiple underlined field names indicate a multi-field key. The word "unique" in parentheses under a field name indicates that each value in that field must be unique within the table: that is, the field cannot have duplicate values. Field Description is a brief definition or description of the field. The descriptions in the Field Description column are the most important part of the tables in this document. Data Type specifies the field's Microsoft Access 2010 data type; the number after a "Text" data type indicates the maximum width of the entry, in characters, for that field. Codes/Conventions provides lookup codes, business rules, or other information applicable to the field.
Coordinated Assessments Data Exchange Standard 20160527 Page 4 of 83

Required fields are indicated by bold red font in the Field Name and Data Type columns. If the Field Name and Data Type are bold and red and italicized, then whether the field is required varies according to other entries in the record -- refer to the Field Description column for business rules on when the field is required.
The data types listed in the tables' Data Type column are Microsoft Access 2010 data types. Appendix G contains details regarding these data types.
For help understanding the data tables or this document, contact Mike Banach with Pacific States Marine Fisheries Commission (503-595-3152; [email protected]).
Coordinated Assessments Data Exchange Standard 20160527 Page 5 of 83
II. Data Tables
Section A: Indicators for Populations of Natural Origin Fishes
A1. NOSA TableThis table stores information concerning natural origin spawner abundance (NOSA). "Spawner abundance" refers to the number of fish that actually spawn, not necessarily the total number of fish returning to a spawning area -- all pre-spawning mortality has already been accounted for in the numbers represented in this table. (Back to Table of Contents.)
Field Name Field Description Data Type Codes/Conventions for NOSA TableFields for defining a unique record
ID(unique)
Value used by computer to identify a record. Text 36 This value is a globally unique identifier (GUID) exactly 36 characters long. When submitting a new record you may include this value or leave it blank. If you include this value then it will be used by
the central system. If you leave it blank then a value will be created for you, and it will be sent back to your system where it must be incorporated.
When updating or deleting records this value must be included.CommonName Common name of the taxon of fish. Text 50 Enter the name of the taxon here, even if taxon name is included in the name of the population. Select from the following:
Bull trout Chinook salmon Chum salmon Coho salmon Sockeye salmon SteelheadAdditional species may be added in the future: refer to http://old.streamnet.org/SpeciesInFW.html for common names.
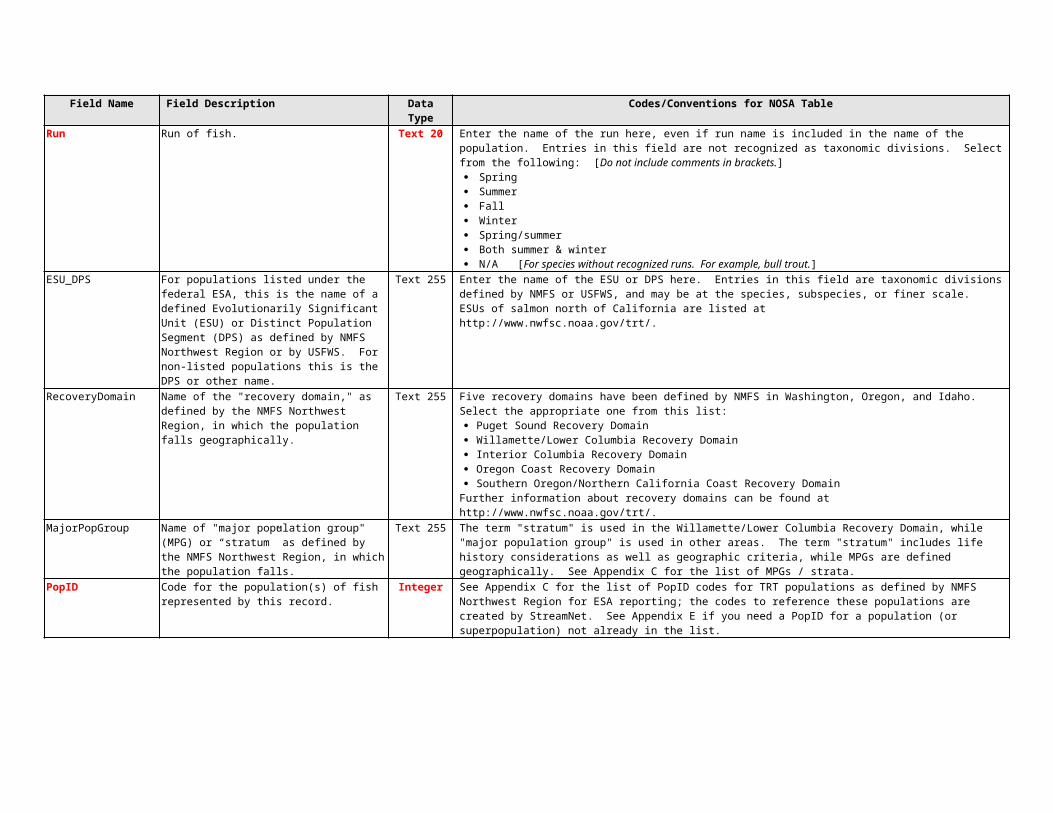
Run Run of fish. Text 20 Enter the name of the run here, even if run name is included in the name of the population. Entries in this field are not recognized as taxonomic divisions. Select from the following: [Do not include comments in brackets.] Spring Summer Fall Winter Spring/summer Both summer & winter N/A [For species without recognized runs. For example, bull trout.]
ESU_DPS For populations listed under the federal ESA, this is the name of a defined Evolutionarily Significant Unit (ESU) or Distinct Population Segment (DPS) as defined by NMFS Northwest Region or by USFWS. For non-listed populations this is the DPS or other name.
Text 255 Enter the name of the ESU or DPS here. Entries in this field are taxonomic divisions defined by NMFS or USFWS, and may be at the species, subspecies, or finer scale. ESUs of salmon north of California are listed athttp://www.nwfsc.noaa.gov/trt/.

Field Name Field Description Data Type Codes/Conventions for NOSA TableRecoveryDomain Name of the "recovery domain," as defined by the
NMFS Northwest Region, in which the population falls geographically.
Text 255 Five recovery domains have been defined by NMFS in Washington, Oregon, and Idaho. Select the appropriate one from this list: Puget Sound Recovery Domain Willamette/Lower Columbia Recovery Domain Interior Columbia Recovery Domain Oregon Coast Recovery Domain Southern Oregon/Northern California Coast Recovery Domain
Further information about recovery domains can be found at http://www.nwfsc.noaa.gov/trt/.MajorPopGroup Name of "major population group" (MPG) or
“stratum” as defined by the NMFS Northwest Region, in which the population falls.
Text 255 The term "stratum" is used in the Willamette/Lower Columbia Recovery Domain, while "major population group" is used in other areas. The term "stratum" includes life history considerations as well as geographic criteria, while MPGs are defined geographically. See Appendix C for the list of MPGs / strata.
PopID Code for the population(s) of fish represented by this record.
Integer See Appendix C for the list of PopID codes for TRT populations as defined by NMFS Northwest Region for ESA reporting; the codes to reference these populations are created by StreamNet. See Appendix E if you need a PopID for a population (or superpopulation) not already in the list.
CBFWApopName Population name as defined by CBFWA for subbasin planning purposes, from subbasin plans and agencies.
Text 255 This may include non-listed populations, or cases where geographic area does not match a defined population of a listed species. See Appendix D for the list of these population names.
Fill this field even when a population's geographic extent coincides with NWR name for a listed population.CommonPopName Population name used by local biologists. Text 255 Often this is simply the name of the population(s) as written on the original time series spreadsheets.PopFit Categorization of how well the geographic extent of
the NOSA estimate corresponds to the geographic definition of the population.
Text 8 This field is required if NullRecord = "No".Acceptable values: [Do not include comments in brackets.] Same [Estimate represents one entire population, the whole population, and nothing but the population.] Portion [Estimate represents a portion of one population. (Describe in PopFitNotes field.)] Multiple [Estimate is from more than one population. (Describe in PopFitNotes field.)]
PopFitNotes Text description of how well the natural origin spawner abundance value corresponds to the defined population, and why the data are not at the scale of a single population.
Memo This field is required if the PopFit field is "Portion" or "Multiple".If the PopFit field is "Portion" or "Multiple", describe the lack of correspondence between the defined population and the fish for which the NOSA estimate was made. Also state why this scale of data was used to represent the population instead of true population-scale data. (Examples: "Data not available at exact scale of this population."; "Data at this scale best represent the population.")
WaterBody Name of the body of water associated with the time series.
Text 255 This may be any of the following: [Do not include comments in brackets.] the name of a fluvial water body. the name of an impounded fluvial water body (reservoir). the name of a lentic water body. a description of multiple water bodies if appropriate for the time series.
To allow for easy sorting, follow these general format examples: River or stream – John Day River; Fifteen Mile Creek. Fork of a river, main name first – John Day River, North Fork
o [for North Fork John Day River] Salmon River, East Fork South Fork
o [for East Fork South Fork Salmon River] Reservoir (the word "Lake" comes first) – Lake Billy Chinook; Cougar Reservoir. Natural lake (the word "Lake" comes last) – Alturas Lake.
SpawningYear The four-digit year in which spawning of this species (and run where appropriate) began.
Integer In cases where an unusual population begins spawning uncharacteristically early (before January 1 for spring spawners) or late (after December 31 for fall spawners) for the species (and perhaps run), assign the year based on the majority of populations of this species/run in order to be consistent for all members of the spawning cohort. For example, most coho spawn in fall but a few populations do not begin spawning until after Jan. 1. The spawning year assigned for these unusual populations would match the other populations that spawned in the fall, even though these particular populations did not begin spawning until after December 31.

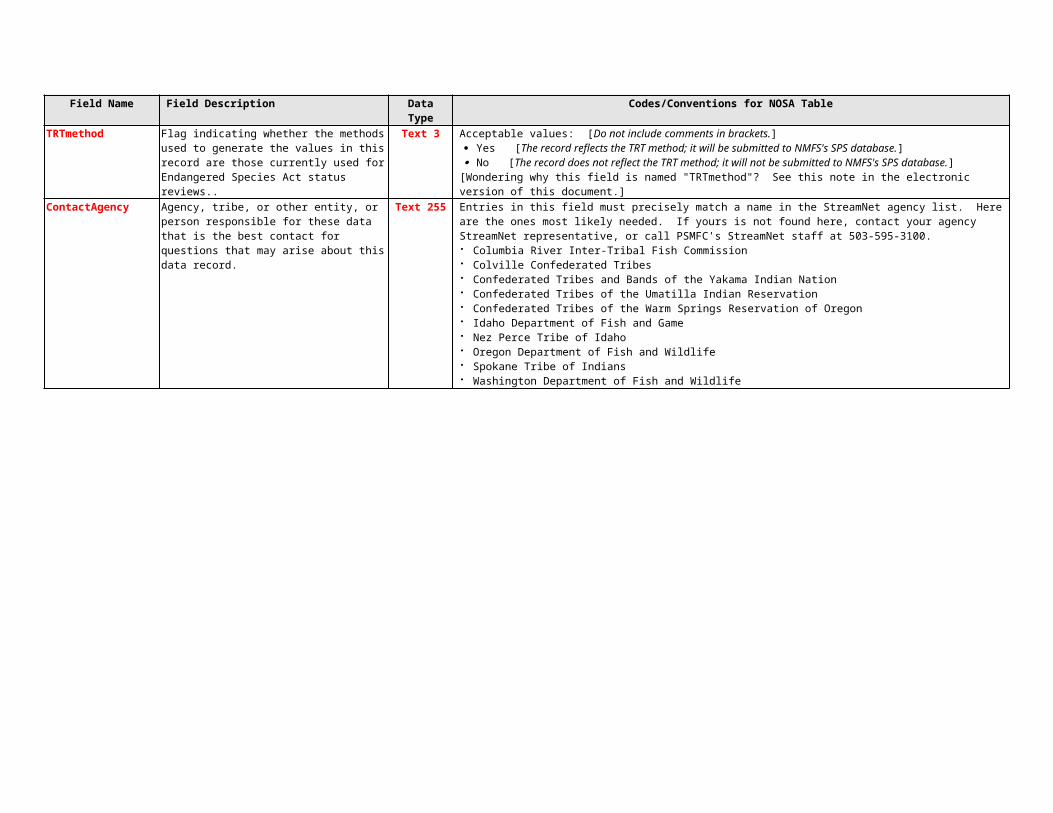
Field Name Field Description Data Type Codes/Conventions for NOSA TableTRTmethod Flag indicating whether the methods used to
generate the values in this record are those currently used for Endangered Species Act status reviews..
Text 3 Acceptable values: [Do not include comments in brackets.] Yes [The record reflects the TRT method; it will be submitted to NMFS's SPS database.] No [The record does not reflect the TRT method; it will not be submitted to NMFS's SPS database.]
[Wondering why this field is named "TRTmethod"? See this note in the electronic version of this document.]ContactAgency Agency, tribe, or other entity, or person responsible
for these data that is the best contact for questions that may arise about this data record.
Text 255 Entries in this field must precisely match a name in the StreamNet agency list. Here are the ones most likely needed. If yours is not found here, contact your agency StreamNet representative, or call PSMFC's StreamNet staff at 503-595-3100. Columbia River Inter-Tribal Fish Commission Colville Confederated Tribes Confederated Tribes and Bands of the Yakama Indian Nation Confederated Tribes of the Umatilla Indian Reservation Confederated Tribes of the Warm Springs Reservation of Oregon Idaho Department of Fish and Game Nez Perce Tribe of Idaho Oregon Department of Fish and Wildlife Spokane Tribe of Indians Washington Department of Fish and Wildlife
MethodNumber This field represents the method(s) used to calculate the values in the "Indicators" and "Metrics" sections.
This field is used in conjunction with the ContactAgency field. See the Codes/Conventions column for details.
Byte This field, along with the "ContactAgency" field above, identifies which entity calculated the values in the record and which (set of) methods where used to calculate them. These fields allow for multiple entries for the same population and year. Thus, it is possible to share values that are based on different assumptions.
If only one set of methods is used to calculate the values for all years for a population, enter "1" for all records. Even if methods changed, you can enter "1" for all records if there is always only one record per year for a population.
If more than one set of methods is used to calculate final values over a range of years for a population, use this field to indicate which records are meant to go together. For example, if method 1 was used to calculate values for 1960 through 1994, and method 2 was used to calculate values for 1980 through 2013, then there will be more than one record for the years 1980 through 1994. In such cases you would enter "1" for records that result from the 1960-1994 method, and "2" for records that result from the 1980-2013 method. Similarly, if 3 different methods are proposed in an area for the same years, then use "1" and "2" and "3" to indicate which records belong together. This lets a data user know which records belong together.
When more than one record exists for a population X year combination, it is up to biologists using the data to select the value of most use when conducting their day to day business. The ContactAgency and MethodNumber fields allow for this.
Indicators
NOSAIJ The point estimate for natural origin spawner abundance, including jacks.
Estimated number of natural origin spawners contributing to spawning in a particular year. “Spawners” includes jacks, all of natural origin. "Natural origin" means the fish's parents spawned in the wild.
Single This field is required if the NOSAEJ field is null and NullRecord = "No".
For populations for which "jacks" are not recognized, enter the NOSA estimate in this field and fill in the associated confidence limits information in the NOSAIJLowerLimit, NOSAIJUpperLimit, NOSAIJAlpha fields. The only species for which jacks are recognized are Chinook salmon, coho salmon, chum salmon (rarely), and winter steelhead (rarely).
The statistical approach used to generate the estimate should be thoroughly explained in the methods referenced in the MethodDocumentation field.
NOSAIJLowerLimit The lower limit of the confidence interval for the NOSAIJ field.
Single Minimum value = 0. If the calculated lower limit of the confidence interval is less than zero you may report 0 in this field, but we suggest you consider statistical options that prevent values outside of possible limits (these include non-normal distributions, transformations, and/or bootstrapping approaches).
NOSAIJUpperLimit The upper limit of the confidence interval for the NOSAIJ field.
Single Minimum value = 0.
NOSAIJAlpha The significance level for the NOSAIJ confidence interval, expressed as alpha.
Single Express these values as alpha values. For example, for the 95% confidence limits enter "0.05" in this field, not "95".
Mike Banach, 09/11/15,
"TRT" in the field name refers to the "Technical Recovery Teams" that defined the methods to be used for anadromous fish status assessments when this table was first created. The Field Description for this field was later broadened and improved, but the field name was kept the same to avoid breaking programming routines that had already been developed.
Field Name Field Description Data Type Codes/Conventions for NOSA TableNOSAEJ The point estimate for natural origin spawner
abundance, excluding jacks.
Estimated number of natural origin spawners contributing to spawning in a particular year. Includes only "adults" of natural origin, excluding jacks. "Natural origin" means the fish's parents spawned in the wild.
Single This field is required if the NOSAIJ field is null and NullRecord = "No".
For populations for which "jacks" are not recognized, leave this field and the associated confidence limits fields blank (NOSAEJLowerLimit, NOSAEJUpperLimit, NOSAEJAlpha). The only species for which jacks are recognized are Chinook salmon, coho salmon, chum salmon (rarely), and winter steelhead (rarely).
The statistical approach used to generate the estimate should be thoroughly explained in the methods referenced in the MethodDocumentation field.
NOSAEJLowerLimit The lower limit of the confidence interval for the NOSAEJ field.
Single Minimum value = 0. If the calculated lower limit of the confidence interval is less than zero you may report 0 in this field, but we suggest you consider statistical options that prevent values outside of possible limits (these include non-normal distributions, transformations, and/or bootstrapping approaches).
NOSAEJUpperLimit The upper limit of the confidence interval for the NOSAEJ field.
Single Minimum value = 0.
NOSAEJAlpha The significance level for the NOSAEJ confidence interval, expressed as alpha.
Single Express these values as alpha values. For example, for the 95% confidence limits enter "0.05" in this field, not "95".
NOBroodStockRemoved The number of additional natural origin fish (adults plus jacks) that would have spawned, had there not been removal of natural origin fish for use as broodstock in a hatchery.
Single This value reflects fish taken for hatchery use from the indicated spawning group. Details should be explained in the Methods citation.
Metrics supporting the "Indicators" fields above
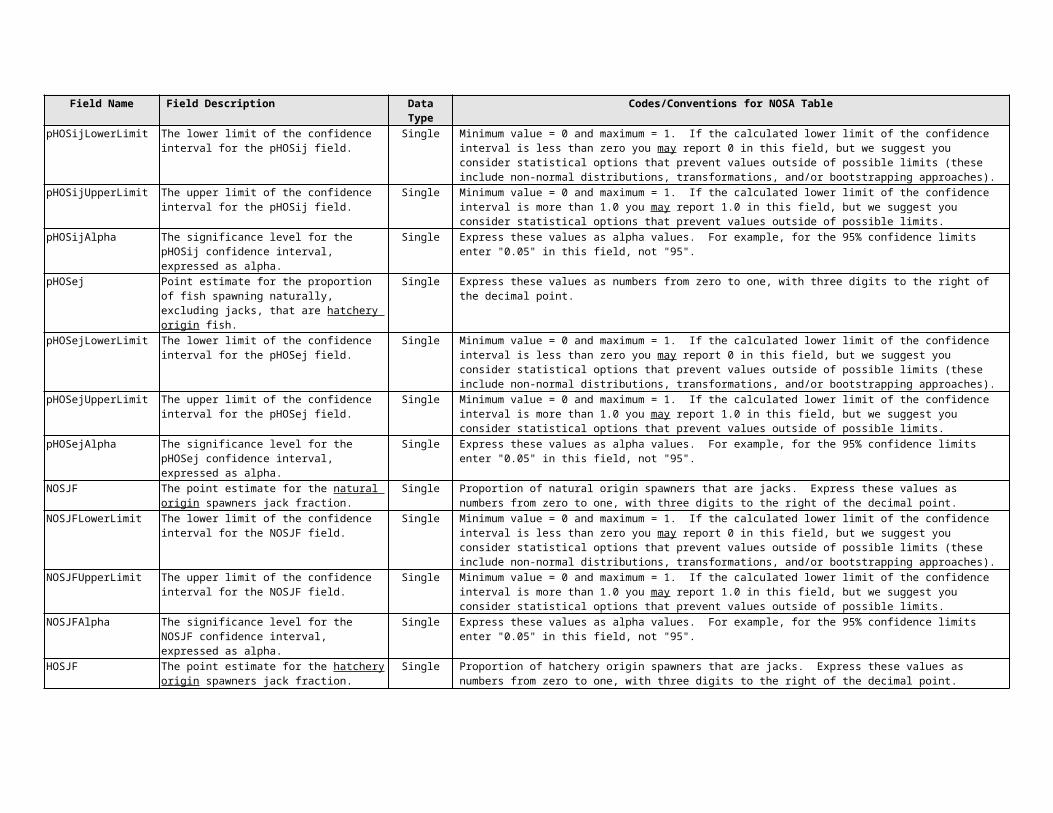
pHOSij Point estimate for the proportion of fish spawning naturally, including jacks, that are hatchery origin fish.
Single Express these values as numbers from zero to one, with three digits to the right of the decimal point.
pHOSijLowerLimit The lower limit of the confidence interval for the pHOSij field.
Single Minimum value = 0 and maximum = 1. If the calculated lower limit of the confidence interval is less than zero you may report 0 in this field, but we suggest you consider statistical options that prevent values outside of possible limits (these include non-normal distributions, transformations, and/or bootstrapping approaches).
pHOSijUpperLimit The upper limit of the confidence interval for the pHOSij field.
Single Minimum value = 0 and maximum = 1. If the calculated lower limit of the confidence interval is more than 1.0 you may report 1.0 in this field, but we suggest you consider statistical options that prevent values outside of possible limits.
pHOSijAlpha The significance level for the pHOSij confidence interval, expressed as alpha.
Single Express these values as alpha values. For example, for the 95% confidence limits enter "0.05" in this field, not "95".
pHOSej Point estimate for the proportion of fish spawning naturally, excluding jacks, that are hatchery origin fish.
Single Express these values as numbers from zero to one, with three digits to the right of the decimal point.
pHOSejLowerLimit The lower limit of the confidence interval for the pHOSej field.
Single Minimum value = 0 and maximum = 1. If the calculated lower limit of the confidence interval is less than zero you may report 0 in this field, but we suggest you consider statistical options that prevent values outside of possible limits (these include non-normal distributions, transformations, and/or bootstrapping approaches).
pHOSejUpperLimit The upper limit of the confidence interval for the pHOSej field.
Single Minimum value = 0 and maximum = 1. If the calculated lower limit of the confidence interval is more than 1.0 you may report 1.0 in this field, but we suggest you consider statistical options that prevent values outside of possible limits.
pHOSejAlpha The significance level for the pHOSej confidence interval, expressed as alpha.
Single Express these values as alpha values. For example, for the 95% confidence limits enter "0.05" in this field, not "95".
NOSJF The point estimate for the natural origin spawners jack fraction.
Single Proportion of natural origin spawners that are jacks. Express these values as numbers from zero to one, with three digits to the right of the decimal point.
NOSJFLowerLimit The lower limit of the confidence interval for the NOSJF field.
Single Minimum value = 0 and maximum = 1. If the calculated lower limit of the confidence interval is less than zero you may report 0 in this field, but we suggest you consider statistical options that prevent values outside of possible limits (these include non-normal distributions, transformations, and/or bootstrapping approaches).
NOSJFUpperLimit The upper limit of the confidence interval for the NOSJF field.
Single Minimum value = 0 and maximum = 1. If the calculated lower limit of the confidence interval is more than 1.0 you may report 1.0 in this field, but we suggest you consider statistical options that prevent values outside of possible limits.

Field Name Field Description Data Type Codes/Conventions for NOSA TableNOSJFAlpha The significance level for the NOSJF confidence
interval, expressed as alpha.Single Express these values as alpha values. For example, for the 95% confidence limits enter "0.05" in this field, not "95".
HOSJF The point estimate for the hatchery origin spawners jack fraction.
Single Proportion of hatchery origin spawners that are jacks. Express these values as numbers from zero to one, with three digits to the right of the decimal point.
TSAIJ The point estimate for total spawner abundance, including jacks.
Single Estimated total number of fish contributing to spawning in a particular year. Includes both natural origin and hatchery origin returns, and adult and jack age classes.
TSAIJLowerLimit The lower limit of the confidence interval for the TSAIJ field.
Single Minimum value = 0. If the calculated lower limit of the confidence interval is less than zero you may report 0 in this field, but we suggest you consider statistical options that prevent values outside of possible limits (these include non-normal distributions, transformations, and/or bootstrapping approaches).
TSAIJUpperLimit The upper limit of the confidence interval for the TSAIJ field.
Single Minimum value = 0.
TSAIJAlpha The significance level for the TSAIJ confidence interval, expressed as alpha.
Single Express these values as alpha values. For example, for the 95% confidence limits enter "0.05" in this field, not "95".
TSAEJ The point estimate for total spawner abundance, excluding jacks.
Single Estimated total number of fish contributing to spawning in a particular year. Includes both natural origin and hatchery origin returns, for adult age classes excluding jacks.
TSAEJLowerLimit The lower limit of the confidence interval for the TSAEJ field.
Single Minimum value = 0. If the calculated lower limit of the confidence interval is less than zero you may report 0 in this field, but we suggest you consider statistical options that prevent values outside of possible limits (these include non-normal distributions, transformations, and/or bootstrapping approaches).
TSAEJUpperLimit The upper limit of the confidence interval for the TSAEJ field.
Single Minimum value = 0.
TSAEJAlpha The significance level for the TSAEJ confidence interval, expressed as alpha.
Single Express these values as alpha values. For example, for the 95% confidence limits enter "0.05" in this field, not "95".
Age determination
Age2Prop The proportion of natural origin fish that were age 2 (brood year +2).
Single Values must be between 0 and 1. Express with 3 digits to the right of the decimal point.
Ages in this table are based on the year spawning occurred, not necessarily the year eggs hatched, so care must be taken in reporting ages.Assigning age can be complicated based on the life history (generally, salmon return and spawn in one year but hatch in the next, steelhead spawn and hatch in the same year). Make sure these details are accounted for in assigning ages.
The age distribution numbers reported here must meet three criteria. If these criteria are not met then do not report ages.1. These age fields contain proportions by age for the natural origin fish. They are not the numbers of fish actually aged, nor
are they the expanded numbers for a population. Consider this scenario: 10,000 fish spawn (as reported in the NOSAIJ field) 500 fish were aged After age analysis is completed it is determined that 1% of the fish (meaning 100 of the 10,000) were age 2. In this case the value in this field should be 0.01 (100/10,000) not 100, 500, or 10,000. Nor is it 0.2 (100/500).
2. The values of the Age2Prop through Age11PlusProp fields must sum to 1.00 ± 0.01.3. The age distribution must be derived only from the natural origin fish of the specific population this record represents.
Therefore, do not include age data that are derived in part or in whole from any other group of fish.The age information may represent the exact group of spawning fish indicated in the NOSAIJ field, or a somewhat different group of fish. For example, the ages may represent the population as the fish passed a dam on their way to the spawning areas. Whatever may be the case, ensure this information is included in the protocol and method documentation section below.
Field Name Field Description Data Type Codes/Conventions for NOSA TableAge2PropLowerLimit The lower limit of the confidence interval for the
Age2Prop field.Single The associated alpha value is in the AgePropAlpha field, which is found below after the fields for age 11+.
Minimum value = 0 and maximum = 1. If the calculated lower limit of the confidence interval is less than zero you may report 0 in this field, but we suggest you consider statistical options that prevent values outside of possible limits (these include non-normal distributions, transformations, and/or bootstrapping approaches).
Age2PropUpperLimit The upper limit of the confidence interval for the Age2Prop field.
Single See the Codes/Conventions for the Age2PropLowerLimit field.
Minimum value = 0 and maximum = 1. If the calculated lower limit of the confidence interval is more than 1.0 you may report 1.0 in this field, but we suggest you consider statistical options that prevent values outside of possible limits.
Age3Prop The proportion of natural origin fish that were age 3 (brood year +3).
Single See the Codes/Conventions column for the Age2Prop field.
Age3PropLowerLimit The lower limit of the confidence interval for the Age3Prop field.
Single See the Codes/Conventions for the Age2PropLowerLimit field.
Age3PropUpperLimit The upper limit of the confidence interval for the Age3Prop field.
Single See the Codes/Conventions for the Age2PropUpperLimit field.
Age4Prop The proportion of natural origin fish that were age 4 (brood year +4).
Single See the Codes/Conventions column for the Age2Prop field.
Age4PropLowerLimit The lower limit of the confidence interval for the Age4Prop field.
Single See the Codes/Conventions for the Age2PropLowerLimit field.
Age4PropUpperLimit The upper limit of the confidence interval for the Age4Prop field.
Single See the Codes/Conventions for the Age2PropUpperLimit field.
Age5Prop The proportion of natural origin fish that were age 5 (brood year +5).
Single See the Codes/Conventions column for the Age2Prop field.
Age5PropLowerLimit The lower limit of the confidence interval for the Age5Prop field.
Single See the Codes/Conventions for the Age2PropLowerLimit field.
Age5PropUpperLimit The upper limit of the confidence interval for the Age5Prop field.
Single See the Codes/Conventions for the Age2PropUpperLimit field.
Age6Prop The proportion of natural origin fish that were age 6 (brood year +6).
Single See the Codes/Conventions column for the Age2Prop field.
Age6PropLowerLimit The lower limit of the confidence interval for the Age6Prop field.
Single See the Codes/Conventions for the Age2PropLowerLimit field.
Age6PropUpperLimit The upper limit of the confidence interval for the Age6Prop field.
Single See the Codes/Conventions for the Age2PropUpperLimit field.
Age7Prop The proportion of natural origin fish that were age 7 (brood year +7).
Single See the Codes/Conventions column for the Age2Prop field.
Age7PropLowerLimit The lower limit of the confidence interval for the Age7Prop field.
Single See the Codes/Conventions for the Age2PropLowerLimit field.
Age7PropUpperLimit The upper limit of the confidence interval for the Age7Prop field.
Single See the Codes/Conventions for the Age2PropUpperLimit field.
Age8Prop The proportion of natural origin fish that were age 8 (brood year +8).
Single See the Codes/Conventions column for the Age2Prop field.
Age8PropLowerLimit The lower limit of the confidence interval for the Age8Prop field.
Single See the Codes/Conventions for the Age2PropLowerLimit field.
Age8PropUpperLimit The upper limit of the confidence interval for the Age8Prop field.
Single See the Codes/Conventions for the Age2PropUpperLimit field.
Age9Prop The proportion of natural origin fish that were age 9 (brood year +9).
Single See the Codes/Conventions column for the Age2Prop field.

Field Name Field Description Data Type Codes/Conventions for NOSA TableAge9PropLowerLimit The lower limit of the confidence interval for the
Age9Prop field.Single See the Codes/Conventions for the Age2PropLowerLimit field.
Age9PropUpperLimit The upper limit of the confidence interval for the Age9Prop field.
Single See the Codes/Conventions for the Age2PropUpperLimit field.
Age10Prop The proportion of natural origin fish that were age 10 (brood year +10).
Single See the Codes/Conventions column for the Age2Prop field.
Age10PropLowerLimit The lower limit of the confidence interval for the Age10Prop field.
Single See the Codes/Conventions for the Age2PropLowerLimit field.
Age10PropUpperLimit The upper limit of the confidence interval for the Age10Prop field.
Single See the Codes/Conventions for the Age2PropUpperLimit field.
Age11PlusProp The proportion of natural origin fish that were age 11 (brood year +11) or older.
Single See the Codes/Conventions column for the Age2Prop field.
Age11PlusPropLowerLimit
The lower limit of the confidence interval for the Age11PlusProp field.
Single See the Codes/Conventions for the Age2PropLowerLimit field.
Age11PlusPropUpperLimit
The upper limit of the confidence interval for the Age11PlusProp field.
Single See the Codes/Conventions for the Age2PropUpperLimit field.
AgePropAlpha The significance level for the Age_x_Prop confidence intervals, expressed as alpha.
Single Express these values as alpha values. For example, for the 95% confidence limits enter "0.05" in this field, not "95".
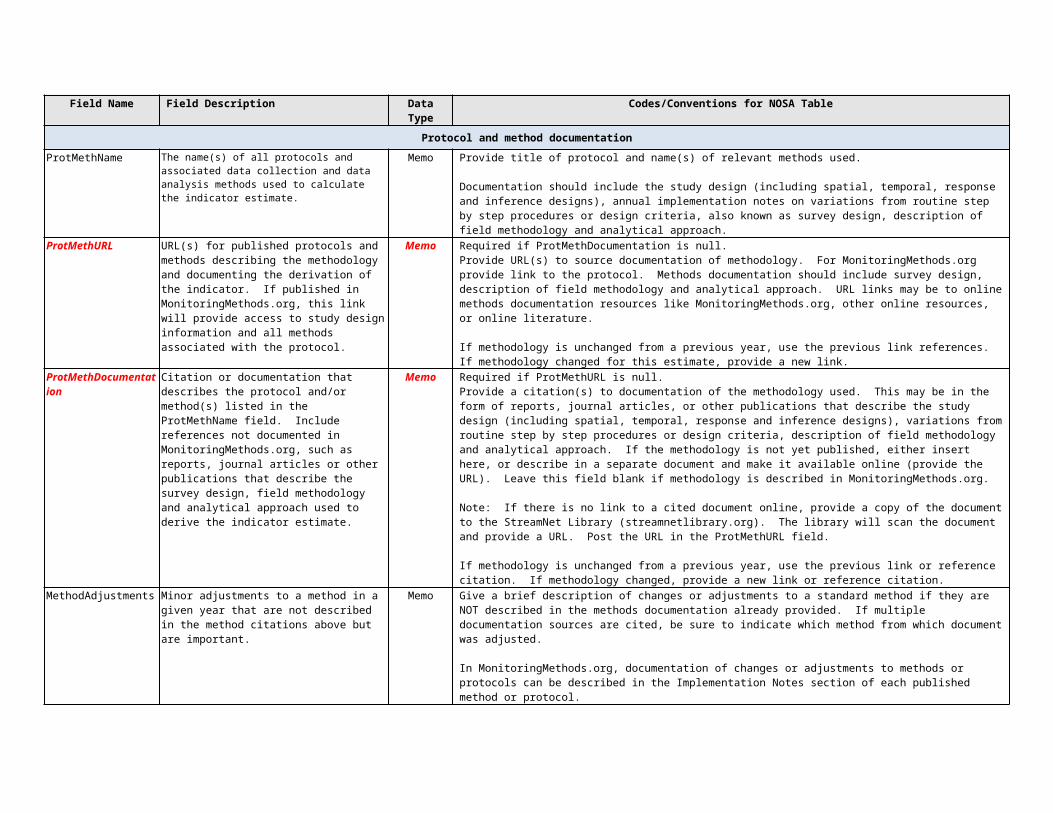
Protocol and method documentation
ProtMethName The name(s) of all protocols and associated data collection and data analysis methods used to calculate the indicator estimate.
Memo Provide title of protocol and name(s) of relevant methods used.
Documentation should include the study design (including spatial, temporal, response and inference designs), annual implementation notes on variations from routine step by step procedures or design criteria, also known as survey design, description of field methodology and analytical approach.
ProtMethURL URL(s) for published protocols and methods describing the methodology and documenting the derivation of the indicator. If published in MonitoringMethods.org, this link will provide access to study design information and all methods associated with the protocol.
Memo Required if ProtMethDocumentation is null.Provide URL(s) to source documentation of methodology. For MonitoringMethods.org provide link to the protocol. Methods documentation should include survey design, description of field methodology and analytical approach. URL links may be to online methods documentation resources like MonitoringMethods.org, other online resources, or online literature.
If methodology is unchanged from a previous year, use the previous link references. If methodology changed for this estimate, provide a new link.
ProtMethDocumentation Citation or documentation that describes the protocol and/or method(s) listed in the ProtMethName field. Include references not documented in MonitoringMethods.org, such as reports, journal articles or other publications that describe the survey design, field methodology and analytical approach used to derive the indicator estimate.
Memo Required if ProtMethURL is null.Provide a citation(s) to documentation of the methodology used. This may be in the form of reports, journal articles, or other publications that describe the study design (including spatial, temporal, response and inference designs), variations from routine step by step procedures or design criteria, description of field methodology and analytical approach. If the methodology is not yet published, either insert here, or describe in a separate document and make it available online (provide the URL). Leave this field blank if methodology is described in MonitoringMethods.org.
Note: If there is no link to a cited document online, provide a copy of the document to the StreamNet Library (streamnetlibrary.org). The library will scan the document and provide a URL. Post the URL in the ProtMethURL field.
If methodology is unchanged from a previous year, use the previous link or reference citation. If methodology changed, provide a new link or reference citation.

Field Name Field Description Data Type Codes/Conventions for NOSA TableMethodAdjustments Minor adjustments to a method in a given year that
are not described in the method citations above but are important.
Memo Give a brief description of changes or adjustments to a standard method if they are NOT described in the methods documentation already provided. If multiple documentation sources are cited, be sure to indicate which method from which document was adjusted.
In MonitoringMethods.org, documentation of changes or adjustments to methods or protocols can be described in the Implementation Notes section of each published method or protocol.
Comments about the data
Comments Any issues, problems, questions about this indicator that were not already captured in other places.
Memo Required if NullRecord = "Yes".
Supporting information
NullRecord In some years data may not be collected and so a value cannot be calculated. For example, high muddy water or wildfires can prevent redd counts. This field is used to indicate that a value does not exist because the data do not exist to calculate it.
Text 3 Normally "No".A value of "Yes" in this field is a positive statement that the data do not exist to calculate the indicator for the population and time period specified.
The value of including this field is so that missing data are explicitly accounted for rather than being a perpetually open question that is repeatedly researched. Explain in the Comments field why the data do not exist.
DataStatus Status of the data in the current record. Text 255 Acceptable values: [Do not include comments in brackets.] Draft [Values in this record are preliminary and have not been thoroughly reviewed.] Reviewed [Values in this record have been reviewed but are not yet approved as "final".] Final [Values in this record have been thoroughly reviewed and are considered "final".]
LastUpdated Date (and time if desired) the information in this record was last updated.
Date/Time If an exact date is not known, give an estimate.
IndicatorLocation Where this indicator is maintained at the source. Memo If online, provide URL(s).MetricLocation Where the supporting metrics are maintained at the
source.Memo If online, provide URL(s).
MeasureLocation Where the measurements are maintained that were used for these calculations.
Memo If online, provide URL(s).
ContactPersonFirst First name of person who is the best contact for questions that may arise about this data record.
Text 30
ContactPersonLast Last name of person who is the best contact for questions that may arise about this data record.
Text 30
ContactPhone Phone number of person who is the best contact for questions that may arise about this data record.
Text 30
ContactEmail Email address of person who is the best contact for questions that may arise about this data record.
Text 50
MetaComments Comments regarding the supporting information. MemoFields needed by people programming the Exchange Network
If you are a programmer or database manager, refer to Appendix A for additional fields that are part of this table but are not listed here.
A2. SAR TableThis table stores information concerning smolt to adult ratios (SAR). Smolt to adult ratios are specific to the smolt and adult locations described in each row of data. (Back to Table of Contents.)
Field Name Field Description Data Type Codes/Conventions for SAR TableFields for defining a unique record
ID(unique)
Value used by computer to identify a record. Text 36 This value is a globally unique identifier (GUID) exactly 36 characters long. When submitting a new record you may include this value or leave it blank. If you include this value then it will be used by
the central system. If you leave it blank then a value will be created for you, and it will be sent back to your system where it must be incorporated.
When updating or deleting records this value must be included.CommonName Common name of the taxon of fish. Text 50 Enter the name of the taxon here, even if taxon name is included in the name of the population. Select from the following:
Bull trout Chinook salmon Chum salmon Coho salmon Sockeye salmon SteelheadAdditional species may be added in the future: refer to http://old.streamnet.org/SpeciesInFW.html for common names.
Run Run of fish. Text 20 Enter the name of the run here, even if run name is included in the name of the population. Entries in this field are not recognized as taxonomic divisions. Select from the following: [Do not include comments in brackets.] Spring Summer Fall Winter Spring/summer Both summer & winter N/A [For species without recognized runs. For example, bull trout.]
ESU_DPS For populations listed under the federal ESA, this is the name of a defined Evolutionarily Significant Unit (ESU) or Distinct Population Segment (DPS) as defined by NMFS Northwest Region or by USFWS. For non-listed populations this is the DPS or other name.
Text 255 Enter the name of the ESU or DPS here. Entries in this field are taxonomic divisions defined by NMFS or USFWS, and may be at the species, subspecies, or finer scale. ESUs of salmon north of California are listed athttp://www.nwfsc.noaa.gov/trt/.
RecoveryDomain Name of the "recovery domain," as defined by the NMFS Northwest Region, in which the population falls geographically.
Text 255 Five recovery domains have been defined by NMFS in Washington, Oregon, and Idaho. Select the appropriate one from this list: Puget Sound Recovery Domain Willamette/Lower Columbia Recovery Domain Interior Columbia Recovery Domain Oregon Coast Recovery Domain Southern Oregon/Northern California Coast Recovery Domain
Further information about recovery domains can be found at http://www.nwfsc.noaa.gov/trt/.MajorPopGroup Name of "major population group" (MPG) or
“stratum” as defined by the NMFS Northwest Region, in which the population falls.
Text 255 The term "stratum" is used in the Willamette/Lower Columbia Recovery Domain, while "major population group" is used in other areas. The term "stratum" includes life history considerations as well as geographic criteria, while MPGs are defined geographically. See Appendix C for the list of MPGs / strata.
PopID Code for the population(s) of fish represented by this record.
Integer See Appendix C for the list of PopID codes for populations as defined by NMFS Northwest Region for ESA. The populations are defined by NMFS Northwest Region; the codes for these populations are created by StreamNet to reference those NMFS populations. See Appendix E if you need a PopID for a population that does not yet have one assigned.

Field Name Field Description Data Type Codes/Conventions for SAR TableCBFWApopName Population name as defined by CBFWA for
subbasin planning purposes, from subbasin plans and agencies.
Text 255 This may include non-listed populations, or cases where geographic area does not match a defined population of a listed species. See Appendix D for the list of these population names.
Fill this field even when a population's geographic extent coincides with NWR name for a listed population.CommonPopName Population name used by local biologists. Text 255 Often this is simply the name of the population(s) as written on the original time series spreadsheets.PopFit Categorization of how well the geographic extent of
the SAR estimate corresponds to the geographic definition of the population.
Text 8 This field is required if NullRecord = "No".Acceptable values: [Do not include comments in brackets.] Same [Estimate represents one entire population, the whole population, and nothing but the population.] Portion [Estimate represents a portion of one population. (Describe in PopFitNotes field.)] Multiple [Estimate is from more than one population. (Describe in PopFitNotes field.)]
PopFitNotes Text description of how well the SAR value corresponds to the defined population, and why the data are not at the scale of a single population.
Memo This field is required if the PopFit field is "Portion" or "Multiple".If the PopFit field is "Portion" or "Multiple", describe the lack of correspondence between the defined population and the fish for which the SAR estimate was made. Also state why this scale of data was used to represent the population instead of true population-scale data. (Examples: "Data not available at exact scale of this population."; "Data at this scale best represent the population.")
SmoltLocation The specific location(s) for where the smolt abundance numbers were determined.
Text 255 This may be any of the following: the name of a fluvial water body and text description of where on that stream or river (river mile preferred, but river
kilometer, lat/long, or other characterization allowable). the name of an impounded fluvial water body (reservoir) and description of where on that reservoir. the name of a lentic water body, and description of where on that lake. a description of multiple water bodies if appropriate for the time series, with descriptions of specific locations. the name of a dam.
SmoltLocPTcode PTAGIS code for the location where smolts were enumerated.
Text 255 There should be a PTAGIS code for most locations where smolts were trapped. Provide that code, or multiple codes if smolts were trapped at multiple locations for this population.
AdultLocation The specific location(s) for where the adult abundance numbers were determined.
Text 255 This may be any of the following: the name of a fluvial water body, with specific location described (river mile preferred, but river kilometer, lat/long, or
other characterization allowable). the name of an impounded fluvial water body (reservoir), with specific location described the name of a lentic water body, with specific location described a description of multiple water bodies if appropriate for the time series. the name of a dam.
SARtype Type of SAR. See Codes/Conventions column for details.
Text 255 This field is used to describe the category of SAR for the current record, in terms of where the smolt and adult numbers were determined that went into the SAR. Current list of acceptable values are shown below. [Do not include comments in brackets.] If you have a need for other types, contact the Coordinated Assessment group to define the new type. Tributary to tributary [Smolt numbers determined in tributary; adult numbers determined in tributary] Tributary to named dam [Smolt numbers determined in tributary; adult numbers determined at first mainstem dam] Named dam to named dam [Smolt numbers determined at first mainstem dam; adult numbers determined at first
mainstem dam] Named dam to tributary [Smolt numbers determined at first mainstem dam; adult numbers determined in tributary]
The values in the "SmoltLocation" and "AdultLocation" fields should match the categorization in this field.ScopeOfInference Description of what this SAR represents: the
specific population(s); specific ESU/DPS(s); specific MPG(s); etc. represented.
Text 255 Identify the specific population(s), ESU(s), etc. that apply. Don't enter "ESU" or "MPG" or "Population", but instead the specific ESU(s) or MPG(s) or population(s) represented, such as "Scappoose Creek population" or "All populations above Lower Granite Dam" or other appropriate entry.
OutmigrationYear The four-digit year for which this SAR is calculated, defined as the year the group migrated to sea.
Integer Year in which the fish migrated to the ocean. This is often not the same as brood year.

Field Name Field Description Data Type Codes/Conventions for SAR TableTRTmethod Flag indicating whether the methods used to
generate the values in this record are those currently used for Endangered Species Act status reviews..
Text 3 Acceptable values: [Do not include comments in brackets.] Yes [The record reflects the TRT method; it will be submitted to NMFS's SPS database.] No [The record does not reflect the TRT method; it will not be submitted to NMFS's SPS database.]
[Wondering why this field is named "TRTmethod"? See this note in the electronic version of this document.]ContactAgency Agency, tribe, or other entity, or person responsible
for these data that is the best contact for questions that may arise about this data record.
Text 255 Entries in this field must precisely match a name in the StreamNet agency list. Here are the ones most likely needed. If yours is not found here, contact your agency StreamNet representative, or call PSMFC's StreamNet staff at 503-595-3100. Columbia River Inter-Tribal Fish Commission Colville Confederated Tribes Confederated Tribes and Bands of the Yakama Indian Nation Confederated Tribes of the Umatilla Indian Reservation Confederated Tribes of the Warm Springs Reservation of Oregon Idaho Department of Fish and Game Nez Perce Tribe of Idaho Oregon Department of Fish and Wildlife Spokane Tribe of Indians Washington Department of Fish and Wildlife
MethodNumber This field represents the method(s) used to calculate the values in the "Indicators" and "Metrics" sections.
This field is used in conjunction with the ContactAgency field. See the Codes/Conventions column for details.
Byte This field, along with the "ContactAgency" field above, identifies which entity calculated the values in the record and which (set of) methods where used to calculate them. These fields allow for multiple entries for the same population and year. Thus, it is possible to share values that are based on different assumptions.
If only one set of methods is used to calculate the values for all years for a population, enter "1" for all records. Even if methods changed, you can enter "1" for all records if there is always only one record per year for a population.
If more than one set of methods is used to calculate final values over a range of years for a population, use this field to indicate which records are meant to go together. For example, if method 1 was used to calculate values for 1960 through 1994, and method 2 was used to calculate values for 1980 through 2013, then there will be more than one record for the years 1980 through 1994. In such cases you would enter "1" for records that result from the 1960-1994 method, and "2" for records that result from the 1980-2013 method. Similarly, if 3 different methods are proposed in an area for the same years, then use "1" and "2" and "3" to indicate which records belong together. This lets a data user know which records belong together.
When more than one record exists for a population X year combination, it is up to biologists using the data to select the value of most use when conducting their day to day business. The ContactAgency and MethodNumber fields allow for this.
Indicators
SAR The point estimate for smolt-to-adult ratio, calculated as 100 X the point estimate of the number of returning natural origin adults, divided by the point estimate of the number of smolts that produced those returning adults.
Single Required if NullRecord = "No".Express these values as percentages (numbers from zero to one hundred), with two digits to the right of the decimal point. Examples: .020 = 2.00, .0015 = 0.15.
This field holds a numeric value only -- the percent sign is implied but not included.
Do NOT include repeat spawners in the number of adult returns. (A fish only returns once from smolting; subsequent returns are not appropriate for inclusion in smolt-to-adult estimates because they head to sea as adults on subsequent trips and thus are not exposed to the same suite of mortality factors.)
SARLowerLimit The lower limit of the confidence interval for the SAR field.
Single This field holds a numeric value only -- the percent sign is implied but not included.
Minimum value = 0 and maximum = 100. If the calculated lower limit of the confidence interval is less than zero you may report 0 in this field, but we suggest you consider statistical options that prevent values outside of possible limits (these include non-normal distributions, transformations, and/or bootstrapping approaches).
Mike Banach, 09/11/15,
"TRT" in the field name refers to the "Technical Recovery Teams" that defined the methods to be used for anadromous fish status assessments when this table was first created. The Field Description for this field was later broadened and improved, but the field name was kept the same to avoid breaking programming routines that had already been developed.

Field Name Field Description Data Type Codes/Conventions for SAR TableSARUpperLimit The upper limit of the confidence interval for the
SAR field.Single This field holds a numeric value only -- the percent sign is implied but not included.
Minimum value = 0 and maximum = 100. If the calculated lower limit of the confidence interval is more than 100 you may report 100 in this field, but we suggest you consider statistical options that prevent values outside of possible limits.
SARAlpha The significance level for the SAR confidence interval, expressed as alpha.
Single Express these values as alpha values. For example, for the 95% confidence limits enter "0.05" in this field, not "95".
ReturnsMissing This field indicates whether any adult return years for this out-migration year were missing.
Text 3 Acceptable values: [Do not include comments in brackets.] Yes [Years were missing.] No [No years missing; return estimates were complete.]
If some years were missing, describe how that gap was addressed under ReturnsMissingExplanationReturnsMissingExplanation
If some return data are not accounted for in the SAR estimate, explain the gap.
Memo Describe how any gap in return years was addressed: Filled in with an interpolated estimate, ignored, etc.
RearingType The rearing type (origin; production type) of the fish represented by this record.
Text 8 Acceptable values: [Do not include comments in brackets.] Natural Mixed [Known to include both hatchery and natural origin fish] Unknown [None of the above can be confidently applied]
[Note: Disagreement exists re: is this an "indicator" (attribute along w/ SAR value), or if it should be part of the key for the table. If indicator then only one record/pop/year; if in key then >1 record/pop/yr is possible. To start we'll have it in the key to allow flexibility in the data. If that causes trouble we'll address it at that time.]
Metrics supporting the "Indicators" fields above
TSO Total smolt outmigration. Point estimate of the number of smolts for this outmigration year, or the number of marked smolts used to calculate the SAR.
Single This should be the denominator in the ratio calculation, with all previous losses (handling mortality, tag loss estimate, etc.) already taken out. The Methods citation should address how this was done.
TSOLowerLimit The lower limit of the confidence interval for the TSO field.
Single Minimum value = 0. If the calculated lower limit of the confidence interval is less than zero you may report 0 in this field, but we suggest you consider statistical options that prevent values outside of possible limits (these include non-normal distributions, transformations, and/or bootstrapping approaches).
TSOUpperLimit The upper limit of the confidence interval for the TSO field.
Single Minimum value = 0.
TSOAlpha The significance level for the TSO confidence interval, expressed as alpha.
Single Express these values as alpha values. For example, for the 95% confidence limits enter "0.05" in this field, not "95".
TAR Total adult return. Point estimate of the number of adults returning for the first time from the indicated outmigration year, or the group of marked smolts (as appropriate), to match the outmigrants in the TSO field.
Single For iteroparous species such as steelhead, include only those adults returning to spawn for the first time. (Failure to do so will result in some adults being counted twice for returns purposes.)
TARLowerLimit The lower limit of the confidence interval for the TAR field.
Single Minimum value = 0. If the calculated lower limit of the confidence interval is less than zero you may report 0 in this field, but we suggest you consider statistical options that prevent values outside of possible limits (these include non-normal distributions, transformations, and/or bootstrapping approaches).
TARUpperLimit The upper limit of the confidence interval for the TAR field.
Single Minimum value = 0.
TARAlpha The significance level for the TAR confidence interval, expressed as alpha.
Single Express these values as alpha values. For example, for the 95% confidence limits enter "0.05" in this field, not "95".
ReturnDef How "return" is defined for this SAR. Memo Examples: Adults migrating to/past a point(s). Estimated number of fish to the spawning grounds. Estimated number of fish that actually spawn. Number of marked fish captured. Etcetera.

Field Name Field Description Data Type Codes/Conventions for SAR TableHarvestAdj How was the return adjusted to account for harvest?
(Are harvested fish included in the estimate of number of adults?)
Text 35 Acceptable values: [Do not include comments in brackets.] Ocean [Value in the TAR field was adjusted for harvest in the ocean, but not in the mainstem and not in tributaries.] Ocean and mainstem [Value in the TAR field was adjusted for harvest in the ocean and mainstem, but not in tributaries.] Ocean and mainstem and tributaries [Value in the TAR field was adjusted for harvest in the ocean, mainstem, and
tributaries.] Mainstem [Value in the TAR field was adjusted for harvest in the mainstem but not in tributaries.] Mainstem and tributaries [Value in the TAR field was adjusted for harvest in both the mainstem and tributaries.] Tributaries [Value in the TAR field was adjusted for harvest in tributaries but not in the mainstem.] Not adjusted [Value in the TAR field was not adjusted for harvest.]
OceanHarvest The estimated number of adults and jacks from the smolt group indicated in the TSO field that were harvested in the ocean.
Single This field is for harvests in the ocean, which is defined as not including the estuary. Provide this estimate ONLY if it was used to adjust the return/recruit estimate to add back harvested fish.
This may or may not include indirect fishery impacts, and these details should be explained in the Methods citation. This harvest value reflects fish harvested from the indicated natural origin group. Leave blank for juvenile recruits.
MainstemHarvest The estimated number of adults and jacks from the smolt group indicated in the TSO field that were harvested in the mainstem.
Single This field is only for harvests in the mainstem, which is defined as all rivers below the tributary(ies). Provide this estimate ONLY if it was used to adjust the return/recruit estimate to add back harvested fish.
This harvest value reflects fish harvested from the indicated smolt group -- they may be all natural origin, all hatchery origin, or mixed origin, as indicated by the RearingType field. This may or may not include indirect fishery impacts, and these details should be explained in the Methods citation.
TribHarvest The estimated number of adults and jacks from the smolt group indicated in the TSO field that were harvested in tributaries.
Single "Tributaries" is defined as the tributary(ies) the population resides in. Provide this estimate ONLY if it was used to adjust the return/recruit estimate to add back harvested fish.
This harvest value reflects fish harvested from the indicated smolt group -- they may be all natural origin, all hatchery origin, or mixed origin, as indicated by the RearingType field. This may or may not include indirect fishery impacts, and these details should be explained in the Methods citation.
BroodStockRemoved The number of additional adults that would have returned from the smolt group indicated in the TSO field, had there not been removal of fish for use as broodstock in a hatchery.
Single This value reflects fish taken for hatchery use from the indicated smolt group -- they may be all natural origin, all hatchery origin, or mixed origin, as indicated by the RearingType field. Details should be explained in the Methods citation.
Protocol and method documentation
ProtMethName The name(s) of all protocols and associated data collection and data analysis methods used to calculate the indicator estimate.
Memo Provide title of protocol and name(s) of relevant methods used.
Documentation should include the study design (including spatial, temporal, response and inference designs), annual implementation notes on variations from routine step by step procedures or design criteria, also known as survey design, description of field methodology and analytical approach.
ProtMethURL URL(s) for published protocols and methods describing the methodology and documenting the derivation of the indicator. If published in MonitoringMethods.org, this link will provide access to study design information and all methods associated with the protocol.
Memo Required if ProtMethDocumentation is null.Provide URL(s) to source documentation of methodology. For MonitoringMethods.org provide link to the protocol. Methods documentation should include survey design, description of field methodology and analytical approach. URL links may be to online methods documentation resources like MonitoringMethods.org, other online resources, or online literature.
If methodology is unchanged from a previous year, use the previous link references. If methodology changed for this estimate, provide a new link.
Field Name Field Description Data Type Codes/Conventions for SAR TableProtMethDocumentation Citation or documentation that describes the
protocol and/or method(s) listed in the ProtMethName field. Include references not documented in MonitoringMethods.org, such as reports, journal articles or other publications that describe the survey design, field methodology and analytical approach used to derive the indicator estimate.
Memo Required if ProtMethURL is null.Provide a citation(s) to documentation of the methodology used. This may be in the form of reports, journal articles, or other publications that describe the study design (including spatial, temporal, response and inference designs), variations from routine step by step procedures or design criteria, description of field methodology and analytical approach. If the methodology is not yet published, either insert here, or describe in a separate document and make it available online (provide the URL). Leave this field blank if methodology is described in MonitoringMethods.org.
Note: If there is no link to a cited document online, provide a copy of the document to the StreamNet Library (streamnetlibrary.org). The library will scan the document and provide a URL. Post the URL in the ProtMethURL field.
If methodology is unchanged from a previous year, use the previous link or reference citation. If methodology changed, provide a new link or reference citation.
MethodAdjustments Minor adjustments to a method in a given year that are not described in the method citations above but are important.
Memo Give a brief description of changes or adjustments to a standard method if they are NOT described in the methods documentation already provided. If multiple documentation sources are cited, be sure to indicate which method from which document was adjusted.
In MonitoringMethods.org, documentation of changes or adjustments to methods or protocols can be described in the Implementation Notes section of each published method or protocol.
Comments about the data
Comments Any issues, problems, questions about this indicator that were not already captured in other places.
Memo Required if NullRecord = "Yes".
Supporting information
NullRecord In some years data may not be collected and so a value cannot be calculated. For example, high muddy water or wildfires can prevent redd counts. This field is used to indicate that a value does not exist because the data do not exist to calculate it.
Text 3 Normally "No".A value of "Yes" in this field is a positive statement that the data do not exist to calculate the indicator for the population and time period specified.
The value of including this field is so that missing data are explicitly accounted for rather than being a perpetually open question that is repeatedly researched. Explain in the Comments field why the data do not exist.
DataStatus Status of the data in the current record. Text 255 Acceptable values: [Do not include comments in brackets.] Draft [Values in this record are preliminary and have not been thoroughly reviewed.] Reviewed [Values in this record have been reviewed but are not yet approved as "final".] Final [Values in this record have been thoroughly reviewed and are considered "final".]
LastUpdated Date (and time if desired) the information in this record was last updated.
Date/Time If an exact date is not known, give an estimate.
IndicatorLocation Where this indicator is maintained at the source. Memo If online, provide URL(s).MetricLocation Where the supporting metrics are maintained at the
source.Memo If online, provide URL(s).
MeasureLocation Where the measurements are maintained that were used for these calculations.
Memo If online, provide URL(s).
ContactPersonFirst First name of person who is the best contact for questions that may arise about this data record.
Text 30
ContactPersonLast Last name of person who is the best contact for questions that may arise about this data record.
Text 30
ContactPhone Phone number of person who is the best contact for questions that may arise about this data record.
Text 30

Field Name Field Description Data Type Codes/Conventions for SAR TableContactEmail Email address of person who is the best contact for
questions that may arise about this data record.Text 50
MetaComments Comments regarding the supporting information. MemoFields needed by people programming the Exchange Network
If you are a programmer or database manager, refer to Appendix A for additional fields that are part of this table but are not listed here.
A3. RperS TableThis table stores information concerning recruits per spawner (R/S). Recruit per spawner ratios are specific to the locations described in each record of data. This table can include the number of juvenile or adult recruits as measures, or full life cycle productivity. That is, "recruit" can be defined at any life stage. (Back to Table of Contents.)
Field Name Field Description Data Type Codes/Conventions for RperS TableFields for defining a unique record
ID(unique)
Value used by computer to identify a record. Text 36 This value is a globally unique identifier (GUID) exactly 36 characters long. When submitting a new record you may include this value or leave it blank. If you include this value then it will be used by
the central system. If you leave it blank then a value will be created for you, and it will be sent back to your system where it must be incorporated.
When updating or deleting records this value must be included.CommonName Common name of the taxon of fish. Text 50 Enter the name of the taxon here, even if taxon name is included in the name of the population. Select from the following:
Bull trout Chinook salmon Chum salmon Coho salmon Sockeye salmon SteelheadAdditional species may be added in the future: refer to http://old.streamnet.org/SpeciesInFW.html for common names.
Run Run of fish. Text 20 Enter the name of the run here, even if run name is included in the name of the population. Entries in this field are not recognized as taxonomic divisions. Select from the following: [Do not include comments in brackets.] Spring Summer Fall Winter Spring/summer Both summer & winter N/A [For species without recognized runs. For example, bull trout.]
ESU_DPS For populations listed under the federal ESA, this is the name of a defined Evolutionarily Significant Unit (ESU) or Distinct Population Segment (DPS) as defined by NMFS Northwest Region or by USFWS. For non-listed populations this is the DPS or other name.
Text 255 Enter the name of the ESU or DPS here. Entries in this field are taxonomic divisions defined by NMFS or USFWS, and may be at the species, subspecies, or finer scale. ESUs of salmon north of California are listed athttp://www.nwfsc.noaa.gov/trt/.

Field Name Field Description Data Type Codes/Conventions for RperS TableRecoveryDomain Name of the "recovery domain," as defined by the
NMFS Northwest Region, in which the population falls geographically.
Text 255 Five recovery domains have been defined by NMFS in Washington, Oregon, and Idaho. Select the appropriate one from this list: Puget Sound Recovery Domain Willamette/Lower Columbia Recovery Domain Interior Columbia Recovery Domain Oregon Coast Recovery Domain Southern Oregon/Northern California Coast Recovery Domain
Further information about recovery domains can be found at http://www.nwfsc.noaa.gov/trt/.MajorPopGroup Name of "major population group" (MPG) or
“stratum” as defined by the NMFS Northwest Region, in which the population falls.
Text 255 The term "stratum" is used in the Willamette/Lower Columbia Recovery Domain, while "major population group" is used in other areas. The term "stratum" includes life history considerations as well as geographic criteria, while MPGs are defined geographically. See Appendix C for the list of MPGs / strata.
PopID Code for the population(s) of fish represented by this record.
Integer See Appendix C for the list of PopID codes for populations as defined by NMFS Northwest Region for ESA. The populations are defined by NMFS Northwest Region; the codes for these populations are created by StreamNet to reference those NMFS populations. See Appendix E if you need a PopID for a population that does not yet have one assigned.
CBFWApopName Population name as defined by CBFWA for subbasin planning purposes, from subbasin plans and agencies.
Text 255 This may include non-listed populations, or cases where geographic area does not match a defined population of a listed species. See Appendix D for the list of these population names.
Fill this field even when a population's geographic extent coincides with NWR name for a listed population.CommonPopName Population name used by local biologists. Text 255 Often this is simply the name of the population(s) as written on the original time series spreadsheets.PopFit Categorization of how well the geographic extent of
the recruits per spawner estimate corresponds to the geographic definition of the population.
Text 8 This field is required if NullRecord = "No".Acceptable values: [Do not include comments in brackets.] Same [Estimate represents one entire population, the whole population, and nothing but the population.] Portion [Estimate represents a portion of one population. (Describe in PopFitNotes field.)] Multiple [Estimate is from more than one population. (Describe in PopFitNotes field.)]
PopFitNotes Text description of how well the recruits per spawner value corresponds to the defined population, and why the data are not at the scale of a single population.
Memo This field is required if the PopFit field is "Portion" or "Multiple".If the PopFit field is "Portion" or "Multiple", describe the lack of correspondence between the defined population and the fish for which the recruits per spawner estimate was made. Also state why this scale of data was used to represent the population instead of true population-scale data. (Examples: "Data not available at exact scale of this population."; "Data at this scale best represent the population.")
SpawnerLocation The specific location(s) for where the spawner abundance numbers were determined.
Text 255 This may be any of the following: the name of a fluvial water body. the name of a lentic water body. a description of multiple water bodies if appropriate for the time series.
RecruitLocation The specific location(s) for where the recruit abundance numbers were determined.
Text 255 This field describes the location where the abundance of recruits is determined, and may be any of the following: the name of a fluvial water body. the name of a lentic water body. a dam or other location where fish numbers can be estimated. a description of multiple water bodies if appropriate for the time series. other, as appropriate.
BroodYear The four-digit brood year for which the recruit per spawner ratio is calculated. Same as "spawning year" for the parent generation.
Integer This field is used to tie juvenile ‘recruits’ or adult returns (over multiple return years) to a specific spawning year. This is the year in which spawning of this species (and run where appropriate) began.
In cases where an unusual population begins spawning uncharacteristically early (before January 1 for spring spawners) or late (after December 31 for fall spawners) for the species (and perhaps run), assign the year based on the majority of populations of this species/run in order to be consistent for all members of the spawning cohort. For example, most coho spawn in fall but a few populations do not begin spawning until after Jan. 1. The brood year assigned for these unusual populations would match the other populations that spawned in the fall, even though these particular populations did not begin spawning until after December 31.

Field Name Field Description Data Type Codes/Conventions for RperS TableRperStype The type of recruit per spawner estimate, in terms of
what fish are included in the estimates of number of spawners and number of recruits.
Text 255 Acceptable values: [Do not include comments in brackets.]For adult to adult R/S estimates: Total recruits per total spawners [Includes males and jacks] Adult recruits per adult spawners [Includes adult males, but not jacks] Female recruits per female spawners [All males excluded]For R/S estimates for juvenile ‘recruits’: Parr per total spawners [Includes males and jacks] Smolts per total spawners [Includes males and jacks] Parr per adult spawners [Includes adult males, but not jacks] Smolts per adult spawners [Includes adult males, but not jacks] Parr per female spawners [Includes female parents only] Smolts per female spawners [Includes female parents only]
If more than one type of estimate is done for one brood year for a population, the estimates go in separate data records.TRTmethod Flag indicating whether the methods used to
generate the values in this record are those currently used for Endangered Species Act status reviews..
Text 3 Acceptable values: [Do not include comments in brackets.] Yes [The record reflects the TRT method; it will be submitted to NMFS's SPS database.] No [The record does not reflect the TRT method; it will not be submitted to NMFS's SPS database.]
[Wondering why this field is named "TRTmethod"? See this note in the electronic version of this document.]ContactAgency Agency, tribe, or other entity, or person responsible
for these data that is the best contact for questions that may arise about this data record.
Text 255 Entries in this field must precisely match a name in the StreamNet agency list. Here are the ones most likely needed. If yours is not found here, contact your agency StreamNet representative, or call PSMFC's StreamNet staff at 503-595-3100. Columbia River Inter-Tribal Fish Commission Colville Confederated Tribes Confederated Tribes and Bands of the Yakama Indian Nation Confederated Tribes of the Umatilla Indian Reservation Confederated Tribes of the Warm Springs Reservation of Oregon Idaho Department of Fish and Game Nez Perce Tribe of Idaho Oregon Department of Fish and Wildlife Spokane Tribe of Indians Washington Department of Fish and Wildlife
MethodNumber This field represents the method(s) used to calculate the values in the "Indicators" and "Metrics" sections.
This field is used in conjunction with the ContactAgency field. See the Codes/Conventions column for details.
Byte This field, along with the "ContactAgency" field above, identifies which entity calculated the values in the record and which (set of) methods where used to calculate them. These fields allow for multiple entries for the same population and year. Thus, it is possible to share values that are based on different assumptions.
If only one set of methods is used to calculate the values for all years for a population, enter "1" for all records. Even if methods changed, you can enter "1" for all records if there is always only one record per year for a population.
If more than one set of methods is used to calculate final values over a range of years for a population, use this field to indicate which records are meant to go together. For example, if method 1 was used to calculate values for 1960 through 1994, and method 2 was used to calculate values for 1980 through 2013, then there will be more than one record for the years 1980 through 1994. In such cases you would enter "1" for records that result from the 1960-1994 method, and "2" for records that result from the 1980-2013 method. Similarly, if 3 different methods are proposed in an area for the same years, then use "1" and "2" and "3" to indicate which records belong together. This lets a data user know which records belong together.
When more than one record exists for a population X year combination, it is up to biologists using the data to select the value of most use when conducting their day to day business. The ContactAgency and MethodNumber fields allow for this.
Mike Banach, 09/11/15,
"TRT" in the field name refers to the "Technical Recovery Teams" that defined the methods to be used for anadromous fish status assessments when this table was first created. The Field Description for this field was later broadened and improved, but the field name was kept the same to avoid breaking programming routines that had already been developed.

Field Name Field Description Data Type Codes/Conventions for RperS Table
Indicators
RperS The point estimate for the ratio of recruits from the designated brood year and RperStype, divided by the number of parent spawners responsible for that brood year. Straight ratio calculation, not a log/natural log transformation.
Single Required if NullRecord = "No".For iteroparous species such as steelhead, adult recruits should include all fish from the brood year that return to spawn, including repeat spawners, since repeat spawners add to the productivity of the population.For juvenile recruits, the total of all of the target life stage from the brood year. For some species and life stages, these may recruit in multiple years.
RperSLowerLimit The lower limit of the confidence interval for the RperS field.
Single Minimum value = 0. If the calculated lower limit of the confidence interval is less than zero you may report 0 in this field, but we suggest you consider statistical options that prevent values outside of possible limits (these include non-normal distributions, transformations, and/or bootstrapping approaches).
RperSUpperLimit The upper limit of the confidence interval for the RperS field.
Single Minimum value = 0.
RperSAlpha The significance level for the RperS confidence interval, expressed as alpha.
Single Express these values as alpha values. For example, for the 95% confidence limits enter "0.05" in this field, not "95".
Metrics supporting the "Indicators" fields above
TotalSpawners Point estimate for the total number of parent spawners, both natural and hatchery origin, that produced the brood year this record reflects.
The number in this field reflects the RperStype field above. That is, if this record is for total spawners then this number will be the total number of spawners; if this record is for females to females, then this number will be only the female spawners.
Single
TotalSpawnersLowerLimit
The lower limit of the confidence interval for the TotalSpawners field.
Single Minimum value = 0. If the calculated lower limit of the confidence interval is less than zero you may report 0 in this field, but we suggest you consider statistical options that prevent values outside of possible limits (these include non-normal distributions, transformations, and/or bootstrapping approaches).
TotalSpawnersUpperLimit
The upper limit of the confidence interval for the TotalSpawners field.
Single Minimum value = 0.
TotalSpawnersAlpha The significance level for the TotalSpawners confidence interval, expressed as alpha.
Single Express these values as alpha values. For example, for the 95% confidence limits enter "0.05" in this field, not "95".
HatcherySpawners Point estimate for the number of parent spawners of hatchery origin that contributed to the brood year this record reflects.
This number is the hatchery portion of the TotalSpawners field.
Single
HatcherySpawnersLowerLimit
The lower limit of the confidence interval for the HatcherySpawners field.
Single Minimum value = 0. If the calculated lower limit of the confidence interval is less than zero you may report 0 in this field, but we suggest you consider statistical options that prevent values outside of possible limits (these include non-normal distributions, transformations, and/or bootstrapping approaches).
HatcherySpawnersUpperLimit
The upper limit of the confidence interval for the HatcherySpawners field.
Single Minimum value = 0.
HatcherySpawnersAlpha The significance level for the HatcherySpawners confidence interval, expressed as alpha.
Single Express these values as alpha values. For example, for the 95% confidence limits enter "0.05" in this field, not "95".

Field Name Field Description Data Type Codes/Conventions for RperS TableRecruits Point estimate for the total number of natural origin
recruits from the indicated combination of species, run, population, spawner location, recruit location, brood year, and RperStype.
Single This is the sum of returns by juvenile life stage or age group as specified in the RperStype field. This is the number of fish recruited to the location indicated in the RecruitLocation field. Adult recruits should include all fish from the brood year that return to spawn, including repeat spawners, since repeat spawners add to the productivity of the population.
RecruitsLowerLimit The lower limit of the confidence interval for the Recruits field.
Single Minimum value = 0. If the calculated lower limit of the confidence interval is less than zero you may report 0 in this field, but we suggest you consider statistical options that prevent values outside of possible limits (these include non-normal distributions, transformations, and/or bootstrapping approaches).
RecruitsUpperLimit The upper limit of the confidence interval for the Recruits field.
Single Minimum value = 0.
RecruitsAlpha The significance level for the Recruits confidence interval, expressed as alpha.
Single Express these values as alpha values. For example, for the 95% confidence limits enter "0.05" in this field, not "95".
RecruitsMissing This field indicates whether any recruits for this brood year were missing.
This field and the next are intended mainly for adult recruits data. An example where this field may be useful for juvenile fish is if an outmigration estimate is done only for spring-migrating fish, but it's known that some fish out-migrate during fall or winter. If such R/S estimates are done, then these fields would be helpful for juveniles also.
Text 3 Indicate if recruit estimates for any year were missing. If so, indicate in this field, and explain how the gap was addressed in the RecruitsMissingExplanation field and in the Methods citation.
Acceptable values: [Do not include comments in brackets.] Yes [Years were missing.] No [No years missing; recruit estimates were complete.]
If some years were missing, describe how that gap was addressed under RecruitsMissingExplanation.
RecruitsMissingExplanation
If some recruits data are not accounted for in the RperS estimate, explain the gap.
Memo Explain how any gaps in returns from this year class were addressed (estimated to fill in, ignored, etc.).Required if RecruitsMissing = "Yes". Must be null if RecruitsMissing = "No".
HarvestAdj For adult returns, how was the return adjusted to account for harvest?
Text 35 Acceptable values: [Do not include comments in brackets.] Ocean [Value in the Recruits field was adjusted for harvest in the ocean, but not in the mainstem and not in tributaries.] Ocean and mainstem [Value in the Recruits field was adjusted for harvest in the ocean and mainstem, but not in
tributaries.] Ocean and mainstem and tributaries [Value in the Recruits field was adjusted for harvest in the ocean, mainstem, and
tributaries.] Mainstem [Value in the Recruits field was adjusted for harvest in the mainstem but not in tributaries.] Mainstem and tributaries [Value in the Recruits field was adjusted for harvest in both the mainstem and tributaries.] Tributaries [Value in the Recruits field was adjusted for harvest in tributaries but not in the mainstem.] Not adjusted [Value in the Recruits field was not adjusted for harvest.]
OceanHarvest The estimated number of adults and jacks from the spawner group indicated in the TotalSpawners field that were harvested in the ocean.
Single This field is for harvests in the ocean, which is defined as not including the estuary. Provide this estimate ONLY if it was used to adjust the return/recruit estimate to add back harvested fish.
This may or may not include indirect fishery impacts, and these details should be explained in the Methods citation. This harvest value reflects fish harvested from the indicated natural origin group. Leave blank for juvenile recruits.
MainstemHarvest The estimated number of adults and jacks from the spawner group indicated in the TotalSpawners field that were harvested in the mainstem.
Single This field is only for harvests in the mainstem, which is defined as all rivers below the tributary(ies) defining the population, and including the estuary. Provide this estimate ONLY if it was used to adjust the return/recruit estimate to add back harvested fish.
This may or may not include indirect fishery impacts, and these details should be explained in the Methods citation. This harvest value reflects fish harvested from the indicated natural origin group. Leave blank for juvenile recruits.
TribHarvest The estimated number of adults and jacks from the spawner group indicated in the TotalSpawners field that were harvested in tributaries.
Single "Tributaries" is defined as the tributary(ies) the population resides in. Provide this estimate ONLY if it was used to adjust the return/recruit estimate to add back harvested fish.This may or may not include indirect fishery impacts, and these details should be explained in the Methods citation. This harvest value reflects fish harvested from the indicated natural origin group. Leave blank for juvenile recruits.

Field Name Field Description Data Type Codes/Conventions for RperS TableNOBroodStockRemoved The number of additional recruits that would have
returned from the group indicated in the TotalSpawners field, had there not been removal of fish from this brood year for use as broodstock in a hatchery.
Single Details should be explained in the Methods citation.
Age determination
Juvenile Recruits:YOY Total number of juvenile recruits (parr or smolts)
that were enumerated prior to forming the first annulus.
Single Number of juvenile recruits (parr or smolts as listed in Type field) prior to forming the first annulus (e.g. ocean type Chinook).
Age1Juvs Total number of recruits at age 1. Single Number of juvenile recruits of Age 1.Age2Juvs Total number of recruits at age 2. Single Number of juvenile recruits of Age 2.Age3Juvs Total number of recruits at age 3. Single Number of juvenile recruits of Age 3.Age4PlusJuvs Total number of recruits at age 4 or more. Single Number of juvenile recruits of age 4 or more (e.g. older steelhead smolts).Adult Recruits:Age2Adults Total number of recruits that recruited at age 2
(brood year +2).Single Ages in this table are based on the year spawning occurred, not necessarily the year they hatched, so care must be taken in
assigning returning fish to a brood year.Assigning returning fish to a brood year can be complicated based on the life history (generally, salmon return and spawn in one year but hatch in the next, steelhead spawn and hatch in the same year). Make sure these details are accounted for in assigning returns to a year class.Adult recruits should include all fish from the brood year that return to spawn, including repeat spawners, since repeat spawners add to the productivity of the population.
Age3Adults Total number of recruits that recruited at age 3 (brood year +3).
Single See the Codes/Conventions column for the Age2Adults field.
Age4Adults Total number of recruits that recruited at age 4 (brood year +4).
Single See the Codes/Conventions column for the Age2Adults field.
Age5Adults Total number of recruits that recruited at age 5 (brood year +5).
Single See the Codes/Conventions column for the Age2Adults field.
Age6Adults Total number of recruits that recruited at age 6 (brood year +6).
Single See the Codes/Conventions column for the Age2Adults field.
Age7Adults Total number of recruits that recruited at age 7 (brood year +7).
Single See the Codes/Conventions column for the Age2Adults field.
Age8Adults Total number of recruits that recruited at age 8 (brood year +8).
Single See the Codes/Conventions column for the Age2Adults field.
Age9Adults Total number of recruits that recruited at age 9 (brood year +9).
Single See the Codes/Conventions column for the Age2Adults field.
Age10Adults Total number of recruits that recruited at age 10 (brood year +10).
Single See the Codes/Conventions column for the Age2Adults field.
Age11PlusAdults Total number of recruits that recruited at age 11 (brood year +11 or more).
Single See the Codes/Conventions column for the Age2Adults field.
Protocol and method documentation
ProtMethName The name(s) of all protocols and associated data collection and data analysis methods used to calculate the indicator estimate.
Memo Provide title(s) of protocol and name(s) of relevant methods used.
Documentation should include the study design (including spatial, temporal, response and inference designs), annual implementation notes on variations from routine step by step procedures or design criteria, also known as survey design, description of field methodology and analytical approach.
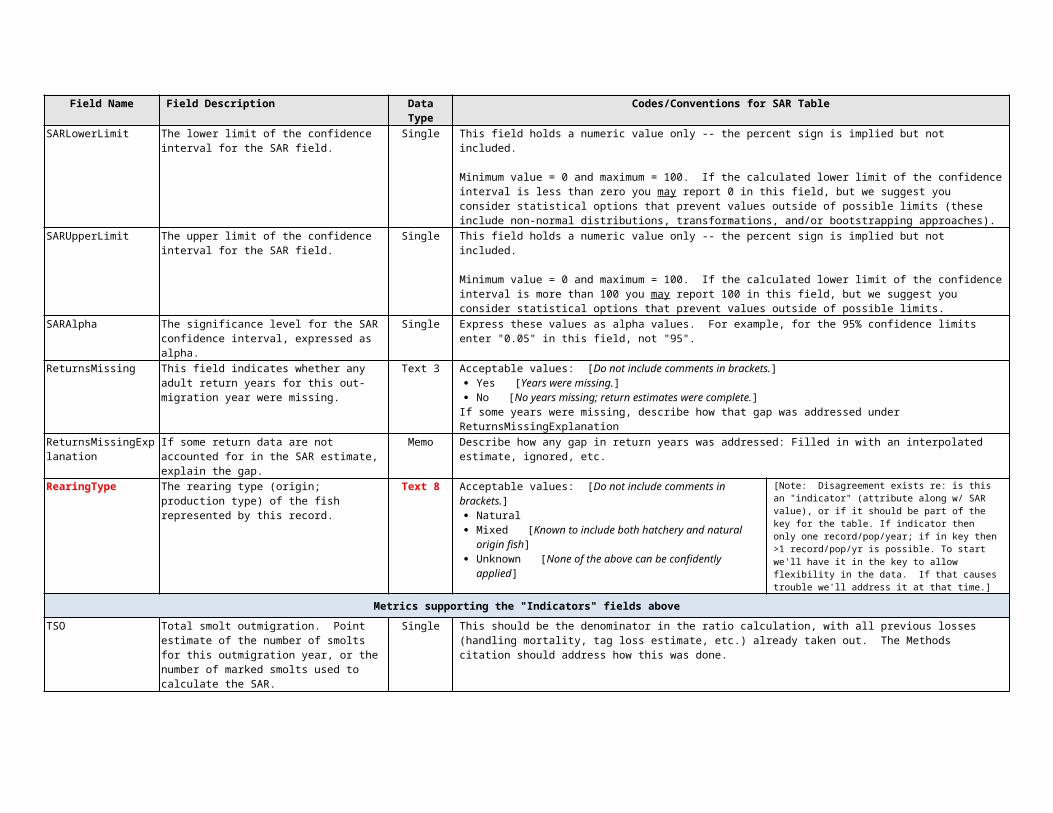
Field Name Field Description Data Type Codes/Conventions for RperS TableProtMethURL URL(s) for published protocols and methods
describing the methodology and documenting the derivation of the indicator. If published in MonitoringMethods.org, this link will provide access to study design information and all methods associated with the protocol
Memo Required if ProtMethDocumentation is null.Provide URL(s) to source documentation of methodology. For MonitoringMethods.org provide link to the protocol. Methods documentation should include survey design, description of field methodology and analytical approach. URL links may be to online methods documentation resources like MonitoringMethods.org, other online resources, or online literature.
If methodology is unchanged from a previous year, use the previous link references. If methodology changed for this estimate, provide a new link.
ProtMethDocumentation Citation or documentation that describes the protocol and/or method(s) listed in the ProtMethName field. Include references not documented in MonitoringMethods.org, such as reports, journal articles or other publications that describe the survey design, field methodology and analytical approach used to derive the indicator estimate.
Memo Required if ProtMethURL is null.Provide a citation(s) to documentation of the methodology used. This may be in the form of reports, journal articles, or other publications that describe the study design (including spatial, temporal, response and inference designs), variations from routine step by step procedures or design criteria, description of field methodology and analytical approach. If the methodology is not yet published, either insert here, or describe in a separate document and make it available online (provide the URL). Leave this field blank if methodology is described in MonitoringMethods.org.
Note: If there is no link to a cited document online, provide a copy of the document to the StreamNet Library (streamnetlibrary.org). The library will scan the document and provide a URL. Post the URL in the ProtMethURL field.
If methodology is unchanged from a previous year, use the previous link or reference citation. If methodology changed, provide a new link or reference citation.
MethodAdjustments Minor adjustments to a method in a given year that are not described in the method citations above but are important.
Memo Give a brief description of changes or adjustments to a standard method if they are NOT described in the methods documentation already provided. If multiple documentation sources are cited, be sure to indicate which method from which document was adjusted.
In MonitoringMethods.org, documentation of changes or adjustments to methods or protocols can be described in the Implementation Notes section of each published method or protocol.
Comments about the data
Comments Any issues, problems, questions about this indicator that were not already captured in other places.
Memo Required if NullRecord = "Yes".
Supporting information
NullRecord In some years data may not be collected and so a value cannot be calculated. For example, high muddy water or wildfires can prevent redd counts. This field is used to indicate that a value does not exist because the data do not exist to calculate it.
Text 3 Normally "No".A value of "Yes" in this field is a positive statement that the data do not exist to calculate the indicator for the population and time period specified.
The value of including this field is so that missing data are explicitly accounted for rather than being a perpetually open question that is repeatedly researched. Explain in the Comments field why the data do not exist.
DataStatus Status of the data in the current record. Text 255 Acceptable values: [Do not include comments in brackets.] Draft [Values in this record are preliminary and have not been thoroughly reviewed.] Reviewed [Values in this record have been reviewed but are not yet approved as "final".] Final [Values in this record have been thoroughly reviewed and are considered "final".]
LastUpdated Date (and time if desired) the information in this record was last updated.
Date/Time If an exact date is not known, give an estimate.
IndicatorLocation Where this indicator is maintained at the source. Memo If online, provide URL(s).MetricLocation Where the supporting metrics are maintained at the
source.Memo If online, provide URL(s).
MeasureLocation Where the measurements are maintained that were used for these calculations.
Memo If online, provide URL(s).

Field Name Field Description Data Type Codes/Conventions for RperS TableContactPersonFirst First name of person who is the best contact for
questions that may arise about this data record.Text 30
ContactPersonLast Last name of person who is the best contact for questions that may arise about this data record.
Text 30
ContactPhone Phone number of person who is the best contact for questions that may arise about this data record.
Text 30
ContactEmail Email address of person who is the best contact for questions that may arise about this data record.
Text 50
MetaComments Comments regarding the supporting information. MemoFields needed by people programming the Exchange Network
If you are a programmer or database manager, refer to Appendix A for additional fields that are part of this table but are not listed here.
A4. JuvenileOutmigrants TableThis table stores information concerning the number of natural origin juvenile outmigrants to the location defined in each data record. The definition of "juvenile outmigrant" varies by species, run, and geographic area. (Back to Table of Contents.)
Field Name Field Description Data Type Codes/Conventions for JuvenileOutmigrants TableFields for defining a unique record
ID Value used by computer to identify a record. Text 36 This value is a globally unique identifier (GUID) exactly 36 characters long. When submitting a new record you may include this value or leave it blank. If you include this value then it will be used by
the central system. If you leave it blank then a value will be created for you, and it will be sent back to your system where it must be incorporated.
When updating or deleting records this value must be included.CommonName Common name of the taxon of fish. Text 50 Enter the name of the taxon here, even if taxon name is included in the name of the population. Select from the following:
Bull trout Chinook salmon Chum salmon Coho salmon Sockeye salmon SteelheadAdditional species may be added in the future: refer to http://old.streamnet.org/SpeciesInFW.html for common names.
Run Run of fish. Text 20 Enter the name of the run here, even if run name is included in the name of the population. Entries in this field are not recognized as taxonomic divisions. Select from the following: [Do not include comments in brackets.] Spring Summer Fall Winter Spring/summer Both summer & winter N/A [For species without recognized runs. For example, bull trout.]

Field Name Field Description Data Type Codes/Conventions for JuvenileOutmigrants TableESU-DPS For populations listed under the federal ESA, this is
the name of a defined Evolutionarily Significant Unit (ESU) or Distinct Population Segment (DPS) as defined by NMFS Northwest Region or by USFWS. For non-listed populations this is the DPS or other name.
Text 255 Enter the name of the ESU or DPS here. Entries in this field are taxonomic divisions defined by NMFS or USFWS, and may be at the species, subspecies, or finer scale. ESUs of salmon north of California are listed athttp://www.nwr.noaa.gov/ESA-Salmon-Listings/Salmon-Populations/Maps/Index.cfm.
RecoveryDomain Name of the "recovery domain," as defined by the NMFS Northwest Region, in which the population falls geographically.
Text 255 Five recovery domains have been defined by NMFS in Washington, Oregon, and Idaho. Select the appropriate one from this list: Puget Sound Recovery Domain Willamette/Lower Columbia Recovery Domain Interior Columbia Recovery Domain Oregon Coast Recovery Domain Southern Oregon/Northern California Coast Recovery Domain
Further information about recovery domains can be found at http://www.nwfsc.noaa.gov/trt/.MajorPopGroup Name of "major population group" (MPG) or
“stratum” as defined by the NMFS Northwest Region, in which the population falls. Enter “N/A” if not applicable.
Text 255 The term "stratum" is used in the Willamette/Lower Columbia Recovery Domain, while "major population group" is used in other areas. The term "stratum" includes life history considerations as well as geographic criteria, while MPGs are defined geographically. See Appendix B for the list of MPGs / strata.
PopID Code for the population(s) of fish represented by this record.
Integer See Appendix B for the list of PopID codes for populations as defined by NMFS Northwest Region for ESA. The populations are defined by NMFS Northwest Region; the codes for these populations are created by StreamNet to reference those NMFS populations. See Appendix E if you need a PopID for a population that does not yet have one assigned.
CBFWApopName Population name as defined by CBFWA for subbasin planning purposes, from subbasin plans and agencies.
Text 255 This may include non-listed populations, or cases where geographic area does not match a defined population of a listed species. See Appendix C for the list of these population names.
Fill this field even when a population's geographic extent coincides with NWR name for a listed population.CommonPopName Population name used by local biologists. Text 255 Often this is simply the name of the population(s) as written on the original time series spreadsheets.PopFit Categorization of how well the geographic extent of
the juvenile outmigrants estimate corresponds to the geographic definition of the population.
Text 8 This field is required if NullRecord = "No".Acceptable values: [Do not include comments in brackets.] Same [Estimate represents one entire population, the whole population, and nothing but the population.] Portion [Estimate represents a portion of one population. (Describe in PopFitNotes field.)] Multiple [Estimate is from more than one population. (Describe in PopFitNotes field.)]
PopFitNotes Text description of how well the juvenile outmigrants value corresponds to the defined population, and why the data are not at the scale of a single population.
Memo This field is required if the PopFit field is "Portion" or "Multiple".If the PopFit field is "Portion" or "Multiple", describe the lack of correspondence between the defined population and the fish for which the juvenile outmigrants estimate was made. Also state why this scale of data was used to represent the population instead of true population-scale data. (Examples: "Data not available at exact scale of this population."; "Data at this scale best represent the population.")
SmoltEqLocation The specific location(s) for where the smolt equivalent abundance numbers were determined.
Text 255 This may be any of the following: the name of a fluvial water body and text description of where on that stream or river (river mile preferred, but river
kilometer, lat/long, or other characterization allowable). the name of an impounded fluvial water body (reservoir) and description of where on that reservoir. the name of a lentic water body, and description of where on that lake. a description of multiple water bodies if appropriate for the time series, with descriptions of specific locations. the name of a dam.
SmoltEqLocPTcode PTAGIS code for the SmoltEqLocation field. Text 255 There should be a PTAGIS code for most locations where smolts were trapped. Provide that code if available, or multiple codes if smolts were trapped at multiple locations for this population.
OutmigrationYear The four-digit year of the spring/summer in which outmigration of this species occurred.
Integer Juvenile anadromous fishes generally migrate to the ocean in the spring. However, a significant portion of the migration may occur in the fall or winter before, or continue into summer. Enter here the year of the spring migration even if the migration begins earlier.

Field Name Field Description Data Type Codes/Conventions for JuvenileOutmigrants TableContactAgency Agency, tribe, or other entity, or person responsible
for these data that is the best contact for questions that may arise about this data record.
Text 255 Entries in this field must precisely match a name in the StreamNet agency list. Here are the ones most likely needed. If yours is not found here, contact your agency StreamNet representative, or call PSMFC's StreamNet staff at 503-595-3100. Columbia River Inter-Tribal Fish Commission Colville Confederated Tribes Confederated Tribes and Bands of the Yakama Indian Nation Confederated Tribes of the Umatilla Indian Reservation Confederated Tribes of the Warm Springs Reservation of Oregon Idaho Department of Fish and Game Nez Perce Tribe of Idaho Oregon Department of Fish and Wildlife Spokane Tribe of Indians Washington Department of Fish and Wildlife
MethodNumber This field represents the method(s) used to calculate the values in the "Indicators" and "Metrics" sections.
Byte This field, along with the "ContactAgency" field above, identifies which entity calculated the values in the record and which (set of) methods where used to calculate them. These fields allow for multiple entries for the same population and year. Thus, it is possible to share values that are based on different assumptions, or for different locations, life stages, etc.
If only one set of methods is used to calculate the values for all years for a population, enter "1" for all records. Even if methods changed, you can enter "1" for all records if there is always only one record per year for a population.
If more than one set of methods is used to calculate final values over a range of years for a population, use this field to indicate which records are meant to go together. For example, if method 1 was used to calculate values for 1960 through 1994, and method 2 was used to calculate values for 1980 through 2013, then there will be more than one record for the years 1980 through 1994. In such cases you would enter "1" for records that result from the 1960-1994 method, and "2" for records that result from the 1980-2013 method. Similarly, if 3 different methods are proposed in an area for the same years, then use "1" and "2" and "3" to indicate which records belong together. This lets a data user know which records belong together.
When more than one record exists for a population X year combination, it is up to biologists using the data to select the value of most use when conducting their day to day business. The ContactAgency and MethodNumber fields allow for this.

Field Name Field Description Data Type Codes/Conventions for JuvenileOutmigrants Table
Indicators
TotalNatural The point estimate, to the location defined in the SmoltEqLocation field, of: the number of spring/summer smolt equivalents
foro bull trouto coastal cutthroat trouto coho salmono east-side spring/summer (stream-type)
Chinook salmon, ando steelhead;
the total number of outmigrants of all types foro fall Chinook salmono lower Columbia spring Chinook salmono upper Columbia summer Chinook salmono Willamette spring Chinook salmon;
the number of smolts foro chum salmono pink salmon.o sockeye salmon.
Single Estimated total number of natural origin fish that outmigrated in a particular year. "Natural origin" means the fish's parents spawned in the wild. The statistical approach used to generate the estimate should be thoroughly explained in the methods referenced in the MethodDocumentation field.
TotalNaturalLowerLimit The lower limit of the confidence interval for the TotalNatural field.
Single Minimum value = 0. If the calculated lower limit of the confidence interval is less than zero you may report 0 in this field, but we suggest you consider statistical options that prevent values outside of possible limits (these include non-normal distributions, transformations, and/or bootstrapping approaches).
TotalNaturalUpperLimit The upper limit of the confidence interval for the TotalNatural field.
Single Minimum value = 0.
TotalNaturalAlpha The significance level for the TotalNatural confidence interval, expressed as alpha.
Single Express these values as alpha values. For example, for the 95% confidence limits enter "0.05" in this field, not "95".
Metrics supporting the "Indicators" fields above can be found in the JuvenileOutmigrantDetail table (below), which is a child of this table.
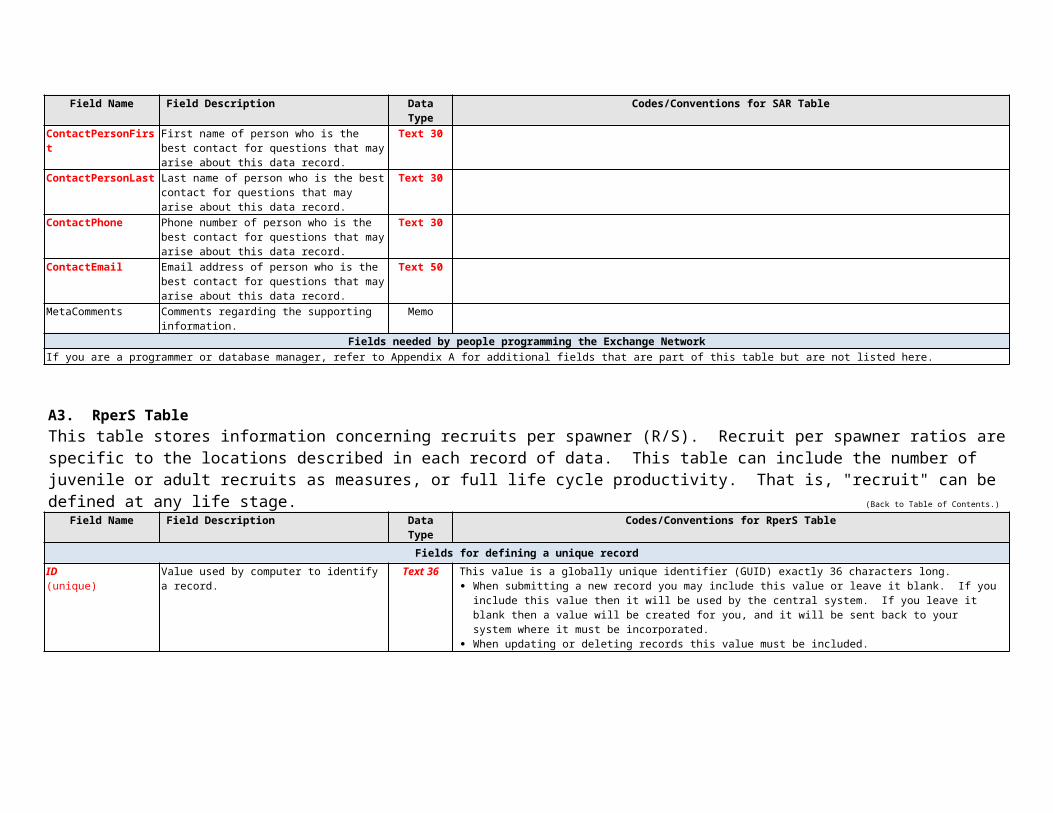
Field Name Field Description Data Type Codes/Conventions for JuvenileOutmigrants Table
Age determination
Age0Prop The proportion of natural origin fish that were age 0 (brood year +0).
Single Values must be between 0 and 1. Express with 3 digits to the right of the decimal point.
Ages in this table are based on the year spawning occurred, not necessarily the year eggs hatched, so care must be taken in reporting ages.
Assigning age can be complicated based on the life history (generally, salmon return and spawn in one year but hatch in the next, steelhead spawn and hatch in the same year). Make sure these details are accounted for in assigning ages. [ Note – This means we would never refer to age 0 salmon, because they hatch in the year after the eggs are laid, but for steelhead and other spring spawners age 0 is a valid age we would expect to see. ]
The age distribution numbers reported here must meet three criteria. If these criteria are not met then do not report ages.1. These age fields contain proportions by age for the natural origin fish. They are not the numbers of fish actually aged, nor
are they the expanded numbers for a population. Consider this scenario: The juvenile outmigrants estimate is 100,000 fish (as reported in the TotalNatural field) 500 fish were aged After age analysis is completed it is determined that 45% of the fish (meaning 45,000 of the 100,000) were age 0. In this case the value in this field should be 0.45 (45,000/100,000) not 45,000, 500, or 100,000.
2. The values of the Age0Prop through Age4PlusProp fields must sum to 1.00 ± 0.01.3. The age distribution must be derived only from the natural origin fish of the specific population and year this record
represents. Therefore, do not include age data that are derived in part or in whole from any other group of fish.
The age information may represent the exact group of fish indicated in the Abundance field, or a somewhat different group of fish. For example, the ages may have been taken from a geographic or temporal subset of the population. Whatever may be the case, ensure this information is included in the protocol and method documentation section below.
Age0PropLowerLimit The lower limit of the confidence interval for the Age0Prop field.
Single Minimum value = 0 and maximum = 1. If the calculated lower limit of the confidence interval is less than zero you may report 0 in this field, but we suggest you consider statistical options that prevent values outside of possible limits (these include non-normal distributions, transformations, and/or bootstrapping approaches).The associated alpha value is in the AgePropAlpha field, which is found below after the fields for age 4+.
Age0PropUpperLimit The upper limit of the confidence interval for the Age0Prop field.
Single Minimum value = 0 and maximum = 1. If the calculated lower limit of the confidence interval is more than 1.0 you may report 1.0 in this field, but we suggest you consider statistical options that prevent values outside of possible limits.
Age1Prop The proportion of natural origin fish that were age 1 (brood year +1).
Single See the Codes/Conventions column for the Age2Prop field.
Age1PropLowerLimit The lower limit of the confidence interval for the Age1Prop field.
Single See the Codes/Conventions for the Age0PropLowerLimit field.
Age1PropUpperLimit The upper limit of the confidence interval for the Age1Prop field.
Single See the Codes/Conventions for the Age2PropUpperLimit field.
Age2Prop The proportion of natural origin fish that were age 2 (brood year +2).
Single See the Codes/Conventions column for the Age2Prop field.
Age2PropLowerLimit The lower limit of the confidence interval for the Age2Prop field.
Single See the Codes/Conventions for the Age0PropLowerLimit field.
Age2PropUpperLimit The upper limit of the confidence interval for the Age2Prop field.
Single See the Codes/Conventions for the Age0PropUpperLimit field.
Age3Prop The proportion of natural origin fish that were age 3 (brood year +3).
Single See the Codes/Conventions column for the Age0Prop field.
Age3PropLowerLimit The lower limit of the confidence interval for the Age3Prop field.
Single See the Codes/Conventions for the Age0PropLowerLimit field.
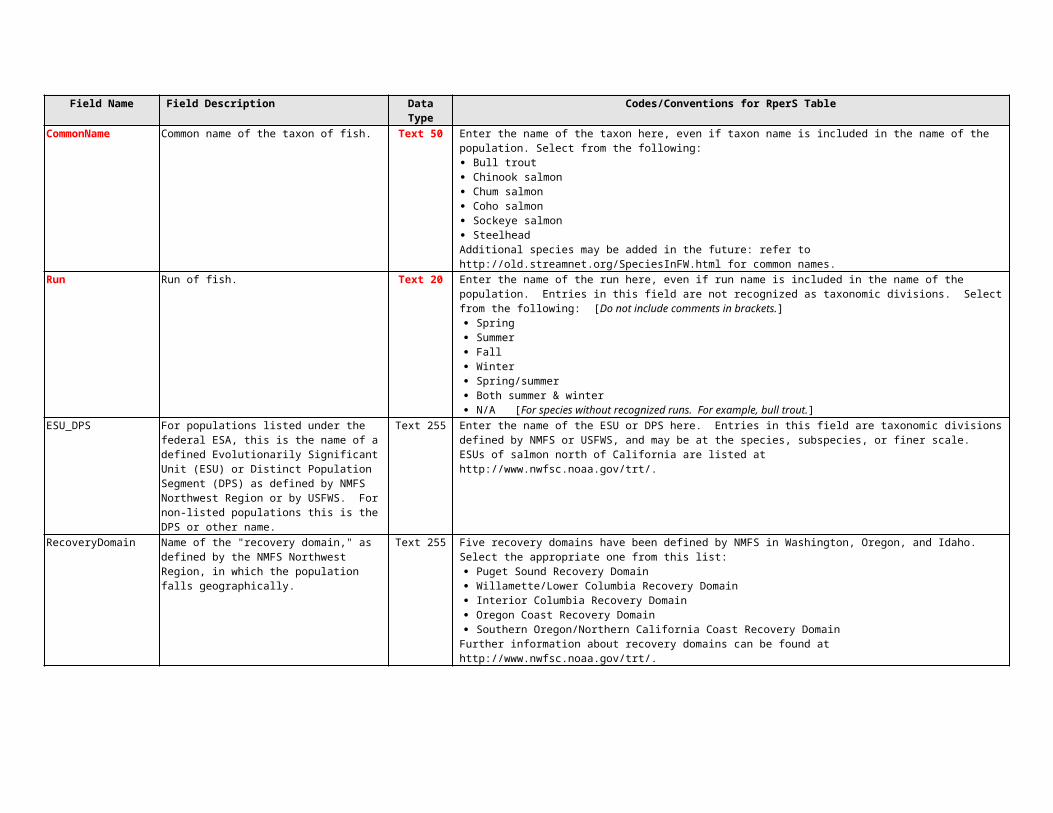
Field Name Field Description Data Type Codes/Conventions for JuvenileOutmigrants TableAge3PropUpperLimit The upper limit of the confidence interval for the
Age3Prop field.Single See the Codes/Conventions for the Age0PropUpperLimit field.
Age4PlusProp The proportion of natural origin fish that were age 4 or higher (brood year +4 or more).
Single See the Codes/Conventions column for the Age0Prop field.
Age4PlusPropLowerLimit
The lower limit of the confidence interval for the Age4PlusProp field.
Single See the Codes/Conventions for the Age0PropLowerLimit field.
Age4PlusPropUpperLimit
The upper limit of the confidence interval for the Age4PlusProp field.
Single See the Codes/Conventions for the Age0PropUpperLimit field.
AgePropAlpha The significance level for the Age_x_Prop confidence intervals, expressed as alpha.
Single Express these values as alpha values. For example, for the 95% confidence limits enter "0.05" in this field, not "95".
Protocol and method documentation
ProtMethName The name(s) of all protocols and associated data collection and data analysis methods used to calculate the indicator estimate.
Memo Provide title of protocol and name(s) of relevant methods used.
Documentation should include the study design (including spatial, temporal, response and inference designs), annual implementation notes on variations from routine step by step procedures or design criteria, also known as survey design, description of field methodology and analytical approach.
ProtMethURL URL(s) for published protocols and methods describing the methodology and documenting the derivation of the indicator. If published in MonitoringMethods.org, this link will provide access to study design information and all methods associated with the protocol.
Memo Required if ProtMethDocumentation is null.Provide URL(s) to source documentation of methodology. For MonitoringMethods.org provide link to the protocol. Methods documentation should include survey design, description of field methodology and analytical approach. URL links may be to online methods documentation resources like MonitoringMethods.org, other online resources, or online literature.
If methodology is unchanged from a previous year, use the previous link references. If methodology changed for this estimate, provide a new link.
ProtMethDocumentation Citation or documentation that describes the protocol and/or method(s) listed in the ProtMethName field. Include references not documented in MonitoringMethods.org, such as reports, journal articles or other publications that describe the survey design, field methodology and analytical approach used to derive the indicator estimate.
Memo Required if ProtMethURL is null.Provide a citation(s) to documentation of the methodology used. This may be in the form of reports, journal articles, or other publications that describe the study design (including spatial, temporal, response and inference designs), variations from routine step by step procedures or design criteria, description of field methodology and analytical approach. If the methodology is not yet published, either insert here, or describe in a separate document and make it available online (provide the URL). Leave this field blank if methodology is described in MonitoringMethods.org.
Note: If there is no link to a cited document online, provide a copy of the document to the StreamNet Library (streamnetlibrary.org). The library will scan the document and provide a URL. Post the URL in the ProtMethURL field.
If methodology is unchanged from a previous year, use the previous link or reference citation. If methodology changed, provide a new link or reference citation.
MethodAdjustments Minor adjustments to a method in a given year that are not described in the method citations above but are important.
Memo Give a brief description of changes or adjustments to a standard method if they are NOT described in the methods documentation already provided. If multiple documentation sources are cited, be sure to indicate which method from which document was adjusted.
In MonitoringMethods.org, documentation of changes or adjustments to methods or protocols can be described in the Implementation Notes section of each published method or protocol.
Comments about the data
Comments Any issues, problems, questions about this indicator that were not already captured in other places.
Memo Required if NullRecord = "Yes".

Field Name Field Description Data Type Codes/Conventions for JuvenileOutmigrants Table
Supporting information
NullRecord In some years data may not be collected and so a value cannot be calculated. For example, high muddy water or wildfires can prevent redd counts. This field is used to indicate that a record does not exist because the data do not exist to calculate it.
Text 3 Normally "No".A value of "Yes" in this field is a positive statement that the data do not exist to calculate the indicator for the population and time period specified.
The value of including this field is so that missing data are explicitly accounted for rather than being a perpetually open question that is repeatedly researched. Explain in the Comments field why the data do not exist.
DataStatus Status of the data in the current record. Text 255 Acceptable values: [Do not include comments in brackets.] Draft [Values in this record are preliminary and have not been thoroughly reviewed.] Reviewed [Values in this record have been reviewed but are not yet approved as "final".] Final [Values in this record have been thoroughly reviewed and are considered "final".]
LastUpdated Date (and time if desired) the information in this record was last updated.
Date/Time If an exact date is not known, give an estimate.
IndicatorLocation Where this indicator is maintained at the source. Memo If online, provide URL(s).ContactPersonFirst First name of person who is the best contact for
questions that may arise about this data record.Text 30
ContactPersonLast Last name of person who is the best contact for questions that may arise about this data record.
Text 30
ContactPhone Phone number of person who is the best contact for questions that may arise about this data record.
Text 30
ContactEmail Email address of person who is the best contact for questions that may arise about this data record.
Text 50
MetaComments Comments regarding the supporting information. Memo
A5. JuvenileOutmigrantsDetail TableThis table is a child of the JuvenileOutmigrants table. It stores metrics (outmigrant numbers) specific to the trapping site(s) and life stages used to calculate the juvenile outmigrant estimates captured in the JuvenileOutmigrants table. (Back to Table of Contents.)
Field Name Field Description Data Type Codes/Conventions for JuvenileOutmigrantsDetail Table
Fields for defining a unique record
ID Value used by computer to identify a record. Text 36 This value is a globally unique identifier (GUID) exactly 36 characters long. When submitting a new record you may include this value or leave it blank. If you include this value then it will be used by
the central system. If you leave it blank then a value will be created for you, and it will be sent back to your system where it must be incorporated.
When updating or deleting records this value must be included.
Fields for linking to parent table
JuvenileOutmigrantsID Foreign key used to identify the parent record in the JuvenileOutmigrants table.
Text 36 The ID of the parent record is a 36 character GUID. That GUID preferably is supplied by the data provider; if it is not then the GUID returned by StreamNet when the parent record is loaded must be applied to both the JuvenileOutmigrants table and its child records in this table.

Field Name Field Description Data Type Codes/Conventions for JuvenileOutmigrantsDetail Table
Metrics supporting the "Indicators" fields in the JuvenileOutmigrants table
Location The specific location (trapping site) where abundance numbers were determined.
Text 255 This may be any of the following: the name of a fluvial water body and text description of where on that stream or river (river mile preferred, but river
kilometer, lat/long, or other characterization allowable). the name of an impounded fluvial water body (reservoir) and description of where on that reservoir. the name of a lentic water body, and description of where on that lake. the name of a dam.
LocPTcode PTAGIS code for the SmoltEqLocation field. Text 255 There should be a PTAGIS code for most locations where smolts were trapped. Provide that code if available, or multiple codes if smolts were trapped at multiple locations for this population.
LifeStage Life stage the record represents. Text 11 This field is required if NullRecord = "No".Acceptable values: use one of the following sets of values, depending on the fish.
For Lower Columbia spring Chinook
use the following:o Subyearlingo Yearling
For Fall Chinook Willamette spring Chinook
use the following:o Fryo Subyearlingo Yearling
For Coho East-side spring/summer (stream-
type) Chinook Steelhead
use the following:o Fryo Parro Presmolto Smolt
For Upper Columbia summer Chinook
use the following:o Fryo Subyearling
For Chum Pink Sockeye
use the following:o Smolt
The suite of life stages to report are not yet determined for bull trout, coastal cutthroat trout, and any other species not explicitly listed here.
TotalNatural The point estimate for the number of natural origin fish of the indicated life stage passing the indicated location.
Single This field is required if NullRecord = "No".Estimated number of natural origin smolts that outmigrated in a particular year. The statistical approach used to generate the estimate should be thoroughly explained in the methods referenced in the MethodDocumentation field.
TotalNaturalLowerLimit The lower limit of the confidence interval for the TotalNatural field.
Single Minimum value = 0. If the calculated lower limit of the confidence interval is less than zero you may report 0 in this field, but we suggest you consider statistical options that prevent values outside of possible limits (these include non-normal distributions, transformations, and/or bootstrapping approaches).
TotalNaturalUpperLimit The upper limit of the confidence interval for the TotalNatural field.
Single Minimum value = 0.
TotalNaturalAlpha The significance level for the TotalNatural confidence interval, expressed as alpha.
Single Express these values as alpha values. For example, for the 95% confidence limits enter "0.05" in this field, not "95".
SurvivalRate The point estimate for the survival rate of fish from the life stage and trapping site indicated by the LifeStage and Location fields of this table to the smolt equivalent estimation site indicated by the SmoltEqLocation in the JuvenileOutmigrants table.
Single This field is required if NullRecord = "No".Express as a proportion from 0 to 1.
The Location field of this table tells where abundance numbers were determined for a specific trapping site and life stage. The SmoltEqLocation field of the JuvenileOutmigrants table (this table's parent table) tells the location for which the number of smolt equivalents was estimated. In cases where Location=SmoltEqLocation and LifeStage="Smolt", this value will equal "1" because the data (TotalNatural field) already indicate the number of smolts at the smolt equivalent location.
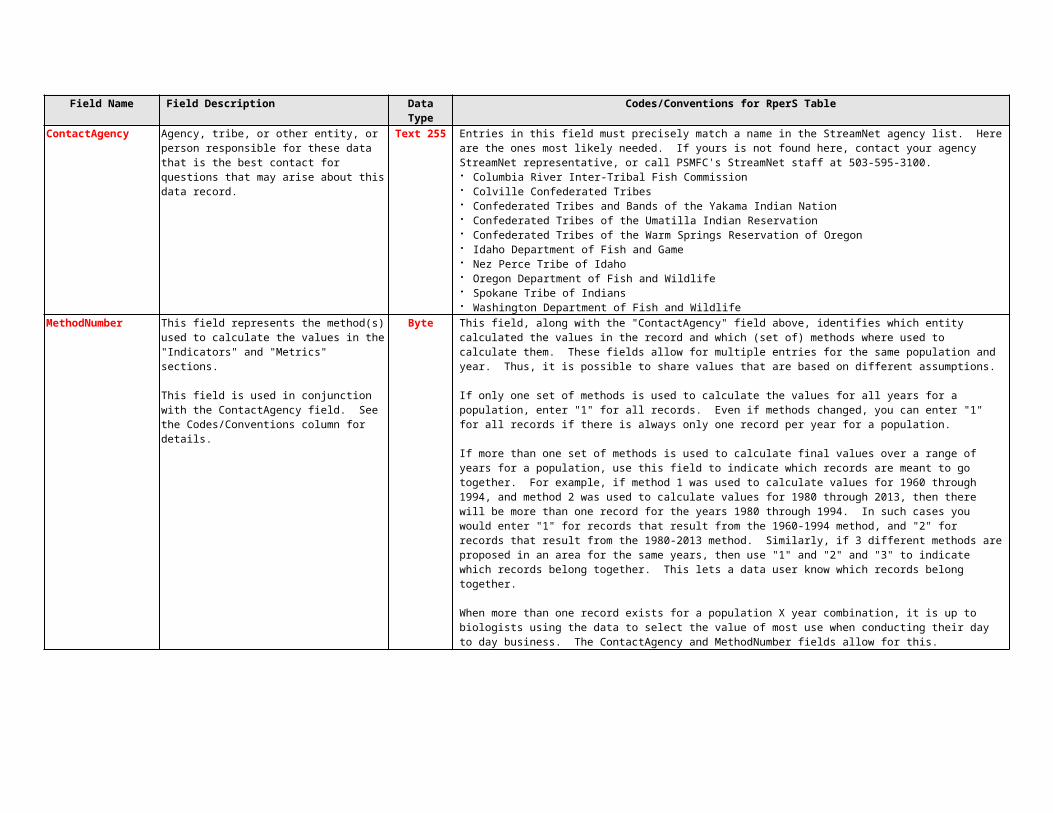
Field Name Field Description Data Type Codes/Conventions for JuvenileOutmigrantsDetail TableSurvivalRateLowerLimit The lower limit of the confidence interval for the
SurvivalRate field.Single Minimum value = 0 and maximum = 1. If the calculated lower limit of the confidence interval is less than zero you may report
0 in this field, but we suggest you consider statistical options that prevent values outside of possible limits (these include non-normal distributions, transformations, and/or bootstrapping approaches).
SurvivalRateUpperLimit The upper limit of the confidence interval for the SurvivalRate field.
Single Minimum value = 0 and maximum = 1. If the calculated lower limit of the confidence interval is more than 1.0 you may report 1.0 in this field, but we suggest you consider statistical options that prevent values outside of possible limits.
SurvivalRateAlpha The significance level for the SurvivalRate confidence interval, expressed as alpha.
Single Express these values as alpha values. For example, for the 95% confidence limits enter "0.05" in this field, not "95".
ContactAgency Agency, tribe, or other entity, or person responsible for these data that is the best contact for questions that may arise about this data record.
Text 255 Entries in this field must precisely match a name in the StreamNet agency list. Here are the ones most likely needed. If yours is not found here, contact your agency StreamNet representative, or call PSMFC's StreamNet staff at 503-595-3100. Columbia River Inter-Tribal Fish Commission Colville Confederated Tribes Confederated Tribes and Bands of the Yakama Indian Nation Confederated Tribes of the Umatilla Indian Reservation Confederated Tribes of the Warm Springs Reservation of Oregon Idaho Department of Fish and Game Nez Perce Tribe of Idaho Oregon Department of Fish and Wildlife Spokane Tribe of Indians Washington Department of Fish and Wildlife
Comments about the metrics data
Comments Any issues, problems, questions about this record that were not already captured in other places.
Memo Required if NullRecord = "Yes".
Supporting information
JMXID PRODUCTION_ESTIMATE_ID value from the JMX system that corresponds to this record.
Text 36 This value lets this table refer to the corresponding record in the WDFW/NWIFC Juvenile Migrant Exchange (JMX) and thus allows for easy access to detailed data for the record.
NullRecord In some years data may not be collected and so a value cannot be calculated. For example, high muddy water or wildfires can prevent redd counts. This field is used to indicate that a record does not exist because the data do not exist to calculate it.
Text 3 Normally "No".A value of "Yes" in this field is a positive statement that the data do not exist to calculate the metric for the population X location X life stage X time period specified.
The value of including this field is so that missing data are explicitly accounted for rather than being a perpetually open question that is repeatedly researched. Explain in the Comments field why the data do not exist.
LastUpdated Date (and time if desired) the information in this record was last updated.
Date/Time If an exact date is not known, give an estimate.
MetricLocation Where this supporting metric is maintained at the source.
Memo If online, provide URL(s).
MeasureLocation Where the measurements are maintained that were used to calculate this metric.
Memo If online, provide URL(s).
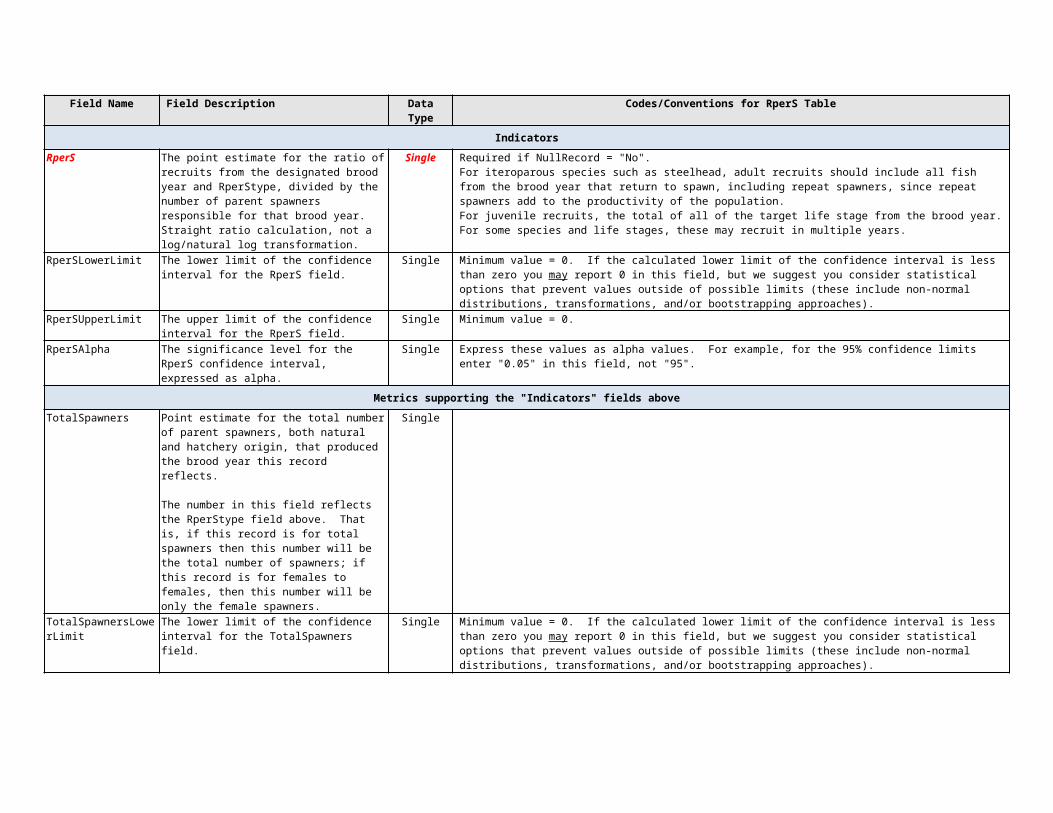
A6. PresmoltAbundance TableThis table stores information concerning natural origin presmolt abundance. "Presmolt abundance" is the total number of fish estimated for the population and time frame (year and months) indicated by each record. Most commonly these records will represent parr numbers estimated for late summer, but other times may be entered, and all presmolt life stages are included in these estimates. (Back to Table of Contents.)
Field Name Field Description Data Type Codes/Conventions for PresmoltAbundance TableFields for defining a unique record
ID(unique)
Value used by computer to identify a record. Text 36 This value is a globally unique identifier (GUID) exactly 36 characters long. When submitting a new record you may include this value or leave it blank. If you include this value then it will be used by
the central system. If you leave it blank then a value will be created for you, and it will be sent back to your system where it must be incorporated.
When updating or deleting records this value must be included.CommonName Common name of the taxon of fish. Text 50 Enter the name of the taxon here, even if taxon name is included in the name of the population. Select from the following:
Bull trout Chinook salmon Chum salmon Coho salmon Sockeye salmon SteelheadAdditional species may be added in the future: refer to http://old.streamnet.org/SpeciesInFW.html for common names.
Run Run of fish. Text 20 Enter the name of the run here, even if run name is included in the name of the population. Entries in this field are not recognized as taxonomic divisions. Select from the following: [Do not include comments in brackets.] Spring Summer Fall Winter Spring/summer Both summer & winter N/A [For species without recognized runs. For example, bull trout.]
ESU_DPS For populations listed under the federal ESA, this is the name of a defined Evolutionarily Significant Unit (ESU) or Distinct Population Segment (DPS) as defined by NMFS Northwest Region or by USFWS. For non-listed populations this is the DPS or other name.
Text 255 Enter the name of the ESU or DPS here. Entries in this field are taxonomic divisions defined by NMFS or USFWS, and may be at the species, subspecies, or finer scale. ESUs of salmon north of California are listed athttp://www.nwfsc.noaa.gov/trt/.
RecoveryDomain Name of the "recovery domain," as defined by the NMFS Northwest Region, in which the population falls geographically.
Text 255 Five recovery domains have been defined by NMFS in Washington, Oregon, and Idaho. Select the appropriate one from this list: Puget Sound Recovery Domain Willamette/Lower Columbia Recovery Domain Interior Columbia Recovery Domain Oregon Coast Recovery Domain Southern Oregon/Northern California Coast Recovery Domain
Further information about recovery domains can be found at http://www.nwfsc.noaa.gov/trt/.MajorPopGroup Name of "major population group" (MPG) or
“stratum” as defined by the NMFS Northwest Region, in which the population falls.
Text 255 The term "stratum" is used in the Willamette/Lower Columbia Recovery Domain, while "major population group" is used in other areas. The term "stratum" includes life history considerations as well as geographic criteria, while MPGs are defined geographically. See Appendix C for the list of MPGs / strata.

Field Name Field Description Data Type Codes/Conventions for PresmoltAbundance TablePopID Code for the population(s) of fish represented by this
record.Integer See Appendix C for the list of PopID codes for populations as defined by NMFS Northwest Region for ESA. The populations
are defined by NMFS Northwest Region; the codes for these populations are created by StreamNet to reference those NMFS populations. See Appendix E if you need a PopID for a population that does not yet have one assigned.
CBFWApopName Population name as defined by CBFWA for subbasin planning purposes, from subbasin plans and agencies.
Text 255 This may include non-listed populations, or cases where geographic area does not match a defined population of a listed species. See Appendix D for the list of these population names.
Fill this field even when a population's geographic extent coincides with NWR name for a listed population.CommonPopName Population name used by local biologists. Text 255 Often this is simply the name of the population(s) as written on the original time series spreadsheets.PopFit Categorization of how well the geographic extent of
the abundance estimate corresponds to the geographic definition of the population.
Text 8 This field is required if NullRecord = "No".Acceptable values: [Do not include comments in brackets.] Same [Estimate represents one entire population, the whole population, and nothing but the population.] Portion [Estimate represents a portion of one population. (Describe in PopFitNotes field.)] Multiple [Estimate is from more than one population. (Describe in PopFitNotes field.)]
PopFitNotes Text description of how well the natural origin spawner abundance value corresponds to the defined population, and why the data are not at the scale of a single population.
Memo This field is required if the PopFit field is "Portion" or "Multiple".If the PopFit field is "Portion" or "Multiple", describe the lack of correspondence between the defined population and the fish for which the abundance estimate was made. Also state why this scale of data was used to represent the population instead of true population-scale data. (Examples: "Data not available at exact scale of this population."; "Data at this scale best represent the population.")
WaterBody Name of the body of water associated with the time series.
Text 255 This may be any of the following: the name of a fluvial water body. the name of an impounded fluvial water body (reservoir). the name of a lentic water body. a description of multiple water bodies if appropriate for the time series.
To allow for easy sorting, follow these general format examples: River or stream – John Day River; Fifteen Mile Creek. Fork of a river, main name first – John Day River, North Fork
o [for North Fork John Day River] Salmon River, East Fork South Fork
o [for East Fork South Fork Salmon River] Reservoir (the word "Lake" comes first) – Lake Billy Chinook; Cougar Reservoir. Natural lake (the word "Lake" comes last) – Alturas Lake.
SurveyYear The four-digit year represented. IntegerStartMonth The month presmolt sampling started. Text 9 Enter full name of month, correctly spelled.EndMonth The month presmolt sampling ended. Text 9 Enter full name of month, correctly spelled.ContactAgency Agency, tribe, or other entity, or person responsible
for these data that is the best contact for questions that may arise about this data record.
Text 255 Entries in this field must precisely match a name in the StreamNet agency list. Here are the ones most likely needed. If yours is not found here, contact your agency StreamNet representative, or call PSMFC's StreamNet staff at 503-595-3100. Columbia River Inter-Tribal Fish Commission Colville Confederated Tribes Confederated Tribes and Bands of the Yakama Indian Nation Confederated Tribes of the Umatilla Indian Reservation Confederated Tribes of the Warm Springs Reservation of Oregon Idaho Department of Fish and Game Nez Perce Tribe of Idaho Oregon Department of Fish and Wildlife Spokane Tribe of Indians Washington Department of Fish and Wildlife

Field Name Field Description Data Type Codes/Conventions for PresmoltAbundance TableMethodNumber This field represents the method(s) used to calculate
the values in the "Indicators" and "Metrics" sections.
This field is used in conjunction with the ContactAgency field. See the Codes/Conventions column for details.
Byte This field, along with the "ContactAgency" field above, identifies which entity calculated the values in the record and which (set of) methods where used to calculate them. These fields allow for multiple entries for the same population and year. Thus, it is possible to share values that are based on different assumptions.
If only one set of methods is used to calculate the values for all years for a population, enter "1" for all records. Even if methods changed, you can enter "1" for all records if there is always only one record per year for a population.
If more than one set of methods is used to calculate final values over a range of years for a population, use this field to indicate which records are meant to go together. For example, if method 1 was used to calculate values for 1960 through 1994, and method 2 was used to calculate values for 1980 through 2013, then there will be more than one record for the years 1980 through 1994. In such cases you would enter "1" for records that result from the 1960-1994 method, and "2" for records that result from the 1980-2013 method. Similarly, if 3 different methods are proposed in an area for the same years, then use "1" and "2" and "3" to indicate which records belong together. This lets a data user know which records belong together.
When more than one record exists for a population X year combination, it is up to biologists using the data to select the value of most use when conducting their day to day business. The ContactAgency and MethodNumber fields allow for this.
GeneralApproach The general class of method(s) used to make the abundance estimate.
Text 255 Acceptable values: Snorkeling Mark/recapture estimate Removal estimate Presmolt tagging with downmigrant trap recapture Down-migrant trapping
(Contact Mike Banach at 503-595-3152 if you need to add to this list.)
Because there are no dedicated "metric" fields in this table, if you wish to include metric-level information then put the following in the MethodAdjustments field: For mark/recapture estimates include number of reaches
sampled, total number of reaches, reach lengths, total survey length/area by habitat type, total length/area expanded to by habitat type, and density (by habitat type).
For presmolt tagging with downmigrant trap recaptures include parr to smolt survival rate & smolt abundance (to back-calculate summer parr numbers), number of parr marked, and number recaptured.
For down-migrant trapping, include total number captured and overall trapping efficiency weighted by trapping period, if available.
Indicators
Abundance The point estimate for natural origin presmolt abundance.
Single Required if NullRecord = "No".Estimated number of natural origin presmolts for the particular year (date?) indicated. "Natural origin" means the fish's parents spawned in the wild. The statistical approach used to generate the estimate should be thoroughly explained in the methods referenced in the MethodDocumentation field.
AbundanceLowerLimit The lower limit of the confidence interval for the Abundance field.
Single Minimum value = 0. If the calculated lower limit of the confidence interval is less than zero you may report 0 in this field, but we suggest you consider statistical options that prevent values outside of possible limits (these include non-normal distributions, transformations, and/or bootstrapping approaches).
AbundanceUpperLimit The upper limit of the confidence interval for the Abundance field.
Single Minimum value = 0.
AbundanceAlpha The significance level for the Abundance confidence interval, expressed as alpha.
Single Express these values as alpha values. For example, for the 95% confidence limits enter "0.05" in this field, not "95".
Metrics supporting the "Indicators" fields above
Because of the diversity of ways in which presmolt numbers may be determined, there is not a common set of fields to act as "Metrics" for this data type. Therefore, at least initially, there are no "metrics" fields in this table.

Field Name Field Description Data Type Codes/Conventions for PresmoltAbundance Table
Age determination
Age0Prop The proportion of natural origin fish that were age 0 (brood year +0).
Single Values must be between 0 and 1. Express with 3 digits to the right of the decimal point.
Ages in this table are based on the year spawning occurred, not necessarily the year eggs hatched, so care must be taken in reporting ages.
Assigning age can be complicated based on the life history (generally, salmon return and spawn in one year but hatch in the next, steelhead spawn and hatch in the same year). Make sure these details are accounted for in assigning ages. [ Note – This means we would never refer to age 0 salmon, because they hatch in the year after the eggs are laid, but for steelhead and other spring spawners age 0 is a valid age we would expect to see. ]
The age distribution numbers reported here must meet three criteria. If these criteria are not met then do not report ages.1. These age fields contain proportions by age for the natural origin fish. They are not the numbers of fish actually aged, nor
are they the expanded numbers for a population. Consider this scenario:a. The presmolt number estimate is 100,000 fish (as reported in the Abundance field)b. 500 fish were agedc. After age analysis is completed it is determined that 45% of the fish (meaning 45,000 of the 100,000) were age 0.d. In this case the value in this field should be 0.45 (45,000/100,000) not 45,000, 500, or 100,000.
2. The values of the Age0Prop through Age4PlusProp fields must sum to 1.00 ± 0.01.3. The age distribution must be derived only from the natural origin fish of the specific population and year this record
represents. Therefore, do not include age data that are derived in part or in whole from any other group of fish.
The age information may represent the exact group of fish indicated in the Abundance field, or a somewhat different group of fish. For example, the ages may have been taken from a geographic or temporal subset of the population. Whatever may be the case, ensure this information is included in the protocol and method documentation section below.
Age0PropLowerLimit The lower limit of the confidence interval for the Age2Prop field.
Single The associated alpha value is in the AgePropAlpha field, which is found below after the fields for age 4+.
Minimum value = 0 and maximum = 1. If the calculated lower limit of the confidence interval is less than zero you may report 0 in this field, but we suggest you consider statistical options that prevent values outside of possible limits (these include non-normal distributions, transformations, and/or bootstrapping approaches).
Age0PropUpperLimit The upper limit of the confidence interval for the Age2Prop field.
Single Minimum value = 0 and maximum = 1. If the calculated lower limit of the confidence interval is more than 1.0 you may report 1.0 in this field, but we suggest you consider statistical options that prevent values outside of possible limits.
Age1Prop The proportion of natural origin fish that were age 2 (brood year +1).
Single See the Codes/Conventions column for the Age0Prop field.
Age1PropLowerLimit The lower limit of the confidence interval for the Age2Prop field.
Single See the Codes/Conventions for the Age0PropLowerLimit field.
Age1PropUpperLimit The upper limit of the confidence interval for the Age2Prop field.
Single See the Codes/Conventions for the Age0PropUpperLimit field.
Age2Prop The proportion of natural origin fish that were age 2 (brood year +2).
Single See the Codes/Conventions column for the Age0Prop field.
Age2PropLowerLimit The lower limit of the confidence interval for the Age2Prop field.
Single See the Codes/Conventions for the Age0PropLowerLimit field.
Age2PropUpperLimit The upper limit of the confidence interval for the Age2Prop field.
Single See the Codes/Conventions for the Age0PropUpperLimit field.
Age3Prop The proportion of natural origin fish that were age 3 (brood year +3).
Single See the Codes/Conventions column for the Age0Prop field.

Field Name Field Description Data Type Codes/Conventions for PresmoltAbundance TableAge3PropLowerLimit The lower limit of the confidence interval for the
Age3Prop field.Single See the Codes/Conventions for the Age0PropLowerLimit field.
Age3PropUpperLimit The upper limit of the confidence interval for the Age3Prop field.
Single See the Codes/Conventions for the Age0PropUpperLimit field.
Age4PlusProp The proportion of natural origin fish that were age 4 or higher (brood year +4 or more).
Single See the Codes/Conventions column for the Age0Prop field.
Age4PlusPropLowerLimit
The lower limit of the confidence interval for the Age4PlusProp field.
Single See the Codes/Conventions for the Age0PropLowerLimit field.
Age4PlusPropUpperLimit
The upper limit of the confidence interval for the Age4PlusProp field.
Single See the Codes/Conventions for the Age0PropUpperLimit field.
AgePropAlpha The significance level for the Age_x_Prop confidence intervals, expressed as alpha.
Single Express these values as alpha values. For example, for the 95% confidence limits enter "0.05" in this field, not "95".
Protocol and method documentation
ProtMethName The name(s) of all protocols and associated data collection and data analysis methods used to calculate the indicator estimate.
Memo Provide title of protocol and name(s) of relevant methods used.
Documentation should include the study design (including spatial, temporal, response and inference designs), annual implementation notes on variations from routine step by step procedures or design criteria, also known as survey design, description of field methodology and analytical approach.
ProtMethURL URL(s) for published protocols and methods describing the methodology and documenting the derivation of the indicator. If published in MonitoringMethods.org, this link will provide access to study design information and all methods associated with the protocol.
Memo Required if ProtMethDocumentation is null.Provide URL(s) to source documentation of methodology. For MonitoringMethods.org provide link to the protocol. Methods documentation should include survey design, description of field methodology and analytical approach. URL links may be to online methods documentation resources like MonitoringMethods.org, other online resources, or online literature.
If methodology is unchanged from a previous year, use the previous link references. If methodology changed for this estimate, provide a new link.
ProtMethDocumentation Citation or documentation that describes the protocol and/or method(s) listed in the ProtMethName field. Include references not documented in MonitoringMethods.org, such as reports, journal articles or other publications that describe the survey design, field methodology and analytical approach used to derive the indicator estimate.
Memo Required if ProtMethURL is null.Provide a citation(s) to documentation of the methodology used. This may be in the form of reports, journal articles, or other publications that describe the study design (including spatial, temporal, response and inference designs), variations from routine step by step procedures or design criteria, description of field methodology and analytical approach. If the methodology is not yet published, either insert here, or describe in a separate document and make it available online (provide the URL). Leave this field blank if methodology is described in MonitoringMethods.org.
Note: If there is no link to a cited document online, provide a copy of the document to the StreamNet Library (streamnetlibrary.org). The library will scan the document and provide a URL. Post the URL in the ProtMethURL field.
If methodology is unchanged from a previous year, use the previous link or reference citation. If methodology changed, provide a new link or reference citation.

Field Name Field Description Data Type Codes/Conventions for PresmoltAbundance TableMethodAdjustments Minor adjustments to a method in a given year that
are not described in the method citations above but are important.
Memo Be sure to include information specified in the MethodAdjustments field, as appropriate.
Give a brief description of changes or adjustments to a standard method if they are NOT described in the methods documentation already provided. If multiple documentation sources are cited, be sure to indicate which method from which document was adjusted.
In MonitoringMethods.org, documentation of changes or adjustments to methods or protocols can be described in the Implementation Notes section of each published method or protocol.
In this table, because there are no dedicated fields for metrics, this MethodAdjustments field can be used to displaymetric-level data. If you choose to do so, be aware that these metric-level data will be visible to all in the online query system. See note in the GeneralApproach field above.
Comments about the data
Comments Any issues, problems, questions about this indicator that were not already captured in other places.
Memo Required if NullRecord = "Yes".
Supporting information
NullRecord In some years data may not be collected and so a value cannot be calculated. For example, high muddy water or wildfires can prevent redd counts. This field is used to indicate that a record does not exist because the data do not exist to calculate it.
Text 3 Normally "No".A value of "Yes" in this field is a positive statement that the data do not exist to calculate the indicator for the population and time period specified.
The value of including this field is so that missing data are explicitly accounted for rather than being a perpetually open question that is repeatedly researched. Explain in the Comments field why the data do not exist.
DataStatus Status of the data in the current record. Text 255 Acceptable values: [Do not include comments in brackets.] Draft [Values in this record are preliminary and have not been thoroughly reviewed.] Reviewed [Values in this record have been reviewed but are not yet approved as "final".] Final [Values in this record have been thoroughly reviewed and are considered "final".]
LastUpdated Date (and time if desired) the information in this record was last updated.
Date/Time If an exact date is not known, give an estimate.
IndicatorLocation Where this indicator is maintained at the source. Memo If online, provide URL(s).MetricLocation Where the supporting metrics are maintained at the
source.Memo If online, provide URL(s).
MeasureLocation Where the measurements are maintained that were used for these calculations.
Memo If online, provide URL(s).
ContactPersonFirst First name of person who is the best contact for questions that may arise about this data record.
Text 30
ContactPersonLast Last name of person who is the best contact for questions that may arise about this data record.
Text 30
ContactPhone Phone number of person who is the best contact for questions that may arise about this data record.
Text 30
ContactEmail Email address of person who is the best contact for questions that may arise about this data record.
Text 50
MetaComments Comments regarding the supporting information. MemoFields needed by people programming the Exchange Network
If you are a programmer or database manager, refer to Appendix A for additional fields that are part of this table but are not listed here.

Section B: Indicators for Hatchery Programs and Populations of Hatchery Origin Fishes
B1. HatcherySpawning TableThis table stores information concerning hatchery spawning. "Spawners" refers to the number of fish that were actually spawned in a hatchery or hatchery complex under a specific program, not necessarily the total number of fish spawned at the hatchery (complex). Excess non-spawned fish are ignored and are not included in this table. (Back to Table of Contents.)
Field Name Field Description Data Type Codes/Conventions for HatcherySpawning TableFields for defining a unique record
ID(unique)
Value used by computer to identify a record. Text 36 This value is a globally unique identifier (GUID) exactly 36 characters long. When submitting a new record you may include this value or leave it blank. If you include this value then it will be used by
the central system. If you leave it blank then a value will be created for you, and it will be sent back to your system where it must be incorporated.
When updating or deleting records this value must be included.CommonName Common name of the taxon of fish. Text 50 Enter the name of the taxon here, even if taxon name is included in the name of the population. Select from the following:
Bull trout Chinook salmon Chum salmon Coho salmon Sockeye salmon Steelhead
Additional species may be added in the future: refer to http://old.streamnet.org/SpeciesInFW.html for common names.Run Run of fish. Text 20 Enter the name of the run here, even if run name is included in the name of the population. Entries in this field are not
recognized as taxonomic divisions. Select from the following: [Do not include comments in brackets.] Spring Summer Fall Winter Spring/summer Both summer & winter N/A [For species without recognized runs. For example, bull trout.]
ESU_DPS For populations listed under the federal ESA, this is the name of a defined Evolutionarily Significant Unit (ESU) or Distinct Population Segment (DPS) as defined by NMFS Northwest Region or by USFWS in which the population falls geographically. For non-listed populations this is the DPS or other name.
Text 255 Enter the name of the ESU or DPS here. Entries in this field are taxonomic divisions defined by NMFS or USFWS, and may be at the species, subspecies, or finer scale. ESUs of salmon north of California are listed athttp://www.nwfsc.noaa.gov/trt/.
RecoveryDomain Name of the "recovery domain," as defined by the NMFS Northwest Region, in which the population falls geographically.
Text 255 Five recovery domains have been defined by NMFS in Washington, Oregon, and Idaho. Select the appropriate one from this list: Puget Sound Recovery Domain Willamette/Lower Columbia Recovery Domain Interior Columbia Recovery Domain Oregon Coast Recovery Domain Southern Oregon/Northern California Coast Recovery Domain
Further information about recovery domains can be found at http://www.nwfsc.noaa.gov/trt/.

Field Name Field Description Data Type Codes/Conventions for HatcherySpawning TableMajorPopGroup Name of "major population group" (MPG) or
“stratum” as defined by the NMFS Northwest Region, in which the population falls geographically.
Text 255 The term "stratum" is used in the Willamette/Lower Columbia Recovery Domain, while "major population group" is used in other areas. The term "stratum" includes life history considerations as well as geographic criteria, while MPGs are defined geographically. See Appendix C for the list of MPGs / strata.
PopID Code for the population(s) of fish represented by this record.
Integer See Appendix C for the list of PopID codes for populations as defined by NMFS Northwest Region for ESA. The populations are defined by NMFS Northwest Region; the codes for these populations are created by StreamNet to reference those NMFS populations. See Appendix E if you need a PopID for a population that does not yet have one assigned.
ESAlisted Flag indicating whether the hatchery fish are part of the ESU or DPS in which it falls geographically.
Text 3 Acceptable values: Yes No
If you are unsure about a particular hatchery stock's inclusion in an ESU/DPS, information can be found athttps://www.federalregister.gov/articles/2014/04/14/2014-08347/endangered-and-threatened-wildlife-final-rule-to-revise-the-code-of-federal-regulations-for-species.
CBFWApopName Population name as defined by CBFWA for subbasin planning purposes, from subbasin plans and agencies.
Text 255 This may include non-listed populations, or cases where geographic area does not match a defined population of a listed species. See Appendix D for the list of these population names.
Fill this field even when a population's geographic extent coincides with NWR name for a listed population.CommonPopName Population name used by local biologists. Text 255 Often this is simply the name of the population(s) as written on the original time series spreadsheets.PopFit Categorization of how well the geographic extent of
the hatchery spawners estimate corresponds to the geographic definition of the population.
Text 8 This field is required if NullRecord = "No".Acceptable values: [Do not include comments in brackets.] Same [Estimate represents one entire population, the whole population, and nothing but the population.] Portion [Estimate represents a portion of one population. (Describe in PopFitNotes field.)] Multiple [Estimate is from more than one population. (Describe in PopFitNotes field.)]
PopFitNotes Text description of how well the hatchery origin spawner abundance value corresponds to the defined population, and why the data are not at the scale of a single population.
Memo This field is required if the PopFit field is "Portion" or "Multiple".If the PopFit field is "Portion" or "Multiple", describe the lack of correspondence between the defined population and the fish for which the hatchery spawners estimate was made. Also state why this scale of data was used to represent the population instead of true population-scale data. (Examples: "Data not available at exact scale of this population."; "Data at this scale best represent the population.")
HatcheryProgramName Hatchery program this record describes. Text 255HatcheryStockName Stock of hatchery fish this record describes. Text 255Hatchery Name of the hatchery or hatchery complex
associated with the time series.Text 255 This may be any of the following:
the name of a hatchery. the name of a hatchery complex. the names of multiple hatcheries if appropriate for the time series. (Providing alphabetically is preferred.)
To allow for easy sorting, it is preferable to use the hatchery name as listed in the StreamNet database at http://q.streamnet.org/Request.cfm?cmd=BuildPicklist&NewQuery=BuildCriteria&PicklistItem=Hatchery.

Field Name Field Description Data Type Codes/Conventions for HatcherySpawning TableHatcheryProgramType Purpose of the hatchery program this record
represents.Text 40 Acceptable values for this field are taken from the "Implementation and Compliance Monitoring" section of Appendix C in
Beasley, C.A., et al. 2008. Recommendations for broad scale monitoring to evaluate the effects of hatchery supplementation on the fitness of natural salmon and steelhead populations. Final report of the Ad hoc supplementation monitoring and evaluation workgroup. Available at http://old.streamnet.org/CoordinatedAssessments/AHSWG-2008-FinalReport.pdf. Descriptions (in italics) are derived from the entire document as necessary. [Do not include comments in brackets.] Segregated harvest augmentation [Purpose is to provide for harvest while attempting to keep hatchery origin fish from
spawning in the wild with natural origin fish.] Integrated supplementation [Purpose is to rebuild abundance of depressed naturally-spawning populations. Hatchery
origin and natural origin fish are intentionally encouraged to interbreed in the hatchery and in the natural environment.] Integrated supplementation/mitigation [Like "integrated supplementation" program, but with added purpose of providing
for harvest to mitigate for loss of harvest opportunities.] Conservation [This hatchery program type was listed in Appendix C of Beasley et al. 2008, but the document did not
provide any definition or description of this program type.]BroodstockType Method(s) used to raise hatchery fish. Text 18 Acceptable values: [Do not include comments in brackets.]
Captive broodstock [Fish were never released; spent entire lives in captivity.] Segregated [Broodstock (all hatchery origin) are kept separate from natural origin spawners to the extent possible.] Integrated [Broodstock (hatchery origin and natural origin) and natural spawners (hatchery origin and natural origin) are
treated as a single population.] Experimental
SpawningYear The four-digit year in which spawning of this species (and run where appropriate) began.
Integer In cases where an unusual population is spawned uncharacteristically early (before January 1 for spring spawners) or late (after December 31 for fall spawners) for the species (and perhaps run), assign the year based on the majority of populations of this species/run in order to be consistent for all members of the spawning cohort. For example, most coho spawn in fall but a few populations do not begin spawning until after Jan. 1. The spawning year assigned for these unusual populations would match the other populations that spawned in the fall, even though these particular populations did not begin spawning until after December 31.
ContactAgency Agency, tribe, or other entity, or person responsible for these data that is the best contact for questions that may arise about this data record.
Text 255 Entries in this field must precisely match a name in the StreamNet agency list. Here are the ones most likely needed. If yours is not found here, contact your agency StreamNet representative, or call PSMFC's StreamNet staff at 503-595-3100. Columbia River Inter-Tribal Fish Commission Colville Confederated Tribes Confederated Tribes and Bands of the Yakama Indian Nation Confederated Tribes of the Umatilla Indian Reservation Confederated Tribes of the Warm Springs Reservation of Oregon Idaho Department of Fish and Game Nez Perce Tribe of Idaho Oregon Department of Fish and Wildlife Spokane Tribe of Indians Washington Department of Fish and Wildlife

Field Name Field Description Data Type Codes/Conventions for HatcherySpawning TableMethodNumber This field represents the method(s) used to calculate
the values in the "Indicators" and "Metrics" sections.
This field is used in conjunction with the ContactAgency field. See the Codes/Conventions column for details.
Byte This field, along with the "ContactAgency" field above, identifies which entity calculated the values in the record and which (set of) methods where used to calculate them. These fields allow for multiple entries for the same population and year. Thus, it is possible to share values that are based on different assumptions.
If only one set of methods is used to calculate the values for all years for a population, enter "1" for all records. Even if methods changed, you can enter "1" for all records if there is always only one record per year for a population.
If more than one set of methods is used to calculate final values over a range of years for a population, use this field to indicate which records are meant to go together. For example, if method 1 was used to calculate values for 1960 through 1994, and method 2 was used to calculate values for 1980 through 2013, then there will be more than one record for the years 1980 through 1994. In such cases you would enter "1" for records that result from the 1960-1994 method, and "2" for records that result from the 1980-2013 method. Similarly, if 3 different methods are proposed in an area for the same years, then use "1" and "2" and "3" to indicate which records belong together. This lets a data user know which records belong together.
When more than one record exists for a population X year combination, it is up to biologists using the data to select the value of most use when conducting their day to day business. The ContactAgency and MethodNumber fields allow for this.
Indicators
NumberSpawned The total number of fish spawned. Integer Required if the EggsTaken field is null and NullRecord = "No".This is the total number of fish used in spawning, which includes hatchery and natural origin fish of all ages. This value must be a whole number.
pNOB Proportion of broodstock actually spawned in a hatchery that are natural origin fish. (See 'broodstock' in Glossary.)
Single Express these values as numbers from zero to one, with three digits to the right of the decimal point.
pNOBLowerLimit The lower limit of the confidence interval for the pNOB field.
Single Minimum value = 0 and maximum = 1. If the calculated lower limit of the confidence interval is less than zero you may report 0 in this field, but we suggest you consider statistical options that prevent values outside of possible limits (these include non-normal distributions, transformations, and/or bootstrapping approaches).
pNOBUpperLimit The upper limit of the confidence interval for the pNOB field.
Single Minimum value = 0 and maximum = 1. If the calculated lower limit of the confidence interval is more than 1.0 you may report 1.0 in this field, but we suggest you consider statistical options that prevent values outside of possible limits.
pNOBAlpha The significance level for the pNOB confidence interval, expressed as alpha.
Single Express these values as alpha values. For example, for the 95% confidence limits enter "0.05" in this field, not "95".
EggsTaken The total number of eggs taken and fertilized. Long int Required if the NumberSpawned field is null and NullRecord = "No".This value must be a whole number.
EggsTakenLowerLimit The lower limit of the confidence interval for the EggsTaken field.
Long int This value must be a whole number.
Minimum value = 0. If the calculated lower limit of the confidence interval is less than zero you may report 0 in this field, but we suggest you consider statistical options that prevent values outside of possible limits (these include non-normal distributions, transformations, and/or bootstrapping approaches).
EggsTakenUpperLimit The upper limit of the confidence interval for the EggsTaken field.
Long int This value must be a whole number.
Minimum value = 0.EggsTakenAlpha The significance level for the EggsTaken confidence
interval, expressed as alpha.Single Express these values as alpha values. For example, for the 95% confidence limits enter "0.05" in this field, not "95".
Metrics supporting the "Indicators" fields above
HOSIJ The number of hatchery origin fish spawned, including jacks.
Single "Hatchery origin" means the fish's parents were spawned in captivity rather than spawning naturally in the wild.

Field Name Field Description Data Type Codes/Conventions for HatcherySpawning TableHOSEJ The number of hatchery origin fish spawned,
excluding jacks.Single Includes only "adults" of hatchery origin, excluding jacks. "Hatchery origin" is as defined in the HOSIJ field.
For populations where jills occur, include them in the number of adult spawners; they will be accounted for in the “age determination” fields below.
For populations for which "jacks" are not recognized, leave this field blank. The only species for which jacks are recognized are Chinook salmon, coho salmon, chum salmon (rarely), and winter steelhead (rarely).
NOSIJ The number of natural origin fish spawned, including jacks.
Single This value reflects natural origin fish taken and spawned in the hatchery as part of the year's egg take operations. "Natural origin" means the fish's parents spawned in the wild.
NOSEJ The number of natural origin fish spawned, excluding jacks.
Single Includes only "adults" of natural origin, excluding jacks. "Natural origin" is as defined in the NOSIJ field.
For populations for which "jacks" are not recognized, leave this field blank. The only species for which jacks are recognized are Chinook salmon, coho salmon, chum salmon (rarely), and winter steelhead (rarely).
Age determination
Age2H The number of spawned hatchery origin fish that were age 2 (brood year +2).
Integer Age fields in this table show numbers of fish, not proportions. Values must be whole numbers.
Ages in this table are based on the year spawning occurred, not necessarily the year eggs hatched, so care must be taken in reporting ages.Assigning age can be complicated based on the life history (generally, salmon return and are spawned in one year but hatch in the next, steelhead are spawned and hatch in the same year). Make sure these details are accounted for in assigning ages.
These age fields contain the estimated numbers of fish spawned, by age, for hatchery origin fish (first set of age fields) and natural origin fish (second set of age fields). The values of the Age2H through Age11PlusN fields ideally should sum to the value in the NumberSpawned field, but imperfect data are allowable.
Age3H The number of spawned hatchery origin fish that were age 3 (brood year +3).
Integer See the Codes/Conventions column for the Age2H field.
Age4H The number of spawned hatchery origin fish that were age 4 (brood year +4).
Integer See the Codes/Conventions column for the Age2H field.
Age5H The number of spawned hatchery origin fish that were age 5 (brood year +5).
Integer See the Codes/Conventions column for the Age2H field.
Age6H The number of spawned hatchery origin fish that were age 6 (brood year +6).
Integer See the Codes/Conventions column for the Age2H field.
Age7H The number of spawned hatchery origin fish that were age 7 (brood year +7).
Integer See the Codes/Conventions column for the Age2H field.
Age8H The number of spawned hatchery origin fish that were age 8 (brood year +8).
Integer See the Codes/Conventions column for the Age2H field.
Age9H The number of spawned hatchery origin fish that were at age 9 (brood year +9).
Integer See the Codes/Conventions column for the Age2H field.
Age10H The number of spawned hatchery origin fish that were age 10 (brood year +10).
Integer See the Codes/Conventions column for the Age2H field.
Age11PlusH The number of spawned hatchery origin fish that were age 11 (brood year +11) or older.
Integer See the Codes/Conventions column for the Age2H field.
Age2N The number of spawned natural origin fish that were age 2 (brood year +2).
Integer See the Codes/Conventions column for the Age2H field.
Age3N The number of spawned natural origin fish that were age 3 (brood year +3).
Integer See the Codes/Conventions column for the Age2H field.

Field Name Field Description Data Type Codes/Conventions for HatcherySpawning TableAge4N The number of spawned natural origin fish that were
age 4 (brood year +4).Integer See the Codes/Conventions column for the Age2H field.
Age5N The number of spawned natural origin fish that were age 5 (brood year +5).
Integer See the Codes/Conventions column for the Age2H field.
Age6N The number of spawned natural origin fish that were age 6 (brood year +6).
Integer See the Codes/Conventions column for the Age2H field.
Age7N The number of spawned natural origin fish that were age 7 (brood year +7).
Integer See the Codes/Conventions column for the Age2H field.
Age8N The number of spawned natural origin fish that were age 8 (brood year +8).
Integer See the Codes/Conventions column for the Age2H field.
Age9N The number of spawned natural origin fish that were at age 9 (brood year +9).
Integer See the Codes/Conventions column for the Age2H field.
Age10N The number of spawned natural origin fish that were age 10 (brood year +10).
Integer See the Codes/Conventions column for the Age2H field.
Age11PlusN The number of spawned natural origin fish that were age 11 (brood year +11) or older.
Integer See the Codes/Conventions column for the Age2H field.
Protocol and method documentation
ProtMethName The name(s) of all protocols and associated data collection and data analysis methods used to calculate the indicator estimate.
Memo Provide title of protocol and name(s) of relevant methods used.
Documentation should include the study design (including spatial, temporal, response and inference designs), annual implementation notes on variations from routine step by step procedures or design criteria, also known as survey design, description of field methodology and analytical approach.
ProtMethURL URL(s) for published protocols and methods describing the methodology and documenting the derivation of the indicator. If published in MonitoringMethods.org, this link will provide access to study design information and all methods associated with the protocol.
Memo Required if ProtMethDocumentation is null.Provide URL(s) to source documentation of methodology. For MonitoringMethods.org provide link to the protocol. Methods documentation should include survey design, description of field methodology and analytical approach. URL links may be to online methods documentation resources like MonitoringMethods.org, other online resources, or online literature.
If methodology is unchanged from a previous year, use the previous link references. If methodology changed for this estimate, provide a new link.
ProtMethDocumentation Citation or documentation that describes the protocol and/or method(s) listed in the ProtMethName field. Include references not documented in MonitoringMethods.org, such as reports, journal articles or other publications that describe the survey design, field methodology and analytical approach used to derive the indicator estimate.
Memo Required if ProtMethURL is null.Provide a citation(s) to documentation of the methodology used. This may be in the form of reports, journal articles, or other publications that describe the study design (including spatial, temporal, response and inference designs), variations from routine step by step procedures or design criteria, description of field methodology and analytical approach. If the methodology is not yet published, either insert here, or describe in a separate document and make it available online (provide the URL). Leave this field blank if methodology is described in MonitoringMethods.org.
Note: If there is no link to a cited document online, provide a copy of the document to the StreamNet Library (streamnetlibrary.org). The library will scan the document and provide a URL. Post the URL in the ProtMethURL field.
If methodology is unchanged from a previous year, use the previous link or reference citation. If methodology changed, provide a new link or reference citation.
MethodAdjustments Minor adjustments to a method in a given year that are not described in the method citations above but are important.
Memo Give a brief description of changes or adjustments to a standard method if they are NOT described in the methods documentation already provided. If multiple documentation sources are cited, be sure to indicate which method from which document was adjusted.
In MonitoringMethods.org, documentation of changes or adjustments to methods or protocols can be described in the Implementation Notes section of each published method or protocol.
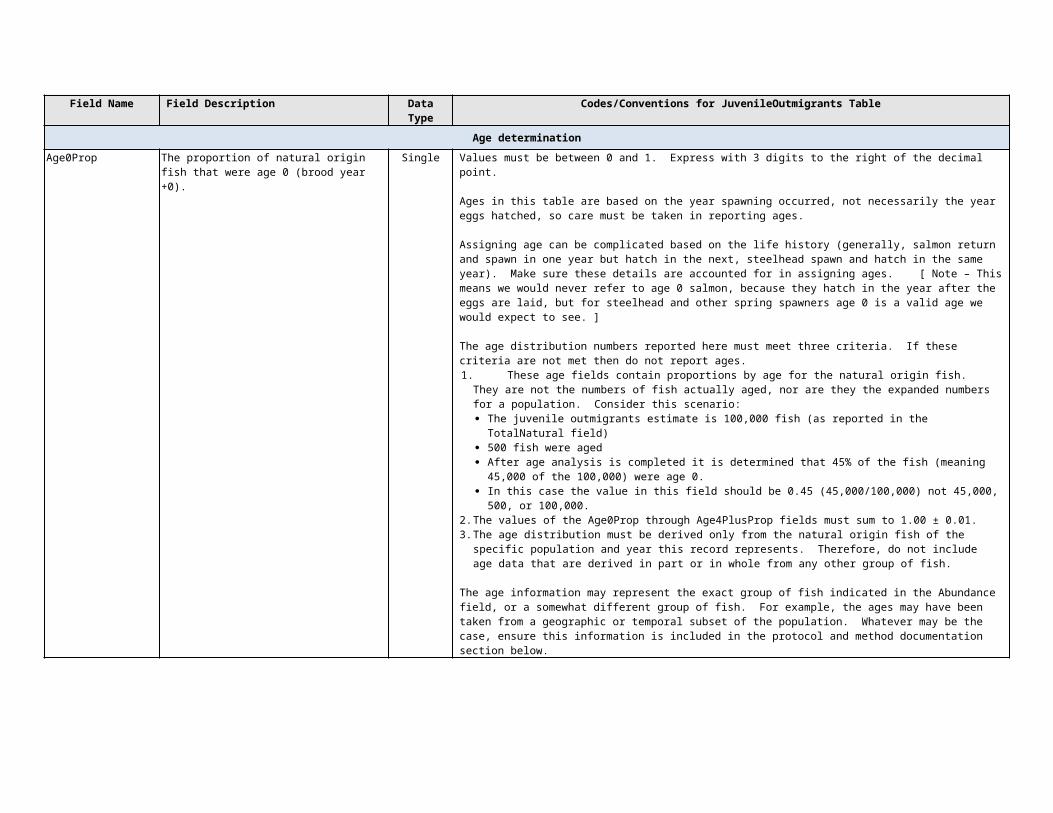
Field Name Field Description Data Type Codes/Conventions for HatcherySpawning Table
Comments about the data
Comments Any issues, problems, questions about this indicator that were not already captured in other places.
Memo Required if NullRecord = "Yes".
Supporting information
NullRecord In some years data may not be collected and so a value cannot be calculated. For example, high muddy water or wildfires can prevent redd counts. This field is used to indicate that a record does not exist because the data do not exist to calculate it.
Text 3 Normally "No".A value of "Yes" in this field is a positive statement that the data do not exist to calculate the indicator for the population and time period specified.
The value of including this field is so that missing data are explicitly accounted for rather than being a perpetually open question that is repeatedly researched. Explain in the Comments field why the data do not exist.
DataStatus Status of the data in the current record. Text 255 Acceptable values: [Do not include comments in brackets.] Draft [Values in this record are preliminary and have not been thoroughly reviewed.] Reviewed [Values in this record have been reviewed but are not yet approved as "final".] Final [Values in this record have been thoroughly reviewed and are considered "final".]
LastUpdated Date (and time if desired) the information in this record was last updated.
Date/Time If an exact date is not known, give an estimate.
IndicatorLocation Where this indicator is maintained at the source. Memo If online, provide URL(s).MetricLocation Where the supporting metrics are maintained at the
source.Memo If online, provide URL(s).
MeasureLocation Where the measurements are maintained that were used for these calculations.
Memo If online, provide URL(s).
ContactPersonFirst First name of person who is the best contact for questions that may arise about this data record.
Text 30
ContactPersonLast Last name of person who is the best contact for questions that may arise about this data record.
Text 30
ContactPhone Phone number of person who is the best contact for questions that may arise about this data record.
Text 30
ContactEmail Email address of person who is the best contact for questions that may arise about this data record.
Text 50
MetaComments Comments regarding the supporting information. MemoFields needed by people programming the Exchange Network
If you are a programmer or database manager, refer to Appendix A for additional fields that are part of this table but are not listed here.

B2. PNI TableThis table stores information about proportionate natural influence (PNI) of supplementation hatcheries, which is an estimate of the relative selection pressure of the natural environment on hatchery origin fish in an integrated natural / hatchery population. (Back to Table of Contents.)
Field Name Field Description Data Type Codes/Conventions for PNI TableFields for defining a unique record
ID(unique)
Value used by computer to identify a record. Text 36 This value is a globally unique identifier (GUID) exactly 36 characters long. When submitting a new record you may include this value or leave it blank. If you include this value then it will be used by
the central system. If you leave it blank then a value will be created for you, and it will be sent back to your system where it must be incorporated.
When updating or deleting records this value must be included.CommonName Common name of the taxon of fish. Text 50 Enter the name of the taxon here, even if taxon name is included in the name of the population. Select from the following:
Bull trout Chinook salmon Chum salmon Coho salmon Sockeye salmon Steelhead
Additional species may be added in the future: refer to http://old.streamnet.org/SpeciesInFW.html for common names.Run Run of fish. Text 20 Enter the name of the run here, even if run name is included in the name of the population. Entries in this field are not
recognized as taxonomic divisions. Select from the following: [Do not include comments in brackets.] Spring Summer Fall Winter Spring/summer Both summer & winter N/A [For species without recognized runs. For example, bull trout.]
ESU_DPS For populations listed under the federal ESA, this is the name of a defined Evolutionarily Significant Unit (ESU) or Distinct Population Segment (DPS) as defined by NMFS Northwest Region or by USFWS in which the population falls geographically. For non-listed populations this is the DPS or other name.
Text 255 Enter the name of the ESU or DPS here. Entries in this field are taxonomic divisions defined by NMFS or USFWS, and may be at the species, subspecies, or finer scale. ESUs of salmon north of California are listed athttp://www.nwfsc.noaa.gov/trt/.
RecoveryDomain Name of the "recovery domain," as defined by the NMFS Northwest Region, in which the population falls geographically.
Text 255 Five recovery domains have been defined by NMFS in Washington, Oregon, and Idaho. Select the appropriate one from this list: Puget Sound Recovery Domain Willamette/Lower Columbia Recovery Domain Interior Columbia Recovery Domain Oregon Coast Recovery Domain Southern Oregon/Northern California Coast Recovery Domain
Further information about recovery domains can be found at http://www.nwfsc.noaa.gov/trt/.MajorPopGroup Name of "major population group" (MPG) or
“stratum” as defined by the NMFS Northwest Region, in which the population falls geographically.
Text 255 The term "stratum" is used in the Willamette/Lower Columbia Recovery Domain, while "major population group" is used in other areas. The term "stratum" includes life history considerations as well as geographic criteria, while MPGs are defined geographically. See Appendix C for the list of MPGs / strata.

Field Name Field Description Data Type Codes/Conventions for PNI TablePopID Code for the population(s) of fish represented by this
record.Integer See Appendix C for the list of PopID codes for populations as defined by NMFS Northwest Region for ESA. The populations
are defined by NMFS Northwest Region; the codes for these populations are created by StreamNet to reference those NMFS populations. See Appendix E if you need a PopID for a population that does not yet have one assigned.
ESAlisted Flag indicating whether the hatchery fish are part of the ESU or DPS in which it falls geographically.
Text 3 Acceptable values: Yes No
If you are unsure about a particular hatchery stock's inclusion in an ESU/DPS, information can be found athttps://www.federalregister.gov/articles/2014/04/14/2014-08347/endangered-and-threatened-wildlife-final-rule-to-revise-the-code-of-federal-regulations-for-species.
CBFWApopName Population name as defined by CBFWA for subbasin planning purposes, from subbasin plans and agencies.
Text 255 This may include non-listed populations, or cases where geographic area does not match a defined population of a listed species. See Appendix D for the list of these population names.
Fill this field even when a population's geographic extent coincides with NWR name for a listed population.CommonPopName Population name used by local biologists. Text 255 Often this is simply the name of the population(s) as written on the original time series spreadsheets.PopFit Categorization of how well the geographic extent of
the PNI estimate corresponds to the geographic definition of the population.
Text 8 This field is required if NullRecord = "No".Acceptable values: [Do not include comments in brackets.] Same [Estimate represents one entire population, the whole population, and nothing but the population.] Portion [Estimate represents a portion of one population. (Describe in PopFitNotes field.)] Multiple [Estimate is from more than one population. (Describe in PopFitNotes field.)]
PopFitNotes Text description of how well the PNI value corresponds to the defined population, and why the data are not at the scale of a single population.
Memo This field is required if the PopFit field is "Portion" or "Multiple".If the PopFit field is "Portion" or "Multiple", describe the lack of correspondence between the defined population and the fish for which the hatchery spawners estimate was made. Also state why this scale of data was used to represent the population instead of true population-scale data. (Examples: "Data not available at exact scale of this population."; "Data at this scale best represent the population.")
HatcheryProgramName Hatchery program this record describes. Text 255HatcheryStockName Stock of hatchery fish this record describes. Text 255Hatchery Name of the hatchery or hatchery complex
associated with the time series.Text 255 This may be any of the following:
the name of a hatchery. the name of a hatchery complex. the names of multiple hatcheries if appropriate for the time series. (Providing alphabetically is preferred.)
To allow for easy sorting, it is preferable to use the hatchery name as listed in the StreamNet database at http://q.streamnet.org/Request.cfm?cmd=BuildPicklist&NewQuery=BuildCriteria&PicklistItem=Hatchery.
HatcheryProgramType Purpose of the hatchery program this record represents. is an integrated hatchery / natural production supplementation effort meant to increase the number of natural spawners in the population.
Text 3 Acceptable values: [See notes in HatcherySpawning table above.]
SpawningYear The four-digit year in which spawning of this species (and run where appropriate) began.
Integer In cases where an unusual population is spawned uncharacteristically early (before January 1 for spring spawners) or late (after December 31 for fall spawners) for the species (and perhaps run), assign the year based on the majority of populations of this species/run in order to be consistent for all members of the spawning cohort. For example, most coho spawn in fall but a few populations do not begin spawning until after Jan. 1. The spawning year assigned for these unusual populations would match the other populations that spawned in the fall, even though these particular populations did not begin spawning until after December 31.

Field Name Field Description Data Type Codes/Conventions for PNI TableContactAgency Agency, tribe, or other entity, or person responsible
for these data that is the best contact for questions that may arise about this data record.
Text 255 Entries in this field must precisely match a name in the StreamNet agency list. Here are the ones most likely needed. If yours is not found here, contact your agency StreamNet representative, or call PSMFC's StreamNet staff at 503-595-3100. Columbia River Inter-Tribal Fish Commission Colville Confederated Tribes Confederated Tribes and Bands of the Yakama Indian Nation Confederated Tribes of the Umatilla Indian Reservation Confederated Tribes of the Warm Springs Reservation of Oregon Idaho Department of Fish and Game Nez Perce Tribe of Idaho Oregon Department of Fish and Wildlife Spokane Tribe of Indians Washington Department of Fish and Wildlife
MethodNumber This field represents the method(s) used to calculate the values in the "Indicators" and "Metrics" sections.
This field is used in conjunction with the ContactAgency field. See the Codes/Conventions column for details.
Byte This field, along with the "ContactAgency" field above, identifies which entity calculated the values in the record and which (set of) methods where used to calculate them. These fields allow for multiple entries for the same population and year. Thus, it is possible to share values that are based on different assumptions.
If only one set of methods is used to calculate the values for all years for a population, enter "1" for all records. Even if methods changed, you can enter "1" for all records if there is always only one record per year for a population.
If more than one set of methods is used to calculate final values over a range of years for a population, use this field to indicate which records are meant to go together. For example, if method 1 was used to calculate values for 1960 through 1994, and method 2 was used to calculate values for 1980 through 2013, then there will be more than one record for the years 1980 through 1994. In such cases you would enter "1" for records that result from the 1960-1994 method, and "2" for records that result from the 1980-2013 method. Similarly, if 3 different methods are proposed in an area for the same years, then use "1" and "2" and "3" to indicate which records belong together. This lets a data user know which records belong together.
When more than one record exists for a population X year combination, it is up to biologists using the data to select the value of most use when conducting their day to day business. The ContactAgency and MethodNumber fields allow for this.
Indicators
PNIIJ Proportionate natural influence index, calculated as
pNOB/(pNOB + pHOS)
where:pNOB = proportion of broodstock actually spawned in a hatchery that are natural origin fish.pHOS = proportion of fish spawning naturally that are hatchery origin fish.
Include jacks when calculating this value. (See 'broodstock' in Glossary.)
Single Required if the PNIEJ field is null and NullRecord = "No".This is equation 11 from Appendix A of Hatchery Scientific Review Group. 2009. Columbia River Hatchery Reform System-Wide Report. 278 pp. plus appendices. Available from http://www.hatcheryreform.us.
When calculating PNI, do not weight contribution of jacks according to differential reproductive success in the hatchery or the wild. Rather, weight all fish equally based on numbers that spawned.
Express these values as numbers from zero to one, with three digits to the right of the decimal point.
The only species for which jacks are recognized are Chinook salmon, coho salmon, chum salmon (rarely), and winter steelhead (rarely).
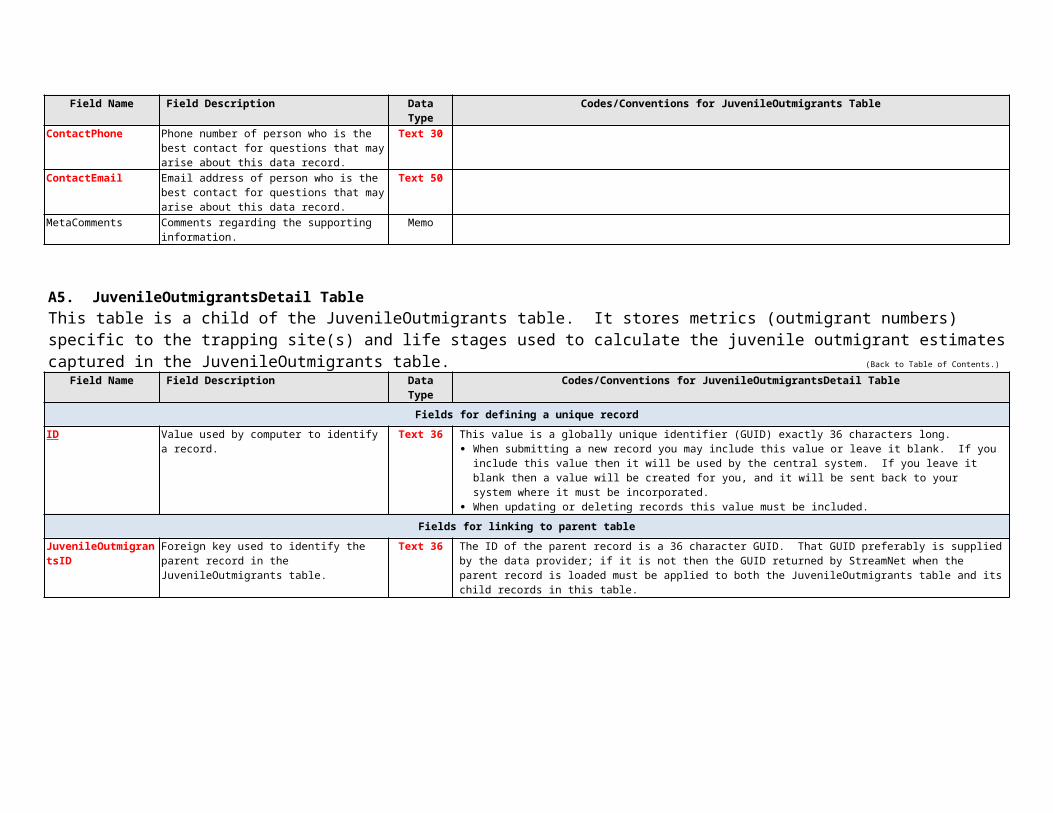
Field Name Field Description Data Type Codes/Conventions for PNI TablePNIEJ Proportionate natural influence index, calculated as
pNOB/(pNOB + pHOS)
where:pNOB = proportion of broodstock actually spawned in a hatchery that are natural origin fish.pHOS = proportion of fish spawning naturally that are hatchery origin fish.
Exclude jacks when calculating this value.
Single Required if the PNIIJ field is null and NullRecord = "No".This is equation 11 from Appendix A of Hatchery Scientific Review Group. 2009. Columbia River Hatchery Reform System-Wide Report. 278 pp. plus appendices. Available from http://www.hatcheryreform.us.
Because jacks are not included in this value, the issue of weighting jack contributions is not applicable to this field.
Express these values as numbers from zero to one, with three digits to the right of the decimal point.
The only species for which jacks are recognized are Chinook salmon, coho salmon, chum salmon (rarely), and winter steelhead (rarely).
Metrics supporting the "Indicators" fields above
HOSIJH The number of hatchery origin fish spawned in the hatchery, including jacks. (This is the same value reported in HOSIJ field of the HatcherySpawning table.)
Single "Hatchery origin" means the fish's parents were spawned in captivity rather than spawning naturally in the wild.
NOSIJH The number of natural origin fish spawned in the hatchery, including jacks. (This is the same value reported in NOSIJ field of the HatcherySpawning table.)
Single This value reflects natural origin fish taken and spawned in the hatchery as part of the year's egg take operations. "Natural origin" means the fish's parents spawned in the wild.
NOSAIJ The point estimate for natural origin spawner abundance, including jacks, spawning in the wild.(This is the same value reported in NOSAIJ field of the NOSA table for the population and year specified for the current record.)
Single Estimated number of natural origin spawners contributing to spawning in the wild in a particular year. “Spawners” includes jacks. "Natural origin" means the fish's parents spawned in the wild. The statistical approach used to generate the estimate should be thoroughly explained in the methods referenced in the MethodDocumentation field.
HOSAIJ The point estimate for hatchery origin spawner abundance, including jacks, spawning in the wild.
Single Estimated number of hatchery origin spawners contributing to spawning in the wild in a particular year. “Spawners” includes jacks. "Hatchery origin" means the fish's parents were spawned in captivity. The statistical approach used to generate the estimate should be thoroughly explained in the methods referenced in the MethodDocumentation field.
HOSEJH The number of hatchery origin fish spawned in the hatchery, excluding jacks. (This is the same value reported in HOSEJ field of the HatcherySpawning table.)
Single "Hatchery origin" means the fish's parents were spawned in captivity rather than spawning naturally in the wild.
NOSEJH The number of natural origin fish spawned in the hatchery, excluding jacks. (This is the same value reported in NOSEJ field of the HatcherySpawning table.)
Single This value reflects natural origin fish taken and spawned in the hatchery as part of the year's egg take operations. "Natural origin" means the fish's parents spawned in the wild.
NOSAEJ The point estimate for natural origin spawner abundance, excluding jacks, spawning in the wild.(This is the same value reported in NOSAIJ field of the NOSA table for the population and year specified for the current record.)
Single Estimated number of natural origin spawners contributing to spawning in the wild in a particular year. “Spawners” does not include jacks. "Natural origin" means the fish's parents spawned in the wild. The statistical approach used to generate the estimate should be thoroughly explained in the methods referenced in the MethodDocumentation field.
HOSAEJ The point estimate for hatchery origin spawner abundance, excluding jacks, spawning in the wild.
Single Estimated number of hatchery origin spawners contributing to spawning in the wild in a particular year. “Spawners” does not include jacks. "Hatchery origin" means the fish's parents were spawned in captivity. The statistical approach used to generate the estimate should be thoroughly explained in the methods referenced in the MethodDocumentation field.
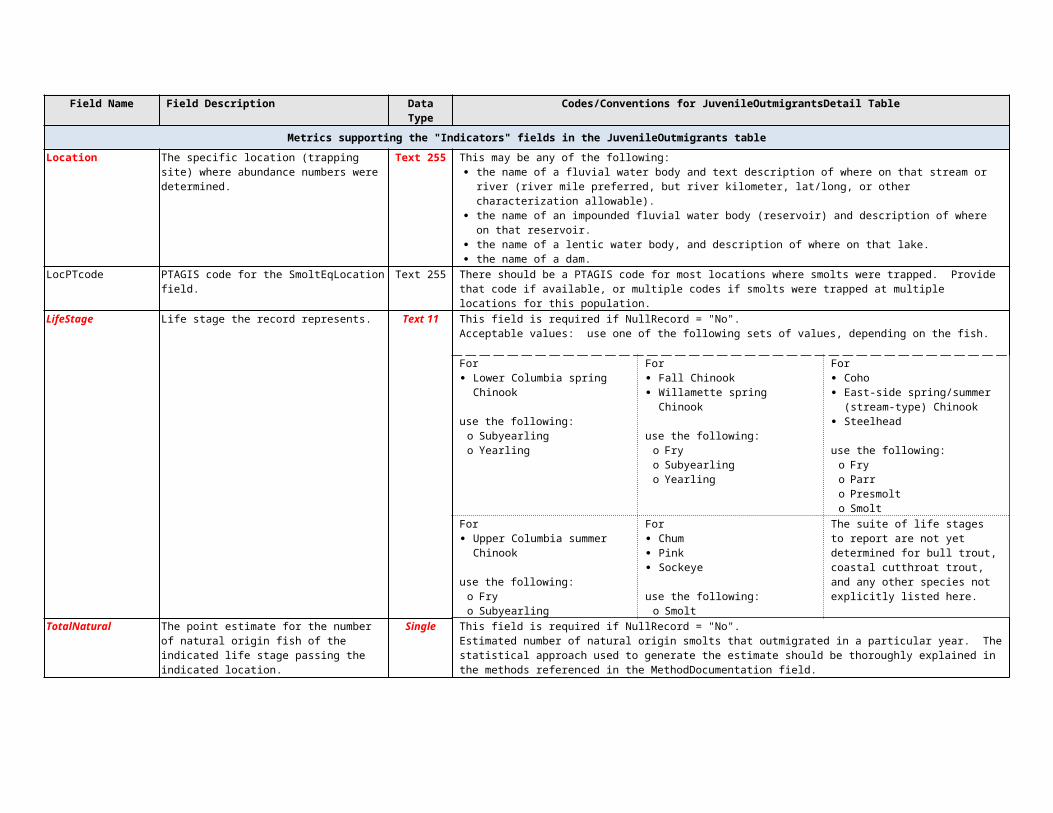
Field Name Field Description Data Type Codes/Conventions for PNI Table
Protocol and method documentation
ProtMethName The name(s) of all protocols and associated data collection and data analysis methods used to calculate the indicator estimate.
Memo Provide title of protocol and name(s) of relevant methods used.
Documentation should include the study design (including spatial, temporal, response and inference designs), annual implementation notes on variations from routine step by step procedures or design criteria, also known as survey design, description of field methodology and analytical approach.
ProtMethURL URL(s) for published protocols and methods describing the methodology and documenting the derivation of the indicator. If published in MonitoringMethods.org, this link will provide access to study design information and all methods associated with the protocol.
Memo Required if ProtMethDocumentation is null.Provide URL(s) to source documentation of methodology. For MonitoringMethods.org provide link to the protocol. Methods documentation should include survey design, description of field methodology and analytical approach. URL links may be to online methods documentation resources like MonitoringMethods.org, other online resources, or online literature.
If methodology is unchanged from a previous year, use the previous link references. If methodology changed for this estimate, provide a new link.
ProtMethDocumentation Citation or documentation that describes the protocol and/or method(s) listed in the ProtMethName field. Include references not documented in MonitoringMethods.org, such as reports, journal articles or other publications that describe the survey design, field methodology and analytical approach used to derive the indicator estimate.
Memo Required if ProtMethURL is null.Provide a citation(s) to documentation of the methodology used. This may be in the form of reports, journal articles, or other publications that describe the study design (including spatial, temporal, response and inference designs), variations from routine step by step procedures or design criteria, description of field methodology and analytical approach. If the methodology is not yet published, either insert here, or describe in a separate document and make it available online (provide the URL). Leave this field blank if methodology is described in MonitoringMethods.org.
Note: If there is no link to a cited document online, provide a copy of the document to the StreamNet Library (streamnetlibrary.org). The library will scan the document and provide a URL. Post the URL in the ProtMethURL field.
If methodology is unchanged from a previous year, use the previous link or reference citation. If methodology changed, provide a new link or reference citation.
MethodAdjustments Minor adjustments to a method in a given year that are not described in the method citations above but are important.
Memo Give a brief description of changes or adjustments to a standard method if they are NOT described in the methods documentation already provided. If multiple documentation sources are cited, be sure to indicate which method from which document was adjusted.
In MonitoringMethods.org, documentation of changes or adjustments to methods or protocols can be described in the Implementation Notes section of each published method or protocol.
Comments about the data
Comments Any issues, problems, questions about this indicator that were not already captured in other places.
Memo Required if NullRecord = "Yes".
Supporting information
NullRecord In some years data may not be collected and so a value cannot be calculated. For example, high muddy water or wildfires can prevent redd counts. This field is used to indicate that a record does not exist because the data do not exist to calculate it.
Text 3 Normally "No".A value of "Yes" in this field is a positive statement that the data do not exist to calculate the indicator for the population and time period specified.
The value of including this field is so that missing data are explicitly accounted for rather than being a perpetually open question that is repeatedly researched. Explain in the Comments field why the data do not exist.
DataStatus Status of the data in the current record. Text 255 Acceptable values: [Do not include comments in brackets.] Draft [Values in this record are preliminary and have not been thoroughly reviewed.] Reviewed [Values in this record have been reviewed but are not yet approved as "final".] Final [Values in this record have been thoroughly reviewed and are considered "final".]
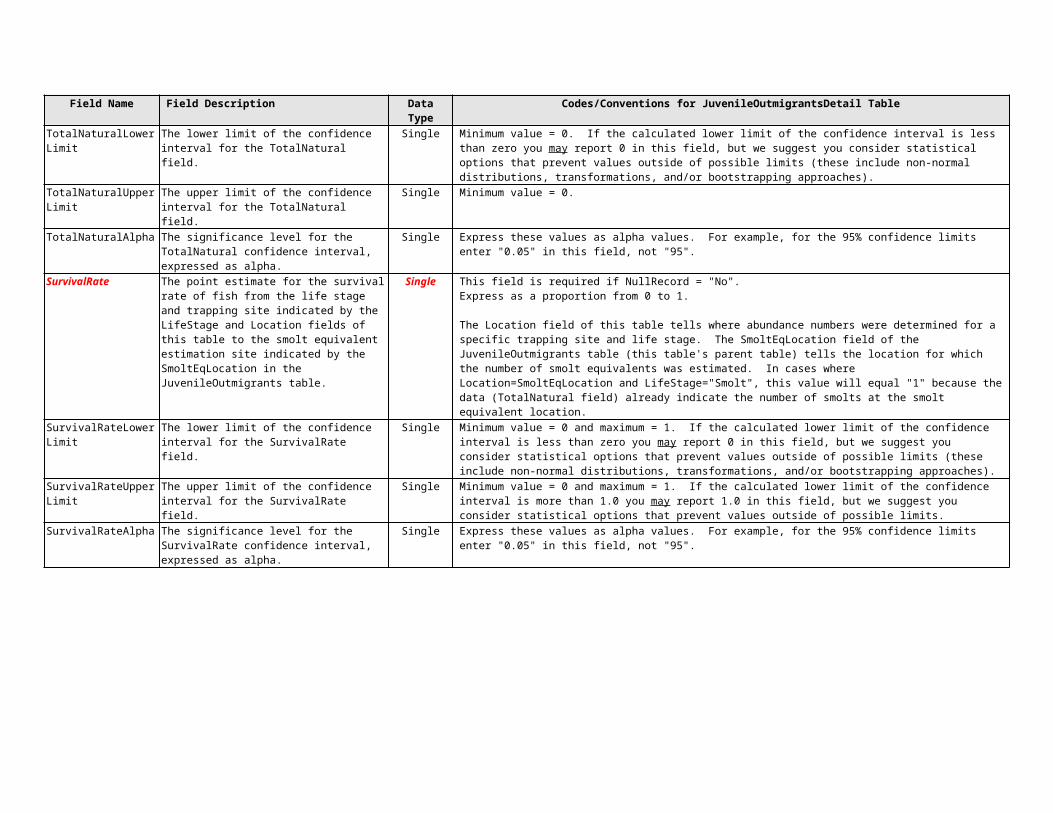
Field Name Field Description Data Type Codes/Conventions for PNI TableLastUpdated Date (and time if desired) the information in this
record was last updated.Date/Time If an exact date is not known, give an estimate.
IndicatorLocation Where this indicator is maintained at the source. Memo If online, provide URL(s).MetricLocation Where the supporting metrics are maintained at the
source.Memo If online, provide URL(s).
MeasureLocation Where the measurements are maintained that were used for these calculations.
Memo If online, provide URL(s).
ContactPersonFirst First name of person who is the best contact for questions that may arise about this data record.
Text 30
ContactPersonLast Last name of person who is the best contact for questions that may arise about this data record.
Text 30
ContactPhone Phone number of person who is the best contact for questions that may arise about this data record.
Text 30
ContactEmail Email address of person who is the best contact for questions that may arise about this data record.
Text 50
MetaComments Comments regarding the supporting information. MemoFields needed by people programming the Exchange Network
If you are a programmer or database manager, refer to Appendix A for additional fields that are part of this table but are not listed here.
B3. EggToRelease TableThis table stores information concerning egg to release survival rates for hatchery fish. Egg to release survival rates are specific to a production group, as well as to the specific egg stage and release stage being described in each record of data. (Back to Table of Contents.)
Field Name Field Description Data Type Codes/Conventions for EggToRelease TableFields for defining a unique record
ID(unique)
Value used by computer to identify a record. Text 36 This value is a globally unique identifier (GUID) exactly 36 characters long. When submitting a new record you may include this value or leave it blank. If you include this value then it will be used by
the central system. If you leave it blank then a value will be created for you, and it will be sent back to your system where it must be incorporated.
When updating or deleting records this value must be included.CommonName Common name of the taxon of fish. Text 50 Enter the name of the taxon here, even if taxon name is included in the name of the population. Select from the following:
Bull trout Chinook salmon Chum salmon Coho salmon Sockeye salmon Steelhead
Additional species may be added in the future: refer to http://old.streamnet.org/SpeciesInFW.html for common names.

Field Name Field Description Data Type Codes/Conventions for EggToRelease TableRun Run of fish. Text 20 Enter the name of the run here, even if run name is included in the name of the population. Entries in this field are not
recognized as taxonomic divisions. Select from the following: [Do not include comments in brackets.] Spring Summer Fall Winter Spring/summer Both summer & winter N/A [For species without recognized runs. For example, bull trout.]
ESU_DPS For populations listed under the federal ESA, this is the name of a defined Evolutionarily Significant Unit (ESU) or Distinct Population Segment (DPS) as defined by NMFS Northwest Region or by USFWS in which the population falls geographically. For non-listed populations this is the DPS or other name.
Text 255 Enter the name of the ESU or DPS here. Entries in this field are taxonomic divisions defined by NMFS or USFWS, and may be at the species, subspecies, or finer scale. ESUs of salmon north of California are listed athttp://www.nwfsc.noaa.gov/trt/.
RecoveryDomain Name of the "recovery domain," as defined by the NMFS Northwest Region, in which the population falls geographically.
Text 255 Five recovery domains have been defined by NMFS in Washington, Oregon, and Idaho. Select the appropriate one from this list: Puget Sound Recovery Domain Willamette/Lower Columbia Recovery Domain Interior Columbia Recovery Domain Oregon Coast Recovery Domain Southern Oregon/Northern California Coast Recovery Domain
Further information about recovery domains can be found at http://www.nwfsc.noaa.gov/trt/.MajorPopGroup Name of "major population group" (MPG) or
“stratum” as defined by the NMFS Northwest Region, in which the population falls geographically.
Text 255 The term "stratum" is used in the Willamette/Lower Columbia Recovery Domain, while "major population group" is used in other areas. The term "stratum" includes life history considerations as well as geographic criteria, while MPGs are defined geographically. See Appendix C for the list of MPGs / strata.
PopID Code for the population(s) of fish represented by this record.
Integer See Appendix C for the list of PopID codes for populations as defined by NMFS Northwest Region for ESA. The populations are defined by NMFS Northwest Region; the codes for these populations are created by StreamNet to reference those NMFS populations. See Appendix E if you need a PopID for a population that does not yet have one assigned.
ESAlisted Flag indicating whether the hatchery fish are part of the ESU or DPS in which it falls geographically.
Text 3 Acceptable values: Yes No
If you are unsure about a particular hatchery stock's inclusion in an ESU/DPS, information can be found athttps://www.federalregister.gov/articles/2014/04/14/2014-08347/endangered-and-threatened-wildlife-final-rule-to-revise-the-code-of-federal-regulations-for-species.
CBFWApopName Population name as defined by CBFWA for subbasin planning purposes, from subbasin plans and agencies.
Text 255 This may include non-listed populations, or cases where geographic area does not match a defined population of a listed species. See Appendix D for the list of these population names.
Fill this field even when a population's geographic extent coincides with NWR name for a listed population.CommonPopName Population name used by local biologists. Text 255 Often this is simply the name of the population(s) as written on the original time series spreadsheets.PopFit Categorization of how well the geographic extent of
the ETR estimate corresponds to the geographic definition of the population.
Text 8 This field is required if NullRecord = "No".Acceptable values: [Do not include comments in brackets.] Same [Estimate represents one entire population, the whole population, and nothing but the population.] Portion [Estimate represents a portion of one population. (Describe in PopFitNotes field.)] Multiple [Estimate is from more than one population. (Describe in PopFitNotes field.)]

Field Name Field Description Data Type Codes/Conventions for EggToRelease TablePopFitNotes Text description of how well the hatchery origin
ETR value corresponds to the defined population, and why the data are not at the scale of a single population.
Memo This field is required if the PopFit field is "Portion" or "Multiple".If the PopFit field is "Portion" or "Multiple", describe the lack of correspondence between the defined population and the fish for which the ETR estimate was made. Also state why this scale of data was used to represent the population instead of true population-scale data. (Examples: "Data not available at exact scale of this population."; "Data at this scale best represent the population.")
HatcheryProgramName Hatchery program this record describes. Text 255HatcheryStockName Stock of hatchery fish this record describes. Text 255Hatchery Name of the hatchery or hatchery complex
associated with the time series.Text 255 This may be any of the following:
the name of a hatchery. the name of a hatchery complex. the names of multiple hatcheries if appropriate for the time series. (Providing alphabetically is preferred.)
To allow for easy sorting, it is preferable to use the hatchery name as listed in the StreamNet database at http://q.streamnet.org/Request.cfm?cmd=BuildPicklist&NewQuery=BuildCriteria&PicklistItem=Hatchery.
SpawningYear The four-digit year in which spawning of this species (and run where appropriate) began.
Integer In cases where an unusual population is spawned uncharacteristically early (before January 1 for spring spawners) or late (after December 31 for fall spawners) for the species (and perhaps run), assign the year based on the majority of populations of this species/run in order to be consistent for all members of the spawning cohort. For example, most coho spawn in fall but a few populations do not begin spawning until after Jan. 1. The spawning year assigned for these unusual populations would match the other populations that spawned in the fall, even though these particular populations did not begin spawning until after December 31.
EggStage Life stage at which the number of eggs was determined.
[The number of eggs is shown in the "Eggs" field.]
Text 30 Acceptable values: Unfertilized eggs Fertilized eggs before eye-up Eyed eggs
ReleaseStage Life stage at which the eggs or fish were released into the wild.
Text 15 This value must be a whole number. Acceptable values: [Do not include comments in brackets.] Egg [Unhatched eggs.] Unfed fry [Hatched juvenile fish that have not yet been fed in the hatchery.] Juvenile [For the purposes of this table, these are fish no longer "unfed fry", but not yet smolts.] Age 0 smolt [Fish that smolt in the same year the eggs hatched.] Age 1+ smolt [Fish that smolt at age 1 or older. That is, they smolt in a year other than when the eggs hatch.]
ContactAgency Agency, tribe, or other entity, or person responsible for these data that is the best contact for questions that may arise about this data record.
Text 255 Entries in this field must precisely match a name in the StreamNet agency list. Here are the ones most likely needed. If yours is not found here, contact your agency StreamNet representative, or call PSMFC's StreamNet staff at 503-595-3100. Columbia River Inter-Tribal Fish Commission Colville Confederated Tribes Confederated Tribes and Bands of the Yakama Indian Nation Confederated Tribes of the Umatilla Indian Reservation Confederated Tribes of the Warm Springs Reservation of Oregon Idaho Department of Fish and Game Nez Perce Tribe of Idaho Oregon Department of Fish and Wildlife Spokane Tribe of Indians Washington Department of Fish and Wildlife
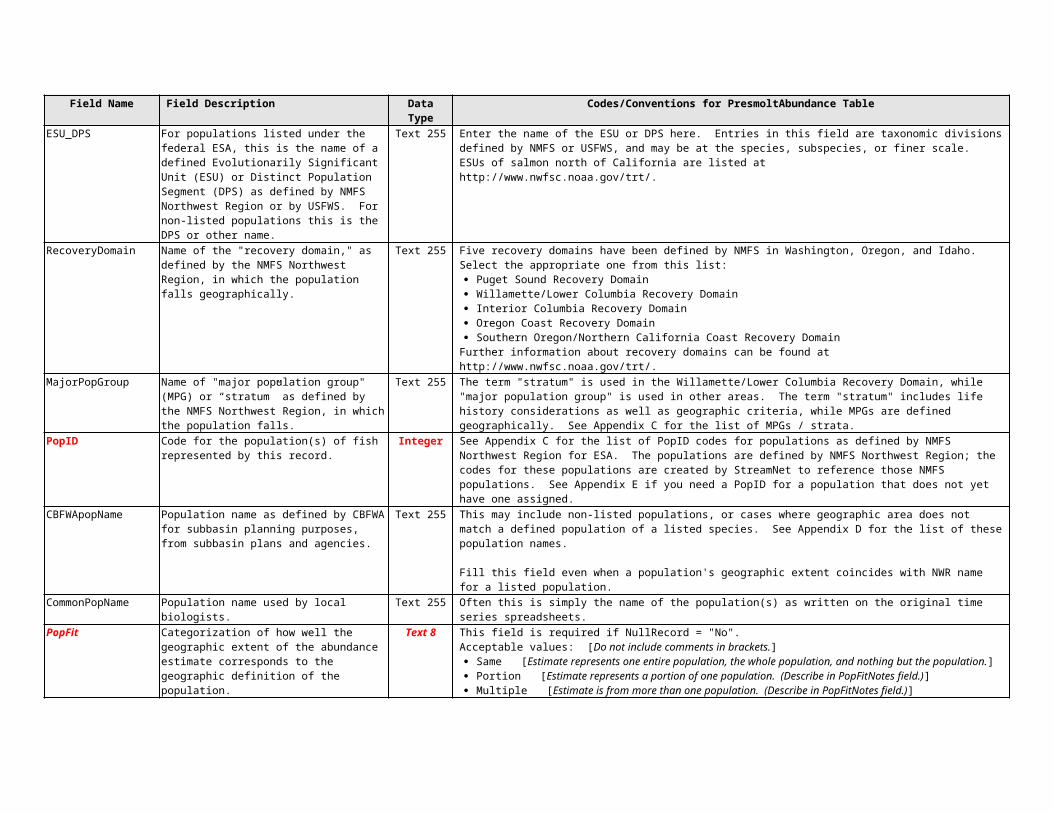
Field Name Field Description Data Type Codes/Conventions for EggToRelease TableMethodNumber This field represents the method(s) used to calculate
the values in the "Indicators" and "Metrics" sections.
This field is used in conjunction with the ContactAgency field. See the Codes/Conventions column for details.
Byte This field, along with the "ContactAgency" field above, identifies which entity calculated the values in the record and which (set of) methods where used to calculate them. These fields allow for multiple entries for the same population and year. Thus, it is possible to share values that are based on different assumptions.
If only one set of methods is used to calculate the values for all years for a population, enter "1" for all records. Even if methods changed, you can enter "1" for all records if there is always only one record per year for a population.
If more than one set of methods is used to calculate final values over a range of years for a population, use this field to indicate which records are meant to go together. For example, if method 1 was used to calculate values for 1960 through 1994, and method 2 was used to calculate values for 1980 through 2013, then there will be more than one record for the years 1980 through 1994. In such cases you would enter "1" for records that result from the 1960-1994 method, and "2" for records that result from the 1980-2013 method. Similarly, if 3 different methods are proposed in an area for the same years, then use "1" and "2" and "3" to indicate which records belong together. This lets a data user know which records belong together.
When more than one record exists for a population X year combination, it is up to biologists using the data to select the value of most use when conducting their day to day business. The ContactAgency and MethodNumber fields allow for this.
Indicators
ETR The point estimate for egg-to-release survival rate, calculated as 100 X the point estimate of the number of released fish, divided by the point estimate of the number of eggs that produced those released fish.
Single Required if NullRecord = "No".Express these values as percentages (numbers from zero to one hundred), without a percent sign, with one digit to the right of the decimal point. Example: 0.923 = 92.3.
This field holds a numeric value only -- the percent sign is implied but not included.ETRLowerLimit The lower limit of the confidence interval for the
ETR field.Single This field holds a numeric value only -- the percent sign is implied but not included.
Minimum value = 0 and maximum = 100. If the calculated lower limit of the confidence interval is less than zero you may report 0 in this field, but we suggest you consider statistical options that prevent values outside of possible limits (these include non-normal distributions, transformations, and/or bootstrapping approaches).
ETRUpperLimit The upper limit of the confidence interval for the ETR field.
Single This field holds a numeric value only -- the percent sign is implied but not included.
Minimum value = 0 and maximum = 100. If the calculated lower limit of the confidence interval is more than 100 you may report 100 in this field, but we suggest you consider statistical options that prevent values outside of possible limits.
ETRAlpha The significance level for the ETR confidence interval, expressed as alpha.
Single Express these values as alpha values. For example, for the 95% confidence limits enter "0.05" in this field, not "95".
Metrics supporting the "Indicators" fields above
Eggs The point estimate for the number of eggs that produced the released fish. Do not include culled eggs in the egg count used to calculate this egg-to-release survival rate.
Long int This value must be a whole number.
EggsLowerLimit The lower limit of the confidence interval for the Eggs field.
Long int This value must be a whole number.
Minimum value = 0. If the calculated lower limit of the confidence interval is less than zero you may report 0 in this field, but we suggest you consider statistical options that prevent values outside of possible limits (these include non-normal distributions, transformations, and/or bootstrapping approaches).
EggsUpperLimit The upper limit of the confidence interval for the Eggs field.
Long int This value must be a whole number.
Minimum value = 0.
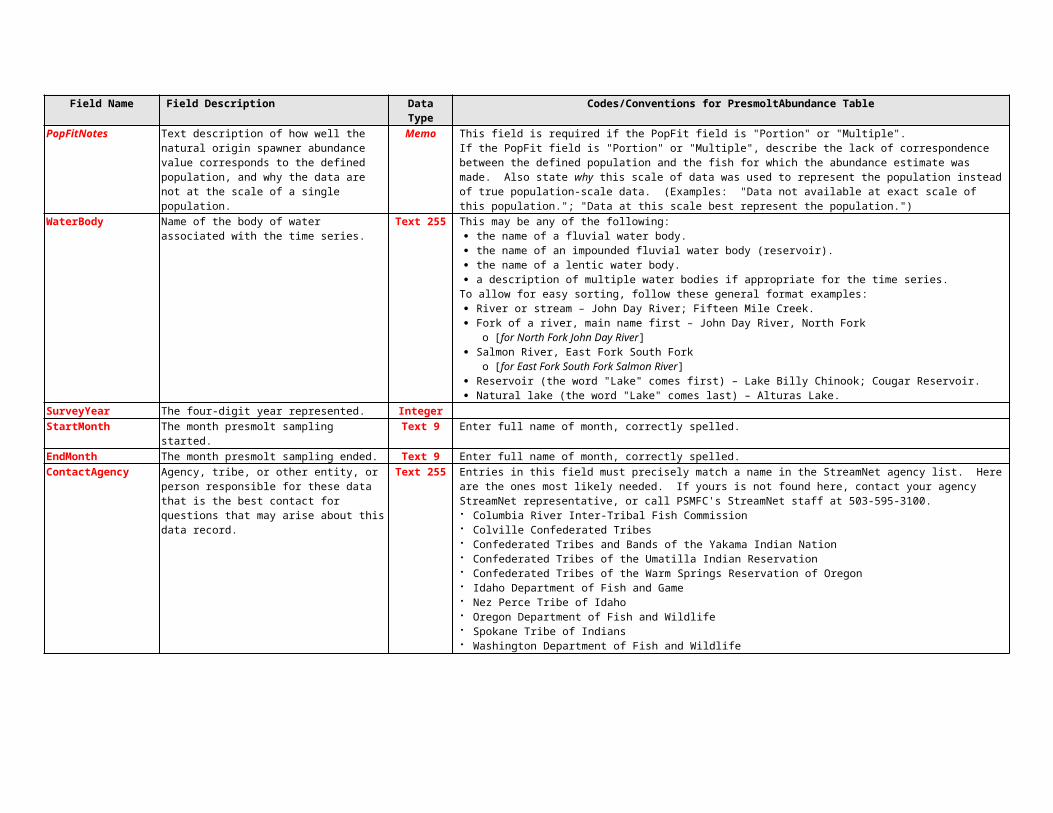
Field Name Field Description Data Type Codes/Conventions for EggToRelease TableEggsAlpha The significance level for the Eggs confidence
interval, expressed as alpha.Single Express these values as alpha values. For example, for the 95% confidence limits enter "0.05" in this field, not "95".
Released The point estimate for the number of eggs planted or fish released.
Long int This value must be a whole number.
ReleasedLowerLimit The lower limit of the confidence interval for the Released field.
Long int This value must be a whole number.
Minimum value = 0. If the calculated lower limit of the confidence interval is less than zero you may report 0 in this field, but we suggest you consider statistical options that prevent values outside of possible limits (these include non-normal distributions, transformations, and/or bootstrapping approaches).
ReleasedUpperLimit The upper limit of the confidence interval for the Released field.
Long int This value must be a whole number.
Minimum value = 0.ReleasedAlpha The significance level for the Released confidence
interval, expressed as alpha.Single Express these values as alpha values. For example, for the 95% confidence limits enter "0.05" in this field, not "95".
Protocol and method documentation
ProtMethName The name(s) of all protocols and associated data collection and data analysis methods used to calculate the indicator estimate.
Memo Provide title of protocol and name(s) of relevant methods used.
Documentation should include the study design (including spatial, temporal, response and inference designs), annual implementation notes on variations from routine step by step procedures or design criteria, also known as survey design, description of field methodology and analytical approach.
ProtMethURL URL(s) for published protocols and methods describing the methodology and documenting the derivation of the indicator. If published in MonitoringMethods.org, this link will provide access to study design information and all methods associated with the protocol.
Memo Required if ProtMethDocumentation is null.Provide URL(s) to source documentation of methodology. For MonitoringMethods.org provide link to the protocol. Methods documentation should include survey design, description of field methodology and analytical approach. URL links may be to online methods documentation resources like MonitoringMethods.org, other online resources, or online literature.
If methodology is unchanged from a previous year, use the previous link references. If methodology changed for this estimate, provide a new link.
ProtMethDocumentation
Citation or documentation that describes the protocol and/or method(s) listed in the ProtMethName field. Include references not documented in MonitoringMethods.org, such as reports, journal articles or other publications that describe the survey design, field methodology and analytical approach used to derive the indicator estimate.
Memo Required if ProtMethURL is null.Provide a citation(s) to documentation of the methodology used. This may be in the form of reports, journal articles, or other publications that describe the study design (including spatial, temporal, response and inference designs), variations from routine step by step procedures or design criteria, description of field methodology and analytical approach. If the methodology is not yet published, either insert here, or describe in a separate document and make it available online (provide the URL). Leave this field blank if methodology is described in MonitoringMethods.org.
Note: If there is no link to a cited document online, provide a copy of the document to the StreamNet Library (streamnetlibrary.org). The library will scan the document and provide a URL. Post the URL in the ProtMethURL field.
If methodology is unchanged from a previous year, use the previous link or reference citation. If methodology changed, provide a new link or reference citation.
MethodAdjustments Minor adjustments to a method in a given year that are not described in the method citations above but are important.
Memo Give a brief description of changes or adjustments to a standard method if they are NOT described in the methods documentation already provided. If multiple documentation sources are cited, be sure to indicate which method from which document was adjusted.
In MonitoringMethods.org, documentation of changes or adjustments to methods or protocols can be described in the Implementation Notes section of each published method or protocol.

Field Name Field Description Data Type Codes/Conventions for EggToRelease Table
Comments about the data
Comments Any issues, problems, questions about this indicator that were not already captured in other places.
Memo Required if NullRecord = "Yes".
Supporting information
NullRecord In some years data may not be collected and so a value cannot be calculated. For example, high muddy water or wildfires can prevent redd counts. This field is used to indicate that a record does not exist because the data do not exist to calculate it.
Text 3 Normally "No".A value of "Yes" in this field is a positive statement that the data do not exist to calculate the indicator for the population and time period specified.
The value of including this field is so that missing data are explicitly accounted for rather than being a perpetually open question that is repeatedly researched. Explain in the Comments field why the data do not exist.
DataStatus Status of the data in the current record. Text 255 Acceptable values: [Do not include comments in brackets.] Draft [Values in this record are preliminary and have not been thoroughly reviewed.] Reviewed [Values in this record have been reviewed but are not yet approved as "final".] Final [Values in this record have been thoroughly reviewed and are considered "final".]
LastUpdated Date (and time if desired) the information in this record was last updated.
Date/Time If an exact date is not known, give an estimate.
IndicatorLocation Where this indicator is maintained at the source. Memo If online, provide URL(s).MetricLocation Where the supporting metrics are maintained at the
source.Memo If online, provide URL(s).
MeasureLocation Where the measurements are maintained that were used for these calculations.
Memo If online, provide URL(s).
ContactPersonFirst First name of person who is the best contact for questions that may arise about this data record.
Text 30
ContactPersonLast Last name of person who is the best contact for questions that may arise about this data record.
Text 30
ContactPhone Phone number of person who is the best contact for questions that may arise about this data record.
Text 30
ContactEmail Email address of person who is the best contact for questions that may arise about this data record.
Text 50
MetaComments Comments regarding the supporting information. MemoFields needed by people programming the Exchange Network
If you are a programmer or database manager, refer to Appendix A for additional fields that are part of this table but are not listed here.

B4. SAR_Hatchery TableThis table stores information concerning smolt to adult ratios (SAR). Smolt to adult ratios are specific to the smolt and adult locations described in each row of data. Adult returns include all fish that reach the location where adults are counted, regardless of their disposition after that point: strays, harvested fish, and fish with other dispositions are included as long as they reached the adult counting location. (Back to Table of Contents.)
Field Name Field Description Data Type Codes/Conventions for SAR_Hatchery TableFields for defining a unique record
ID(unique)
Value used by computer to identify a record. Text 36 This value is a globally unique identifier (GUID) exactly 36 characters long. When submitting a new record you may include this value or leave it blank. If you include this value then it will be used by
the central system. If you leave it blank then a value will be created for you, and it will be sent back to your system where it must be incorporated.
When updating or deleting records this value must be included.CommonName Common name of the taxon of fish. Text 50 Enter the name of the taxon here, even if taxon name is included in the name of the population. Select from the following:
Bull trout Chinook salmon Chum salmon Coho salmon Sockeye salmon Steelhead
Additional species may be added in the future: refer to http://old.streamnet.org/SpeciesInFW.html for common names.Run Run of fish. Text 20 Enter the name of the run here, even if run name is included in the name of the population. Entries in this field are not
recognized as taxonomic divisions. Select from the following: [Do not include comments in brackets.] Spring Summer Fall Winter Spring/summer Both summer & winter N/A [For species without recognized runs. For example, bull trout.]
ESU_DPS For populations listed under the federal ESA, this is the name of a defined Evolutionarily Significant Unit (ESU) or Distinct Population Segment (DPS) as defined by NMFS Northwest Region or by USFWS in which the population falls geographically. For non-listed populations this is the DPS or other name.
Text 255 Enter the name of the ESU or DPS here. Entries in this field are taxonomic divisions defined by NMFS or USFWS, and may be at the species, subspecies, or finer scale. ESUs of salmon north of California are listed athttp://www.nwfsc.noaa.gov/trt/.
RecoveryDomain Name of the "recovery domain," as defined by the NMFS Northwest Region, in which the population falls geographically.
Text 255 Five recovery domains have been defined by NMFS in Washington, Oregon, and Idaho. Select the appropriate one from this list: Puget Sound Recovery Domain Willamette/Lower Columbia Recovery Domain Interior Columbia Recovery Domain Oregon Coast Recovery Domain Southern Oregon/Northern California Coast Recovery Domain
Further information about recovery domains can be found at http://www.nwfsc.noaa.gov/trt/.MajorPopGroup Name of "major population group" (MPG) or
“stratum” as defined by the NMFS Northwest Region, in which the population falls geographically.
Text 255 The term "stratum" is used in the Willamette/Lower Columbia Recovery Domain, while "major population group" is used in other areas. The term "stratum" includes life history considerations as well as geographic criteria, while MPGs are defined geographically. See Appendix C for the list of MPGs / strata.

Field Name Field Description Data Type Codes/Conventions for SAR_Hatchery TablePopID Code for the population(s) of fish represented by this
record.Integer See Appendix C for the list of PopID codes for populations as defined by NMFS Northwest Region for ESA. The populations
are defined by NMFS Northwest Region; the codes for these populations are created by StreamNet to reference those NMFS populations. See Appendix E if you need a PopID for a population that does not yet have one assigned.
ESAlisted Flag indicating whether the hatchery fish are part of the ESU or DPS in which it falls geographically.
Text 3 Acceptable values: Yes No
If you are unsure about a particular hatchery stock's inclusion in an ESU/DPS, information can be found athttps://www.federalregister.gov/articles/2014/04/14/2014-08347/endangered-and-threatened-wildlife-final-rule-to-revise-the-code-of-federal-regulations-for-species.
CBFWApopName Population name as defined by CBFWA for subbasin planning purposes, from subbasin plans and agencies.
Text 255 This may include non-listed populations, or cases where geographic area does not match a defined population of a listed species. See Appendix D for the list of these population names.
Fill this field even when a population's geographic extent coincides with NWR name for a listed population.CommonPopName Population name used by local biologists. Text 255 Often this is simply the name of the population(s) as written on the original time series spreadsheets.PopFit Categorization of how well the geographic extent of
the hatchery origin SAR estimate corresponds to the geographic definition of the population.
Text 8 This field is required if NullRecord = "No".Acceptable values: [Do not include comments in brackets.] Same [Estimate represents one entire population, the whole population, and nothing but the population.] Portion [Estimate represents a portion of one population. (Describe in PopFitNotes field.)] Multiple [Estimate is from more than one population. (Describe in PopFitNotes field.)]
PopFitNotes Text description of how well the hatchery origin SAR value corresponds to the defined population, and why the data are not at the scale of a single population.
Memo This field is required if the PopFit field is "Portion" or "Multiple".If the PopFit field is "Portion" or "Multiple", describe the lack of correspondence between the defined population and the fish for which the hatchery spawners estimate was made. Also state why this scale of data was used to represent the population instead of true population-scale data. (Examples: "Data not available at exact scale of this population."; "Data at this scale best represent the population.")
HatcheryProgramName Hatchery program this record describes. Text 255HatcheryStockName Stock of hatchery fish this record describes. Text 255Hatchery Name of the hatchery or hatchery complex
associated with the time series.Text 255 This may be any of the following:
the name of a hatchery. the name of a hatchery complex. the names of multiple hatcheries if appropriate for the time series. (Providing alphabetically is preferred.)
To allow for easy sorting, it is preferable to use the hatchery name as listed in the StreamNet database at http://q.streamnet.org/Request.cfm?cmd=BuildPicklist&NewQuery=BuildCriteria&PicklistItem=Hatchery.
SmoltLocation The specific location(s) for where the fish were released or the abundance was determined.
Text 255 This may be any of the following: the name of a hatchery facility the name of a fluvial water body and text description of where on that stream or river (river mile preferred, but river
kilometer, lat/long, or other characterization allowable). the name of an impounded fluvial water body (reservoir) and description of where on that reservoir. the name of a lentic water body, and description of where on that lake. a description of multiple water bodies if appropriate for the time series, with descriptions of specific locations. the name of a dam.
SmoltLocPTcode PTAGIS code for the location where fish were enumerated.
Text 255 There should be a PTAGIS code for most locations where smolts were enumerated. Provide that code, or multiple codes if smolts were enumerated at multiple locations for this population.

Field Name Field Description Data Type Codes/Conventions for SAR_Hatchery TableAdultLocation The specific location(s) for where the adult
abundance numbers were determined.Text 255 This may be any of the following:
the name of a fluvial water body, with specific location described (river mile preferred, but river kilometer, lat/long, or other characterization allowable).
the name of an impounded fluvial water body (reservoir), with specific location described the name of a lentic water body, with specific location described a description of multiple water bodies if appropriate for the time series. the name of a dam.
AdultLocPTcode PTAGIS code for the location where adults were counted.
Text 255 Follow directions shown in the SmoltLocPTcode field above.
SARtype Type of SAR. See Codes/Conventions column for details.
Text 255 This field is used to describe the category of SAR for the current record, in terms of where the smolt and adult numbers were determined that went into the SAR. Current list of acceptable values are shown below. If you have a need for other types, contact the Coordinated Assessment group to define the new type. Release site to release site Release site to dam Named dam to named dam Named dam to release site
The values in the "SmoltLocation" and "AdultLocation" fields should match the categorization in this field.OutmigrationYear The four-digit year for which this SAR is calculated,
defined as the year the group migrated to sea.Integer Year in which the fish migrated to the ocean. This is often not the same as brood year.
ContactAgency Agency, tribe, or other entity, or person responsible for these data that is the best contact for questions that may arise about this data record.
Text 255 Entries in this field must precisely match a name in the StreamNet agency list. Here are the ones most likely needed. If yours is not found here, contact your agency StreamNet representative, or call PSMFC's StreamNet staff at 503-595-3100. Columbia River Inter-Tribal Fish Commission Colville Confederated Tribes Confederated Tribes and Bands of the Yakama Indian Nation Confederated Tribes of the Umatilla Indian Reservation Confederated Tribes of the Warm Springs Reservation of Oregon Idaho Department of Fish and Game Nez Perce Tribe of Idaho Oregon Department of Fish and Wildlife Spokane Tribe of Indians Washington Department of Fish and Wildlife
MethodNumber This field represents the method(s) used to calculate the values in the "Indicators" and "Metrics" sections.
This field is used in conjunction with the ContactAgency field. See the Codes/Conventions column for details.
Byte This field, along with the "ContactAgency" field above, identifies which entity calculated the values in the record and which (set of) methods where used to calculate them. These fields allow for multiple entries for the same population and year. Thus, it is possible to share values that are based on different assumptions.
If only one set of methods is used to calculate the values for all years for a population, enter "1" for all records. Even if methods changed, you can enter "1" for all records if there is always only one record per year for a population.
If more than one set of methods is used to calculate final values over a range of years for a population, use this field to indicate which records are meant to go together. For example, if method 1 was used to calculate values for 1960 through 1994, and method 2 was used to calculate values for 1980 through 2013, then there will be more than one record for the years 1980 through 1994. In such cases you would enter "1" for records that result from the 1960-1994 method, and "2" for records that result from the 1980-2013 method. Similarly, if 3 different methods are proposed in an area for the same years, then use "1" and "2" and "3" to indicate which records belong together. This lets a data user know which records belong together.
When more than one record exists for a population X year combination, it is up to biologists using the data to select the value of most use when conducting their day to day business. The ContactAgency and MethodNumber fields allow for this.

Field Name Field Description Data Type Codes/Conventions for SAR_Hatchery Table
Indicators
SAR The point estimate for smolt-to-adult ratio, calculated as 100 X the point estimate of the number of returning hatchery origin adults, divided by the point estimate of the number of smolts that produced those returning adults.
Single Required if NullRecord = "No".Express these values as percentages (numbers from zero to one hundred), with one digit to the right of the decimal point. Examples: .024 = 2.4, .001 = 0.1.
This field holds a numeric value only -- the percent sign is implied but not included.
Do NOT include repeat spawners in the number of adult returns. (A fish only returns once from smolting; subsequent returns are not appropriate for inclusion in smolt-to-adult estimates because they head to sea as adults on subsequent trips and thus are not exposed to the same suite of mortality factors.)
SARLowerLimit The lower limit of the confidence interval for the SAR field.
Single This field holds a numeric value only -- the percent sign is implied but not included.
Minimum value = 0 and maximum = 100. If the calculated lower limit of the confidence interval is less than zero you may report 0 in this field, but we suggest you consider statistical options that prevent values outside of possible limits (these include non-normal distributions, transformations, and/or bootstrapping approaches).
SARUpperLimit The upper limit of the confidence interval for the SAR field.
Single This field holds a numeric value only -- the percent sign is implied but not included.
Minimum value = 0 and maximum = 100. If the calculated lower limit of the confidence interval is more than 100 you may report 100 in this field, but we suggest you consider statistical options that prevent values outside of possible limits.
SARAlpha The significance level for the SAR confidence interval, expressed as alpha.
Single Express these values as alpha values. For example, for the 95% confidence limits enter "0.05" in this field, not "95".
ReturnsMissing This field indicates whether any adult return years for this out-migration year were missing.
Text 3 Acceptable values: [Do not include comments in brackets.] Yes [Years were missing.] No [No years missing; return estimates were complete.]
If some years were missing, describe how that gap was addressed under ReturnMissingExplanationReturnsMissingExplanation
If some return data are not accounted for in the SAR estimate, explain the gap.
Memo Describe how any gap in return years was addressed: Filled in with an interpolated estimate, ignored, etc.
Metrics supporting the "Indicators" fields above
TSR Total smolts released. Point estimate of the number of smolts released for this outmigration year, or the number of marked smolts used to calculate the SAR.
Single This should be the denominator in the ratio calculation, with all previous losses (handling mortality, tag loss estimate, etc.) already taken out. The Methods citation should address how this was done.
TSRLowerLimit The lower limit of the confidence interval for the TSR field.
Single Minimum value = 0. If the calculated lower limit of the confidence interval is less than zero you may report 0 in this field, but we suggest you consider statistical options that prevent values outside of possible limits (these include non-normal distributions, transformations, and/or bootstrapping approaches).
TSRUpperLimit The upper limit of the confidence interval for the TSR field.
Single Minimum value = 0.
TSRAlpha The significance level for the TSR confidence interval, expressed as alpha.
Single Express these values as alpha values. For example, for the 95% confidence limits enter "0.05" in this field, not "95".
TAR Total adult return. Point estimate of the number of adults returning for the first time from the indicated release year, or the group of marked smolts (as appropriate), to match the smolts in the TSR field. Includes fish of all dispositions – harvested above adult return site, strays, etc.
Single For iteroparous species such as steelhead, include only those adults returning to spawn for the first time. (Failure to do so will result in some adults being counted twice for returns purposes.)
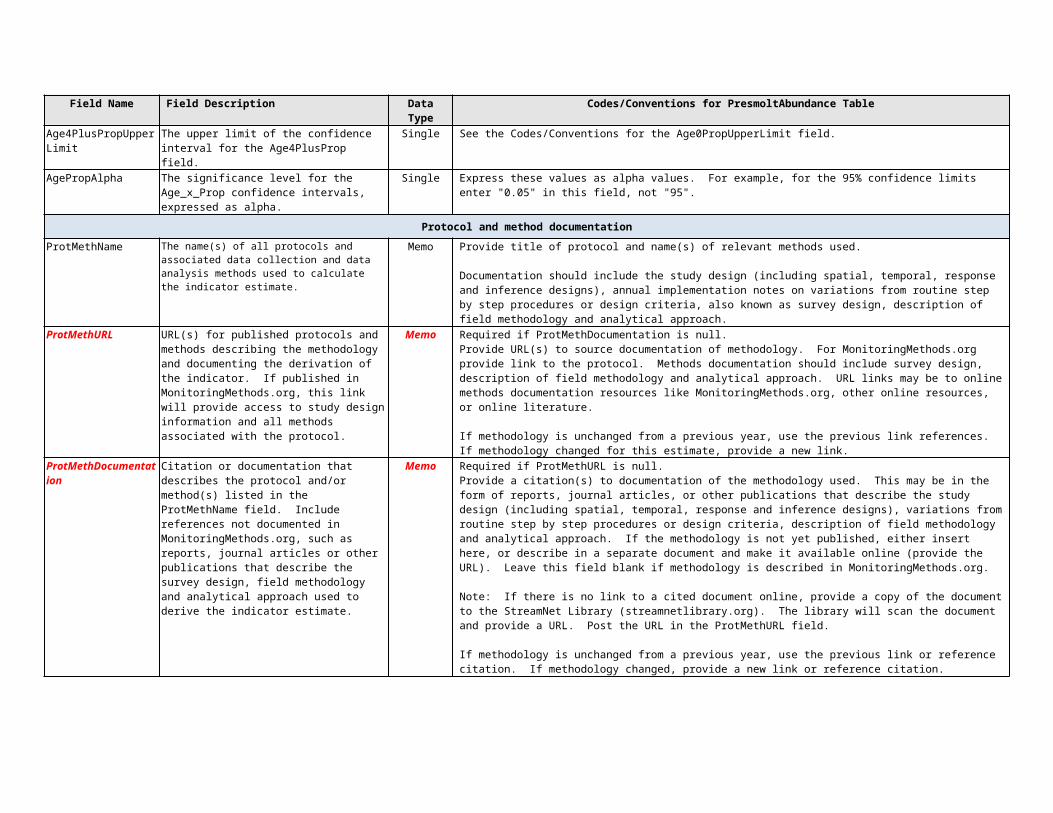
Field Name Field Description Data Type Codes/Conventions for SAR_Hatchery TableTARLowerLimit The lower limit of the confidence interval for the
TAR field.Single Minimum value = 0. If the calculated lower limit of the confidence interval is less than zero you may report 0 in this field, but
we suggest you consider statistical options that prevent values outside of possible limits (these include non-normal distributions, transformations, and/or bootstrapping approaches).
TARUpperLimit The upper limit of the confidence interval for the TAR field.
Single Minimum value = 0.
TARAlpha The significance level for the TAR confidence interval, expressed as alpha.
Single Express these values as alpha values. For example, for the 95% confidence limits enter "0.05" in this field, not "95".
HarvestAdj How was the return adjusted to account for harvest? (Are harvested fish included in the estimate of number of adults?)
Text 35 Acceptable values: [Do not include comments in brackets.] Ocean [Value in the TAR field was adjusted for harvest in the ocean, but not in the mainstem and not in tributaries.] Ocean and mainstem [Value in the TAR field was adjusted for harvest in the ocean and mainstem, but not in tributaries.] Ocean and mainstem and tributaries [Value in the TAR field was adjusted for harvest in the ocean, mainstem, and
tributaries.] Mainstem [Value in the TAR field was adjusted for harvest in the mainstem but not in tributaries.] Mainstem and tributaries [Value in the TAR field was adjusted for harvest in both the mainstem and tributaries.] Tributaries [Value in the TAR field was adjusted for harvest in tributaries but not in the mainstem.] Not adjusted [Value in the TAR field was not adjusted for harvest.]
OceanHarvest The estimated number of adults and jacks from the smolt group indicated in the TSR field that were harvested in the ocean.
Single This field is for harvests in the ocean, which is defined as not including the estuary. Provide this estimate ONLY if it was used to adjust the return/recruit estimate to add back harvested fish.
This may or may not include indirect fishery impacts, and these details should be explained in the Methods citation. This harvest value reflects fish harvested from the indicated natural origin group. Leave blank for juvenile recruits.
MainstemHarvest The estimated number of adults and jacks from the smolt group indicated in the TSR field that were harvested in the mainstem.
Single This field is only for harvests in the mainstem, which is defined as all rivers below the tributary(ies). Provide this estimate ONLY if it was used to adjust the return/recruit estimate to add back harvested fish.
This harvest value reflects fish harvested from the indicated smolt group -- they may be all natural origin, all hatchery origin, or mixed origin, as indicated by the RearingType field. This may or may not include indirect fishery impacts, and these details should be explained in the Methods citation.
TribHarvest The estimated number of adults and jacks from the smolt group indicated in the TSR field that were harvested in tributaries.
Single "Tributaries" is defined as the tributary(ies) the population resides in. Provide this estimate ONLY if it was used to adjust the return/recruit estimate to add back harvested fish.
This harvest value reflects fish harvested from the indicated smolt group -- they may be all natural origin, all hatchery origin, or mixed origin, as indicated by the RearingType field. This may or may not include indirect fishery impacts, and these details should be explained in the Methods citation.
Protocol and method documentation
ProtMethName The name(s) of all protocols and associated data collection and data analysis methods used to calculate the indicator estimate.
Memo Provide title of protocol and name(s) of relevant methods used.
Documentation should include the study design (including spatial, temporal, response and inference designs), annual implementation notes on variations from routine step by step procedures or design criteria, also known as survey design, description of field methodology and analytical approach.
ProtMethURL URL(s) for published protocols and methods describing the methodology and documenting the derivation of the indicator. If published in MonitoringMethods.org, this link will provide access to study design information and all methods associated with the protocol.
Memo Required if ProtMethDocumentation is null.Provide URL(s) to source documentation of methodology. For MonitoringMethods.org provide link to the protocol. Methods documentation should include survey design, description of field methodology and analytical approach. URL links may be to online methods documentation resources like MonitoringMethods.org, other online resources, or online literature.
If methodology is unchanged from a previous year, use the previous link references. If methodology changed for this estimate, provide a new link.

Field Name Field Description Data Type Codes/Conventions for SAR_Hatchery TableProtMethDocumentation Citation or documentation that describes the
protocol and/or method(s) listed in the ProtMethName field. Include references not documented in MonitoringMethods.org, such as reports, journal articles or other publications that describe the survey design, field methodology and analytical approach used to derive the indicator estimate.
Memo Required if ProtMethURL is null.Provide a citation(s) to documentation of the methodology used. This may be in the form of reports, journal articles, or other publications that describe the study design (including spatial, temporal, response and inference designs), variations from routine step by step procedures or design criteria, description of field methodology and analytical approach. If the methodology is not yet published, either insert here, or describe in a separate document and make it available online (provide the URL). Leave this field blank if methodology is described in MonitoringMethods.org.
Note: If there is no link to a cited document online, provide a copy of the document to the StreamNet Library (streamnetlibrary.org). The library will scan the document and provide a URL. Post the URL in the ProtMethURL field.
If methodology is unchanged from a previous year, use the previous link or reference citation. If methodology changed, provide a new link or reference citation.
MethodAdjustments Minor adjustments to a method in a given year that are not described in the method citations above but are important.
Memo Give a brief description of changes or adjustments to a standard method if they are NOT described in the methods documentation already provided. If multiple documentation sources are cited, be sure to indicate which method from which document was adjusted.
In MonitoringMethods.org, documentation of changes or adjustments to methods or protocols can be described in the Implementation Notes section of each published method or protocol.
Comments about the data
Comments Any issues, problems, questions about this indicator that were not already captured in other places.
Memo Required if NullRecord = "Yes".
Supporting information
NullRecord In some years data may not be collected and so a value cannot be calculated. For example, high muddy water or wildfires can prevent redd counts. This field is used to indicate that a record does not exist because the data do not exist to calculate it.
Text 3 Normally "No".A value of "Yes" in this field is a positive statement that the data do not exist to calculate the indicator for the population and time period specified.
The value of including this field is so that missing data are explicitly accounted for rather than being a perpetually open question that is repeatedly researched. Explain in the Comments field why the data do not exist.
DataStatus Status of the data in the current record. Text 255 Acceptable values: [Do not include comments in brackets.] Draft [Values in this record are preliminary and have not been thoroughly reviewed.] Reviewed [Values in this record have been reviewed but are not yet approved as "final".] Final [Values in this record have been thoroughly reviewed and are considered "final".]
LastUpdated Date (and time if desired) the information in this record was last updated.
Date/Time If an exact date is not known, give an estimate.
IndicatorLocation Where this indicator is maintained at the source. Memo If online, provide URL(s).MetricLocation Where the supporting metrics are maintained at the
source.Memo If online, provide URL(s).
MeasureLocation Where the measurements are maintained that were used for these calculations.
Memo If online, provide URL(s).
ContactPersonFirst First name of person who is the best contact for questions that may arise about this data record.
Text 30
ContactPersonLast Last name of person who is the best contact for questions that may arise about this data record.
Text 30
ContactPhone Phone number of person who is the best contact for questions that may arise about this data record.
Text 30
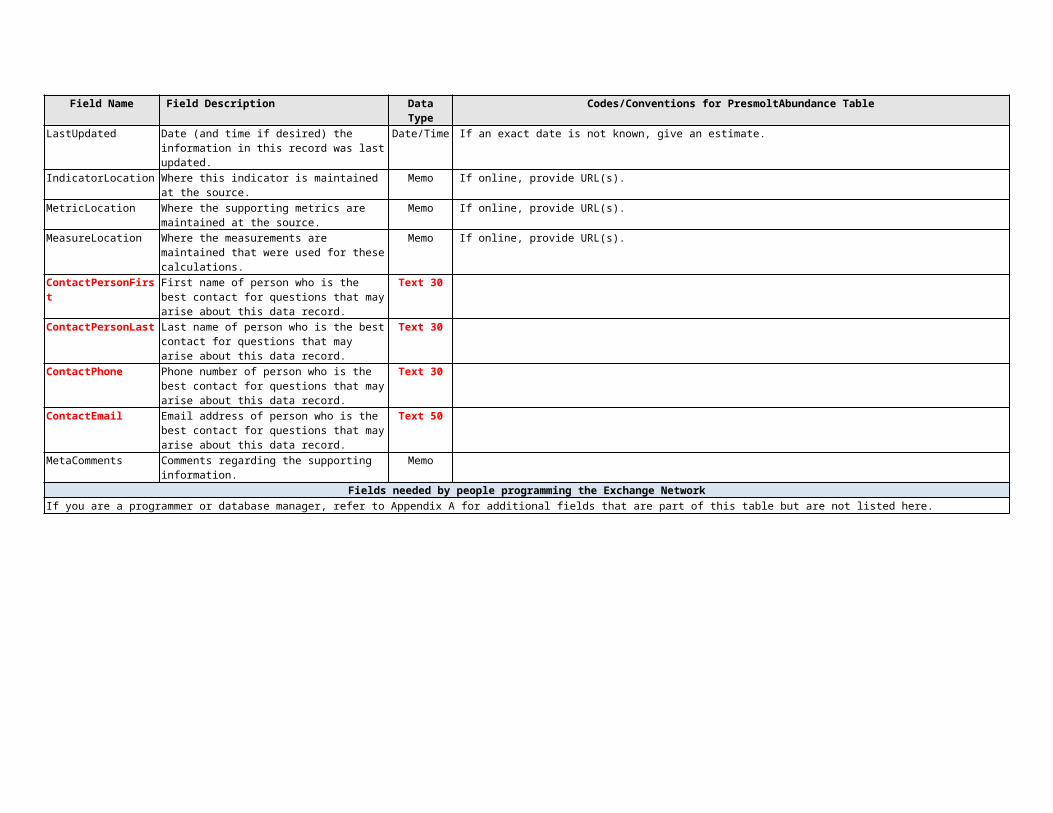
Field Name Field Description Data Type Codes/Conventions for SAR_Hatchery TableContactEmail Email address of person who is the best contact for
questions that may arise about this data record.Text 50
MetaComments Comments regarding the supporting information. MemoFields needed by people programming the Exchange Network
If you are a programmer or database manager, refer to Appendix A for additional fields that are part of this table but are not listed here.
B5. RperS_Hatchery TableThis table stores information concerning recruits per spawner (R/S) for hatchery origin fish. Recruit per spawner ratios are specific to the locations and seasons described in each record of data. This table is for adult recruits only. (Back to Table of Contents.)
Field Name Field Description Data Type Codes/Conventions for RperS_Hatchery TableFields for defining a unique record
ID(unique)
Value used by computer to identify a record. Text 36 This value is a globally unique identifier (GUID) exactly 36 characters long. When submitting a new record you may include this value or leave it blank. If you include this value then it will be used by
the central system. If you leave it blank then a value will be created for you, and it will be sent back to your system where it must be incorporated.
When updating or deleting records this value must be included.CommonName Common name of the taxon of fish. Text 50 Enter the name of the taxon here, even if taxon name is included in the name of the population. Select from the following:
Bull trout Chinook salmon Chum salmon Coho salmon Sockeye salmon Steelhead
Additional species may be added in the future: refer to http://old.streamnet.org/SpeciesInFW.html for common names.Run Run of fish. Text 20 Enter the name of the run here, even if run name is included in the name of the population. Entries in this field are not
recognized as taxonomic divisions. Select from the following: [Do not include comments in brackets.] Spring Summer Fall Winter Spring/summer Both summer & winter N/A [For species without recognized runs. For example, bull trout.]
ESU_DPS For populations listed under the federal ESA, this is the name of a defined Evolutionarily Significant Unit (ESU) or Distinct Population Segment (DPS) as defined by NMFS Northwest Region or by USFWS in which the population falls geographically. For non-listed populations this is the DPS or other name.
Text 255 Enter the name of the ESU or DPS here. Entries in this field are taxonomic divisions defined by NMFS or USFWS, and may be at the species, subspecies, or finer scale. ESUs of salmon north of California are listed athttp://www.nwfsc.noaa.gov/trt/.
Many hatchery populations are not part of an ESU. In such cases leave this field blank.
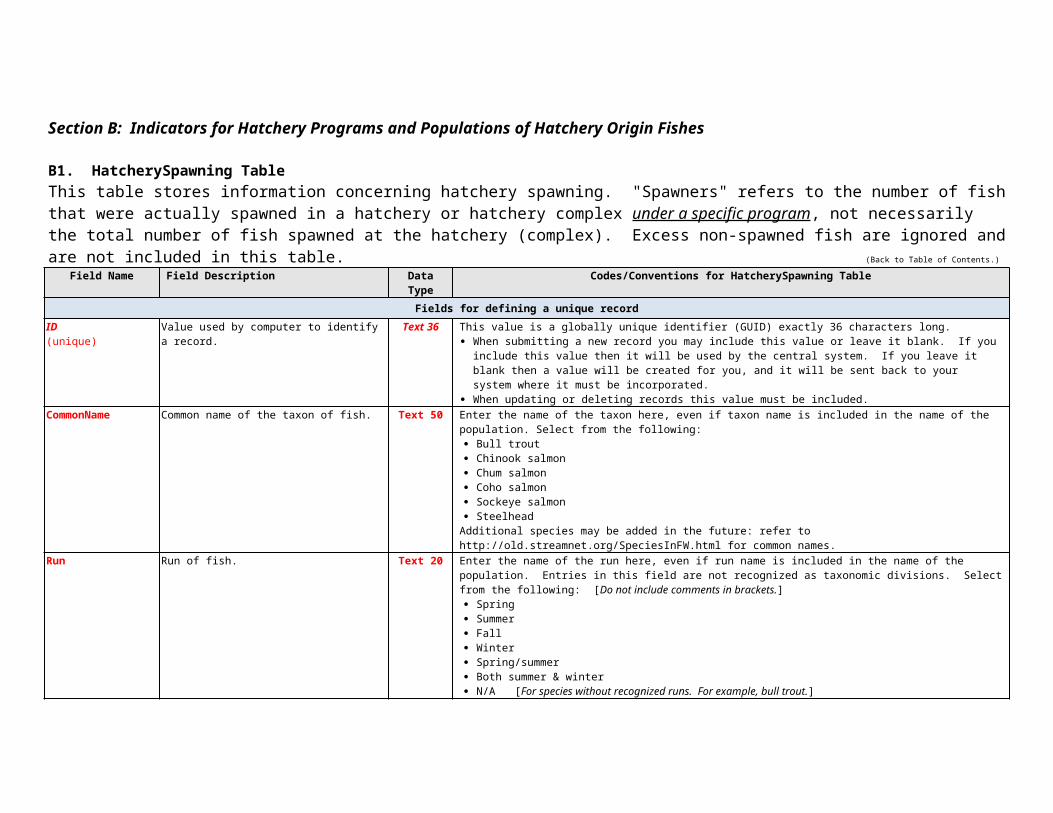
Field Name Field Description Data Type Codes/Conventions for RperS_Hatchery TableRecoveryDomain Name of the "recovery domain," as defined by the
NMFS Northwest Region, in which the population falls geographically.
Text 255 Five recovery domains have been defined by NMFS in Washington, Oregon, and Idaho. Select the appropriate one from this list. Many hatchery populations are not part of a recovery domain. In such cases leave this field blank. Puget Sound Recovery Domain Willamette/Lower Columbia Recovery Domain Interior Columbia Recovery Domain Oregon Coast Recovery Domain Southern Oregon/Northern California Coast Recovery Domain
Further information about recovery domains can be found at http://www.nwfsc.noaa.gov/trt/.MajorPopGroup Name of "major population group" (MPG) or
“stratum” as defined by the NMFS Northwest Region, in which the population falls geographically.
Text 255 The term "stratum" is used in the Willamette/Lower Columbia Recovery Domain, while "major population group" is used in other areas. The term "stratum" includes life history considerations as well as geographic criteria, while MPGs are defined geographically. See Appendix C for the list of MPGs / strata.
PopID Code for the population(s) of fish represented by this record.
Integer See Appendix C for the list of PopID codes for populations as defined by NMFS Northwest Region for ESA. The populations are defined by NMFS Northwest Region; the codes for these populations are created by StreamNet to reference those NMFS populations. See Appendix E if you need a PopID for a population that does not yet have one assigned.
ESAlisted Flag indicating whether the hatchery fish are part of the ESU or DPS in which it falls geographically.
Text 3 Acceptable values: Yes No
If you are unsure about a particular hatchery stock's inclusion in an ESU/DPS, information can be found athttps://www.federalregister.gov/articles/2014/04/14/2014-08347/endangered-and-threatened-wildlife-final-rule-to-revise-the-code-of-federal-regulations-for-species.
CBFWApopName Population name as defined by CBFWA for subbasin planning purposes, from subbasin plans and agencies.
Text 255 This may include non-listed populations, or cases where geographic area does not match a defined population of a listed species. See Appendix D for the list of these population names.
Fill this field even when a population's geographic extent coincides with NWR name for a listed population.CommonPopName Population name used by local biologists. Text 255 Often this is simply the name of the population(s) as written on the original time series spreadsheets.PopFit Categorization of how well the geographic extent of
the recruits per spawner estimate corresponds to the geographic definition of the population.
Text 8 This field is required if NullRecord = "No".Acceptable values: [Do not include comments in brackets.] Same [Estimate represents one entire population, the whole population, and nothing but the population.] Portion [Estimate represents a portion of one population. (Describe in PopFitNotes field.)] Multiple [Estimate is from more than one population. (Describe in PopFitNotes field.)]
PopFitNotes Text description of how well the recruits per spawner value corresponds to the defined population, and why the data are not at the scale of a single population.
Memo This field is required if the PopFit field is "Portion" or "Multiple".If the PopFit field is "Portion" or "Multiple", describe the lack of correspondence between the defined population and the fish for which the recruits per spawner estimate was made. Also state why this scale of data was used to represent the population instead of true population-scale data. (Examples: "Data not available at exact scale of this population."; "Data at this scale best represent the population.")
HatcheryProgramName Hatchery program this record describes. Text 255HatcheryStockName Stock of hatchery fish this record describes. Text 255Hatchery Name of the hatchery or hatchery complex
associated with the time series.Text 255 This may be any of the following:
the name of a hatchery. the name of a hatchery complex. the names of multiple hatcheries if appropriate for the time series. (Providing alphabetically is preferred.)
To allow for easy sorting, it is preferable to use the hatchery name as listed in the StreamNet database at http://q.streamnet.org/Request.cfm?cmd=BuildPicklist&NewQuery=BuildCriteria&PicklistItem=Hatchery.

Field Name Field Description Data Type Codes/Conventions for RperS_Hatchery TableReleaseLocation The specific location(s) for where the fish were
released.Text 255 This may be any of the following:
the name of a hatchery facility the name of a fluvial water body and text description of where on that stream or river (river mile preferred, but river
kilometer, lat/long, or other characterization allowable). the name of an impounded fluvial water body (reservoir) and description of where on that reservoir. the name of a lentic water body, and description of where on that lake. a description of multiple water bodies if appropriate for the time series, with descriptions of specific locations. the name of a dam.
RecruitLocation The specific location(s) for where the recruit abundance numbers were determined.
Text 255 This field describes the location where the abundance of recruits is determined, and may be any of the following: the name of a fluvial water body. the name of a lentic water body. a dam or other location where fish numbers can be estimated. a description of multiple water bodies if appropriate for the time series. other, as appropriate.
BroodYear The four-digit brood year for which the recruit per spawner ratio is calculated. Same as "spawning year" for the parent generation.
Integer This field is used to tie juvenile ‘recruits’ or adult returns (over multiple return years) to a specific spawning year. This is the year in which spawning of this species (and run where appropriate) began.
In cases where an unusual population begins spawning uncharacteristically early (before January 1 for spring spawners) or late (after December 31 for fall spawners) for the species (and perhaps run), assign the year based on the majority of populations of this species/run in order to be consistent for all members of the spawning cohort. For example, most coho spawn in fall but a few populations do not begin spawning until after Jan. 1. The brood year assigned for these unusual populations would match the other populations that spawned in the fall, even though these particular populations did not begin spawning until after December 31.
RperStype The type of recruit per spawner estimate, in terms of what fish are included in the estimates of number of spawners and number of recruits.
Text 255 Juvenile recruits are not included in this table. Acceptable values: [Do not include comments in brackets.] Total recruits per total spawners [Includes males and jacks] Adult recruits per adult spawners [Includes adult males, but not jacks] Female recruits per female spawners [All males excluded]If more than one type of estimate is done for one brood year for a population, the estimates go in separate data records.
ContactAgency Agency, tribe, or other entity, or person responsible for these data that is the best contact for questions that may arise about this data record.
Text 255 Entries in this field must precisely match a name in the StreamNet agency list. Here are the ones most likely needed. If yours is not found here, contact your agency StreamNet representative, or call PSMFC's StreamNet staff at 503-595-3100. Columbia River Inter-Tribal Fish Commission Colville Confederated Tribes Confederated Tribes and Bands of the Yakama Indian Nation Confederated Tribes of the Umatilla Indian Reservation Confederated Tribes of the Warm Springs Reservation of Oregon Idaho Department of Fish and Game Nez Perce Tribe of Idaho Oregon Department of Fish and Wildlife Spokane Tribe of Indians Washington Department of Fish and Wildlife

Field Name Field Description Data Type Codes/Conventions for RperS_Hatchery TableMethodNumber This field represents the method(s) used to calculate
the values in the "Indicators" and "Metrics" sections.
This field is used in conjunction with the ContactAgency field. See the Codes/Conventions column for details.
Byte This field, along with the "ContactAgency" field above, identifies which entity calculated the values in the record and which (set of) methods where used to calculate them. These fields allow for multiple entries for the same population and year. Thus, it is possible to share values that are based on different assumptions.
If only one set of methods is used to calculate the values for all years for a population, enter "1" for all records. Even if methods changed, you can enter "1" for all records if there is always only one record per year for a population.
If more than one set of methods is used to calculate final values over a range of years for a population, use this field to indicate which records are meant to go together. For example, if method 1 was used to calculate values for 1960 through 1994, and method 2 was used to calculate values for 1980 through 2013, then there will be more than one record for the years 1980 through 1994. In such cases you would enter "1" for records that result from the 1960-1994 method, and "2" for records that result from the 1980-2013 method. Similarly, if 3 different methods are proposed in an area for the same years, then use "1" and "2" and "3" to indicate which records belong together. This lets a data user know which records belong together.
When more than one record exists for a population X year combination, it is up to biologists using the data to select the value of most use when conducting their day to day business. The ContactAgency and MethodNumber fields allow for this.
Indicators
RperS The point estimate for the ratio of recruits from the designated brood year and type, divided by the number of parent spawners responsible for that brood year. Straight ratio calculation, not a log/natural log transformation.
Single Required if NullRecord = "No".For iteroparous species such as steelhead, adult recruits should include all fish from the brood year that return to spawn, including repeat spawners, since repeat spawners add to the productivity of the population.
Juvenile recruits are not included in this table.RperSLowerLimit The lower limit of the confidence interval for the
RperS field.Single Minimum value = 0. If the calculated lower limit of the confidence interval is less than zero you may report 0 in this field, but
we suggest you consider statistical options that prevent values outside of possible limits (these include non-normal distributions, transformations, and/or bootstrapping approaches).
RperSUpperLimit The upper limit of the confidence interval for the RperS field.
Single Minimum value = 0.
RperSAlpha The significance level for the RperS confidence interval, expressed as alpha.
Single Express these values as alpha values. For example, for the 95% confidence limits enter "0.05" in this field, not "95".
Metrics supporting the "Indicators" fields above
NumberSpawned The total number of fish spawned. Integer This is the total number of fish used in spawning, which includes hatchery and natural origin fish of all ages. Not included are pre-spawn mortalities and excess non-spawned (culled) fish. This value must be a whole number.
Recruits Point estimate for the total number of recruits from the indicated combination of species, run, population, hatchery program, release location, recruit location, brood year, and RperStype.
Long int Adult recruits should include all fish from the brood year that return to the recruit location, including repeat spawners, since repeat spawners add to the productivity of the population.
RecruitsLowerLimit The lower limit of the confidence interval for the Recruits field.
Long int Minimum value = 0. If the calculated lower limit of the confidence interval is less than zero you may report 0 in this field, but we suggest you consider statistical options that prevent values outside of possible limits (these include non-normal distributions, transformations, and/or bootstrapping approaches).
RecruitsUpperLimit The upper limit of the confidence interval for the Recruits field.
Long int Minimum value = 0.
RecruitsAlpha The significance level for the Recruits confidence interval, expressed as alpha.
Single Express these values as alpha values. For example, for the 95% confidence limits enter "0.05" in this field, not "95".

Field Name Field Description Data Type Codes/Conventions for RperS_Hatchery TableRecruitsMissing This field indicates whether any recruits for this
brood year were missing.Text 3 Indicate if recruit estimates for any year were missing. If so, indicate in this field, and explain how the gap was addressed in
the RecruitsMissingExplanation field and in the Methods citation.
Acceptable values: [Do not include comments in brackets.] Yes [Years were missing.] No [No years missing; recruit estimates were complete.]
If some years were missing, describe how that gap was addressed under RecruitsMissingExplanation.RecruitsMissingExplanation
If some recruits data are not accounted for in the RperS estimate, explain the gap.
Memo Required if RecruitsMissing = "Yes". Must be null if RecruitsMissing = "No".Explain how any gaps in returns from this year class were addressed (estimated to fill in, ignored, etc.).
HarvestAdj For adult returns, how was the return adjusted to account for harvest?
Text 35 Acceptable values: [Do not include comments in brackets.] Ocean [Value in the Recruits field was adjusted for harvest in the ocean, but not in the mainstem and not in tributaries.] Ocean and mainstem [Value in the Recruits field was adjusted for harvest in the ocean and mainstem, but not in
tributaries.] Ocean and mainstem and tributaries [Value in the Recruits field was adjusted for harvest in the ocean, mainstem, and
tributaries.] Mainstem [Value in the Recruits field was adjusted for harvest in the mainstem but not in tributaries.] Mainstem and tributaries [Value in the Recruits field was adjusted for harvest in both the mainstem and tributaries.] Tributaries [Value in the Recruits field was adjusted for harvest in tributaries but not in the mainstem.] Not adjusted [Value in the Recruits field was not adjusted for harvest.]
OceanHarvest The estimated number of adults and jacks from the spawner group indicated in the NumberSpawned field that were harvested in the ocean.
Single This field is for harvests in the ocean, which is defined as not including the estuary. Provide this estimate ONLY if it was used to adjust the return/recruit estimate to add back harvested fish.
This may or may not include indirect fishery impacts, and these details should be explained in the Methods citation. This harvest value reflects fish harvested from the indicated natural origin group. Leave blank for juvenile recruits.
MainstemHarvest The estimated number of adults and jacks from the spawner group indicated in the NumberSpawned field that were harvested in the mainstem.
Single This field is only for harvests in the mainstem, which is defined as all rivers below the tributary(ies) defining the population, in including the estuary. Provide this estimate regardless of whether the number of recruits was adjusted for mainstem harvest.
This may or may not include indirect fishery impacts, and these details should be explained in the Methods citation. This harvest value reflects fish harvested from the indicated release group.
TribHarvest The estimated number of adults and jacks from the spawner group indicated in the NumberSpawned field that were harvested in tributaries.
Single "Tributaries" is defined as the tributary(ies) the population resides in. Provide this estimate regardless of whether the number of recruits was adjusted for the harvest in tributaries.This may or may not include indirect fishery impacts, and these details should be explained in the Methods citation. This harvest value reflects fish harvested from the indicated release group.
Age determination
Age2Adults Total number of recruits that recruited at age 2 (brood year +2).
Single Ages in this table are based on the year spawning occurred, not necessarily the year they hatched, so care must be taken in assigning returning fish to a brood year.Assigning returning fish to a brood year can be complicated based on the life history (generally, salmon return and spawn in one year but hatch in the next, steelhead spawn and hatch in the same year). Make sure these details are accounted for in assigning returns to a year class.Adult recruits should include all fish from the brood year that return to spawn, including repeat spawners, since repeat spawners add to the productivity of the population.
Age3Adults Total number of recruits that recruited at age 3 (brood year +3).
Single See the Codes/Conventions column for the Age2Adults field.
Age4Adults Total number of recruits that recruited at age 4 (brood year +4).
Single See the Codes/Conventions column for the Age2Adults field.
Age5Adults Total number of recruits that recruited at age 5 (brood year +5).
Single See the Codes/Conventions column for the Age2Adults field.
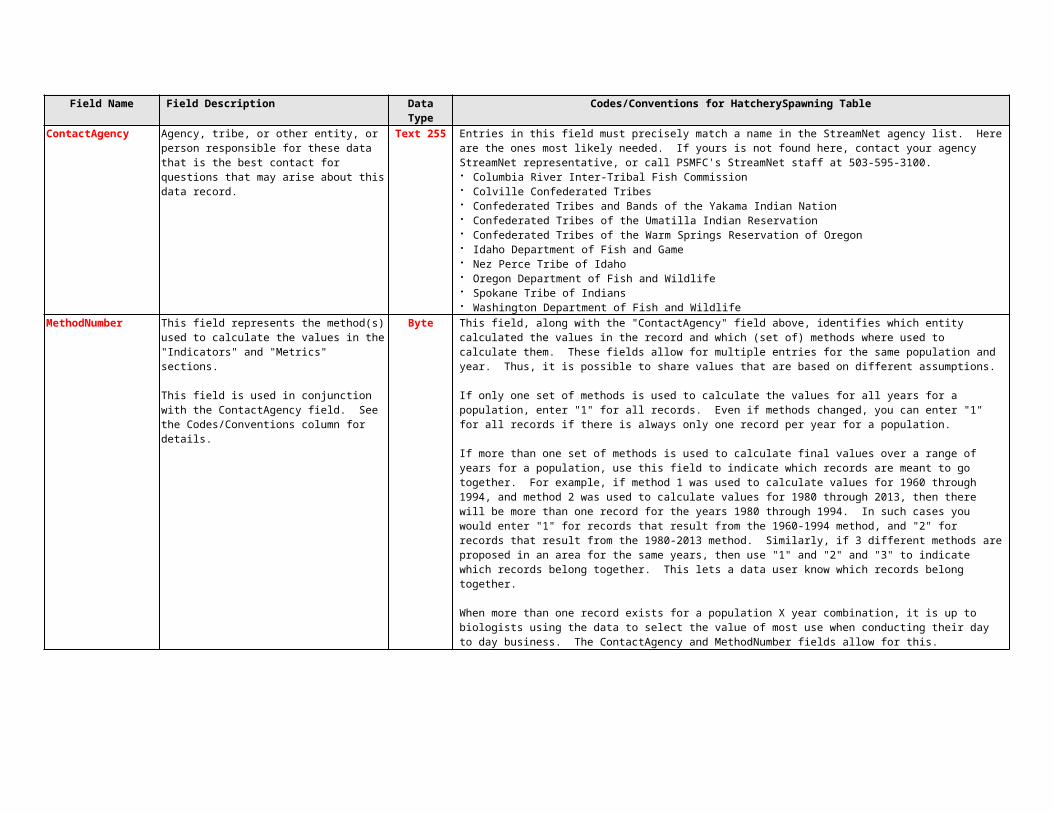
Field Name Field Description Data Type Codes/Conventions for RperS_Hatchery TableAge6Adults Total number of recruits that recruited at age 6
(brood year +6).Single See the Codes/Conventions column for the Age2Adults field.
Age7Adults Total number of recruits that recruited at age 7 (brood year +7).
Single See the Codes/Conventions column for the Age2Adults field.
Age8Adults Total number of recruits that recruited at age 8 (brood year +8).
Single See the Codes/Conventions column for the Age2Adults field.
Age9Adults Total number of recruits that recruited at age 9 (brood year +9).
Single See the Codes/Conventions column for the Age2Adults field.
Age10Adults Total number of recruits that recruited at age 10 (brood year +10).
Single See the Codes/Conventions column for the Age2Adults field.
Age11PlusAdults Total number of recruits that recruited at age 11 (brood year +11 or more).
Single See the Codes/Conventions column for the Age2Adults field.
Protocol and method documentation
ProtMethName The name(s) of all protocols and associated data collection and data analysis methods used to calculate the indicator estimate.
Memo Provide title(s) of protocol and name(s) of relevant methods used.
Documentation should include the study design (including spatial, temporal, response and inference designs), annual implementation notes on variations from routine step by step procedures or design criteria, also known as survey design, description of field methodology and analytical approach.
ProtMethURL URL(s) for published protocols and methods describing the methodology and documenting the derivation of the indicator. If published in MonitoringMethods.org, this link will provide access to study design information and all methods associated with the protocol
Memo Required if ProtMethDocumentation is null.Provide URL(s) to source documentation of methodology. For MonitoringMethods.org provide link to the protocol. Methods documentation should include survey design, description of field methodology and analytical approach. URL links may be to online methods documentation resources like MonitoringMethods.org, other online resources, or online literature.
If methodology is unchanged from a previous year, use the previous link references. If methodology changed for this estimate, provide a new link.
ProtMethDocumentation Citation or documentation that describes the protocol and/or method(s) listed in the ProtMethName field. Include references not documented in MonitoringMethods.org, such as reports, journal articles or other publications that describe the survey design, field methodology and analytical approach used to derive the indicator estimate.
Memo Required if ProtMethURL is null.Provide a citation(s) to documentation of the methodology used. This may be in the form of reports, journal articles, or other publications that describe the study design (including spatial, temporal, response and inference designs), variations from routine step by step procedures or design criteria, description of field methodology and analytical approach. If the methodology is not yet published, either insert here, or describe in a separate document and make it available online (provide the URL). Leave this field blank if methodology is described in MonitoringMethods.org.
Note: If there is no link to a cited document online, provide a copy of the document to the StreamNet Library (streamnetlibrary.org). The library will scan the document and provide a URL. Post the URL in the ProtMethURL field.
If methodology is unchanged from a previous year, use the previous link or reference citation. If methodology changed, provide a new link or reference citation.
MethodAdjustments Minor adjustments to a method in a given year that are not described in the method citations above but are important.
Memo Give a brief description of changes or adjustments to a standard method if they are NOT described in the methods documentation already provided. If multiple documentation sources are cited, be sure to indicate which method from which document was adjusted.
In MonitoringMethods.org, documentation of changes or adjustments to methods or protocols can be described in the Implementation Notes section of each published method or protocol.
Comments about the data
Comments Any issues, problems, questions about this indicator that were not already captured in other places.
Memo Required if NullRecord = "Yes".

Field Name Field Description Data Type Codes/Conventions for RperS_Hatchery Table
Supporting information
NullRecord In some years data may not be collected and so a value cannot be calculated. For example, high muddy water or wildfires can prevent redd counts. This field is used to indicate that a record does not exist because the data do not exist to calculate it.
Text 3 Normally "No".A value of "Yes" in this field is a positive statement that the data do not exist to calculate the indicator for the population and time period specified.
The value of including this field is so that missing data are explicitly accounted for rather than being a perpetually open question that is repeatedly researched. Explain in the Comments field why the data do not exist.
DataStatus Status of the data in the current record. Text 255 Acceptable values: [Do not include comments in brackets.] Draft [Values in this record are preliminary and have not been thoroughly reviewed.] Reviewed [Values in this record have been reviewed but are not yet approved as "final".] Final [Values in this record have been thoroughly reviewed and are considered "final".]
LastUpdated Date (and time if desired) the information in this record was last updated.
Date/Time If an exact date is not known, give an estimate.
IndicatorLocation Where this indicator is maintained at the source. Memo If online, provide URL(s).MetricLocation Where the supporting metrics are maintained at the
source.Memo If online, provide URL(s).
MeasureLocation Where the measurements are maintained that were used for these calculations.
Memo If online, provide URL(s).
ContactPersonFirst First name of person who is the best contact for questions that may arise about this data record.
Text 30
ContactPersonLast Last name of person who is the best contact for questions that may arise about this data record.
Text 30
ContactPhone Phone number of person who is the best contact for questions that may arise about this data record.
Text 30
ContactEmail Email address of person who is the best contact for questions that may arise about this data record.
Text 50
MetaComments Comments regarding the supporting information. MemoFields needed by people programming the Exchange Network
If you are a programmer or database manager, refer to Appendix A for additional fields that are part of this table but are not listed here.

III. Appendices
Appendix A. Fields included in every table by reference(Back to Table of Contents.)
The fields shown in this appendix are included in all tables of sections A and B of this document. These fields are for use by the programmers implementing the Exchange Network system; everyone else can ignore them. In the interest of saving space in the document, easing editing of this document, and keeping these fields out of the way of people who don't need to see them, these fields are included here by reference rather than being shown in every table above. At this time none of these fields are required except the "SubmitAgency" and "Publish" fields. (Back to Table of Contents.)
Field Name Field Description Data Type Codes/ConventionsFields needed by people programming the Exchange Network
SubmitAgency Initials or acronym for the agency, tribe, or other entity, or name of person, that sent this record of data to the exchange network node at StreamNet.
Note that it is possible for one entity to share data with another, and that second entity sends the record to the exchange network node. For example, the Shoshone-Bannock Tribes may send data to IDFG, who in turn sends those data to the exchange network. In such a case the Sho-Ban Tribes would be identified as the contact agency for the data, but the "SubmitAgency" would be IDFG.
Text 255 Entries in this field must precisely match a name in the Acronym field of the StreamNet agency list unless it is for an individual. Here are the ones most likely needed. If yours is not found here, contact your agency StreamNet representative, or call PSMFC's StreamNet staff at 503-595-3100. CRITFC = Columbia River Inter-Tribal Fish Commission CCT = Colville Confederated Tribes YIN = Confederated Tribes and Bands of the Yakama Indian Nation CTUIR = Confederated Tribes of the Umatilla Indian Reservation CTWSIR = Confederated Tribes of the Warm Springs Reservation of Oregon IDFG = Idaho Department of Fish and Game NPT = Nez Perce Tribe of Idaho ODFW = Oregon Department of Fish and Wildlife STOI = Spokane Tribe of Indians1
WDFW = Washington Department of Fish and WildlifeRefID The unique StreamNet reference ID number that
identifies the source document or database from which the record was obtained.
Long int Pre-Data Exchange - 0 - 1,000WDFW = 10,000-19,999; 100,000-199,999CRITFC = 20,000-29,999; 200,000-299,999USFWS = 30,000-39,999; 300,000-399,999IDFG = 40,000-49,999; 400,000-499,999ODFW = 50,000-59,999; 500,000-599,999PSMFC = 60,000-69,999; 600,000-699,999MFWP = 70,000-89,999; 700,000-799,999CDFG = 90,000-99,999; 800,000-899,999
UpdDate The date and time that the record was created or updated. For data obtained in electronic format from another source it can reflect the date and time of data capture or of conversion to Coordinated Assessment/StreamNet standards.
Datetime This can be the time a record was created, the last time it was edited, or the last time it was QCd.
DataEntry Compiler's name. Text 50 The name of the person who entered the record.DataEntryNotes Notes about this record by the compiler identified in
the "DataEntry" field.Memo Notes for the compiler to reference field office, contact, or any other information.

Field Name Field Description Data Type Codes/ConventionsCompilerRecordID Agency record ID maintained by the data submitter. Text 36 This field can be used in any way the compiler may find helpful. For example, it can be used to create a link between the
Coordinated Assessments exchange network and an internal system such as ODFW's Salmon Tracker.Publish Yes/no value indicating whether this record should
be shared freely with all public users via the Exchange Network. If "No" then the record can only be accessed by using the apikey that created it.
Text 3 Acceptable values: [Do not include comments in brackets.] Yes [Record will be shared with public via Exchange Network.] No [Record will not be shared with public via Exchange Network.]
Setting this value to "No" lets you test your systems and avoid having such test records be output on the public system.
Appendix B. Glossary(Back to Table of Contents.)
Terms in this list are defined in the following way for use in this document.
Broodstock: Fish set aside for spawning in a hatchery setting.NOTE 1: Broodstock may be fish raised in a hatchery their entire lives ('captive broodstock'), fish released to grow that returned to spawn ('hatchery broodstock' for salmon and steelhead), and/or fish obtained from natural populations ('natural broodstock' or 'wild broodstock'). In hatchery jargon "hatchery broodstock" refers only to fish of hatchery origin.
NOTE 2: Broodstock selection and spawning can be complicated. Often, not all returning fish will be part of the broodstock. Also, broodstock may be brought in from other hatcheries or from natural populations. Further, in many cases not all of the identified broodstock will be spawned due to pre-spawning mortality, broodstock set-aside in excess of spawning needs, skewed sex ratio, selection of individuals, and other factors. In a simple case where only returning salmon are selected as broodstock, the broodstock is usually a subset of the total return, and the hatchery spawners are usually a subset of the broodstock.
Appendix C. Recovery Domains, Species, ESUs, MPGs, and Populations Defined by NMFS and NPCC/CBFWA/CRITFC(Back to Table of Contents.)
The tables in the main portion of this document ask that the species common name, run, evolutionarily significant unit (ESU), recovery domain, major population groups (MPG), and fish population code be provided whenever possible and appropriate.
MPGs are groups of populations intermediate in scope between individual populations and ESUs. MPGs are sometimes called "strata" in the Willamette/Lower Columbia recovery domain and "geographic regions" in the Puget Sound recovery area. Further information about MPGs can be found at http://www.nwfsc.noaa.gov/trt/. The current list of ESUs and MPGs defined by NMFS, along with population names and population codes, can be found at http://www.streamnet.org/ca-populations.

Appendix D. Names of Populations Defined by NPCC / CBFWA / CRITFC (from Subbasin Planning)(Back to Table of Contents.)
Listed below in hierarchical order are the names of fish populations used by NPCC for subbasin planning. This list was developed by CBFWA and CRITFC from the subbasin plans. The names shown were provided by David Graves of CRITFC on September 26, 2012. Geographic representations of the populations can be found at http://fishery.critfc.org/FiSci/FishUnitsIntroMap.htm.
Chinook salmon Fall
o Big Creek Fall Chinooko Clackamas River Fall Chinooko Clatskanie River Fall Chinooko Clearwater River Fall Chinooko Columbia Upper Gorge Tributaries Fall Chinooko Coweeman River Fall Chinooko Deschutes River Fall Chinooko Elochoman River Fall Chinooko Grande Ronde River Fall Chinooko Grays River Fall Chinooko Hanford Reach Fall Chinooko Hood River Fall Chinooko Imnaha River Fall Chinooko Kalama River Fall Chinooko Klickitat River Fall Chinooko Lewis River Early Fall Chinooko Lewis River Late Fall Chinooko Lower Columbia Gorge Tributaries Fall Chinooko Lower Cowlitz River Fall Chinooko Lower Snake River Fall Chinooko Lower Yakima River Fall Chinooko Mill Creek Fall Chinooko Rock Creek Fall Chinooko Salmon Creek Early Fall Chinooko Sandy River Early Fall Chinooko Scappoose Creek Fall Chinooko Snake Hell's Canyon Fall Chinooko Toutle River Fall Chinooko Tucannon River Fall Chinook
o Umatilla River Fall Chinooko Upper Cowlitz River Fall Chinooko Washougal River Fall Chinooko White Salmon Bright Fall Chinooko White Salmon Tule Fall Chinooko Youngs Bay Fall Chinook
Springo American River Spring Chinooko Calapooia River Spring Chinooko Catherine Creek Spring Chinooko Cispus River Spring Chinooko Clackamas River Spring Chinooko East Fork Salmon River Spring Chinooko Entiat River Spring Chinooko Granite Creek John Day Spring Chinooko Hood River Spring Chinooko Kalama River Spring Chinooko Klickitat River Spring Chinooko Lewis River Spring Chinooko Little White Salmon River Spring Chinooko Lolo Creek Spring Chinooko Lookingglass Creek Spring Chinooko Malheur River Spring Chinooko McKenzie River Spring Chinooko Methow River Spring Chinooko Middle Fork John Day Spring Chinooko Middle Fork Willamette River Spring Chinooko Minam River Spring Chinooko Molalla/Pudding River Spring Chinooko Naches River Spring Chinooko North Fork John Day Spring Chinook

o North Santiam River Spring Chinooko Okanogan River Spring Chinooko Potlatch River Spring Chinooko Sandy River Spring Chinooko Shitike Creek Spring Chinooko South Santiam River Spring Chinooko Tilton River Spring Chinooko Toutle River Spring Chinooko Umatilla River Spring Chinooko Upper Cowlitz River Spring Chinooko Upper Grande Ronde Spring Chinooko Upper John Day Spring Chinooko Upper Yakima River Spring Chinooko Walla Walla Spring Chinooko Wallowa - Lostine River Spring Chinooko Warm Springs River Spring Chinooko Wenatchee River Spring Chinooko White Salmon Spring Chinooko Wind River Spring Chinook
Spring/summero Asotin Creek Spring/Summer Chinooko Bear Valley Creek Spring/Summer Chinooko Big Creek Spring/Summer Chinooko Big Sheep Creek Spring/Summer Chinooko Camas Creek Spring/Summer Chinooko Chamberlain Creek Spring/Summer Chinooko East Fork South Fork Salmon River Spring/Summer Chinooko Imnaha River Mainstem Spring/Summer Chinooko Lapwai/Big Canyon Spring/Summer Chinooko Lawyer Creek Spring/Summer Chinooko Lemhi River Spring/Summer Chinooko Little Salmon River Spring/Summer Chinooko Lochsa River Spring/Summer Chinooko Loon Creek Spring/Summer Chinooko Lower North Fork Clearwater River Spring/Summer Chinooko Marsh Creek Spring/Summer Chinooko Meadow Creek Spring/Summer Chinooko Middle Fork Salmon River above Indian Creek Spring/Summer Chinooko Middle Fork Salmon River below Indian Creek Spring/Summer Chinooko Moose Creek Spring/Summer Chinooko North Fork Salmon River Spring/Summer Chinooko Pahsimeroi River Spring/Summer Chinook
o Panther Creek Spring/Summer Chinooko Salmon River Lower Mainstem below Redfish Lake Spring/Summer Chinooko Salmon River Upper Mainstem above Redfish Lake Spring/Summer Chinooko Secesh River Spring/Summer Chinooko South Fork Salmon River Spring/Summer Chinooko Sulphur Creek Spring/Summer Chinooko Tucannon River Spring/Summer Chinooko Upper North Fork Clearwater River Spring/Summer Chinooko Upper Selway River Spring/Summer Chinooko Upper South Fork Clearwater River Spring/Summer Chinooko Valley Creek Spring/Summer Chinooko Wenaha River Spring/Summer Chinooko Yankee Fork Spring/Summer Chinook
Chum salmon Fallo Cowlitz River Fall Chum
(No run indicated)o Big Creek Chumo Clackamas River Chumo Clatskanie River Chumo Cowlitz River Summer Chumo Elochoman River Chumo Grays/Chinook Rivers Chumo Kalama River Chumo Lewis River Chumo Lower Columbia Gorge Tributaries Chumo Lower Columbia Mainstem Chumo Mill Creek Chumo Sandy River Chumo Scappoose Creek Chumo Upper Gorge Tributaries Chumo Washougal River Chumo Youngs Bay Chum
Coho salmon (No run indicated)o Big Creek Cohoo Cispus River Cohoo Clackamas River Cohoo Clatskanie River Coho

o Coweeman River Cohoo East Fork Lewis River Cohoo Elochoman Cohoo Entiat River Cohoo Fifteenmile Creek Cohoo Grays/Chinook Rivers Cohoo Hood River Cohoo Kalama River Cohoo Lower Columbia Gorge Tributaries Cohoo Lower Cowlitz River Cohoo Mill Creek Cohoo Molalla/Pudding River Cohoo North Fork Lewis River Cohoo North Fork Toutle River Cohoo North Santiam River Cohoo Salmon Creek Cohoo Sandy River Cohoo Scappoose Creek Cohoo South Fork Toutle River Cohoo Tilton River Cohoo Umatilla River Cohoo Upper Cowlitz River Cohoo Washougal River Cohoo Wenatchee River Cohoo White Salmon Cohoo Youngs Bay Coho
Kokanee (No run indicated)o Bumping Lake Kokaneeo Cle elum Lake Kokaneeo Coeur d'Alene Lake Kokaneeo Crab Creek Kokaneeo Crane Prairie Reservoir Kokaneeo Kachess Lake Kokaneeo Keechelus Lake Kokaneeo Lake Billy Chinook Kokaneeo Lake Chelan Kokaneeo Lake Osoyoos Kokaneeo Lake Pend Oreille Kokaneeo Lake Wenatchee Kokaneeo Paulina Lake Kokanee
o Payette Lake Kokaneeo Priest Lake Kokaneeo Rimrock Lake Kokaneeo San Poil River Kokaneeo Spokane River Kokaneeo Suttle Lake Kokaneeo Upper Columbia River Kokaneeo Wallowa Lake Kokaneeo Wickiup Reservoir Kokanee
Sockeye salmon (No run indicated)o Okanogan River Sockeyeo Snake River (Redfish Lake) Sockeye Salmono Snake River Sockeye (Stanley, Petit, Alturas, other lakes)o Wenatchee River Sockeyeo Yakima River Sockeye
Steelhead Summero Asotin Creek Summer Steelheado Burnt River Summer Steelheado Chamberlain Creek Summer Steelheado Clearwater River Lower Mainstem Summer Steelheado Crab Creek Summer Steelheado Deschutes Crooked River Summer Steelheado Deschutes River Eastside Tributaries Summer Steelheado Deschutes River Westside Tributaries Summer Steelheado East Fork Lewis River Summer Steelheado East Fork Salmon River Summer Steelheado Entiat River Summer Steelheado Hood River Summer Steelheado Imnaha River Summer Steelheado Joseph Creek Summer Steelheado Kalama River Summer Steelheado Klickitat River Summer Steelheado Lemhi River Summer Steelheado Little and Lower Salmon River Summer Steelheado Lochsa River Summer Steelheado Lolo Creek Summer Steelheado Lower Grande Ronde Summer Steelhead

o Lower John Day Summer Steelheado Lower Malheur River Summer Steelheado Lower Middle Fork Salmon River Summer Steelheado Lower Owyhee River Summer Steelheado Methow River Summer Steelheado Middle Fork John Day Summer Steelheado Naches River Summer Steelheado North Fork Clearwater River Summer Steelheado North Fork John Day Summer Steelheado North Fork Lewis River Summer Steelheado North Fork Salmon River Summer Steelheado Okanogan River Summer Steelheado Pahsimeroi River Summer Steelheado Panther Creek Summer Steelheado Powder River Summer Steelheado Rock Creek Summer Steelheado Salmon River Upper Mainstem Summer Steelheado Sandy River Summer Steelheado Satus Creek Summer Steelheado Secesh River Summer Steelheado Selway River Summer Steelheado Snake Hells Canyon Summer Steelheado South Fork Clearwater River Summer Steelheado South Fork John Day Summer Steelheado South Fork Salmon River Summer Steelheado Toppenish Creek Summer Steelheado Touchet River Summer Steelheado Tucannon River Summer Steelheado Umatilla River Summer Steelheado Upper Grande Ronde Summer Steelheado Upper John Day Summer Steelheado Upper Malheur River Summer Steelheado Upper Middle Fork Salmon River Summer Steelheado Upper Owyhee River Summer Steelheado Upper Yakima River Summer Steelheado Walla Walla River Summer Steelheado Wallowa River Summer Steelheado Washougal River Summer Steelhead
o Wenatchee River Summer Steelheado White Salmon River Steelheado Willow Creek Summer Steelheado Wind River Summer Steelhead
Wintero Big Creek Winter Steelheado Calapooia River Winter Steelheado Cispus River Winter Steelheado Clackamas River Winter Steelheado Clatskanie River Winter Steelheado Columbia Gorge Tributaries Winter Steelheado Coweeman River Winter Steelheado East Fork Lewis River Winter Steelheado Elochoman Winter Steelheado Fifteenmile Subbasin Winter Steelheado Grays River Winter Steelheado Hood River Winter Steelheado Kalama River Winter Steelheado Klickitat River Winter Steelheado Lower Cowlitz River Winter Steelheado Middle Fork Willamette River Winter Steelheado Mill Creek Winter Steelheado Molalla/Pudding River Winter Steelheado North Fork Lewis River Winter Steelheado North Fork Toutle River Winter Steelheado North Santiam River Winter Steelheado Salmon Creek Winter Steelheado Sandy River Winter Steelheado Scappoose Creek Winter Steelheado South Fork Toutle River Winter Steelheado South Santiam River Winter Steelheado Tilton River Winter Steelheado Upper Columbia Gorge Tributaries Winter Steelheado Upper Cowlitz River Winter Steelheado Washougal River Winter Steelheado Willamette Westside Tributaries Winter Steelheado Youngs Bay Winter Steelhead
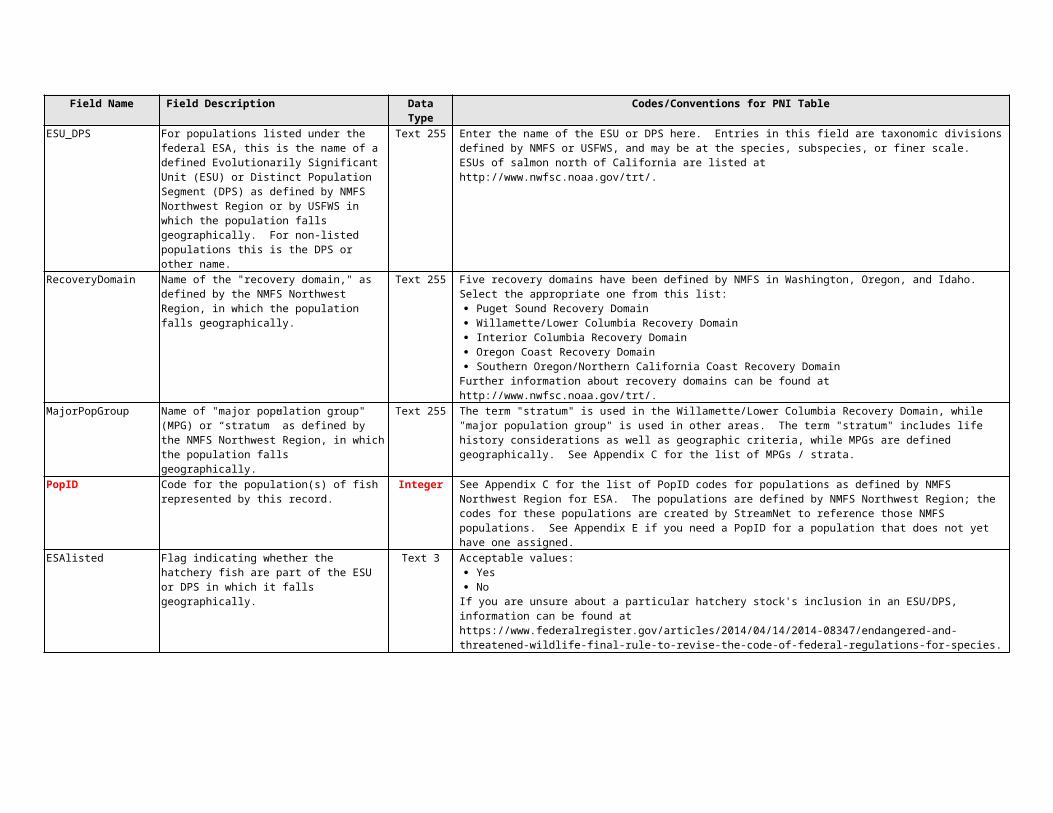
Appendix E. Defining New Populations and "Superpopulations"(Back to Table of Contents.)
To add a new population or a new "superpopulation" (a collection of populations) for use in the main HLI tables, contact StreamNet at [email protected] or 503-595-3100. The following steps, more or less, will be followed for any population or superpopulation that does not already have a PopID. Because we want to avoid duplicates and other data problems, new populations cannot be submitted using the API.
To add a new population:
1) Fill out a record for Table E1 (Populations) as fully as possible for each new population. Leave the PopID field blank for now.a) Along with the table, a geographic description (preferably in GIS format) for each population must be included. The RecordNote field can be
used instead if a text description suffices.b) If the population is listed in the CRITFC "population crosswalk" at http://www.critfc.org/fish-and-watersheds/fishery-science/data-resources-
for-scientists/columbia-basin-salmon-and-steelhead-crosswalk-project/, specify the name from the crosswalk in the RecordNote field. Doing this will satisfy the requirement under step 1a.
2) Submit the new record(s) to StreamNet ([email protected]) and request a PopID assignment for each population. Submit them as early as you can to allow spatial data QC work at StreamNet.
3) StreamNet will provide you with a PopID for each population.
To add a new superpopulation (a collection of populations):
1) Use the directions above to get a PopID for each population that is a component of the superpopulation, if necessary.2) Fill out a record for Table E1 (Populations) as fully as possible for each new superpopulation. Leave the PopID field blank for now.
a) Put the superpopulation's name in the CommonPopName field.b) No geographic descriptions or GIS data are required for superpopulations.
3) StreamNet will provide you with a PopID for each superpopulation (but you can temporarily use 1, 2, 3, etc. if defining more than one SuperPopulation).
4) Fill out records in Table E2 (SuperPopulations) for each superpopulation.a) All fields are required except PopFitNotes, which is required only if PopFit = "Portion".b) There will be one record in SuperPopulations for each component population.
i) For example, if a superpopulation consists of PopID #1 and #3 and #7, then there will be 3 records in the SuperPopulations table.ii) All 3 records for the superpopulation will have the same SuperPopID, which is the PopID provided in step 3.

Appendix E1. Populations TableThis table stores information about populations and superpopulations. Also included is who requested each record be added. At least one of the fields that indicates a population name must be filled in. (Back to Table of Contents.)
Field Name Field Description Data Type Codes/Conventions for Populations TablePopID StreamNet-defined code for the population (or
superpopulation) of fish represented by this record.Integer Must be null when submitting a new record.
PopTypeID Code for whether the record is for a single population or a superpopulation.
Byte 1 = Population2 – Superpopulation
CommonName Common name of the taxon of fish. Text 50 Enter the name of the taxon here, even if taxon name is included in the name of the population. Select from the following: Bull trout Chinook salmon Chum salmon Coho salmon Sockeye salmon SteelheadAdditional species may be added in the future: refer to http://old.streamnet.org/SpeciesInFW.html for common names.
Run Run(s) of fish. Text 20 Enter the name of the run here, even if run name is included in the name of the population. Entries in this field are not recognized as taxonomic divisions. Select from the following: Spring Summer Fall Winter Spring/summer Both summer & winter N/A [For species without recognized runs. For example, bull trout.]
ESU_DPS For populations listed under the federal ESA, this is the name of a defined Evolutionarily Significant Unit (ESU) or Distinct Population Segment (DPS) as defined by NMFS Northwest Region or by USFWS. For non-listed populations this is the DPS or other name.
Text 255 Enter the name of the ESU or DPS here. Entries in this field are taxonomic divisions defined by NMFS or USFWS, and may be at the species, subspecies, or finer scale. ESUs of salmon north of California are listed athttp://www.nwfsc.noaa.gov/trt/.
RecoveryDomain Name of the "recovery domain," as defined by the NMFS Northwest Region, in which the population falls geographically.
Text 255 Five recovery domains have been defined by NMFS in Washington, Oregon, and Idaho. Select the appropriate one from this list: Puget Sound Recovery Domain Willamette/Lower Columbia Recovery Domain Interior Columbia Recovery Domain Oregon Coast Recovery Domain Southern Oregon/Northern California Coast Recovery Domain
Further information about recovery domains can be found at http://www.nwfsc.noaa.gov/trt/.MajorPopGroup Name of "major population group" (MPG) or
“stratum” as defined by the NMFS Northwest Region, in which the population falls.
Text 255 The term "stratum" is used in the Willamette/Lower Columbia Recovery Domain, while "major population group" is used in other areas. The term "stratum" includes life history considerations as well as geographic criteria, while MPGs are defined geographically. See Appendix C for the list of MPGs / strata.
CBFWApopName Population name as defined by CBFWA for subbasin planning purposes, from subbasin plans and agencies.
Text 255 This may include non-listed populations, or cases where geographic area does not match a defined population of a listed species. See Appendix D for the list of these population names.
Fill this field even when a population's geographic extent coincides with NWR name for a listed population.CommonPopName Population name(s) used by local biologists. Text 255 Often this is simply the name of the population(s) as written on the original time series spreadsheets.

Field Name Field Description Data Type Codes/Conventions for Populations TableContactAgency Agency, tribe, or other entity that requested this
population be added to the list.Text 255 Entries in this field must precisely match a name in the StreamNet agency list. Here are the ones most likely needed. If yours
is not found here, contact your agency StreamNet representative, or call PSMFC's StreamNet staff at 503-595-3100. Columbia River Inter-Tribal Fish Commission Colville Confederated Tribes Confederated Tribes and Bands of the Yakama Indian Nation Confederated Tribes of the Umatilla Indian Reservation Confederated Tribes of the Warm Springs Reservation of Oregon Idaho Department of Fish and Game Nez Perce Tribe of Idaho Oregon Department of Fish and Wildlife Spokane Tribe of Indians Washington Department of Fish and Wildlife
RecordNote Information about the record. Text 255
Appendix E2. SuperPopulations TableThis table lists the individual component populations which, when combined, define a superpopulation. The records with the same SuperPopID all belong to the same superpopulation. Both the SuperPopID and the PopID of each component population must already exist in the Populations table before this table can be filled. (Back to Table of Contents.)
Field Name Field Description Data Type Codes/Conventions for Populations TableSuperPopID StreamNet-defined code for the superpopulation. Integer Foreign key to the Populations table's PopID field.PopID StreamNet-defined code for a component
population.Integer Foreign key to the Populations table's PopID field.
PopFit Categorization of how well the geographic extent of the data corresponds to the geographic definition of the component population.
Text 8 Acceptable values: [Do not include comments in brackets.] Same [Represents one entire population, the whole population, and nothing but the population.] Portion [Represents a portion of one population. (Describe in PopFitNotes field.)]
PopFitNotes Text description of why only part of the component population is included in the superpopulation.
Memo This field is required if the PopFit field is "Portion".If the PopFit field is "Portion" describe the lack of correspondence between the whole component population and that part of it that is part of the superpopulation.
ContactAgency Agency, tribe, or other entity that requested this population be added to the list.
Text 255 Entries in this field must precisely match a name in the StreamNet agency list. Here are the ones most likely needed. If yours is not found here, contact your agency StreamNet representative, or call PSMFC's StreamNet staff at 503-595-3100. Columbia River Inter-Tribal Fish Commission Colville Confederated Tribes Confederated Tribes and Bands of the Yakama Indian Nation Confederated Tribes of the Umatilla Indian Reservation Confederated Tribes of the Warm Springs Reservation of Oregon Idaho Department of Fish and Game Nez Perce Tribe of Idaho Oregon Department of Fish and Wildlife Spokane Tribe of Indians Washington Department of Fish and Wildlife
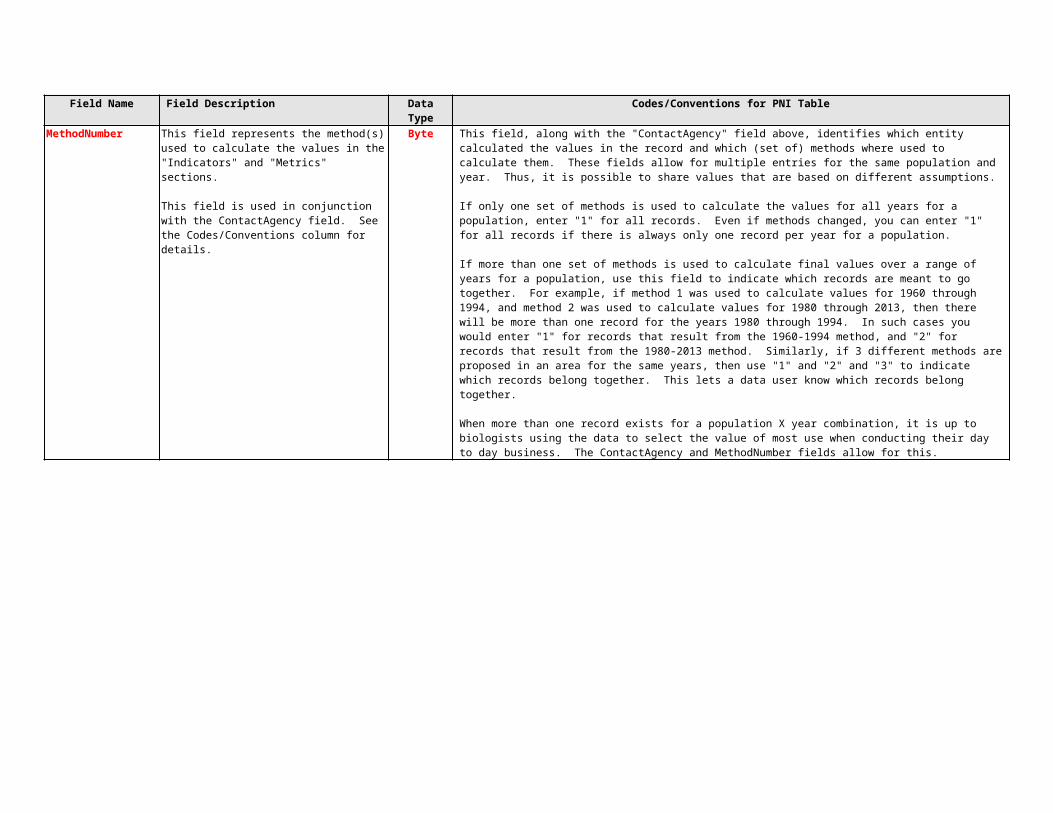
Appendix F. MS-Access 2010 Data Types(Back to Table of Contents.)
MS-Access 2010 Data Type Purpose Characteristics Storage Required Per Record
Currency Numbers.Appropriate for numbers other than currency.
Zero to 15 digits to the left ofthe decimal point and zero to 4 digits to the right. 8 bytes
Date/Time Date and time.
Years 100 through 9999.This data type stores date AND time -- it is not possible
to store one without the other.A date with no time is interpreted as 00:00 in the
morning.A time with no date is interpreted as 12/30/1899.
Calculations among records recognize and use thesedefault values in calculations, so must be accounted
for when using the data.
8 bytes
Memo Long text entries.(Including numbers not used in calculations.) Up to 63,999 characters in length.
2 bytes / character for Unicode.1 byte / character if Unicode compression enabled and
entry is under 4,096 characters.
Number (Byte) Whole numbers from 0 to 255. Integers only: no decimal places.No negative numbers. 1 byte
Number (Decimal) Numbers from -9.999 X 1027 to 9.99927. Decimal places and negative numbers allowed.Up to 28 significant digits. 12 bytes
Number (Integer) Whole numbers from -32,768 to 32,767. Integers only: no decimal places. 2 bytes
Number (Long Integer) Whole numbers–2,147,483,648 to 2,147,483,647. Integers only: no decimal places. 4 bytes
Number (Single) Floating point numbers–3.402823 X 1038 to 3.402823 X 1038. Up to 7 significant digits. 4 bytes
Number (Double) Floating point numbers–1.79769313486231 X 10308 to 1.79769313486231 X 10308. Up to 15 significant digits. 8 bytes
ReplicationID Globally unique identifier (GUID). Creates a (presumably) unique value to identify a record. 16 bytes
Text Text.(Including numbers not used in calculations.)
Up to 255 characters in length.Maximum allowed length can be shorter than 255.
2 bytes / character for Unicode.1 byte / character if Unicode compression enabled.
Yes/No Storage of values that can have only one of two values.Yes/No; On/Off; True/False.
Cannot be null. Must be one of the 2 values.It is not possible to indicate such things as
"Not applicable" or "Unknown".1 bit

Related Documents


