Coordinate Regulation of Glutathione Biosynthesis and Release by Nrf2-Expressing Glia Potently Protects Neurons from Oxidative Stress Andy Y. Shih, 1 Delinda A. Johnson, 3 Gloria Wong, 1 Andrew D. Kraft, 3 Lei Jiang, 1 Heidi Erb, 1 Jeffrey A. Johnson, 3,4,5,6 and Timothy H. Murphy 1,2 Kinsmen Laboratory of Neurological Research and Departments of 1 Psychiatry and 2 Physiology, University of British Columbia, Vancouver, British Columbia, V6T 1Z3, Canada, and 3 School of Pharmacy, 4 Molecular and Environmental Toxicology Center, 5 Waisman Center, and 6 Center for Neuroscience, University of Wisconsin, Madison, Wisconsin 53705-2222 Astrocytes have a higher antioxidant potential in comparison to neurons. Pathways associated with this selective advantage include the transcriptional regulation of antioxidant enzymes via the action of the Cap‘n’Collar transcription factor Nrf2 at the antioxidant response element (ARE). Here we show that Nrf2 overexpression can reengineer neurons to express this glial pathway and enhance antioxidant gene expression. However, Nrf2-mediated protection from oxidative stress is conferred primarily by glia in mixed cultures. The anti- oxidant properties of Nrf2-overexpressing glia are more pronounced than those of neurons, and a relatively small number of these glia ( 1% of total cell number added) could protect fully cocultured naive neurons from oxidative glutamate toxicity associated with glutathione (GSH) depletion. Microarray and biochemical analyses indicate a coordinated upregulation of enzymes involved in GSH biosynthesis (xCT cystine antiporter, -glutamylcysteine synthetase, and GSH synthase), use (glutathione S-transferase and glutathione reductase), and export (multidrug resistance protein 1) with Nrf2 overexpression, leading to an increase in both media and intracellular GSH. Selective inhibition of glial GSH synthesis and the supplementation of media GSH indicated that an Nrf2-dependent increase in glial GSH synthesis was both necessary and sufficient for the protection of neurons, respectively. Neuroprotection was not limited to overex- pression of Nrf2, because activation of endogenous glial Nrf2 by the small molecule ARE inducer, tert-butylhydroquinone, also protected against oxidative glutamate toxicity. Key words: Nrf2; xCT; system x c – ; phase II detoxification enzymes; astrocyte; oxidative glutamate toxicity; glutathione; cystine depriva- tion; tert-butylhydroquinone; antioxidant response element; quinone reductase; oxidative stress; neuroprotection Introduction Glial cells (astrocytes) are known to interact with surrounding neurons by nourishing, protecting, and modulating growth and excitability (Travis, 1994). Although it has been shown repeatedly that astrocytes can improve neuronal survival, the mechanisms of protection remain uncertain. Astrocytes have stronger antioxida- tive potential than neurons (Raps et al., 1989; Makar et al., 1994; Lucius and Sievers, 1996) and can protect neurons from oxidative stress induced by various compounds such as dopamine, H 2 O 2 , and 6-hydroxydopamine and nitric oxide (Desagher et al., 1996; Mena et al., 1996; Chen et al., 2001). One potential defense against the toxicity of reactive oxygen species (ROS) is the induc- tion of a family of phase II detoxification enzymes (Fahey et al., 1997; Kensler, 1997). Data from our lab and others suggest that this response is expressed preferentially in astrocytes, with con- siderably lower levels in neurons (Ahlgren-Beckendorf et al., 1999; Eftekharpour et al., 2000; Murphy et al., 2001; Johnson et al., 2002). Originally thought to be restricted to promoting xeno- biotic conjugation with endogenous ligands, such as glutathione (GSH) (Hayes and Pulford, 1995; Primiano et al., 1997), the ob- served functions of phase II enzymes have broadened recently. Now, there are 2 dozen known phase II enzyme genes, with more to be elucidated via current technologies (Li et al., 2002). Sharing common regulatory pathways, these enzymes possess chemically versatile antioxidant properties and are inducible by various agents, including those found in a normal diet (Fahey et al., 1997; Gao et al., 2001). Treatment of mammalian cells with electrophilic agents provokes a cellular response leading to the coordinated transcription of phase II genes (Prestera et al., 1993). A unique cis-acting regulatory sequence, termed the antioxidant response element (ARE), is essential for the constitutive and in- duced expression of many antioxidant genes involved in the phase II pathway (Friling et al., 1990; Rushmore et al., 1991; Nguyen et al., 2000). Several lines of evidence suggest that NF- E2-related factor 2 (Nrf2) is an important transcription factor responsible for upregulating ARE-mediated gene expression (Itoh et al., 1997, 1999; Alam et al., 1999; Hayes et al., 2000; Ishii et al., 2000). Studies that use knock-out mice have shown that Nrf2 was part of a transcription factor complex required for regula- Received Dec. 10, 2002; revised Jan. 29, 2003; accepted Feb. 6, 2003. This work was supported by a Rick Hansen Neurotrauma Initiative and a Michael Smith Foundation for Health Research (MSFHR) studentship award (A.Y.S); a grant from the Heart and Stroke Foundation of British Columbia and Yukon (T.H.M.); Grants ES08089 (J.A.J.), ES10042 (J.A.J.), and ES09090 (Environmental Health Sciences Center) from the National Institute of Environmental Health Sciences; and by the Burroughs Wellcome New Investigator in Toxicological Sciences Award (J.A.J.). T.H.M. is a Canadian Institutes of Health Research investigator and MSFHR senior scholar, and is supported by a grant from the Canadian Stroke Network. We thank Jessica Yu for excellent technical assistance, Matthew Slattery and the Molecular Biology Core Facility of the University of Wisconsin Environmental Health Science Center for conducting the gene array hybridizations, Dr. Alaa el-Husseini for use of the Axiovert 200M microscope, and Yingru Lui for anti-HO-1 antibodies. Correspondence should be addressed to either of the following: Dr. Timothy H. Murphy, 4N1-2255 Wesbrook Mall, University of British Columbia, Vancouver, BC, V6T 1Z3, Canada, E-mail: [email protected]; or Dr. Jeffrey A. Johnson, School of Pharmacy, University of Wisconsin, 6125 Rennebohm Hall, 777 Highland Avenue, Madison, WI 53705-2222, E-mail: [email protected]. Copyright © 2003 Society for Neuroscience 0270-6474/03/233394-13$15.00/0 3394 • The Journal of Neuroscience, April 15, 2003 • 23(8):3394 –3406

Welcome message from author
This document is posted to help you gain knowledge. Please leave a comment to let me know what you think about it! Share it to your friends and learn new things together.
Transcript

Coordinate Regulation of Glutathione Biosynthesis andRelease by Nrf2-Expressing Glia Potently Protects Neuronsfrom Oxidative StressAndy Y. Shih,1 Delinda A. Johnson,3 Gloria Wong,1 Andrew D. Kraft,3 Lei Jiang,1 Heidi Erb,1 Jeffrey A. Johnson,3,4,5,6 andTimothy H. Murphy1,2
Kinsmen Laboratory of Neurological Research and Departments of 1Psychiatry and2Physiology, University of British Columbia, Vancouver, BritishColumbia, V6T 1Z3, Canada, and 3School of Pharmacy, 4Molecular and Environmental Toxicology Center, 5Waisman Center, and 6Center for Neuroscience,University of Wisconsin, Madison, Wisconsin 53705-2222
Astrocytes have a higher antioxidant potential in comparison to neurons. Pathways associated with this selective advantage include thetranscriptional regulation of antioxidant enzymes via the action of the Cap‘n’Collar transcription factor Nrf2 at the antioxidant responseelement (ARE). Here we show that Nrf2 overexpression can reengineer neurons to express this glial pathway and enhance antioxidantgene expression. However, Nrf2-mediated protection from oxidative stress is conferred primarily by glia in mixed cultures. The anti-oxidant properties of Nrf2-overexpressing glia are more pronounced than those of neurons, and a relatively small number of these glia(� 1% of total cell number added) could protect fully cocultured naive neurons from oxidative glutamate toxicity associated withglutathione (GSH) depletion. Microarray and biochemical analyses indicate a coordinated upregulation of enzymes involved in GSHbiosynthesis (xCT cystine antiporter, �-glutamylcysteine synthetase, and GSH synthase), use (glutathione S-transferase and glutathionereductase), and export (multidrug resistance protein 1) with Nrf2 overexpression, leading to an increase in both media and intracellularGSH. Selective inhibition of glial GSH synthesis and the supplementation of media GSH indicated that an Nrf2-dependent increase in glialGSH synthesis was both necessary and sufficient for the protection of neurons, respectively. Neuroprotection was not limited to overex-pression of Nrf2, because activation of endogenous glial Nrf2 by the small molecule ARE inducer, tert-butylhydroquinone, also protectedagainst oxidative glutamate toxicity.
Key words: Nrf2; xCT; system xc–; phase II detoxification enzymes; astrocyte; oxidative glutamate toxicity; glutathione; cystine depriva-
tion; tert-butylhydroquinone; antioxidant response element; quinone reductase; oxidative stress; neuroprotection
IntroductionGlial cells (astrocytes) are known to interact with surroundingneurons by nourishing, protecting, and modulating growth andexcitability (Travis, 1994). Although it has been shown repeatedlythat astrocytes can improve neuronal survival, the mechanisms ofprotection remain uncertain. Astrocytes have stronger antioxida-tive potential than neurons (Raps et al., 1989; Makar et al., 1994;Lucius and Sievers, 1996) and can protect neurons from oxidativestress induced by various compounds such as dopamine, H2O2,and 6-hydroxydopamine and nitric oxide (Desagher et al., 1996;Mena et al., 1996; Chen et al., 2001). One potential defenseagainst the toxicity of reactive oxygen species (ROS) is the induc-tion of a family of phase II detoxification enzymes (Fahey et al.,
1997; Kensler, 1997). Data from our lab and others suggest thatthis response is expressed preferentially in astrocytes, with con-siderably lower levels in neurons (Ahlgren-Beckendorf et al.,1999; Eftekharpour et al., 2000; Murphy et al., 2001; Johnson etal., 2002). Originally thought to be restricted to promoting xeno-biotic conjugation with endogenous ligands, such as glutathione(GSH) (Hayes and Pulford, 1995; Primiano et al., 1997), the ob-served functions of phase II enzymes have broadened recently.Now, there are �2 dozen known phase II enzyme genes, withmore to be elucidated via current technologies (Li et al., 2002).Sharing common regulatory pathways, these enzymes possesschemically versatile antioxidant properties and are inducible byvarious agents, including those found in a normal diet (Fahey etal., 1997; Gao et al., 2001). Treatment of mammalian cells withelectrophilic agents provokes a cellular response leading to thecoordinated transcription of phase II genes (Prestera et al., 1993).A unique cis-acting regulatory sequence, termed the antioxidantresponse element (ARE), is essential for the constitutive and in-duced expression of many antioxidant genes involved in thephase II pathway (Friling et al., 1990; Rushmore et al., 1991;Nguyen et al., 2000). Several lines of evidence suggest that NF-E2-related factor 2 (Nrf2) is an important transcription factorresponsible for upregulating ARE-mediated gene expression(Itoh et al., 1997, 1999; Alam et al., 1999; Hayes et al., 2000; Ishiiet al., 2000). Studies that use knock-out mice have shown thatNrf2 was part of a transcription factor complex required for regula-
Received Dec. 10, 2002; revised Jan. 29, 2003; accepted Feb. 6, 2003.This work was supported by a Rick Hansen Neurotrauma Initiative and a Michael Smith Foundation for Health Research
(MSFHR) studentship award (A.Y.S); a grant from the Heart and Stroke Foundation of British Columbia and Yukon (T.H.M.);GrantsES08089(J.A.J.),ES10042(J.A.J.),andES09090(EnvironmentalHealthSciencesCenter)fromtheNational InstituteofEnvironmental Health Sciences; and by the Burroughs Wellcome New Investigator in Toxicological Sciences Award (J.A.J.).T.H.M. is a Canadian Institutes of Health Research investigator and MSFHR senior scholar, and is supported by a grant fromthe Canadian Stroke Network. We thank Jessica Yu for excellent technical assistance, Matthew Slattery and the MolecularBiology Core Facility of the University of Wisconsin Environmental Health Science Center for conducting the gene arrayhybridizations, Dr. Alaa el-Husseini for use of the Axiovert 200M microscope, and Yingru Lui for anti-HO-1 antibodies.
Correspondence should be addressed to either of the following: Dr. Timothy H. Murphy, 4N1-2255 WesbrookMall, University of British Columbia, Vancouver, BC, V6T 1Z3, Canada, E-mail: [email protected]; or Dr.Jeffrey A. Johnson, School of Pharmacy, University of Wisconsin, 6125 Rennebohm Hall, 777 Highland Avenue,Madison, WI 53705-2222, E-mail: [email protected] © 2003 Society for Neuroscience 0270-6474/03/233394-13$15.00/0
3394 • The Journal of Neuroscience, April 15, 2003 • 23(8):3394 –3406

tion of the mouse glutathione S-transferase (GST) and NADPH:quinone oxidoreductase (NQO1) genes (Itoh et al., 1997; Hayes etal., 2000). In addition, Nrf2/small Maf heterodimers bind to the AREsequence with high affinity during regulation of the GST and NQO1genes (Venugopal and Jaiswal, 1996). From these observations Nrf2appears to be the major transcription factor necessary for ARE acti-vation and thus essential for the induction of phase II detoxificationenzymes. In this study we use replication-deficient adenoviruses tooverexpress Nrf2 protein in both neurons and glia to determinewhether augmentation of the ARE-mediated antioxidant responsemight reduce neuronal vulnerability to oxidative stress.
Materials and MethodsMaterials. All chemicals were purchased from Sigma-Aldrich Canada(Ontario, Canada) unless otherwise stated.
Plasmids and adenoviruses. pEF mammalian expression plasmids car-rying cDNA encoding mouse Nrf2 and Nrf2DN were a generous giftfrom Dr. Jawed Alam (Alton Ochsner Medical Foundation, New Or-leans, LA; Alam et al., 1999). Rat ARE sequences were obtained from theNQO1 promotor. To make the human placental alkaline phosphatase(hPAP) reporter construct (rQR51), we excised a 51 bp ARE/electrophileresponse element (EpRE) fragment by using restriction sites (XhoI andHindIII) flanking the ARE sequence from a parent luciferase expressionvector (Moehlenkamp and Johnson, 1999) and subcloned it into thepGEM-7zf vector [American Type Culture Collection (ATCC), Manas-sas, VA] upstream of the hPAP reporter gene. A mutant rQR51(rQR51mut) was made by replacing the original core ARE sequence witha cassette encoding a mutant ARE core sequence. The BglII/NheI excis-able cassette was constructed with the following oligonucleotides(Sigma-Genosys, The Woodlands, TX). The 10 bp mutation is under-lined, and the region corresponding to the ARE core sequence is shown inbold: 5�-CTAGCTCGAGATCCTCAGAGATTTCAGTCTAGAGTCA-CACGCAAACAGGAAAATCA-3� and 3�-GAGCTCTAGGAGTCTCT-AAAGTCAGATCTCAGTGTGCGTTTGTCCTTTTAGTCTAG-5�.
Recombinant adenoviral vectors were constructed by using the Cre-lox system (Canadian Stroke Network core facility, University of Ottawa,Ottawa, Canada; Hardy et al., 1997). The Nrf2 and Nrf2DN cDNAs wereexcised from the pEF vector by using restriction enzymes NotI, and NotIand HindIII, respectively. All viruses were titered on human embryonickidney 293 (HEK293) cells.
Mammalian cell culture. Mixed neuronal– glial cultures were preparedfrom the cerebral cortex of Wistar rat fetuses embryonic day 17–18 (E17–E18), using the papain dissociation method (Murphy et al., 1990). Viablecells were plated at 1 � 10 6 cells/ml on poly-D-lysine-coated plastic cul-ture plates (Costar, Pleasanton, CA) in B27-supplemented Neurobasalmedium (Invitrogen, San Diego, CA). After 1 d in vitro (1 DIV) themedium was changed to MEM (Invitrogen) supplemented with 5.5 gm/lD-glucose, 2 mM glutamine, 10% fetal bovine serum (FBS; HyClone,Logan, UT), 1 mM Na �-pyruvate, 100 U/ml penicillin, and 0.1 mg/mlstreptomycin (MEM-pyr). This medium change was required to reduceexcessive antioxidant levels from the B27 medium. Enriched neuronalcultures used for Western blot analysis were prepared by culturing cor-tical cultures in the presence of 10 �M 5-fluoro-2�-deoxyuridine/uridinethat was replaced every 4 d until the cultures were harvested at 14 DIV.Enriched glial cultures were prepared from 1–2 d postnatal rat pups.Cortices were dissected, minced, and used in the papain dissociationmethod. Cells were plated in MEM supplemented with 10% FBS, 5%heat-inactivated horse serum (HyClone), 2 mM glutamine, 100 U/mlpenicillin, and 0.1 mg/ml streptomycin in noncoated 10 cm plates (2plates per brain). After 1 DIV the medium was replaced, and the glia wereallowed to grow for 3 d. Adherent neurons were removed from the glialculture by repeated pipetting of the medium. All glial cultures were usedwithin 10 DIV because older, quiescent cultures appeared to lack theantioxidant response. These conditions for isolating glial cells mainlyresult in a population of type I and II astrocytes. Anti-glial fibrillary acidprotein (GFAP) staining suggests that the glial cultures are mainly of theastrocyte phenotype. For a simple neuron– glial coculture setup virus-infected glia were trypsinized and transplanted directly into naive (no
contact with virus) cortical culture after 24 hr of transgene expression(coculture; Fig. 1 A). Glia were transplanted with concentrations rangingfrom 0.1 � 10 4 to 2 � 10 4 cells/ml, a plating density of 0.1–2% of thetotal number of cells per well. Cocultures with glia that were separatedphysically from neurons (membrane-delimited coculture) consisted ofnaive cortical cultures prepared in 24-well plates (neuronal compart-ment) and infected glia separated in culture plate inserts with 0.4 �mpore size (glial compartment; Millipore, Bedford, MA) (Fig. 1 B). In-fected glia were trypsinized 6 hr after infection and plated at 2 � 10 4 cellsper insert, a plating density of 2% of the total cell number, into thecollagen-coated inserts. For depletion of glial glutathione the glial com-partment was pretreated with 200 �M L-buthionine sulfoximine (BSO)for 24 hr, then preincubated for 10 min in fresh medium, and washedtwice before transfer into the neuronal compartment. For both setups thetransplanted glia were washed three times with PBS to prevent the trans-fer of virus to the neuronal compartment.
HEK293 (ATCC) were plated at a density of 1 � 105 cells/ml on 10 cmplates (Costar). Culture medium was prepared from MEM supplementedwith 10% FBS, 1 mM Na�-pyruvate, 2 mM L-glutamine, and 100 U/ml pen-icillin, 0.1 mg/ml streptomycin. After plating, the cells were allowed to growfor �16 hr before commencement of transfection. All cultures were main-tained at 37°C in a humidified 95% O2/5% CO2 incubator.
Transfections and infections. HEK293 cells were transiently transfectedby the calcium-phosphate method (10 �g/10 cm plate) (Chen andOkayama, 1987) or with Polyfect reagent (Qiagen, Chatsworth, CA) ac-cording to the manufacturer’s protocol. The transfection efficiency wastypically 60 –70% as assessed by �-gal staining. Mature (14 DIV) primarycultures of mixed cortical neurons and glia were transiently transfectedwith the ballistic gene transfer method by using a Helios gene gun (Bio-Rad, Hercules, CA) firing 0.6 �m gold particles coated with DNA (1 �gDNA/mg gold loading ratio). For adenovirus infection the immaturecortical cultures were infected at 1 DIV by virus diluted to a multiplicityof infection of 200 in MEM-pyr. The cultures were allowed to express
Figure 1. Schematic explanation of neuron– glial coculture setups used in this study. A, For asimple neuron– glial coculture setup the virus-infected glia were transplanted directly into naive (nocontact with virus) mixed neuronal– glial cultures after 24 hr of transgene expression. B, Some exper-iments required a setup by which glia were separated physically from neurons (membrane-delimitedcoculture). This system consisted of naive cultures prepared in 24-well plates; infected glia were sep-arated by a culture plate insert. Both cocultures were maintained for 24 hr and then exposed to 3 mM
glutamate (Glu) for a further 24 hr, followed by quantitation of neuronal viability.
Shih et al. • Nrf2 Upregulates Glial GSH and Promotes Neuroprotection J. Neurosci., April 15, 2003 • 23(8):3394 –3406 • 3395

transgenes for 48 hr before usage. All infected cultures were examined foradequate infection efficiency (25% of neurons, 80% of glia) as assessed bygreen fluorescent protein (GFP) fluorescence.
Toxicity treatment. For all toxicity studies the cortical cultures wereused in their immature state (1– 4 DIV). MEM-pyr was replaced withMEM supplemented with 5.5 gm/l D-glucose, 2 mM glutamine, 5% FBS,100 U/ml penicillin, 0.1 mg/ml streptomycin (MEM/5% FBS) containingthe indicated concentrations of L-glutamate, H2O2, or staurosporine.Cells were exposed to all toxins for 24 hr. No inhibitors of GSH oxidationwere added to the medium during the toxicity experiments.
Determination of neuronal viability. Neuronal viability was evaluatedby two methods: (1) manual counting of cells labeled with fluorescentantibodies to neuron-specific enolase (NSE) or GFP, and (2) 3-(4,5-dimethylthiazol-2-yl)-2,5-diphenyl-2 H-tetrazolium bromide (MTT)cell viability assay. For cell counting after immunocytochemistry, 10pictures of each experimental group were taken with a 20� objective(Zeiss, Oberkochen, Germany), using wide-field fluorescence mi-croscopy (Zeiss Axiophot) with a color CCD camera (Sony power-HAD, model DXC-950, Tokyo, Japan). The imaged areas were chosenrandomly from at least three different wells per experimental group.All counting was performed with the rater blinded to the experimen-tal conditions that were used. To confirm cell counts, we scanned the96-well plates that were used for counting with a Fluoroskan fluores-cence plate reader (excitation, 530 nm; emission, 620 nm; Lab-systems, Helsinki, Finland) to measure red fluorescence from NSE-positive cells, although not all experiments could be processed thisway; absolute levels of NSE fluorescence could vary because of back-ground staining or cell density. All measurements made with theFluoroskan were background-subtracted, where background was thefluorescence measured from ad-GFP-infected wells treated with 3 mM
glutamate (see Fig. 6 B,C), 30 �M H2O2 (see Fig. 5A), or 10 �M stau-rosporine (see Fig. 5B) for 24 hr. For the MTT assay the cultures wereincubated with 0.45 mg/ml MTT diluted in MEM/5% FBS with nophenol red for 2 hr at 37°C after the toxicity studies. Then the MTTstaining solution was removed and replaced with PBS and an equalvolume of MTT lysis buffer consisting of 20% SDS in 50% dimethyl-formamide, pH 4.7. The formazan crystals were allowed to dissolveovernight before the plate was read on a Multiskan plate reader (ab-sorbance, 560 nm; Labsystems). In mixed neuron– glia cortical cul-tures glial-mediated MTT turnover accounted for approximatelyone-half of the total MTT reduction. To eliminate the glial compo-nent of MTT reduction, we used measurements from control wellstreated with 3 mM glutamate for 24 hr, in which nearly all neurons haddied, as a background that was subtracted from all other groups (seeFigs. 7C, 8 A).
Western blot analysis and immunocytochemistry. Cells were washed inPBS and harvested in PBS containing 2 �g/ml aprotinin plus (in mM) 1phenylmethylsulfonyl fluoride, 1 EGTA, and 1 EDTA; the cells were son-icated for 10 sec to make crude lysate. Protein concentration was mea-sured with the bicinchoninic acid method (BCA; Pierce, Rockford, IL).Samples prepared in loading buffer (7 mg/ml DTT, 6% SDS, 30% glyc-erol, and 0.38 M Tris, pH 6.8, and pyronin Y) were denatured by boilingfor 2 min before loading. For SDS-PAGE 30% acrylamide gels were usedto run HEK293 protein lysates (10 �g loaded) and enriched neuron orglial lysates (30 �g loaded), respectively. Antibody reactivity was detectedby enhanced chemiluminescence substrate (Amersham Biosciences, Ar-lington Heights, IL). For immunocytochemistry after toxicity experi-ments the cultures were washed twice with 37°C PBS to remove dead cellsand cellular debris, were fixed with 2% paraformaldehyde (PFA) for 10min, and then were incubated with primary and secondary antibodies.Immunostained cells were mounted in Fluoromount-G (Southern Bio-technology Associates, Birmingham, AL). Antibodies used in this studyinclude anti-Nrf2 from rabbit (1:200 dilution; Santa Cruz Biotechnology,Santa Cruz, CA), anti-GFP from mouse (1:1000; Boehringer Mannheim,Indianapolis, IN), anti-NSE from rabbit (1:2000; Polysciences, War-rington, PA), anti-GFAP from rabbit (1:100; Sigma-Aldrich Canada),anti-mouse Alexa Fluor 488 from goat (1:2000; Molecular Probes, Eu-gene, OR), anti-actin from goat (1:1000; Santa Cruz Biotechnology),anti-heme oxygenase 1 from rabbit (1:500; Stressgen Biotechnologies,
San Diego, CA), anti-rabbit horseradish peroxidase (HRP) from sheep(1:5000; Amersham Biosciences), and anti-goat HRP from donkey (1:5000; Santa Cruz Biotechnology).
Densitometry. Densitometric analysis of Western blots was performedwith the Scion Imaging program (version � 4.0.2, Scion, Frederick, MD).Band intensities were measured by taking the mean pixel intensity. Allband measurements were background-subtracted.
[3H]-glutamate uptake assay. L-[ 3H]-glutamate uptake was measuredas described previously (Shih and Murphy, 2001). Briefly, infected im-mature cortical cultures were preincubated in Na �-free HBSS for 10 minat 37°C before being incubated with Na �-free HBSS containing 38 nM
L-[ 3H]-glutamate (Amersham Biosciences) and the indicated unlabeledcompounds (1 mM) for a further 20 min at 37°C. Then the cells werewashed three times with ice-cold Na �-free HBSS and lysed with 0.5%Triton X-100 in 0.1 M potassium phosphate buffer. Radioactivity wasdetermined by liquid scintillation counting and normalized to proteinconcentration for each sample.
Placental alkaline phosphatase and quinone reductase staining. ForhPAP staining (Murphy et al., 2001) the cultures were rinsed with PBSand fixed with 4% PFA and 0.2% glutaraldehyde for 10 min. Preparationswere rinsed again with PBS and incubated at 65°C for 30 min to inactivateany endogenous heat-labile alkaline phosphatase activity. The prepara-tions were stained with 1 mg/ml nitroblue tetrazolium (NBT) and 1mg/ml 5-bromo-4-chloro-3-indoyl phosphate dissolved in 0.1 M Trisbuffer, pH 10. The staining reaction was performed at 37°C for �30 – 40min and was terminated by washing with PBS. Pictures were taken with a60� objective (Zeiss) that used conventional light microscopy with acolor CCD camera. For NQO1 staining (Murphy et al., 1998) the cellswere fixed with 2% PFA for 10 min, washed with PBS, and preincubatedin buffer A (25 mM Tris, 0.08% Triton X-100, 2 mg/ml BSA, pH 7.4) for30 min. The preincubation solution was replaced with buffer containing100 �M NBT and 100 �M LY 83583 (Alexis Pharmaceuticals, San Diego,CA), and staining was initiated with the addition of NADPH (1 mM
final). The reaction was incubated at 37°C for 20 –30 min and terminatedby washing in buffer A. Differential interference contrast (DIC) andphase-contrast pictures were taken before and after staining, respectively,using a 63� oil immersion objective (Zeiss) on an Axiovert 200M mi-croscope (Zeiss) equipped with an AxioCam HRm digital camera (Zeiss).DIC and phase-contrast images were overlaid for final presentation.
Total intracellular GSH assay and effluxed GSH assay. Total GSH wasquantified by the method of Tietze (1969). Briefly, cells were collected in PBSand sonicated for 10 sec on ice. The acid-soluble fraction was obtained byadding perchloric acid to a final concentration of 3%, followed by centrifu-gation at 14,000 � g for 10 min. The acid-soluble fraction was neutralized topH 7 with 0.5 M KOH/50 mM Tris. After the removal of precipitate (potassi-um perchlorate) by a second centrifugation, 50 �l aliquots of sample werecombined with 100 �l of reaction mixture consisting of 2.5 ml of 1 mM
5,5�,dithiobis-(2-nitrobenzoic acid) (DTNB), 2.5 ml of 5 mM NADPH, and2.65 ml of phosphate buffer (100 mM NaPO4, pH 7.5, 1 mM EDTA), gluta-thione reductase (5 U/ml final). The increase in A412 from GSH-mediatedreduction of DTNB was measured at 30 sec intervals over 30 min. GSHcontent among treatment groups was normalized to protein. For GSH effluxassays the MEM/5% FBS with no phenol red was incubated with cultures for24 hr and used in the same procedure minus the removal of proteins viaperchloric acid. In some experiments the proteins were removed by filtrationthrough a 3 kDa molecular weight cutoff membrane (Nanosep3K Omega,Pall Gelman Laboratory, Sydney, Australia). Monochlorobimane (mCBi;Molecular Probes) staining was performed by incubating adenovirus-infected cultures with 60 �M mCBi for 20 min (Tauskela et al., 2000). Stainedcultures were washed twice with PBS to remove excess mCBi and were fixedwith 4% PFA with 0.2% glutaraldehyde for 20 min. At this stage the cellseither were viewed directly for fluorescence (excitation, 360 nm; emission,410 nm) or were stained further for GFP and GFAP, using immunocytochem-istry.QuantitativemeasurementsofmCBi/GSHadductfluorescenceweremadewith Photoshop (Adobe Systems, Mountain View, CA) by taking mean intensi-ties from individual cells. All values were background-subtracted.
RT-PCR and microarray analysis. Total RNA was isolated from in-fected cultures with Trizol reagent (Invitrogen) according to the manu-facturer’s instructions. RNA (1 �g) was reverse-transcribed by using
3396 • J. Neurosci., April 15, 2003 • 23(8):3394 –3406 Shih et al. • Nrf2 Upregulates Glial GSH and Promotes Neuroprotection

Oligo-dT 15 primer in accordance with the RT System (Promega, Mad-ison, WI). Then the resulting cDNA was PCR-amplified by using primersets for the genes: GFP, 5�-GAG CTG TTC ACC GGG GTG GTG-3� and5�-GAG CTC GAG ATC TGA GTC CGG-3�; mouse Nrf2, 5�-TGA AGCTCA GCT CGC ATT GAT CC-3� and 5�-AAG ATA CAA GGT GCT GAGCCG CC-3�; rat xCT, 5�-TTG CAA GCT CAC AGC AAT TC-3� and5�-CGT CAG AGG ATG CAA AAC AA-3�; actin, 5�-CCC AGA GCAAGA GAG GTA TC-3� and 5�-AGA GCA TAG CCC TCG TAG AT-3�.PCR conditions were as follows: initial denaturing step that used 1 cycleat 95°C for 3 min, followed by 35 cycles at 95°C for 30 sec, and theappropriate primer annealing temperature (ranging from 53.4 to 56.6°C)for 1 min, then 72°C for 1.5 min, and a final cycle at 72°C for 5 min. ThePCR products were separated on a 1.4% agarose gel containing ethidiumbromide. Stained cDNA was visualized by using an ultraviolet lightsource. Microarray analysis was performed as previously described (Liand Johnson, 2002; Li et al., 2002; Stein and Johnson, 2002), using totalRNA extracted from primary cultures with Trizol reagent (Invitrogen).Briefly, cDNA was synthesized from total RNA by reverse transcriptionwith T7-(dT)24 primer incorporating a T7 RNA polymerase promotor,followed by a DNA polymerase reaction (MessageAmp kit, Ambion,Austin, TX). Biotin-labeled cRNA was prepared by an in vitro transcrip-tion reaction that used the cDNA from above (MessageAmp kit, Ambion;biotin-labeled nucleotide triphosphates, Enzo Biochem, New York, NY).Labeled cRNA was fragmented by incubation at 94°C for 35 min in thepresence of (in mM) 40 Tris-acetate, pH 8.1, 100 potassium acetate, and30 magnesium acetate. Fragmented cRNA (15 �g) was hybridized for 16hr at 45°C to a rat genome U34A array (Affymetrix, Santa Clara, CA).After hybridization the gene chips were washed automatically andstained with streptavidin-phycoerythrin by using a fluidics station. Probearrays then were scanned at 3 �m resolution, using the Genechip Systemconfocal scanner made for Affymetrix by Agilent Technologies (PaloAlto, CA). Affymetrix Microarray Suite 5.0 was used to scan and analyze
the relative abundance of each gene from theaverage difference of hybridization intensities.Analysis parameters used by the software wereset to values corresponding to a moderatestringency (�1, 0.04; �2, 0.06; �, 0.015; �1L and�1H, 0.0025; �2L and �2H, 0.003). Outputfrom the microarray analysis was stored as anExcel data spreadsheet. The definition of statis-tically significant increase or decrease for indi-vidual genes was based on the following threecriteria, in order, as previously described (Liand Johnson, 2002; Li et al., 2002; Stein andJohnson, 2002). (1) Rank analysis of the differ-ence call (a measure of the direction and mag-nitude of change) was made from three inter-group comparisons (3 � 3, matrix analysis ofthree replicate samples) for neuronal culturesand two intergroup comparisons (2 � 2) forastrocyte cultures; no change was given a valueof zero, marginal increase/decrease was given avalue of 1/–1, and increase/decrease was given avalue of 2/–2. The final rank referred to sum-ming up the nine values for the neuronal cul-tures and four values for the astrocyte culturescorresponding to the difference calls. Thesevalues varied from 18 to –18 and from 9 to –9 forthe neuronal and astrocyte cultures, respectively.The cutoff value for the determination of in-crease/decrease for neuronal cultures was set as9/–9 and for astrocyte cultures was set as 4/–4. (2)For the coefficient of variation the cutoffs were setat 1.20. (3) For the fold change the cutoffs were setat 1.3 or greater for increased genes or �1.3 orlower for decreased genes.
Statistical analysis. All experiments were re-peated at least three times unless otherwisestated. Results are presented as the mean � SE.Statistical analysis of raw data was performed
with GraphPad Prism 2.0 (San Diego, CA). Experimental groups werecompared by one-way ANOVA, two-way ANOVA followed by Bonfer-roni’s posttest, Kruskal–Wallis test, or Student’s t test as appropriate. Astatistical probability of p � 0.05 was considered significant.
ResultsNeurons express lower levels of Nrf2 protein than astrocytesWe previously demonstrated that cortical astrocytes have ahigher basal and stimulated level of ARE-mediated gene expres-sion than neurons (Murphy et al., 2001; Johnson et al., 2002).One explanation for this observation would be that astrocytesexpress higher levels of the transcription factor Nrf2 than neu-rons. To test this hypothesis, we prepared enriched neuronal andastrocyte primary cortical cultures and probed their extracts withan anti-Nrf2 antibody by Western blot. A 105 kDa Nrf2-specificband was identified in enriched glial cultures that comigratedwith recombinant Nrf2 overexpressed in HEK293 cells (Fig.2A,B). The same band was detected at very low levels in neuron-enriched cultures. Densitometry analysis revealed that glial-enriched cultures express �12-fold more Nrf2 protein thanneuron-enriched cultures, implying that astrocytes may havemore pronounced ARE-mediated gene expression because theyexpress higher levels of Nrf2 than neurons (Fig. 2B). The 105 kDaband was not detectable in HEK293 cells overexpressing a�-galactosidase control. The Nrf2 antibody, raised against theNrf2 C-terminal region, also recognized the dominant-negative N-terminal-deleted form of Nrf2 migrating at 29 kDa(Nrf2DN). Although the Nrf2 antibody was used for Western
Figure 2. Cortical glia have higher basal Nrf2 expression and ARE promotor activity than neurons. A, Western blot of heterolo-gously expressed Nrf2 (105 kDa) and Nrf2DN (28 kDa) in HEK293 cells. B, A comigrating 105 kDa band corresponding to Nrf2 isobserved in enriched cortical glial, but not neuronal, cultures. Densitometric analysis reveals an �12-fold difference in Nrf2protein (n�3); *p�0.05. C, Coexpression of Nrf2 cDNA with a hPAP-encoding reporter of ARE-mediated gene expression (rQR51)greatly increases neuronal hPAP expression. Reporter constructs carrying a mutation within the core ARE consensus sequence(rQR51Mut) were not inducible. Coexpression with Nrf2DN cDNA suppresses both neuronal and glial hPAP expression. *p � 0.05,neuron comparison to pEF (empty vector) control; #p � 0.05, glial comparison to pEF control. D, E, Representative hPAP-stainedastrocyte-like cells with coexpression of pEF vector only. F, G, With Nrf2 overexpression cells of both neuronal and glial morphologyshow ARE-driven hPAP expression. Data from hPAP experiments represent the mean � SEM number of cells counted fromtriplicate coverslips over four independent experiments.
Shih et al. • Nrf2 Upregulates Glial GSH and Promotes Neuroprotection J. Neurosci., April 15, 2003 • 23(8):3394 –3406 • 3397
blots, its nonspecific binding activity made it unsuitable forimmunocytochemistry.
If a lower basal level of Nrf2 protein is the reason for the lack ofARE-mediated gene expression in neurons, then overexpressionof Nrf2 in neurons may be a strategy to boost their antioxidantgene expression. To test this idea, we used a reporter constructcarrying a heat-stable hPAP gene driven by a minimal ARE-bearing promoter (rQR51). Previous studies in our lab show that,in rQR51-transfected cortical cultures and cultures derived fromtransgenic ARE-hPAP reporter mice, hPAP staining is restrictedmainly to the astrocyte population (Murphy et al., 2001; Johnsonet al., 2002). Consistent with our hypothesis, when rQR51 wascotransfected with an expression vector for Nrf2, the number ofneurons staining for hPAP increased dramatically (Fig. 2C--G).Coexpression of rQR51 with the empty expression vector pEF didnot increase neuronal staining, and coexpression with Nrf2DNnot only prevented neuronal staining but also suppressed basalastrocyte staining. Thus neurons are able to undergo ARE-mediated gene expression but appear to be constrained becauseof insufficient levels of Nrf2 protein. Induction of hPAP expres-sion from rQR51 was dependent on the presence of a wild-typeconsensus ARE sequence and was abolished by mutation of thissequence (rQR51mut; Fig. 2C).
Overexpression of Nrf2 enhances antioxidant activity ofneurons and astrocytes in immature cortical culturesWe next evaluated whether Nrf2 overexpression could increasethe antioxidant properties of cortical neurons and glia. For theseexperiments replication-deficient adenoviruses (Crocker et al.,2001) were used to infect a large fraction of neurons efficiently.Three different adenovirus constructs were made with CMV pro-moters driving the expression of enhanced green fluorescent pro-tein (eGFP) alone (ad-GFP), Nrf2 and eGFP (ad-Nrf2), orNrf2DN and eGFP (Ad-Nrf2DN). For the latter two viruses eachcDNA was driven by a separate CMV promoter. When used toinfect immature rat cortical cultures (1 DIV), all three viruseswere able to infect �25% of the neurons and �80% of the glia,when used at a multiplicity of infection of 200.
To characterize the antioxidant activity of ad-Nrf2-infectedcultures, we evaluated the protein products of three known Nrf2target genes: heme-oxygenase-1 (HO-1) (Alam et al., 1999; Gonget al., 2002), system xc
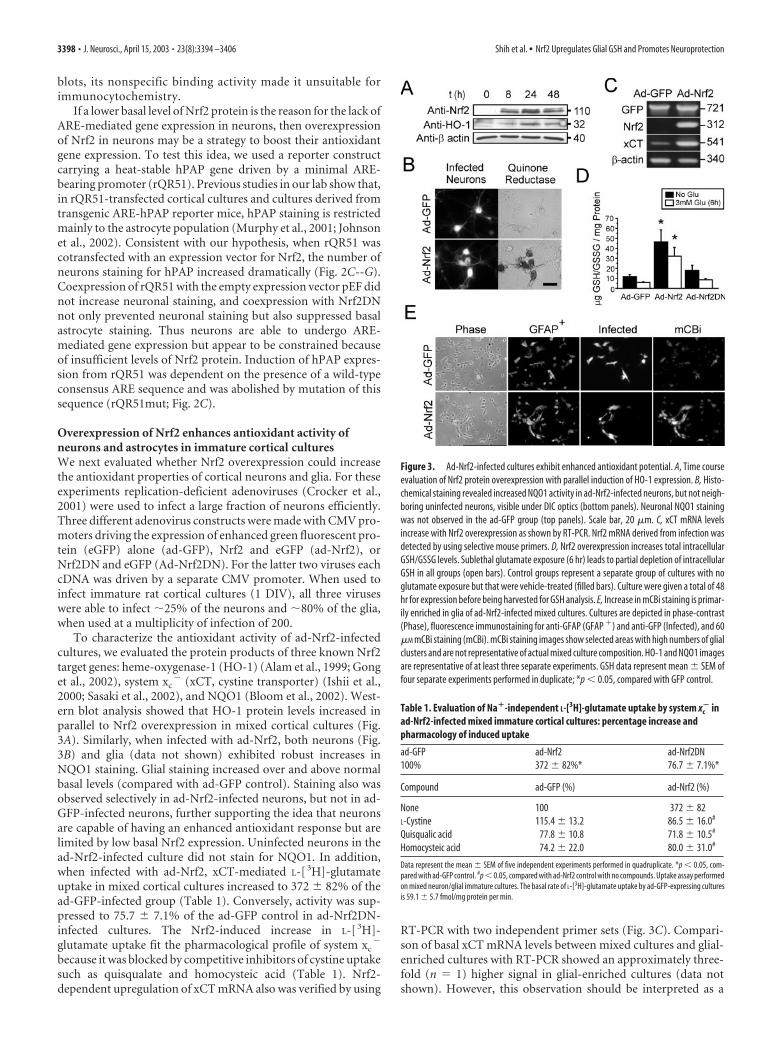
� (xCT, cystine transporter) (Ishii et al.,2000; Sasaki et al., 2002), and NQO1 (Bloom et al., 2002). West-ern blot analysis showed that HO-1 protein levels increased inparallel to Nrf2 overexpression in mixed cortical cultures (Fig.3A). Similarly, when infected with ad-Nrf2, both neurons (Fig.3B) and glia (data not shown) exhibited robust increases inNQO1 staining. Glial staining increased over and above normalbasal levels (compared with ad-GFP control). Staining also wasobserved selectively in ad-Nrf2-infected neurons, but not in ad-GFP-infected neurons, further supporting the idea that neuronsare capable of having an enhanced antioxidant response but arelimited by low basal Nrf2 expression. Uninfected neurons in thead-Nrf2-infected culture did not stain for NQO1. In addition,when infected with ad-Nrf2, xCT-mediated L-[ 3H]-glutamateuptake in mixed cortical cultures increased to 372 � 82% of thead-GFP-infected group (Table 1). Conversely, activity was sup-pressed to 75.7 � 7.1% of the ad-GFP control in ad-Nrf2DN-infected cultures. The Nrf2-induced increase in L-[ 3H]-glutamate uptake fit the pharmacological profile of system xc
�
because it was blocked by competitive inhibitors of cystine uptakesuch as quisqualate and homocysteic acid (Table 1). Nrf2-dependent upregulation of xCT mRNA also was verified by using
RT-PCR with two independent primer sets (Fig. 3C). Compari-son of basal xCT mRNA levels between mixed cultures and glial-enriched cultures with RT-PCR showed an approximately three-fold (n � 1) higher signal in glial-enriched cultures (data notshown). However, this observation should be interpreted as a
Figure 3. Ad-Nrf2-infected cultures exhibit enhanced antioxidant potential. A, Time courseevaluation of Nrf2 protein overexpression with parallel induction of HO-1 expression. B, Histo-chemical staining revealed increased NQO1 activity in ad-Nrf2-infected neurons, but not neigh-boring uninfected neurons, visible under DIC optics (bottom panels). Neuronal NQO1 stainingwas not observed in the ad-GFP group (top panels). Scale bar, 20 �m. C, xCT mRNA levelsincrease with Nrf2 overexpression as shown by RT-PCR. Nrf2 mRNA derived from infection wasdetected by using selective mouse primers. D, Nrf2 overexpression increases total intracellularGSH/GSSG levels. Sublethal glutamate exposure (6 hr) leads to partial depletion of intracellularGSH in all groups (open bars). Control groups represent a separate group of cultures with noglutamate exposure but that were vehicle-treated (filled bars). Culture were given a total of 48hr for expression before being harvested for GSH analysis. E, Increase in mCBi staining is primar-ily enriched in glia of ad-Nrf2-infected mixed cultures. Cultures are depicted in phase-contrast(Phase), fluorescence immunostaining for anti-GFAP (GFAP �) and anti-GFP (Infected), and 60�M mCBi staining (mCBi). mCBi staining images show selected areas with high numbers of glialclusters and are not representative of actual mixed culture composition. HO-1 and NQO1 imagesare representative of at least three separate experiments. GSH data represent mean � SEM offour separate experiments performed in duplicate; *p � 0.05, compared with GFP control.
Table 1. Evaluation of Na�-independent L-[3H]-glutamate uptake by system xc� in
ad-Nrf2-infected mixed immature cortical cultures: percentage increase andpharmacology of induced uptake
ad-GFP ad-Nrf2 ad-Nrf2DN100% 372 � 82%* 76.7 � 7.1%*
Compound ad-GFP (%) ad-Nrf2 (%)
None 100 372 � 82L-Cystine 115.4 � 13.2 86.5 � 16.0#
Quisqualic acid 77.8 � 10.8 71.8 � 10.5#
Homocysteic acid 74.2 � 22.0 80.0 � 31.0#
Data represent the mean � SEM of five independent experiments performed in quadruplicate. *p � 0.05, com-pared with ad-GFP control. #p � 0.05, compared with ad-Nrf2 control with no compounds. Uptake assay performedon mixed neuron/glial immature cultures. The basal rate of L-[3H]-glutamate uptake by ad-GFP-expressing culturesis 59.1 � 5.7 fmol/mg protein per min.
3398 • J. Neurosci., April 15, 2003 • 23(8):3394 –3406 Shih et al. • Nrf2 Upregulates Glial GSH and Promotes Neuroprotection

qualitative difference attributable to potential nonlinearity in theRT-PCR method. RT-PCR for GFP confirmed than an approxi-mately equal amount of viral gene expression occurred in ad-GFP- and ad-Nrf2-infected cultures as well as between the mixedand glia-enriched culture types.
Nrf2 overexpression in mixed cultures also generated an ap-proximately four- to fivefold increase in total intracellular gluta-thione [GSH � oxidized glutathione (GSSG)] as compared withGFP control (Fig. 3D). Treating the cultures with 3 mM Glu for 6hr before harvesting for GSH measurement reduced the GSHlevels in all groups without causing neuronal death, but the ad-Nrf2-infected group still contained more GSH in comparison tocontrols. Using mCBi to stain for GSH in ad-Nrf2-infected cul-tures, we observed that the GSH/mCBi adduct fluorescence wasenriched in GFAP-positive glia cells (Fig. 3E). This staining pat-tern was not observed in ad-GFP-infected cultures. A detailedquantitation of mCBi fluorescence revealed that both infectedand uninfected neurons also were stained more heavily in thead-Nrf2-infected mixed cultures in comparison to neurons inad-GFP-infected cultures (Table 2). It should be noted, however,
that increased mCBi staining can be indicative of both increasedGSH levels as well as enhanced GST activity (Tauskela et al.,2000).
Microarray analysis of Nrf2-overexpressing mixed corticalcultures and enriched glial culturesTo define the gene set targeted by Nrf2 thoroughly, we performedmicroarray analysis on mRNA derived from mixed neuron– gliacultures (3 DIV) and glial-enriched cultures (5–10 DIV) 48 hr
Table 3. Common Nrf2 upregulated genes in glial-enriched cultures and mixed neuronal/glial cultures
GenBankaccession number Gene
Glial-enriched Neuron/glial mixed
R Fold CV BS R Fold CV BS
DetoxificationM58495 NAD(P)H:quinone oxidoreductase 8 4.3 0.24 2621 18 5.4 0.56 141K00136 Glutathione S-transferase A1 or 2 6 17.6 0.41 24 12 8.8 0.80 100K01932 Glutathione S-transferase A3 8 12.3 0.77 4657 18 19.8 0.56 223X62660 Glutathione S-transferase A4 8 21.7 0.56 443 18 4.1 0.42 769X02904 Glutathione S-transferase P2 8 3.4 0.38 22952 18 2.4 0.25 7230J02722 Heme oxygenase 1 8 2.8 0.18 24137 18 21.3 1.2 358M11670 Catalase 8 4.1 0.34 1381 16 1.7 0.22 593M11794 Metallothionein 1 or 2 4 3.7 0.56 15750 16 2.83 0.35 1274AI010083 Peroxiredoxin 1 8 2.9 0.06 32993 18 2.5 0.25 6609AF014009 Peroxiredoxin 6 (1-cys peroxiredoxin) 8 3.3 0.12 6153 14 1.8 0.20 1772M21060 Cu/Zn superoxide dismutase 8 1.5 0.09 28627 16 1.9 0.27 14495AF106563 p-glycoprotein/multi-drug resistance protein (MDR2) 6 1.9 0.23 1459 10 5.9 0.71 2671X90642 Multi-drug resistance protein (MRPI) 8 2.3 0.33 3432 14 1.7 0.13 1317
Signal transductionU09583 Src-related tyrosine kinase 8 22.6 0.90 89 18 25.6 0.16 56AI231354 Stress-activated protein kinase, � 8 3.1 0.10 1097 14 1.65 0.26 880D78610 Protein tyrosine phosphatase receptor E 7 6.7 0.27 83 14 0.0 0.00 858M15427 c-raf 8 3.6 0.25 3558 18 1.6 0.22 7427U31668 E2F-5 transcription factor 8 2.8 0.06 2242 18 1.7 0.16 933U04835 cAMP-responsive element modulator 8 2.0 0.20 2242 10 2.7 1.1 756
Antioxidant/reducing potential/metabolismAI233261 Glutamate-cysteine ligase, modifier subunit (�GCS) 8 13.0 0.13 945 18 5.1 0.21 208U73174 Glutathione reductase 1 8 3.3 0.15 1667 14 2.0 0.32 1324U63923 Thioredoxin reductase 1 8 2.6 0.16 10344 16 3.4 0.56 3426M26594 Malic enzyme 1 8 8.3 0.23 1264 18 10.1 0.35 227AI169802 Ferritin H subunit H 7 1.8 0.23 50557 10 1.3 0.13 18452J02791 Acyl-coenzyme A dehydrogenase, medium chain 8 3.2 0.22 925 12 3.2 0.87 42M60322 Aldose reductase 1 8 5.1 0.15 24812 18 2.4 0.18 9958AA799452 Transaldolase 8 3.6 0.25 21356 18 1.8 0.23 19236M96633 Mitochondrial intermediate peptidase 8 2.8 0.30 699 9 1.5 0.24 452AA945054 Cytochrome b5 8 2.6 0.40 1902 14 1.6 0.27 2179S53527 S-100 calcium binding protein � 8 78.7 1.15 1167 10 2.3 0.68 67U26714 Solute carrier family 29 (iron-regulated transporter) 6 21.3 0.37 402 18 5.9 0.27 102
InflammationAI176170 FK506 binding protein 6 1.5 0.20 19602 18 1.3 0.06 18354AA818025 CD59 antigen 8 25.9 0.04 1128 18 1.4 0.08 10966U03388 Cyclooxygenase 1 8 3.9 0.23 2083 18 5.6 0.50 312
HousekeepingV01217 � actin 186225 164621X02231 Glyceraldehyde-3-phosphate-dehydrogenase 405 348U07181 Lactate dehydrogenase B 13108 11253
Genes with fold change 1.3 are listed. R, Relative rank; CV, coefficient of variation; BS, basal signal intensity from GFP-infected cultures. Data shown are from n � 2 glial-enriched cultures and n � 3 mixed cultures.
Table 2. Evaluation of GSH-bimane adduct staining in infected mixedcortical cultures
Cell type Ad-GFP Ad-Nrf2 Ad-Nrf2DN
Infected neuron 21.1 � 4.9 (60) 40.6 � 10 (60)* 25.0 � 5.2 (60)Uninfected neuron 19.0 � 4.9 (60) 34.1 � 10 (60)* 19.9 � 4.5 (60)Infected glia 61.6 � 11 (25) 119 � 17 (59)* 35.1 � 5.2 (40)*#
Data represent the mean � SEM, in arbitrary units of fluorescence intensity. Cell type was identified based onmorphology (glial cells larger with web-like processes). The total number of cells evaluated for each group is listedin parentheses; with data collected from cells over three independent experiments performed in duplicate. *p �0.001, compared with ad-GFP of same cell type. #p � 0.05, compared with ad-GFP of same cell type.
Shih et al. • Nrf2 Upregulates Glial GSH and Promotes Neuroprotection J. Neurosci., April 15, 2003 • 23(8):3394 –3406 • 3399
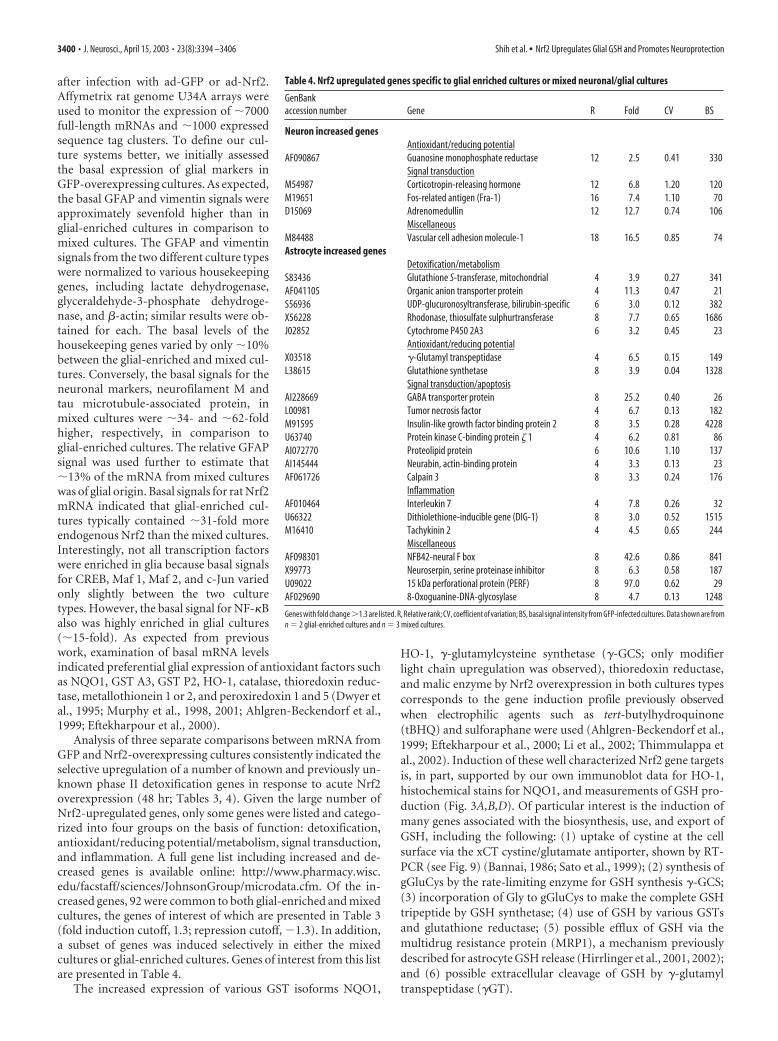
after infection with ad-GFP or ad-Nrf2.Affymetrix rat genome U34A arrays wereused to monitor the expression of �7000full-length mRNAs and �1000 expressedsequence tag clusters. To define our cul-ture systems better, we initially assessedthe basal expression of glial markers inGFP-overexpressing cultures. As expected,the basal GFAP and vimentin signals wereapproximately sevenfold higher than inglial-enriched cultures in comparison tomixed cultures. The GFAP and vimentinsignals from the two different culture typeswere normalized to various housekeepinggenes, including lactate dehydrogenase,glyceraldehyde-3-phosphate dehydroge-nase, and �-actin; similar results were ob-tained for each. The basal levels of thehousekeeping genes varied by only �10%between the glial-enriched and mixed cul-tures. Conversely, the basal signals for theneuronal markers, neurofilament M andtau microtubule-associated protein, inmixed cultures were �34- and �62-foldhigher, respectively, in comparison toglial-enriched cultures. The relative GFAPsignal was used further to estimate that�13% of the mRNA from mixed cultureswas of glial origin. Basal signals for rat Nrf2mRNA indicated that glial-enriched cul-tures typically contained �31-fold moreendogenous Nrf2 than the mixed cultures.Interestingly, not all transcription factorswere enriched in glia because basal signalsfor CREB, Maf 1, Maf 2, and c-Jun variedonly slightly between the two culturetypes. However, the basal signal for NF-�Balso was highly enriched in glial cultures(�15-fold). As expected from previouswork, examination of basal mRNA levelsindicated preferential glial expression of antioxidant factors suchas NQO1, GST A3, GST P2, HO-1, catalase, thioredoxin reduc-tase, metallothionein 1 or 2, and peroxiredoxin 1 and 5 (Dwyer etal., 1995; Murphy et al., 1998, 2001; Ahlgren-Beckendorf et al.,1999; Eftekharpour et al., 2000).
Analysis of three separate comparisons between mRNA fromGFP and Nrf2-overexpressing cultures consistently indicated theselective upregulation of a number of known and previously un-known phase II detoxification genes in response to acute Nrf2overexpression (48 hr; Tables 3, 4). Given the large number ofNrf2-upregulated genes, only some genes were listed and catego-rized into four groups on the basis of function: detoxification,antioxidant/reducing potential/metabolism, signal transduction,and inflammation. A full gene list including increased and de-creased genes is available online: http://www.pharmacy.wisc.edu/facstaff/sciences/JohnsonGroup/microdata.cfm. Of the in-creased genes, 92 were common to both glial-enriched and mixedcultures, the genes of interest of which are presented in Table 3(fold induction cutoff, 1.3; repression cutoff, �1.3). In addition,a subset of genes was induced selectively in either the mixedcultures or glial-enriched cultures. Genes of interest from this listare presented in Table 4.
The increased expression of various GST isoforms NQO1,
HO-1, �-glutamylcysteine synthetase (�-GCS; only modifierlight chain upregulation was observed), thioredoxin reductase,and malic enzyme by Nrf2 overexpression in both cultures typescorresponds to the gene induction profile previously observedwhen electrophilic agents such as tert-butylhydroquinone(tBHQ) and sulforaphane were used (Ahlgren-Beckendorf et al.,1999; Eftekharpour et al., 2000; Li et al., 2002; Thimmulappa etal., 2002). Induction of these well characterized Nrf2 gene targetsis, in part, supported by our own immunoblot data for HO-1,histochemical stains for NQO1, and measurements of GSH pro-duction (Fig. 3A,B,D). Of particular interest is the induction ofmany genes associated with the biosynthesis, use, and export ofGSH, including the following: (1) uptake of cystine at the cellsurface via the xCT cystine/glutamate antiporter, shown by RT-PCR (see Fig. 9) (Bannai, 1986; Sato et al., 1999); (2) synthesis ofgGluCys by the rate-limiting enzyme for GSH synthesis �-GCS;(3) incorporation of Gly to gGluCys to make the complete GSHtripeptide by GSH synthetase; (4) use of GSH by various GSTsand glutathione reductase; (5) possible efflux of GSH via themultidrug resistance protein (MRP1), a mechanism previouslydescribed for astrocyte GSH release (Hirrlinger et al., 2001, 2002);and (6) possible extracellular cleavage of GSH by �-glutamyltranspeptidase (�GT).
Table 4. Nrf2 upregulated genes specific to glial enriched cultures or mixed neuronal/glial cultures
GenBankaccession number Gene R Fold CV BS
Neuron increased genesAntioxidant/reducing potential
AF090867 Guanosine monophosphate reductase 12 2.5 0.41 330Signal transduction
M54987 Corticotropin-releasing hormone 12 6.8 1.20 120M19651 Fos-related antigen (Fra-1) 16 7.4 1.10 70D15069 Adrenomedullin 12 12.7 0.74 106
MiscellaneousM84488 Vascular cell adhesion molecule-1 18 16.5 0.85 74Astrocyte increased genes
Detoxification/metabolismS83436 Glutathione S-transferase, mitochondrial 4 3.9 0.27 341AF041105 Organic anion transporter protein 4 11.3 0.47 21S56936 UDP-glucuronosyltransferase, bilirubin-specific 6 3.0 0.12 382X56228 Rhodonase, thiosulfate sulphurtransferase 8 7.7 0.65 1686J02852 Cytochrome P450 2A3 6 3.2 0.45 23
Antioxidant/reducing potentialX03518 �-Glutamyl transpeptidase 4 6.5 0.15 149L38615 Glutathione synthetase 8 3.9 0.04 1328
Signal transduction/apoptosisAI228669 GABA transporter protein 8 25.2 0.40 26L00981 Tumor necrosis factor 4 6.7 0.13 182M91595 Insulin-like growth factor binding protein 2 8 3.5 0.28 4228U63740 Protein kinase C-binding protein � 1 4 6.2 0.81 86AI072770 Proteolipid protein 6 10.6 1.10 137AI145444 Neurabin, actin-binding protein 4 3.3 0.13 23AF061726 Calpain 3 8 3.3 0.24 176
InflammationAF010464 Interleukin 7 4 7.8 0.26 32U66322 Dithiolethione-inducible gene (DIG-1) 8 3.0 0.52 1515M16410 Tachykinin 2 4 4.5 0.65 244
MiscellaneousAF098301 NFB42-neural F box 8 42.6 0.86 841X99773 Neuroserpin, serine proteinase inhibitor 8 6.3 0.58 187U09022 15 kDa perforational protein (PERF) 8 97.0 0.62 29AF029690 8-Oxoguanine-DNA-glycosylase 8 4.7 0.13 1248
Genes with fold change1.3 are listed. R, Relative rank; CV, coefficient of variation; BS, basal signal intensity from GFP-infected cultures. Data shown are fromn � 2 glial-enriched cultures and n � 3 mixed cultures.
3400 • J. Neurosci., April 15, 2003 • 23(8):3394 –3406 Shih et al. • Nrf2 Upregulates Glial GSH and Promotes Neuroprotection

Enhancing antioxidant potential by Nrf2 overexpressionprotects neurons from cell death caused by oxidative stress,but not staurosporine-induced apoptosisCan the increased antioxidant potential from Nrf2 overexpres-sion protect neurons in in vitro models of oxidative stress? Forthis experiment we used a well established NMDA receptor-independent oxidative glutamate toxicity paradigm in whichneurons die from GSH depletion (Murphy et al., 1989, 1990).When ad-GFP-infected cultures were treated with 3 mM gluta-mate, only 12.5 � 5.3% of the infected neurons were viable after24 hr (Fig. 4A,B). With the same treatment 103.7 � 4.6% of thead-Nrf2-infected neurons survived the toxic exposure as com-pared with the ad-GFP control. Surprisingly, 88.0 � 14.0% of theuninfected neurons in the same culture were protected also (Fig.4A,D). The extent of neuronal death in the ad-Nrf2DN-infectedgroup was very similar to that of the ad-GFP-infected group.Doubling the glutamate concentration to 6 mM was not able toovercome the protective effect of Nrf2 (data not shown), suggest-ing that upregulated glutamate removal mechanisms such as en-hanced glutamate metabolism, glutamine synthesis from gluta-mate, or sodium-dependent glial glutamate uptake were not themain mechanisms for protection. Furthermore, after a 24 hr in-cubation the glutamate levels in the medium were not signifi-cantly different among the ad-GFP and ad-Nrf2 groups as as-sessed by a fluorescence-based glutamate dehydrogenase cyclingassay (data not shown) (Nicholls et al., 1987). To ensure that theobserved toxicity was indeed a result of oxidative stress, we added100 �M �-tocopherol in the presence of 3 mM glutamate, and anearly complete block of the neuronal death (80.3 � 11.5% re-duction; n � 4) was observed. We further ruled out the possibilityof NMDA receptor-mediated excitotoxicity in our paradigm bytreating 3– 4 DIV cultures with 200 �M NMDA overnight or witha short 500 �M NMDA or glutamate exposure for 10 min inHBSS, followed by washout. Neither treatment caused apprecia-ble neuronal death in these cultures (data not shown). The via-bility of glial cells was not affected by oxidative glutamate toxicityas observed in previous studies (Murphy et al., 1990) (Fig. 4A,C).
Ad-Nrf2-infected cultures were alsomore resistant to direct exposure to the pro-oxidant molecule H2O2. Ad-GFP- or ad-Nrf2-infected cultures were exposed to0.3–30 �M H2O2 for 24 hr. Under these con-ditions the ad-GFP-infected group began toshow significant neuronal toxicity at 3 �M
H2O2 and maximum cell death at 30 �M
H2O2 (Fig. 5A). Infecting the cultures withad-Nrf2 reduced neuronal toxicity by53.1 � 16.9% of the ad-GFP control duringexposure to 10 �M H2O2. The protective ef-fect of Nrf2 was overcome by 30 �M H2O2.
Neuronal injury from oxidative stresscan exhibit features of an apoptotic pathway(Whittemore et al., 1995; Tan et al., 1998).To test whether Nrf2 upregulation couldprotect neurons from apoptosis induced bya different pathway than direct exposure toROS, we treated infected cultures with0.1–10 �M staurosporine, a potent inhibitorof phospholipid/Ca2�-dependent proteinkinase (Tamaoki et al., 1986). Interestingly,overexpression of Nrf2 did not confer anyprotection from staurosporine-inducedtoxicity under these conditions (Fig. 5B). In
both ad-GFP- and ad-Nrf2-infected groups cell death was observedwith 0.3 �M first, whereas maximal toxicity was achieved with 10 �M.
Glutathione released from ad-Nrf2-infected glial is necessaryand sufficient for protecting neurons from oxidativeglutamate toxicityGiven that a small number of ad-Nrf2-infected glia are present ininfected mixed cortical cultures (�2% of the total cell numberaccording to manual cell-counting data), it is possible that theseenhanced glial cells contributed to the observed protection ofneurons. To address this possibility, we tested whether ad-Nrf2-infected glia transplanted into naive (uninfected) mixed culturescould protect resident neurons. Ad-Nrf2-infected glia wereplated directly into naive cultures at 0.1–2% of the total cell num-ber by using the coculture setup, as detailed in Materials andMethods (Fig. 1A). Amazingly, up to 83.3 � 22.3% of the naiveneurons were protected from 3 mM glutamate when the gliawere transplanted at only 0.5% (Fig. 6 A–C). Complete neuro-nal protection was achieved when glia were plated at 1.5% of
Figure 4. Nrf2 overexpression in a subpopulation of cells confers widespread neuronal protection from oxidative glutamatetoxicity. A, Immunocytochemistry for eGFP (green, identifying infected cells) and NSE (red marker, a neuron-selective marker).Within a typical ad-GFP-infected culture the infected neurons (yellow, red � green), uninfected neurons (red), and infected glia(green) can be observed. B, Group data evaluating the vulnerability of infected neurons to oxidative glutamate toxicity. Data areexpressed as a percentage of GFP � NSE � cells (presumed infected neurons) in the indicated glutamate treatment group ascompared with the ad-GFP control group. VE, Vitamin E (�-tocopherol), 100 �M. C, Viability of GFP � NSE � cells (presumedinfected glia) present per image was not affected significantly with glutamate treatment. D, Uninfected neurons within culturescontaining Nrf2-infected cells are more resistant to oxidative glutamate toxicity. Data represent the mean � SEM number of cellscounted over triplicate wells from at least three independent experiments; *p � 0.05, compared with the GFP control no-glutamate group.
Figure 5. Nrf2 overexpression in mixed immature cortical cultures protects neurons from H2O2-mediated toxicity, but not staurosporine-induced apoptosis. Ad-GFP- and ad-Nrf2-infected cultureswereallowedtoexpresstransgenesfor48hrbeforeexposureto0.3–30�M H2O2 (A;n�3)or0.1–10�M staurosporine (B; n � 4) for a further 24 hr. Cells were stained for NSE to evaluate neuronalviability. Data represent the mean � SEM from the indicated number of experiments performed inquadruplicate; *p � 0.05, compared with ad-GFP-infected control.
Shih et al. • Nrf2 Upregulates Glial GSH and Promotes Neuroprotection J. Neurosci., April 15, 2003 • 23(8):3394 –3406 • 3401

the total cell number. This protectionwas not observed with ad-GFP-, ad-Nrf2DN-infected, or uninfected glia. Itshould be noted, however, that theplated glial densities slightly underesti-mate the number of glia during expo-sure to toxins 24 hr after plating due toglial proliferation.
Glia are known to release a number ofprotective factors that enhance neuronalsurvival via a variety of mechanisms. Of par-ticular importance is the release of sulfhy-dryl species such as GSH, cysteine–glycine(CysGly), or cysteine, which can contributeto neuronal GSH synthesis (Sagara et al.,1993a; Dringen et al., 1999; Wang andCynader, 2000). When enriched glial cul-tures were infected with ad-Nrf2, both in-tracellular and released GSH were increased(Fig. 7A,B). When glia were infected withad-Nrf2 and plated at 2 � 104 cells/ml(equivalent to 2% of the total cell number),the GSH accumulated in the medium over24 hr was increased significantly to 11.5 �1.9 �M as compared with 4.6 � 0.8 �M withad-GFP or 2.8 � 1.2 �M with ad-Nrf2DN.Filtering the medium (�3 kDa size restric-tion) did not reduce the GSH measured in the medium significantly,suggesting that the released GSH was not protein-bound and wasmost likely in its free form. Indeed, neuronal toxicity was preventedcompletely when naive cultures were exposed to 3 mM glutamate inthe presence of 10 �M exogenous GSH for 24 hr (Fig. 7C). Thissuggests that the concentration of GSH released into the medium bya small ad-Nrf2-infected glial component was sufficient for neuronalprotection from oxidative glutamate toxicity.
To test whether GSH release from ad-Nrf2-infected glia was nec-essary for the observed neuronal protection, we used BSO, an irre-versible blocker of �-GCS, to inhibit glial GSH synthesis (Griffithand Meister, 1979). To avoid potential effects of BSO on neuronalGSH, we plated infected glia on culture plate inserts and treatedthem with 200 �M BSO for 24 hr before transfer into neuronal cul-tures by using the membrane-delimited coculture setup (Fig. 1B).For this setup the glial cells were situated in an upper layer 1–2 mmabove naive neurons in the bottom of a well. BSO pretreatment ofad-Nrf2-infected glia suppressed levels of released GSH to �3 �M
for 24 hr after washout (data not shown) and completely blockedthe Nrf2-mediated protection of neurons (Fig. 7D).
Small molecule inducers of Nrf2 increase neuronal survivalduring oxidative glutamate toxicityCompounds such as tBHQ and dimethyl fumarate, known in-ducers of Nrf2 activation and phase II gene induction, have beenshown to protect various cell lines against oxidative stress causedby H2O2 and dopamine exposure (Duffy et al., 1998; Li et al.,2002). In this study we have found that direct pretreatment ofimmature cortical culture with 10 –20 �M tBHQ for 24 hr effi-ciently blocks oxidative glutamate toxicity (Fig. 8A). To comparethe protective potential of tBHQ-treated glia with ad-Nrf2-overexpressing glia, we treated enriched glial cultures with 5–20 �M
tBHQ for 24 hr to allow for upregulation of an antioxidant responsebefore they were transplanted into naive cortical cultures via thecoculture setup (Fig. 1A). Glia pretreated with 20 �M tBHQ pro-vided neuronal protection from 3 mM glutamate when they were
transplanted at a plating density of 5% of the total cell number (Fig.8B). However, protection was not seen when tBHQ-treated gliawere transplanted at 2%, a density sufficient for neuronal protectionwhen ad-Nrf2-infected glia were used. Treating glial with tBHQ in-creased intracellular GSH content, as previously described(Eftekharpour et al., 2000), and also increased released GSH in adose-dependent manner (data not shown).
DiscussionNrf2 overexpression boosts antioxidant potential of glia:protection of neurons from oxidative glutamate toxicityOverexpression of the Cap‘n’Collar transcription factor Nrf2 up-regulates a strong antioxidant response in both neurons and gliadissociated from rat cortex. We show that protection of neuronscan be achieved by upregulation of the glial antioxidant responsealone. Central to this protection was the augmented synthesis andrelease of glial GSH, which can be used toward strengthening theneuronal GSH pool. This conclusion was based on several lines ofevidence. First, ad-Nrf2 infection of glia significantly increasedintracellular and released GSH. Second, microarray analyses in-dicated the coordinated induction of GSH biosynthesis, use, andexport enzymes. Third, exogenous GSH addition mimicked neu-roprotection offered by ad-Nrf2-infected glia, and selective de-pletion of glial GSH with the use of BSO abolished this neuropro-tection. Thus Nrf2-dependent enhancement of glial GSH releaseappears to be necessary and sufficient for neuronal protection.However, it is important to note that suppression of glial GSHsynthesis may have deleterious effects on glial health and possiblycould alter the expression of other glial-derived protective fac-tors. Although GSH plays an important role for protection in theoxidative glutamate toxicity paradigm, we cannot rule out com-pletely the involvement of other glial-derived factors.
It is well documented that astrocytes can protect neurons fromdamage caused by various ROS (Desagher et al., 1996; Lucius andSievers, 1996; Tanaka et al., 1999; Kirchhoff et al., 2001). Previousstudies have shown that an adequate astrocyte GSH content is essen-
Figure 6. A small fraction of infected glial cells is sufficient to protect neurons from oxidative glutamate toxicity. A, Represen-tative images from glial–neuron coculture setup (see Fig. 1 A). Within a typical coculture infected glia (green) and uninfectedneurons (red) can be observed. Uninf, Uninfected glia transplanted. B, Group data obtained from plate scanning for NSE (red)fluorescence. C, Decreased neuronal viability is demonstrated by a loss of red fluorescence. The addition of Nrf2-overexpressing gliarestores NSE expression to levels found in an ad-GFP-infected group that was not exposed to glutamate. Data represent themean � SEM from three separate experiments performed in quadruplicate; *p � 0.05. Scale bar, 80 �m.
3402 • J. Neurosci., April 15, 2003 • 23(8):3394 –3406 Shih et al. • Nrf2 Upregulates Glial GSH and Promotes Neuroprotection

tial because depletion of GSH with BSO abolishes astrocyte-mediated neuroprotection (Drukarch et al., 1997; Chen et al., 2001).One mechanism underlying this protection is the continuous glialdelivery of GSH and/or GSH precursors to neurons for GSH synthe-sis (Yudkoff et al., 1990; Sagara et al., 1993a,b; Dringen et al., 1999,2000). Interestingly, GSH efflux becomes markedly increased whenthe astrocytes are exposed to oxidative stress (Sagara et al., 1996), aresponse that may be initiated by Nrf2 activation.
Although the events necessary for the neuronal uptake of GSHand its precursors remain uncertain, evidence suggests that anumber of sulfhydryl species can be used by neurons, includingcysteine, cystine, and the CysGly dipeptide (Murphy et al., 1990;Sagara et al., 1993a,b; Kranich et al., 1996; Wang and Cynader,2000). Two major paths can be initiated with the release of GSHinto the medium/CSF (Fig. 9). GSH can be metabolized intoCysGly and Glu-X conjugates by the glial ectoenzyme �-GT(Dringen et al., 1999). CysGly can be taken up by neurons or canbe hydrolyzed further by the ectoenzyme aminopeptidase N torelease cysteine (Dringen et al., 2001). Alternatively, a constantrelease of GSH can potentiate an extracellular thiol/disulfide ex-change reaction with cystine to produce cysteine and a GSH-cysteine conjugate (Wang and Cynader, 2000). There is currentlylittle direct evidence to support the uptake of GSH by neurons.However, both sodium-dependent and -independent GSH trans-port systems have been isolated from brain cells, including astrocytes
(Kannan et al., 2000), bovine brain capillary cells (Kannan et al.,1996), and immortalized mouse brain endothelial cells (Kannan etal., 1999). Furthermore, sodium-dependent GSH transport in ratsynaptosomal membrane vesicles exhibited high-affinity kinetics(Km � 4.5 � 0.8 �M) (Iantomasi et al., 1999) and may be physiolog-ically relevant for uptake considering the low GSH levels found inCSF (5.87 � 0.29 �M) (Wang and Cynader, 2000).
For a toxicity paradigm we primarily have used oxidative glu-tamate toxicity in which neurons are exposed to millimolar levelsof extracellular glutamate to inhibit cystine uptake completely viathe cystine/glutamate antiporter, system xc
�, leading to GSH de-pletion and oxidative stress (Murphy et al., 1989, 1990). In vivo,oxidative stress resulting from glutamate toxicity potentially mayplay a role in cell death during stroke, injury, and neurodegen-erative disease (Coyle and Puttfarcken, 1993). Under these con-ditions extracellular levels of glutamate need not be in the milli-molar range to inhibit cystine uptake, because CSF cystine levelsare quite low and can be inhibited easily by only 100 �M gluta-mate, which is below the level of extracellular glutamate found inmodels of stroke and trauma (McAdoo et al., 1999; Wang andCynader, 2000; Schubert and Piasecki, 2001).
The current literature describes the importance of Nrf2 forcellular resistance to pro-oxidant molecules (H2O2, tBHQ, andperoxynitrite), oxidant-generating molecules (menadione), invivo situations that potentiate ROS-mediated damage (hyperoxiclung injury), as well as cytotoxic molecules that are neutralized byGSH detoxification or glucuronidation (4-hydroxynonenal,acetaminophen) (Duffy et al., 1998; Chan and Kan, 1999; Gao etal., 2001; Cho et al., 2002). However, it remains to be determinedwhether Nrf2 can provide resistance to relatively ROS-independent forms of cell death (i.e., excitotoxicity). Our datasuggest that Nrf2-mediated protection does not extend to stau-rosporine toxicity and cell death attributed to calcium overloadwith the use of ionomycin (Duffy et al., 1998), both of which caninitiate the apoptotic cascade like ROS accumulation (Ratan etal., 1994).
Characterization of the Nrf2 inducible gene set in neuronsand glia via microarray analysisThe phase II enzyme gene set regulated by Nrf2 is broadeningrapidly with the use of microarray technology (Li et al., 2002;Thimmulappa et al., 2002). These studies demonstrate that
Figure 7. Release of GSH from glia is both sufficient and necessary for conferring neuronal protec-tion.A,B, Infectionwithad-Nrf2increasestotal intracellularGSH/GSSGaswellasGSHreleasedintothemedium (MEM/5% FCS, no phenol red). C, Exogenous addition of reduced GSH concurrently withglutamate treatment protects neurons from oxidative glutamate toxicity. D, Glial GSH release is nec-essary for Nrf2-dependent neuronal protection. A membrane-delimited coculture (see Fig. 1 B) wasused, allowing enriched glial cultures to be pretreated separately with the GSH synthesis inhibitor BSOand then to be washed and added to wells containing neurons. BSO pretreatment (200 �M) for 24 hrproduces long-term reduction of intracellular GSH/GSSG and release of GSH from glia and abolishesglial-mediated neuronal protection. Data represent the mean � SEM of at least three independentexperiments performed in triplicate; #*p � 0.05.
Figure 8. Neuronal protection can be achieved by activation of endogenous Nrf2 with the use of asmall molecule inducer. A, Immature cortical cultures pretreated for 24 hr with 10 and 20�M tBHQ areprotected from 1–3 mM glutamate exposure. Partial protection is conferred by tBHQ treatment at 3mM glutamate. B, Selective induction of endogenous Nrf2 in glia led to partial neuronal protectionfrom oxidative glutamate toxicity. Glia pretreated with a range of tBHQ concentrations (0 –20�M) for24 hr were transplanted into naive neuronal cultures at a plating density of 5% of the total cell num-ber, using a coculture setup (see Fig. 1 A). Data represent the mean � SEM from three independentexperiments performed in quadruplicate; *p � 0.05.
Shih et al. • Nrf2 Upregulates Glial GSH and Promotes Neuroprotection J. Neurosci., April 15, 2003 • 23(8):3394 –3406 • 3403

small molecule inducers of Nrf2 such astBHQ and sulforaphane coordinatelyupregulate enzymes involved in severalimportant lines of cellular defense: (1)antioxidant scavenging of ROS, (2) neu-tralization of electrophiles and xenobiot-ics by glucuronidation and glutathioneconjugation, and (3) NADPH-generatingmetabolic pathways. Our results are inagreement with the enhancement of theselines of cellular defense, in particular GSHbiosynthesis and use pathways, duringNrf2 activation. The fact that Nrf2 up-regulates GSH-related enzymes is consis-tent with our observation that glial GSHrelease is important for neuroprotection.However, in light of the microarray data,which implicate that action of additionalfactors such as malic enzyme, ferritin H,HO-1, and peroxiredoxins, we believeNrf2 activation in vivo leads to the activa-tion of multiple enzymes that work inconjunction with enhanced GSH to ac-count for changes in cerebral metabolismafter insults such as stroke.
Using Nrf2 overexpression as an ap-proach to identify the Nrf2-regulatedgene set has certain advantages. Overex-pression leads to robust activation of the ARE and potentiallyinduces more subtly activated genes that may have escaped de-tection while using tBHQ or other inducers as a transcriptionalstimulus. In addition, acute viral overexpression also comple-ments the comparison of gene expression between wild-type andNrf2 knock-out mice without the added complication of poten-tial gene compensation caused by chronic absence of Nrf2 overthe life span of the animal (Thimmulappa et al., 2002).
Because basal Nrf2 levels in neurons are considerably lowerthan in glia, the induction of these enzymes in neurons by endog-enous Nrf2 may not necessarily follow the same profile exhibitedby Nrf2 overexpression (Tables 3, 4). Furthermore, the amountof Nrf2 expressed in neurons is likely not the only factor regulat-ing phase II enzyme expression. For example, despite large foldchanges in many phase II enzyme mRNAs in mixed cultures(containing mostly neurons), after Nrf2 overexpression the ab-solute mRNA levels for many phase II enzymes were still wellbelow those found in glial cultures. An estimate of this discrep-ancy can be made by multiplying the fold induction by the basalsignal in Table 3. Perhaps glial cells have higher levels of otherARE-specific transcription factors such as Nrf1 that can contrib-ute to a portion of the observed phase II enzyme gene induction(Venugopal and Jaiswal, 1996, 1998). Alternatively, glia may havereduced Nrf2 degradation via the ubiquitin–proteasome pathway(Nguyen et al., 2002; Sekhar et al., 2002; Stewart et al., 2002).
Given that the expression of phase II detoxification enzymes isgenerally lower in neurons (Eftekharpour et al., 2000; Murphy etal., 2001; Johnson et al., 2002), the large number of genes thatapparently are upregulated in the mixed cultures may reflect, inpart, the presence of contaminating glial cells in these cultures.However, genes that appear to be present only in mixed cultures,but not in glial-enriched cultures, suggest that the gene lists mayrepresent a set of Nrf2-regulated genes specific to neurons, includingguanosine monophosphate reductase and vascular cell adhesionmolecule 1 (Table 4). Similarly, genes that appear to be upregulated
selectively in glia cells also were identified, including �GT and UDP-glucuronosyltransferase. Nevertheless, it is important to note thatincreased expression of a gene in mixed cultures, but not glial-enriched cultures, does not prove necessarily that the gene is upregu-lated exclusively in neurons. It is possible that glial gene expressioncould be altered by direct contact with neurons or response to dif-fusible neuron-derived factors. We have not verified the expressionof these putative neuron- or glial-specific genes by using in situ hy-bridization or immunostaining.
Small molecule inducers of ARE gene expression in brain cellsIn recent years small molecules that induce the activation of Nrf2have been well characterized (Alam et al., 1999; Ishii et al., 2000;Lee et al., 2001). In this study we found that the selective activa-tion of glial Nrf2 by the inducers partially protected neighboringneurons from oxidative stress, whereas direct treatment of mixedcultures provided more extensive neuronal protection. It is pos-sible that, when mixed cultures are treated with tBHQ, inducedneurons are upregulating their own antioxidant defenses in ad-dition to accepting any diffusible sulfhydryl contributions frominduced glia. Consistent with this observation, Johnson et al.(2002) demonstrated by using transgenic ARE-hPAP reportermice that neurons display enhanced ARE-mediated gene expres-sion with tBHQ treatment albeit at a considerably lower levelthan glia. Mixed cortical cultures prepared from these mice alsoexhibit increased resistance to oxidative stress (i.e., H2O2) whenpretreated with tBHQ (our unpublished data).
From a practical standpoint, diet-based therapies that deliverphase II enzyme inducers to the brain may prove to be an efficientand straightforward means for neuroprotection (Fahey et al., 1997).However, like many other drugs designed for CNS disorders, theseinducers face the added complication of passing the blood–brainbarrier (BBB) to affect their targets (Miller, 2002). It remains unclearwhether phase II enzyme inducers, although small and relativelylipophilic, can pass the BBB efficiently before being cleared from thebody. However, once in the brain, activation of both glial and neu-
Figure 9. Schematic diagram of GSH biosynthesis and release pathways that may be involved with Nrf2-dependent coupling ofGSH between astrocytes and neurons. Astrocyte GSH synthesis and release are more robust with Nrf2 overexpression. Higher levelsof xCT (system xc
�) expression were detected, which promotes cystine uptake and provides a precursor for GSH synthesis.Microarray analyses indicate that all major enzymes involved in GSH biosynthesis are upregulated also. GSH release from astrocytesis increased, leading into several possible pathways of extracellular GSH metabolism, including an initial breakdown by�-glutamylcysteine transpeptidase (�GT) and possible further breakdown by aminopeptidase (Apep) into the glutathione pre-cursors Cys, Gly, and CysGly suitable for neuronal uptake (Dringen et al., 1999, 2001). Alternatively, extracellular GSH may be takenup by neurons directly or may contribute to the reduction of cystine into cysteine, which may be a source of sulfhydryl species for neuronaluptake (Sagara et al., 1993; Wang and Cynader, 2000). Neurons may also uptake cystine for glutathione synthesis (Murphy et al., 1990).Microarray analyses also indicate the upregulation of additional factors involved in detoxification, ROS scavenging, and NADPH productionthat may work together with GSH to protect neurons. Genes that are upregulated significantly by Nrf2 overexpression are underlined.Intracellular and extracellular concentrations of glutamate are average values from a combination of previous studies in the human brainand CSF (Siegel, 1981). CSF levels of cystine are typically very low at �0.2 �M (Lakke and Teelken, 1976; Araki et al., 1988; Wang andCynader, 2000). The Invitrogen MEM used in this study is formulated to contain 100 �M cystine.
3404 • J. Neurosci., April 15, 2003 • 23(8):3394 –3406 Shih et al. • Nrf2 Upregulates Glial GSH and Promotes Neuroprotection

ronal antioxidant responses with low doses of electrophilic agentsmay be sufficient for protecting neurons from oxidative stress. Fur-thermore, if glial delivery of sulfhydryl species to neurons occurs invivo, efficient coupling is expected, considering the close associationof neurons and glia and the much higher glial-to-neuron ratio in theCNS (Travis, 1994).
In conclusion, Nrf2 activation in glia produces a strong anti-oxidant response, particularly via the GSH synthesis and usepathway. Neuronal viability is enhanced significantly by an in-creased supply of GSH precursors from Nrf2-overexpressing glia.Future work will determine whether similar neuroprotection canbe achieved in vivo by induction of the phase II response byadministration of small molecule inducers or strategicadenoviral-mediated Nrf2 overexpression in certain areas of thebrain. These approaches may have the potential to mitigate neu-ronal death caused by oxidative stress during stroke, traumaticinjury, or even neurodegenerative disease.
ReferencesAhlgren-Beckendorf JA, Reising AM, Schander MA, Herdler JW, Johnson JA
(1999) Coordinate regulation of NAD(P)H:quinone oxidoreductase andglutathione S-transferases in primary cultures of rat neurons and glia: roleof the antioxidant/electrophile responsive element. Glia 25:131–142.
Alam J, Stewart D, Touchard C, Boinapally S, Choi AM, Cook JL (1999)Nrf2, a Cap’n’Collar transcription factor, regulates induction of the hemeoxygenase-1 gene. J Biol Chem 274:26071–26078.
Araki K, Harada M, Ueda Y, Takino T, Kuriyama K (1988) Alteration ofamino acid content of cerebrospinal fluid from patients with epilepsy.Acta Neurol Scand 78:473– 479.
Bannai S (1986) Exchange of cystine and glutamate across plasma mem-brane of human fibroblasts. J Biol Chem 261:2256 –2263.
Bloom D, Dhakshinamoorthy S, Jaiswal AK (2002) Site-directed mutagen-esis of cysteine to serine in the DNA binding region of Nrf2 decreases itscapacity to upregulate antioxidant response element-mediated expres-sion and antioxidant induction of NAD(P)H:quinone oxidoreductase1gene. Oncogene 21:2191–2200.
Chan K, Kan YW (1999) Nrf2 is essential for protection against acute pul-monary injury in mice. Proc Natl Acad Sci USA 96:12731–12736.
Chen C, Okayama H (1987) High-efficiency transformation of mammaliancells by plasmid DNA. Mol Cell Biol 7:2745–2752.
Chen Y, Vartiainen NE, Ying W, Chan PH, Koistinaho J, Swanson RA (2001)Astrocytes protect neurons from nitric oxide toxicity by a glutathione-dependent mechanism. J Neurochem 77:1601–1610.
Cho HY, Jedlicka AE, Reddy SP, Kensler TW, Yamamoto M, Zhang LY,Kleeberger SR (2002) Role of NRF2 in protection against hyperoxic lunginjury in mice. Am J Respir Cell Mol Biol 26:175–182.
Coyle JT, Puttfarcken P (1993) Oxidative stress, glutamate, and neurode-generative disorders. Science 262:689 – 695.
Crocker SJ, Lamba WR, Smith PD, Callaghan SM, Slack RS, Anisman H, ParkDS (2001) c-Jun mediates axotomy-induced dopamine neuron death invivo. Proc Natl Acad Sci USA 98:13385–13390.
Desagher S, Glowinski J, Premont J (1996) Astrocytes protect neurons fromhydrogen peroxide toxicity. J Neurosci 16:2553–2562.
Dringen R, Pfeiffer B, Hamprecht B (1999) Synthesis of the antioxidantglutathione in neurons: supply by astrocytes of CysGly as precursor forneuronal glutathione. J Neurosci 19:562–569.
Dringen R, Gutterer JM, Hirrlinger J (2000) Glutathione metabolism inbrain metabolic interaction between astrocytes and neurons in the de-fense against reactive oxygen species. Eur J Biochem 267:4912– 4916.
Dringen R, Gutterer JM, Gros C, Hirrlinger J (2001) Aminopeptidase Nmediates the utilization of the GSH precursor CysGly by cultured neu-rons. J Neurosci Res 66:1003–1008.
Drukarch B, Schepens E, Jongenelen CA, Stoof JC, Langeveld CH (1997)Astrocyte-mediated enhancement of neuronal survival is abolished byglutathione deficiency. Brain Res 770:123–130.
Duffy S, So A, Murphy TH (1998) Activation of endogenous antioxidantdefenses in neuronal cells prevents free radical-mediated damage. J Neu-rochem 71:69 –77.
Dwyer BE, Nishimura RN, Lu SY (1995) Differential expression of hemeoxygenase-1 in cultured cortical neurons and astrocytes determined by
the aid of a new heme oxygenase antibody. Response to oxidative stress.Brain Res Mol Brain Res 30:37– 47.
Eftekharpour E, Holmgren A, Juurlink BH (2000) Thioredoxin reductaseand glutathione synthesis is [sic] upregulated by t-butylhydroquinone incortical astrocytes but not in cortical neurons. Glia 31:241–248.
Fahey JW, Zhang Y, Talalay P (1997) Broccoli sprouts: an exceptionally richsource of inducers of enzymes that protect against chemical carcinogens.Proc Natl Acad Sci USA 94:10367–10372.
Friling RS, Bensimon A, Tichauer Y, Daniel V (1990) Xenobiotic-inducibleexpression of murine glutathione S-transferase Ya subunit gene is con-trolled by an electrophile-responsive element. Proc Natl Acad Sci USA87:6258 – 6262.
Gao X, Dinkova-Kostova AT, Talalay P (2001) Powerful and prolongedprotection of human retinal pigment epithelial cells, keratinocytes, andmouse leukemia cells against oxidative damage: the indirect antioxidanteffects of sulforaphane. Proc Natl Acad Sci USA 98:15221–15226.
Gong P, Stewart D, Hu B, Li N, Cook J, Nel A, Alam J (2002) Activation ofthe mouse heme oxygenase-1 gene by 15-deoxy- 12,14-prostaglandin j2 ismediated by the stress response elements and transcription factor Nrf2.Antioxid Redox Signal 4:249 –257.
Griffith OW, Meister A (1979) Potent and specific inhibition of glutathionesynthesis by buthionine sulfoximine (S-n-butyl homocysteine sulfoxi-mine). J Biol Chem 254:7558 –7560.
Hardy S, Kitamura M, Harris-Stansil T, Dai Y, Phipps ML (1997) Construc-tion of adenovirus vectors through Cre-lox recombination. J Virol71:1842–1849.
Hayes JD, Pulford DJ (1995) The glutathione S-transferase supergene fam-ily: regulation of GST and the contribution of the isoenzymes to cancerchemoprotection and drug resistance. Crit Rev Biochem Mol Biol30:445– 600.
Hayes JD, Chanas SA, Henderson CJ, McMahon M, Sun C, Moffat GJ, WolfCR, Yamamoto M (2000) The Nrf2 transcription factor contributesboth to the basal expression of glutathione S-transferases in mouse liverand to their induction by the chemopreventive synthetic antioxidants,butylated hydroxyanisole and ethoxyquin. Biochem Soc Trans 28:33– 41.
Hirrlinger J, Konig J, Keppler D, Lindenau J, Schulz JB, Dringen R (2001)The multidrug resistance protein MRP1 mediates the release of glutathi-one disulfide from rat astrocytes during oxidative stress. J Neurochem76:627– 636.
Hirrlinger J, Schulz JB, Dringen R (2002) Glutathione release from culturedbrain cells: multidrug resistance protein 1 mediates the release of GSHfrom rat astroglial cells. J Neurosci Res 69:318 –326.
Iantomasi T, Favilli F, Vincenzini MT (1999) Evidence of glutathione trans-porter in rat brain synaptosomal membrane vesicles. Neurochem Int34:509 –516.
Ishii T, Itoh K, Takahashi S, Sato H, Yanagawa T, Katoh Y, Bannai S,Yamamoto M (2000) Transcription factor Nrf2 coordinately regulates agroup of oxidative stress-inducible genes in macrophages. J Biol Chem275:16023–16029.
Itoh K, Chiba T, Takahashi S, Ishii T, Igarashi K, Katoh Y, Oyake T, HayashiN, Satoh K, Hatayama I, Yamamoto M, Nabeshima Y (1997) An Nrf2/small Maf heterodimer mediates the induction of phase II detoxifyingenzyme genes through antioxidant response elements. Biochem BiophysRes Commun 236:313–322.
Itoh K, Ishii T, Wakabayashi N, Yamamoto M (1999) Regulatory mecha-nisms of cellular response to oxidative stress. Free Radic Res 31:319 –324.
Johnson DA, Andrews GK, Xu W, Johnson JA (2002) Activation of the an-tioxidant response element in primary cortical neuronal cultures derivedfrom transgenic reporter mice. J Neurochem 81:1233–1241.
Kannan R, Yi JR, Tang D, Li Y, Zlokovic BV, Kaplowitz N (1996) Evidencefor the existence of a sodium-dependent glutathione (GSH) transporter.Expression of bovine brain capillary mRNA and size fractions in Xenopuslaevis oocytes and dissociation from �-glutamyltranspeptidase and facil-itative GSH transporters. J Biol Chem 271:9754 –9758.
Kannan R, Mittur A, Bao Y, Tsuruo T, Kaplowitz N (1999) GSH transport inimmortalized mouse brain endothelial cells: evidence for apical localiza-tion of a sodium-dependent GSH transporter. J Neurochem 73:390 –399.
Kannan R, Chakrabarti R, Tang D, Kim KJ, Kaplowitz N (2000) GSH trans-port in human cerebrovascular endothelial cells and human astrocytes:evidence for luminal localization of Na �-dependent GSH transport inHCEC. Brain Res 852:374 –382.
Shih et al. • Nrf2 Upregulates Glial GSH and Promotes Neuroprotection J. Neurosci., April 15, 2003 • 23(8):3394 –3406 • 3405
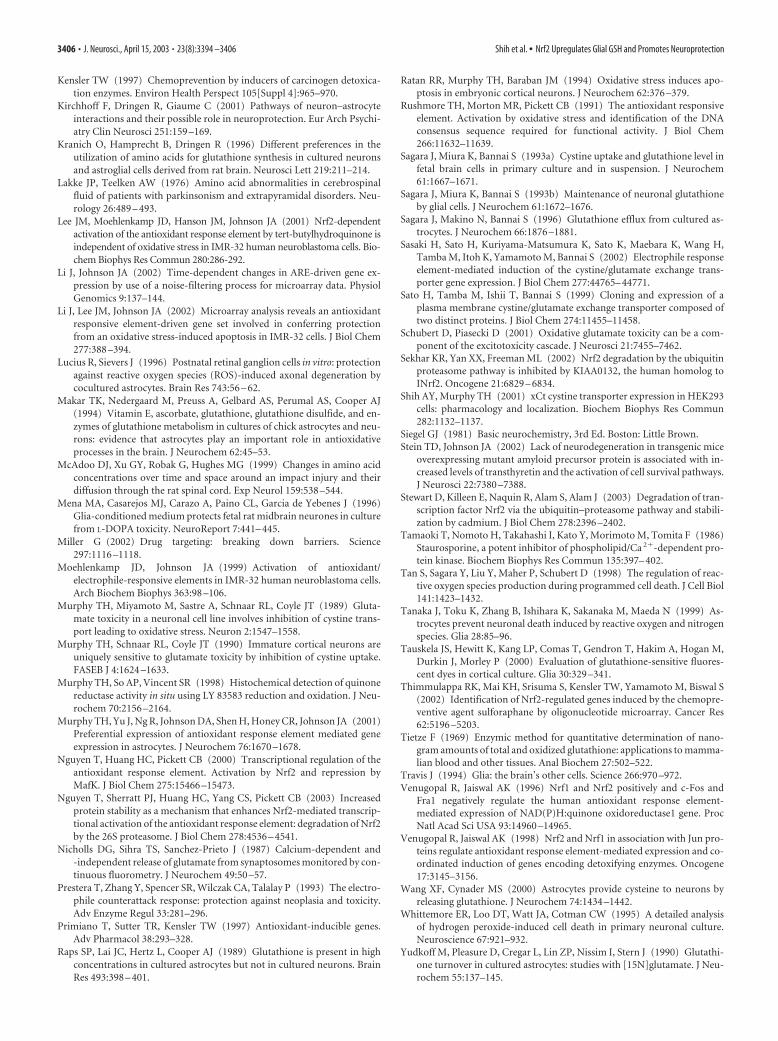
Kensler TW (1997) Chemoprevention by inducers of carcinogen detoxica-tion enzymes. Environ Health Perspect 105[Suppl 4]:965–970.
Kirchhoff F, Dringen R, Giaume C (2001) Pathways of neuron–astrocyteinteractions and their possible role in neuroprotection. Eur Arch Psychi-atry Clin Neurosci 251:159 –169.
Kranich O, Hamprecht B, Dringen R (1996) Different preferences in theutilization of amino acids for glutathione synthesis in cultured neuronsand astroglial cells derived from rat brain. Neurosci Lett 219:211–214.
Lakke JP, Teelken AW (1976) Amino acid abnormalities in cerebrospinalfluid of patients with parkinsonism and extrapyramidal disorders. Neu-rology 26:489 – 493.
Lee JM, Moehlenkamp JD, Hanson JM, Johnson JA (2001) Nrf2-dependentactivation of the antioxidant response element by tert-butylhydroquinone isindependent of oxidative stress in IMR-32 human neuroblastoma cells. Bio-chem Biophys Res Commun 280:286-292.
Li J, Johnson JA (2002) Time-dependent changes in ARE-driven gene ex-pression by use of a noise-filtering process for microarray data. PhysiolGenomics 9:137–144.
Li J, Lee JM, Johnson JA (2002) Microarray analysis reveals an antioxidantresponsive element-driven gene set involved in conferring protectionfrom an oxidative stress-induced apoptosis in IMR-32 cells. J Biol Chem277:388 –394.
Lucius R, Sievers J (1996) Postnatal retinal ganglion cells in vitro: protectionagainst reactive oxygen species (ROS)-induced axonal degeneration bycocultured astrocytes. Brain Res 743:56 – 62.
Makar TK, Nedergaard M, Preuss A, Gelbard AS, Perumal AS, Cooper AJ(1994) Vitamin E, ascorbate, glutathione, glutathione disulfide, and en-zymes of glutathione metabolism in cultures of chick astrocytes and neu-rons: evidence that astrocytes play an important role in antioxidativeprocesses in the brain. J Neurochem 62:45–53.
McAdoo DJ, Xu GY, Robak G, Hughes MG (1999) Changes in amino acidconcentrations over time and space around an impact injury and theirdiffusion through the rat spinal cord. Exp Neurol 159:538 –544.
Mena MA, Casarejos MJ, Carazo A, Paino CL, Garcia de Yebenes J (1996)Glia-conditioned medium protects fetal rat midbrain neurones in culturefrom L-DOPA toxicity. NeuroReport 7:441– 445.
Miller G (2002) Drug targeting: breaking down barriers. Science297:1116 –1118.
Moehlenkamp JD, Johnson JA (1999) Activation of antioxidant/electrophile-responsive elements in IMR-32 human neuroblastoma cells.Arch Biochem Biophys 363:98 –106.
Murphy TH, Miyamoto M, Sastre A, Schnaar RL, Coyle JT (1989) Gluta-mate toxicity in a neuronal cell line involves inhibition of cystine trans-port leading to oxidative stress. Neuron 2:1547–1558.
Murphy TH, Schnaar RL, Coyle JT (1990) Immature cortical neurons areuniquely sensitive to glutamate toxicity by inhibition of cystine uptake.FASEB J 4:1624 –1633.
Murphy TH, So AP, Vincent SR (1998) Histochemical detection of quinonereductase activity in situ using LY 83583 reduction and oxidation. J Neu-rochem 70:2156 –2164.
Murphy TH, Yu J, Ng R, Johnson DA, Shen H, Honey CR, Johnson JA (2001)Preferential expression of antioxidant response element mediated geneexpression in astrocytes. J Neurochem 76:1670 –1678.
Nguyen T, Huang HC, Pickett CB (2000) Transcriptional regulation of theantioxidant response element. Activation by Nrf2 and repression byMafK. J Biol Chem 275:15466 –15473.
Nguyen T, Sherratt PJ, Huang HC, Yang CS, Pickett CB (2003) Increasedprotein stability as a mechanism that enhances Nrf2-mediated transcrip-tional activation of the antioxidant response element: degradation of Nrf2by the 26S proteasome. J Biol Chem 278:4536 – 4541.
Nicholls DG, Sihra TS, Sanchez-Prieto J (1987) Calcium-dependent and-independent release of glutamate from synaptosomes monitored by con-tinuous fluorometry. J Neurochem 49:50 –57.
Prestera T, Zhang Y, Spencer SR, Wilczak CA, Talalay P (1993) The electro-phile counterattack response: protection against neoplasia and toxicity.Adv Enzyme Regul 33:281–296.
Primiano T, Sutter TR, Kensler TW (1997) Antioxidant-inducible genes.Adv Pharmacol 38:293–328.
Raps SP, Lai JC, Hertz L, Cooper AJ (1989) Glutathione is present in highconcentrations in cultured astrocytes but not in cultured neurons. BrainRes 493:398 – 401.
Ratan RR, Murphy TH, Baraban JM (1994) Oxidative stress induces apo-ptosis in embryonic cortical neurons. J Neurochem 62:376 –379.
Rushmore TH, Morton MR, Pickett CB (1991) The antioxidant responsiveelement. Activation by oxidative stress and identification of the DNAconsensus sequence required for functional activity. J Biol Chem266:11632–11639.
Sagara J, Miura K, Bannai S (1993a) Cystine uptake and glutathione level infetal brain cells in primary culture and in suspension. J Neurochem61:1667–1671.
Sagara J, Miura K, Bannai S (1993b) Maintenance of neuronal glutathioneby glial cells. J Neurochem 61:1672–1676.
Sagara J, Makino N, Bannai S (1996) Glutathione efflux from cultured as-trocytes. J Neurochem 66:1876 –1881.
Sasaki H, Sato H, Kuriyama-Matsumura K, Sato K, Maebara K, Wang H,Tamba M, Itoh K, Yamamoto M, Bannai S (2002) Electrophile responseelement-mediated induction of the cystine/glutamate exchange trans-porter gene expression. J Biol Chem 277:44765– 44771.
Sato H, Tamba M, Ishii T, Bannai S (1999) Cloning and expression of aplasma membrane cystine/glutamate exchange transporter composed oftwo distinct proteins. J Biol Chem 274:11455–11458.
Schubert D, Piasecki D (2001) Oxidative glutamate toxicity can be a com-ponent of the excitotoxicity cascade. J Neurosci 21:7455–7462.
Sekhar KR, Yan XX, Freeman ML (2002) Nrf2 degradation by the ubiquitinproteasome pathway is inhibited by KIAA0132, the human homolog toINrf2. Oncogene 21:6829 – 6834.
Shih AY, Murphy TH (2001) xCt cystine transporter expression in HEK293cells: pharmacology and localization. Biochem Biophys Res Commun282:1132–1137.
Siegel GJ (1981) Basic neurochemistry, 3rd Ed. Boston: Little Brown.Stein TD, Johnson JA (2002) Lack of neurodegeneration in transgenic mice
overexpressing mutant amyloid precursor protein is associated with in-creased levels of transthyretin and the activation of cell survival pathways.J Neurosci 22:7380 –7388.
Stewart D, Killeen E, Naquin R, Alam S, Alam J (2003) Degradation of tran-scription factor Nrf2 via the ubiquitin–proteasome pathway and stabili-zation by cadmium. J Biol Chem 278:2396 –2402.
Tamaoki T, Nomoto H, Takahashi I, Kato Y, Morimoto M, Tomita F (1986)Staurosporine, a potent inhibitor of phospholipid/Ca 2�-dependent pro-tein kinase. Biochem Biophys Res Commun 135:397– 402.
Tan S, Sagara Y, Liu Y, Maher P, Schubert D (1998) The regulation of reac-tive oxygen species production during programmed cell death. J Cell Biol141:1423–1432.
Tanaka J, Toku K, Zhang B, Ishihara K, Sakanaka M, Maeda N (1999) As-trocytes prevent neuronal death induced by reactive oxygen and nitrogenspecies. Glia 28:85–96.
Tauskela JS, Hewitt K, Kang LP, Comas T, Gendron T, Hakim A, Hogan M,Durkin J, Morley P (2000) Evaluation of glutathione-sensitive fluores-cent dyes in cortical culture. Glia 30:329 –341.
Thimmulappa RK, Mai KH, Srisuma S, Kensler TW, Yamamoto M, Biswal S(2002) Identification of Nrf2-regulated genes induced by the chemopre-ventive agent sulforaphane by oligonucleotide microarray. Cancer Res62:5196 –5203.
Tietze F (1969) Enzymic method for quantitative determination of nano-gram amounts of total and oxidized glutathione: applications to mamma-lian blood and other tissues. Anal Biochem 27:502–522.
Travis J (1994) Glia: the brain’s other cells. Science 266:970 –972.Venugopal R, Jaiswal AK (1996) Nrf1 and Nrf2 positively and c-Fos and
Fra1 negatively regulate the human antioxidant response element-mediated expression of NAD(P)H:quinone oxidoreductase1 gene. ProcNatl Acad Sci USA 93:14960 –14965.
Venugopal R, Jaiswal AK (1998) Nrf2 and Nrf1 in association with Jun pro-teins regulate antioxidant response element-mediated expression and co-ordinated induction of genes encoding detoxifying enzymes. Oncogene17:3145–3156.
Wang XF, Cynader MS (2000) Astrocytes provide cysteine to neurons byreleasing glutathione. J Neurochem 74:1434 –1442.
Whittemore ER, Loo DT, Watt JA, Cotman CW (1995) A detailed analysisof hydrogen peroxide-induced cell death in primary neuronal culture.Neuroscience 67:921–932.
Yudkoff M, Pleasure D, Cregar L, Lin ZP, Nissim I, Stern J (1990) Glutathi-one turnover in cultured astrocytes: studies with [15N]glutamate. J Neu-rochem 55:137–145.
3406 • J. Neurosci., April 15, 2003 • 23(8):3394 –3406 Shih et al. • Nrf2 Upregulates Glial GSH and Promotes Neuroprotection
Related Documents