Cooperatives for Staple Crop Marketing Tanguy Bernard, David J. Spielman, Alemayehu Seyoum Taffesse, and Eleni Z. Gabre-Madhin evid ence from ethiopia

Welcome message from author
This document is posted to help you gain knowledge. Please leave a comment to let me know what you think about it! Share it to your friends and learn new things together.
Transcript

Cooperatives for Staple Crop Marketing
Tanguy Bernard, David J. Spielman, Alemayehu Seyoum Taffesse, and Eleni Z. Gabre-Madhin
e v i d e n c e f r o m e t h i o p i a

About IFPRIThe International Food Policy Research Institute (IFPRI®) was established in 1975 to identify and analyze alternative national and international strategies and policies for meeting food needs of the developing world on a sustainable basis, with particular emphasis on low-income countries and on the poorer groups in those countries. While the research effort is geared to the precise objective of contributing to the reduction of hunger and malnutrition, the factors involved are many and wide-ranging, requiring analysis of underlying processes and extending beyond a narrowly defined food sector. The Insti-tute’s research program reflects worldwide collaboration with governments and private and public institutions interested in increasing food produc-tion and improving the equity of its distribution. Research results are dis-seminated to policymakers, opinion formers, administrators, policy analysts, researchers, and others concerned with national and international food and agricultural policy.
About IFPRI Research MonographsIFPRI Research Monographs are well-focused, policy-relevant monographs based on original and innovative research conducted at IFPRI. All manuscripts submitted for publication as IFPRI Research Monographs undergo extensive external and internal reviews. Prior to submission to the Publications Review Committee, each manuscript is circulated informally among the author’scolleagues. Upon submission to the Committee, the manuscript is reviewed by an IFPRI reviewer and presented in a formal seminar. Three additional reviewers—at least two external to IFPRI and one from the Committee—are selected to review the manuscript. Reviewers are chosen for their familiarity with the country setting. The Committee provides the author its reaction to the reviewers’ comments. After revising as necessary, the author resubmits the manuscript to the Committee with a written response to the reviewers’ and Committee’s comments. The Committee then makes its recommenda-tions on publication of the manuscript to the Director General of IFPRI. With the Director General’s approval, the manuscript becomes part of the IFPRI Research Monograph series. The publication series, under the original name of IFPRI Research Reports, began in 1977.


Cooperatives for Staple Crop MarketingEvidence from Ethiopia
Tanguy Bernard, David J. Spielman, Alemayehu Seyoum Taffesse, and Eleni Z. Gabre-Madhin
RESEARCHMONOGRAPH 164

Copyright © 2010 International Food Policy Research Institute. All rights reserved. Sections of this material may be reproduced for personal and not-for-profit use without the express written permission of but with acknowledgment to IFPRI. To reproduce material contained herein for profit or commercial use requires express written permission. To obtain permission, contact the Communications Division at [email protected].
International Food Policy Research Institute2033 K Street, NWWashington, D.C. 20006-1002, U.S.A.Telephone +1-202-862-5600www.ifpri.org
DOI: 10.2499/9780896291751RR164
Library of Congress Cataloging-in-Publication Data
Cooperatives for staple crop marketing : evidence from Ethiopia / Tanguy Bernard . . . [et al.]. p. cm. — (IFPRI research monograph ; 164) Includes bibliographical references and index. ISBN 978-0-89629-175-1 (alk. paper) 1. Cooperative marketing of farm produce—Ethiopia. 2. Marketing cooperatives—Ethiopia. 3. Farms, Small—Economic aspects—Ethiopia.4. Grain—Cooperative marketing—Ethiopia. I. Bernard, Tanguy. II. International Food Policy Research Institute. III. Series: IFPRIresearch monograph ; 164.HD1491.E83C66 2010334′.6830963—dc22 2010003993

Contents
List of Tables vi
List of Figures viii
List of Boxes ix
Foreword x
Acknowledgments xii
Acronyms and Abbreviations xiii
Currency xiv
Summary xv
1. Introduction 1
2. Ethiopian Cooperatives 13
3. Impact of Cooperatives on Members’ Commercialization 27
4. Cooperatives for Whom? 48
5. Commercialization Performance of Cooperatives 58
6. Conclusions 70
References 74
About the Authors 82
Index 83
v

Tables
1.1 Participation in staple foodgrain markets, eastern and southern Africa 3
1.2 Evolution of the number of cooperatives in selected countries, 1989–92 and 2005 6
1.3 Incidence of cooperatives in nine African countries 7
2.1 Households reporting membership in traditional institutions 15
2.2 Rural organizations during Ethiopia’s Derg regime, 1988–89 16
2.3 Number of registered primary cooperatives and members by region, Ethiopia, 2007 20
2.4 Household participation in cooperatives among smallholder farmers in Ethiopia 20
2.5 Types of cooperatives in Ethiopia, 2007 25
2.6 Grain-marketing cooperatives in Ethiopia, descriptive statistics 26
3.1 Treatment and comparison kebeles, by development domains 31
3.2 Number of treatment and comparison kebeles, by region 32
3.3 Balancing tests: treatment and comparison kebeles 33
3.4 Distribution of households across treatment and comparison kebeles 35
3.5 Probit estimations of determinants of participation in cooperatives 36
3.6 Balancing tests of matched samples 38
3.7 Effect of cooperatives on members’ cereals commercialization 42
3.8 Heterogeneous effects of membership on commercialization 45
4.1 Reasons not to join the cooperative 49
4.2 Determinants of households’ participation in cooperatives 50
4.3 Cooperative-level indicators of inclusiveness 52
4.4 Membership criteria and actual membership 52
4.5 Activities undertaken by agricultural marketing cooperatives 54
vi

4.6 Who benefits from cooperative activities? 55
5.1 Marketing performance of Ethiopian cooperatives 59
5.2 Characteristics and marketing performance of sampled cooperatives 61
5.3 Social activities and size of cooperative 63
5.4 Marketing performance of cooperatives 64
5.5 Membership, governance, and performance 69
TABLES vii

Figures
2.1 Actors and relationships in cooperative promotion and development, Ethiopia, 2007 18
2.2 Kebeles with at least one cooperative, 1991–2005 19
3.1 Geographic location of treatment and comparison kebeles 34
3.2 Propensity-score distribution among treatment and comparison observations 37
3.3 Distribution of cooperative membership impact across households, kernel-density estimates 46
5.1 Participatory decisionmaking 68
viii

Boxes
2.1 Amecha Area Multipurpose Cooperative 22
2.2 Awara Cooperative 23
ix

x
Foreword
During the 1980s, agricultural-sector reforms in many developing coun-tries led to the dismantling of rural producer organizations (RPOs)—farmers’ organizations, associations, and cooperatives. This was part
of a larger process aimed at reducing the role of the state in the economy, eliminating inefficiencies in food production, and encouraging the growth of competitive markets in the agricultural sector. These reforms assumed that the private sector would replace the state as the key source of agricultural inputs and marketing services for smallholder farmers. While this has occurred in some countries with respect to cash crops, it is far less common in the case of staple foodcrops—crops that are critical to the livelihoods of the vast majority of smallholders in the developing world. In recent years, RPOs have reappeared on the international developmentagenda as a potentially important means of linking farmers to markets, increas-ing agricultural productivity, and ultimately reducing rural poverty. Innova-tive RPO models are being held up as the key to helping smallholders better manage the procurement and distribution of inputs, aggregate their surplus farm output, and bargain for better terms of trade in the marketplace. These same models are also being leveraged to help government agencies and non-governmental organizations to better identify and reach out to the rural poor with an array of social and economic welfare programs. However, it is not clear how effective these RPO models may be, particu-larly for smallholders who cultivate food staples. What is missing is a suffi-cient body of evidence on where, when, and how RPOs benefit the rural poor—a significant gap in light of the checkered history of cooperatives in many countries. While evidence suggests that cooperatives play a constructive role when high-value agricultural commodities such as dairy and horticultural products are involved, there is far less evidence of their contribution to increasing returns to farmers who cultivate staple foods, particularly cere-als. This is because food staples are quite different from high-value crops in that they rarely offer the lucrative returns to farmers that high-value crops do. Staples are also more susceptible to distortions caused by urban-biased price-control policies and the competing price effects of food aid and food imports.

FOREWORD xi
Ethiopia presents an important case in point. Low productivity, high trans-action costs, limited use of modern inputs, and minimal levels of commercial-ization among small-scale, resource-poor farmers are defining characteristics of agriculture in Ethiopia. The results—endemic rural poverty and chronic food insecurity—are all too well known. Yet farmers, policymakers, and administrators in Ethiopia have made concerted efforts in recent decades to reverse this situation. One particular effort has been to strengthen the role of farmers’ cooperatives in marketing farm output, thereby reducing the costs of moving agricultural commodities from farmers to consumers and improving farmers’ bargaining power in the country’s expanding market economy. This study provides some new empirical evidence that may help us under-stand the conditions under which cereal marketing cooperatives are promot-ing smallholder commercialization and generating rural welfare improvements in Ethiopia. We hope that this evidence will provide new insights for policy-makers, researchers, and development practitioners who are encouraged by the re-emergence of RPOs as a means of benefiting the rural poor.
Shenggen FanDirector General, IFPRI

xii
Acknowledgments
We gratefully acknowledge the support of our colleagues at the Ethio-pian Development Research Institute, the International Food Policy Research Institute, and the Ethiopian Strategy Support Program. We
are particularly indebted to Shenggen Fan, Paul Dorosh, Joachim von Braun, Abey Meherka, Abera Demeke, Dawit Kelemework, Shahidur Rashid, Kwaw Andam, Tigist Mamo, Etenesh Yitna, Fikru Wubshet, Yetnayet Begashaw, and several anonymous referees. Any and all errors are the sole responsibility of the authors.

Acronyms and Abbreviations
BoARD Bureau of Agriculture and Rural Development
BoCP Bureau of Cooperative Promotion
CBO community-based organization
ECS Ethiopian Cooperatives Survey
EDRI Ethiopian Development Research Institute
ESCS Ethiopian Smallholders Commercialization Survey
FCA Federal Cooperatives Agency
GDP gross domestic product
GoE Government of Ethiopia
IFPRI International Food Policy Research Institute
NGO nongovernmental organization
RPO rural producer organization
SNNP Southern Nations, Nationalities, and Peoples regional state
xiii

Currency
Ethiopia Ethiopian birr (ETB)
xiv

Summary
The commercialization of crops grown by small-scale, resource-poor farmers has the potential to increase household food security, reduce rural poverty, and contribute to agricultural development and econo-
mywide growth. By encouraging the application of modern inputs and farming techniques, diversification out of low-yielding subsistence crops, and spe-cialization in more tradable crops, commercialization can increase farming incomes, enhance purchasing power, and reduce vulnerability among small-holders. If the positive output shocks resulting from large-scale technological changes are offset by short-term policies to manage the resulting negative price and income effects, this commercialization process can rapidly shift smallholders from low-productivity, low-income traps to higher-productivity, higher-income livelihood systems that are integrated into the wider modern economy. However, in the face of imperfect markets, high transaction costs, and agro-climatic risks, few smallholders in Sub-Saharan Africa have been able to real-ize the potential gains from commercialization. This is particularly true with regard to smallholders who cultivate food staples. Such crops constitute the bulk of agricultural production in Africa and employ the majority of people, and therefore hold the greatest potential for poverty reduction on the conti-nent. Commercialization of food staples—especially cereal crops—in the region is very low due to their generally low returns to producers, nondifferentiabil-ity in local markets, susceptibility to urban-biased price controls, and vulner-ability to the competing price effects of food aid and food imports. Without appropriate institutional mechanisms to improve the market in-centives for cereal production, smallholders throughout the region are unlikely to realize the benefits of commercialization any time soon. Rural producer organizations (RPOs)—such as farmers’ organizations, producers’ associations, and rural cooperatives—represent one such mechanism. After a 25-year hiatus, RPOs have returned to the policy agenda as a means of promoting equitable growth and poverty reduction. By leveraging the power of collective action, RPOs are expected to help smallholders gain a footing in competitive markets, help development partners in reaching the poor, and provide a voice to under-represented communities and households in rural areas.
xv

xvi SUMMARY
However, empirical evidence about how RPOs contribute to growth and development in smallholder-based agriculture is required in order to help realize the potential of RPOs. This study meets the need for evidence through an intensive analysis of data from two in-depth surveys conducted in Ethiopia in 2005 and 2006. The analysis aims to identify the conditions under which RPOs engaged in cereal marketing successfully promote smallholder commer-cialization and to determine how the benefits are distributed.

CHAPTER 1
Introduction
Smallholder Commercialization, Food Staples, and Sub-Saharan Africa
Smallholder commercialization and rural welfare are closely linked con-cepts. There is extensive theoretical and empirical evidence showing how the commercialization of small-scale, resource-poor farmers can
lead to increases in household food security and reductions in rural poverty, and how these improvements can contribute to agricultural development andeconomywide growth (for example, Timmer 1988; Fafchamps 2005). By encour-aging the application of modern inputs and farming techniques, diversifica-tion out of low-yielding subsistence crops, and specialization into more tradable crops, commercialization can increase farming incomes, enhance purchasing power, and reduce vulnerability among smallholders. If the positive outputshocks—the commodity gluts—resulting from large-scale technological changes are offset by short-term policies to manage the resulting negative price andincome effects, this commercialization process can rapidly shift smallholdersfrom low-productivity, low-income traps to higher productivity, higher income livelihood systems that are integrated with the wider modern economy.1 The evidence from the so-called Green Revolution in Asia during the late 1960s is a testament to this, as are other, more incremental processes of small-holder commercialization in Asia and Latin America since then (Hazell and Ramasamy 1991; Rosegrant and Hazell 2000; Hazell and Haddad 2001). However, in the face of imperfect markets, high transaction costs, and sig-nificant agroclimatic risks, few smallholders in Sub-Saharan Africa have been able to realize the potential gains from commercialization. This is particu-
1
1 The choice of which policies are appropriate is a matter of debate. Solutions range from market liberalization as suggested (Schultz 1978) to redistributive pricing policies (Taylor 1980; Streeten 1987) or short-term price stabilizing interventions (Timmer 1997). See Gabre-Madhin, Barrett, and Dorosh (2003) for a review of options for addressing the theory of the “agricultural technology treadmill” first posited by Cochrane (1958).

larly true with regard to smallholders who cultivate food staples—crops that constitute the bulk of agricultural production in Africa, employ the majority of people, and therefore hold the greatest potential for poverty reduction on the continent (Omamo et al. 2006; World Bank 2008). Commercialization of food staples—particularly cereal crops—in the region is particularly low (Table 1.1). Low commercialization of cereals in Sub-Saharan Africa stems from the unique and challenging nature of cereals, including their generally low return to producers, nondifferentiability in local markets, susceptibility to urban-biased price controls, and vulnerability to the competing price effects of food aid and food imports (see, for example, Gabre-Madhin 2001; Barrett 2008). Without appropriate institutional mechanisms to improve the market incen-tives for cereal production, it is unlikely that smallholders throughout the region will realize the benefits of commercialization any time soon. Over the past decade, rural producer organizations (RPOs) have re-emerged as one such mechanism. Farmers’ organizations, producers’ associations, and rural cooperatives have returned to the policy agenda after a 25-year hiatus as a means of promoting equitable growth and poverty reduction (see, for example, Collion and Rondot 1998; World Bank 2003, 2008). By leveraging the power of collective action, RPOs are expected to assist smallholders in aggre-gating their surplus output, realizing scale economies in marketing, and bar-gaining for better terms of trade in the marketplace. RPOs are also expected to serve as a means of identifying the rural poor, securing grassroots partners for state and nonstate development programs, and representing the voice of the rural poor in local governance systems. In short, RPOs are viewed as a key institutional mechanism to improve rural livelihoods. This renewed interest in RPOs is of importance to Sub-Saharan Africa, where agriculture is the mainstay of the region’s economy and where agricul-tural growth and development are decidedly smallholder-based.2 However, without empirical evidence on exactly how RPOs contribute to growth and development in smallholder-based agriculture, it is unclear how much this newfound interest can contribute. Thus, this study aims to better identify the conditions under which RPOs specifically engaged in cereal marketing are successfully promoting smallholder commercialization and how the benefits are distributed, using illustrations from cooperatives in Ethiopia.
2 CHAPTER 1
2 Agriculture is the primary source of livelihood for about 65 percent of all people living in Sub-Saharan Africa, and it accounts for up to 40 percent of the region’s gross domestic product (GDP) and around 60 percent of the region’s exports. And more than 90 percent of agricultural production is attributable to small-scale farming (Resnick 2004).

RPOs: A Historical PerspectiveThe historical record demonstrates just how valuable RPOs can be to agri-cultural development. For example, RPOs have played an important role in transforming the rural economies of many industrialized countries.3 In the European Union there are some 30,000 agricultural cooperatives with 9 million members, accounting for 50 percent of the overall market for agricultural inputs and 60 percent of the market for agricultural products (Mercoiret, Pesche, and Bosc 2006). In the United States, cooperatives control about 80 percent of thecountry’s dairy production system and are deeply involved in a range of spe-cialty agricultural commodities.
INTRODUCTION 3
Table 1.1 Participation in staple foodgrain markets, eastern and southern Africa
PercentageCountry Crop Year of sellers Study
Ethiopia Maize, teff 1996 25n Jayne, Zulu, and Nijhoff (2006) Barley 1999–2000 10g Levinsohn and McMillan (2007)a
Maize 23g Sorghum 11g Teff 20g Wheat 12gKenya Maize 1997 29n Nyoro, Kiiru, and Jayne (1999) 1998 34n 1999 39n Renkow, Hallstrom, and Karanja (2004) 2000 30n Jayne, Zulu, and Nijhoff (2006)Madagascar Rice 1990 32g Barrett and Dorosh (1996) 2001 25n Minten and Barrett (2008)Mozambique Basic food 1996–97 14g Heltberg and Tarp (2002) Maize 2001–02 30g Boughton et al. (2007) Maize 2005 16g Tschirley and Abdula (2007) Rice 2002 43nRwanda Beans 1986–97 22n Weber et al. (1988) Sorghum 24nSomalia Maize 1986–87 39n Weber et al. (1988)Tanzania Food 2003 33n Sarris, Savastano, and Christiaensen (2006)Zambia Maize 2000 26n Jayne, Zulu, and Nijhoff (2006)Zimbabwe Maize 1984–85 45n Weber et al. (1988) Grain 1996 27g Govereh and Jayne (2003)
Source: Barrett (2008).Note: g means gross; n means net.aRural households only.
3 See Malassis (2000) for a description of how farmers’ organizations were instrumental in France’s agricultural and rural development.

RPOs have also played an important role in Latin America and Asia (see, for example, Damiani 2000, 2001; Berdegue 2001). In Colombia, the National Federation of Coffee Growers provides marketing services to a half-million coffee growers, most of them smallholders with less than 2 hectares of land. In India, cooperatives account for 22 percent of domestic milk production. They have played a central role not only in organizing milk production and marketing among more than 12 million small-scale producers (each holding just one or two cows) but also in moving the country out of chronic shortages and into the dairy export business (Sharma and Gulati 2003). RPOs also have a recognized role to play in the management of natural resources, where collective action among small farmers is often a necessary condition for sustaining the equitable use of water resources, pasture lands, and other common pool resources. Syntheses by Agrawal (2001) and Meinzen-Dick et al. (2002), among others, provide insight into the importance of group size, composition, and structure as factors that contribute to success in the collective management of natural resources. Of course, RPOs also have a well-known record of failure in many devel-oping countries. Intractable market constraints, politicization of leadership, elite capture, and breakdowns in collective action are just some of the factors contributing to RPO failures (see, for example, Tendler [1983] on Bolivia and Banerjee et al. [2001] on India). This record of failure is a real-ity in Sub-Saharan Africa as much as elsewhere in the developing world. To provide some context for this study, we review here the history of RPOs in Sub-Saharan Africa in broad brushstrokes, from the 1960s to the present. At the time of the emergence of independent African nations in the 1960s, RPOs (more commonly referred to as cooperatives) existed in many African countries. In Anglophone African countries, such as Kenya, South Africa, Zam-bia, and Zimbabwe, organizations representing the interests of large-scale farmers played an important role in lobbying for state support for marketing, input supply, and research (Jayne and Jones 1997). Some of these organiza-tions, such as the Kenya Farmers Association or the Buganda Growers Associa-tion, were formed as early as the 1920s to organize the collective marketing of such cash crops as maize and were closely linked to state marketing boards and input supply monopolies (Ariga, Jayne, and Nyoro 2006; Develtere, Pollet,and Wanyama 2008). Several exceptions in Anglophone Africa suggest that colonial authorities did have some interest in encouraging cooperatives among small farmers. Organizations established in the 1920s, such as the Kilimanjaro Native Farm-ers Association in Tanganyika or the Buganda Growers Association, sought to promote collective marketing of coffee and cotton by “native” smallholders. These and other smallholder cooperatives were generally based on very simi-
4 CHAPTER 1

lar designs that drew on the colonial experience in South Asia, suggesting a one-size-fits-all approach that may have not been entirely appropriate for Africa’s many and varied socioeconomic contexts (Kabuga 2005; Develtere, Pollet, and Wanyama 2008). In Francophone countries, the experience was somewhat different. Colo-nial legislation dating back to 1893 encouraged the establishment of Sociétés Indigènes de Prévoyance, de Secours et de Prêts Mutuels. These Provident Societies (which later became “Mutual Societies for Rural Development”) were intended to support the production of agricultural commodities among small and large farmers with both input and marketing services. As they evolved, they took on such characteristics as compulsory membership and became vehicles of state influence, though not to the extent seen in Anglo-phone Africa (Develtere, Pollet, and Wanyama 2008). It was not until immediately after independence that the issue of RPOs and small-scale farmers took center stage in the region’s agricultural sectors. Newly independent governments widely promoted them as a means of modernizing the agricultural sector while also building on traditional solidarity norms in rural communities (Bosc et al. 2003). For example, these RPOs played a role in improving access to household assets and agricultural services for small-scale farmers in Zimbabwe during the early 1980s and may have contributed significantly to the country’s food security following the protracted struggle for independence (Bratton 1986). In most cases, these cooperatives were closely tied to centrally planned production and marketing systems—systems that were fairly unfamiliar to smallholders and were designed without allowances for direct control by themembers themselves. They were, in effect, cooperatives without the ben-efit of cooperators (Bosc et al. 2003). Weak economic incentives, excessive state intervention, elite capture, and other forms of rent-seeking behav-ior did little to modernize agriculture or to generate the surpluses needed to foster wider growth, development, and poverty reduction (Lele 1981; Braverman, Guasch, and Huppi 1991; Deininger 1995; Jayne and Jones 1997; Bosc et al. 2003). Policy reforms introduced under the structural adjustment programs of the 1980s in many Sub-Saharan African countries significantly diminished the role and influence of state-controlled RPOs throughout the region. Yet the private investors and entrepreneurs who were, in theory, expected to replace these cooperatives as intermediaries between supply and demand failed to materialize, except in a few isolated cases relating to high-value crops (Jayne and Jones 1997; Dorward et al. 2004; Piesse et al. 2005; World Bank 2008). Smallholders whose livelihoods depended on cereals and other food staples remained largely tied to the low-productivity, low-income trap.
INTRODUCTION 5

Since the 1990s, a new breed of RPOs has emerged in some Sub-Saharan African countries that is defined by three key characteristics. First, these RPOs are member-controlled entities (rather than instruments of the state) firmly rooted in the rural communities that they mean to serve. Second, they maintain voluntary and open membership policies, rather than compulsory membership, as in many earlier cooperatives. Third, they often provide a wide array of ser-vices to their members, ranging from marketing of members’ surplus output to the provision of public goods for the community (Bernard et al. 2008; Devel-tere, Pollet, and Wanyama 2008). Tables 1.2 and 1.3 provide an indication ofthe size and extent of these cooperatives in selected Sub-Saharan African countries. Today there is growing evidence of RPO successes from across the region, particularly in the area of agricultural commodity marketing. Examples include cotton in Mali (Tefft 2004), green beans in Kenya (Narrod et al. 2008), coffee in Ethiopia (Kodama 2007), onions in Burkina Faso (KIT and IIRR 2008), dairy in Kenya (Sinja et al. 2006), and others that are synthesized in Markelova et al. (2008). Yet few of these success stories focus on RPOs involved in the production and marketing of food staples. And apart from a review by Coulter (2007) on farmer groups and staple-food marketing in Africa and one by Shiferaw, Obare, and Muricho (2008) on dry legumes in Kenya, few studies examine grain-marketing cooperatives and their impact on production, commercialization, and poverty. And fewer still provide rigor-ous assessments of the extent to which RPOs include poorer households at the intracommunity level (Collion and Rondot 2001; Ferris, Engoru, and Kaganzi2008). Only a couple of reports are based on a quantitative approach (Donnelly-Roark, Ouedraogo, and Ye 2001 on Burkina Faso; Bernard et al. 2008 on Sen-egal and Burkina Faso). Given the importance of food-staple production to rural livelihoods in Sub-Saharan Africa, the persistent market failures that
6 CHAPTER 1
Table 1.2 Evolution of the number of cooperatives in selected countries, 1989–92 and 2005
Number of active cooperatives Number of members (million)
1989–92 2005 1989–92 2005
Ghana 1,000 2,850 n.a. 2.4Kenya 4,000 7,000 2.5 3.3Nigeria 29,000 50,000 2.6 4.3Senegal 2,000 6,000 n.a. 3.0
Source: Develtere, Pollet, and Wanyama (2008).Note: n.a. means not available.

constrain the commercialization of food staples, and the potential contribu-tion that collective action could make to reducing rural poverty, there is much to gain from a closer examination of RPOs as a possible solution (Uphoff 1993; Chirwa et al. 2005; Neven, Reardon, and Hopkins 2005; Mercoiret and Mfou’ou 2006; Mercoiret, Pesche, and Bosc 2006; Bernard et al. 2008). Past studies of these issues point out that although cooperatives are poten-tially important in improving price incentives and encouraging small-scale pro-duction, nonprice factors (such as the composition and design of the coopera-tive, or the dynamics of collective action) also have a significant influence on the supply response from small farmers (Lele 1975; Bebbington 1996; Poulton, Dorward, and Kydd 2005; Develtere, Pollet, and Wanyama 2008). In its World Development Report (2008), the World Bank highlights the issue in terms of the unresolved conflict between efficiency and equity: RPOs must balance com-munity norms of social inclusiveness and solidarity against business norms of professionalism and competitiveness. As policymakers and donors throughout Sub-Saharan Africa begin to invest anew in efforts to promote cooperatives, there is a need to generate new knowledge about the potential efficiency–equity trade-offs inherent in grain-marketing cooperatives.
INTRODUCTION 7
Table 1.3 Incidence of cooperatives in nine African countries
Population Number of Number of membersCountry (million) cooperatives (thousand)
Cape Verde 0.47 300a 6Egypt 73.4 13,100a 10,150Ethiopia 72.4 14,400a 4,500Ghana 21.4 2,850a 2,400Kenya 32.4 10,640b 3,370Niger 12.4 11,300c 332South Africa 45.2 5,000a 75Senegal 10.3 6,000d 3,000Uganda 26.6 7,476a 323 Total 429.8 71,066a 30,136
Source: Develtere, Pollet, and Wanyama (2008) based on data from various government agencies.
Note: The average penetration rate for all countries is 7 percent.aIncludes both registered cooperatives and village associations. An estimated 1,300 are reported to be viable.bAn estimated 7,000 are reported to be currently active.cIncludes “pre-cooperatives.” Figures are thought to be problematic (see Develtere, Pollet, and Wanyama 2008).dAlso includes Groupement d’Interet Economique and pre- and non-cooperatives.

Key Concepts and IssuesTo better identify the key concepts relating to this study, we examine here three issues relating to smallholder commercialization and RPOs. The first issuefocuses on the role of collective action in helping smallholders overcome marketing constraints. The second issue concerns the extent to which poorer households tend to participate in RPOs. The third issue examines the possible constraints on an RPO’s marketing performance. These issues are used to guide the empirical elements of this study presented in later sections.
Issue 1: Collective Action Can Help Smallholders Overcome Marketing ConstraintsAlthough smallholders in many developing countries have benefited in recent decades from technological advances in agriculture, they face relatively greater challenges when it comes to commercializing their surplus output (see, for example, Dorward et al. 2004; Fafchamps and Hill 2005). One way of explain-ing the persistently low levels of smallholder commercialization relates to the idea of transaction costs: the costs entailed in marketing surplus output create a wide differential between selling and purchase prices, limiting the benefits smallholders are able to accrue from their market-based exchanges. These transaction costs may include the costs associated with finding a partner to trade with, delivering the commodity, negotiating a contract, or enforcing the agreement (for example, de Janvry, Fafchamps, and Sadoulet 1991). Importantly, some of these transaction costs are fixed (that is, indepen-dent of the size of the transaction); thus the unit cost of transacting tends to decrease as the amount to be sold increases. Therefore—in addition to such problems as lack of collateral, distress selling, and information asymmetries—smallholders typically face proportionally higher transaction costs than do other types of sellers because of the small size of each transaction. In some cases, it may be more advantageous for a household not to participate in the market at all (Goetz 1992; Key, Sadoulet, and de Janvry 2000). In other words, if the difference between the price received and the transaction costs is not at least equal to the reservation price demanded by the producer (based, for example, on costs of production), the producer will not engage in market transactions. Collective action mechanisms can help smallholders reduce the transac-tion costs of commercializing their surplus output. By pooling their surplus output into a single tradable lot and using this larger quantity as the basis for negotiating with buyers, they can increase their bargaining power in the market and reduce per-unit transaction costs. In short, an organization that aggregates its members’ outputs can reward them with increased access to market as well as better rewards through higher prices.
8 CHAPTER 1

Issue 2: Poorer Households Tend to Participate Less in RPOsDespite the potential benefits of collective action, there is limited evidence that the poorest of the poor either participate in or benefit from such orga-nizations when the latter are specifically formed for the purpose of commer-cializing surplus output. For instance, a study by Thorp, Stewart, and Heyer (2005) examines 80 case studies of collective action organizations and finds that the chronically poor are rarely included in these types of groups; it also concludes that their exclusion contributes to a vicious cycle of chronic pov-erty.4 Chirwa et al. (2005) argue that this failure to participate may reflect several factors: lack of productive assets (land, livestock, or equipment), financial assets (cash to pay membership fees), or social capital (access to a collective action organization based on ethnicity, social status, social ties, or other such characteristics). Several types of mechanisms may contribute to this apparent exclusion of the poorest. First, RPOs may be inclusive at the community level but are likely located in more prosperous villages that have higher market opportuni-ties, lower pressure on land, better cropping opportunities, or lower envi-ronmental risks (Chirwa et al. 2005; Bernard et al. 2008). Second, within a community, poorer households may choose not to participate in these orga-nizations if the benefits they would derive from it would be too low. Note that the household’s gains from participating in the RPO can be measured as the per-unit gain in transaction costs obtained through product aggregation, multiplied by the household’s level of production. The per-unit gain itself is the difference between the per-unit transaction cost the smallholder faces when selling her product alone and the per-unit transaction cost that she faces when selling through the RPO. For very low levels of production, even though the per-unit transaction cost gains will be high, the overall benefits will be low because of the small quantity to be commercialized, so that the overall benefit may not be sufficient to outweigh the costs of participating in the organization.5
Third, RPOs themselves may choose to restrict their memberships to house-holds with sufficient production levels. Indeed, in the case of a pure marketing organization, the value of each additional member will depend on her con-
INTRODUCTION 9
4 Note, however, that even if groups do exclude the very poorest, they may nonetheless contrib-ute to poverty reduction provided they are formed among the poor (Thorp, Stewart, and Heyer 2005).5 A similar problem arises for high levels of production. Although the quantity to be commercial-ized is high, the gains in per-unit transaction costs are low, leaving the overall benefits from membership relatively low. The overall gains from membership are greatest for smallholders with an intermediate level of production, suggesting an inverted U-shaped relationship between the benefit from participation and the farmer’s production level.

tribution to product aggregation (and hence to reducing transaction costs) relative to the management costs of including an additional member. Becauseper-member management costs are fixed, selection is likely to be biased toward larger producers. Although one rarely finds explicit versions of this argument in the field, there are various types of membership criteria (including finan-cial contribution) that can be implicitly interpreted as reflecting such cost considerations. Finally, in spite of the above, there is some evidence to suggest that the poorest of the poor may still benefit from market-oriented RPOs—even when they are excluded from membership. Such benefits may be termed spillovers that extend beyond the RPO’s membership base and are often linked to the RPO’s everyday activities: for example, an RPO may provide a service that can be rendered to members and nonmembers alike that cannot be delivered in a way that excludes nonmembers.6
Issue 3: Marketing Performance May Be Constrained by a Wide Portfolio of ActivitiesCollective action is not without its costs. The time and effort needed to gov-ern and manage the organization—to coordinate meetings among members, collect their membership fees or other contributions, resolve conflicts and dis-putes, monitor compliance with the organization’s rules, organize the orga-nization’s activities, and so on—are transaction costs internal to the RPO. Quite naturally, these coordination costs tend to increase with the size of the organization. Further, they increase with the heterogeneity of prefer-ences among members, as intergroup agreement becomes more difficult to reach. Another type of cost relates to the scope of the organization’s activi-ties: RPOs typically have lower management costs when performing several related activities than when simultaneously engaged in several entirely inde-pendent endeavors. And indeed, an important feature of RPOs is their frequent engagement in wide varieties of activities. For instance, Bernard et al. (2008) find that 55 percent of market-oriented RPOs in Senegal were also engaged in provid-ing social activities, as were nearly 70 percent in Burkina Faso. Although it seems reasonable that successful organizations contribute to their communi-ties’ development, several case studies argue that a broad scope of activities often comes at the expense of economic performance (see, for example, Lele 1981; Stringfellow et al. 1997; Coulter et al. 1999; Delion 2000; Collion and Rondot 2001; Chirwa et al. 2005; Bernard et al. 2008). Further, the engage-
10 CHAPTER 1
6 As documented in Bernard, de Janvry, and Sadoulet (2010), exclusive RPOs may also engage in public-good services to gain social acceptability in their communities.

ment of market-oriented RPOs in social activities is often driven by externalpressures from administrative agencies of the state, foreign donors, non-governmental organizations (NGOs), or interest groups in a community (Chirwa et al. 2005; Bernard, de Janvry, and Sadoulet 2010). With open-membership policies, such a broad portfolio of activities may entail other costs as well. As a marketing-oriented RPO expands its activity portfolio, it attracts new members with different levels of interest in its various activities. Expansion thus increases both the size of the RPO and the heterogeneity of membership’s interests, raising coordination costs in the organization. Importantly, although these additional members raise coordi-nation costs, they are likely to contribute less than the original members (or not at all) to product aggregation and hence to lowering transaction costs. Eventually, this rise in coordination and management costs may negatively affect returns for the initial members, who are primarily interested in the commercialization services offered by the organization, and discourage them from further participation. The salience of increased coordination costs depends on the type of decisionmaking rule in the RPO. Where consensus of all members is neces-sary (participatory decisionmaking), reaching a decision in large and hetero-geneous groups may be very costly. In such cases, concentrating the power to make decisions in a restricted number of informed individuals may help reduce coordination and management costs, provided these individuals’ decisions are respected by other members (see, for example, Tendler 1983; Bianchi 2002; Bernard, de Janvry, and Sadoulet 2010). Some studies argue, however, that participatory governance is a valuable means of enhancing the sustainability and effectiveness of the organization by facilitating decisions adapted to local conditions and customs (for example, Attwood and Baviskar 1987). Particularly for an RPO engaged in the provision of public goods, this form of governance can result in outcomes that are more desirable to a larger share of members (Foster and Rosenzweig 2001). The overall picture is that of a trade-off model. A market-oriented RPO is likely to exhibit only two of the following three attributes: (1) inclusive membership; (2) participatory governance; and (3) marketing performance.
Data and MethodsThe present study focuses on the recent (re)development of cooperatives in Ethiopia. Data are drawn from two main sources: (1) a nationally represen-tative survey of smallholder commercialization conducted in 2005 and (2) a relatively large survey of smallholder cooperatives conducted in 2006. The 2005 Ethiopian Smallholders Commercialization Survey (ESCS 2005) was jointly designed by the International Food Policy Research Institute (IFPRI),
INTRODUCTION 11

7 In Ethiopia, kebeles (peasant associations), are the smallest administrative unit below the woreda (district) level. For purposes of comparison, kebeles correspond to a cluster of villages in many other Sub-Saharan African countries.
12 CHAPTER 1
the Ethiopian Development Research Institute (EDRI), and the Central Sta-tistical Agency of Ethiopia, with the aim of providing an in-depth analysis of smallholders’ commercialization behavior. Data were collected in mid-2005 and include 7,186 households randomly drawn from 293 kebeles.7 The sampleis considered representative at the national and regional levels for four regions: Amhara; Oromia; the Southern Nations, Nationalities, and Peoples regional state (SNNP); and Tigray. The survey covered a large number of issues,including demographics, human capital stock, employment, land production and input use, crop and livestock production and disposition, marketing channels and contractual arrangements, physical assets, social capital, and participation in cooperatives. However, the ESCS did not collect information on household consumption and expenditures. The 2006 Ethiopian Cooperatives Survey (ECS 2006), conducted by IFPRI and EDRI, was designed to examine the role played by cooperatives in the commercialization of Ethiopian smallholders’ surplus grain production. Data were collected in mid-2006 across four regional strata (Amhara, Oromia, SNNP, and Tigray) from 205 cooperatives in 54 woredas. In each stratum, 14 woredas were randomly selected, and a maximum of four agriculture-related cooperatives were then randomly chosen from a list available at each woreda cooperative office. For each cooperative, questions were asked about the organization’s history, membership, activities (including marketing), gover-nance structure, and external links. Of the 205 cooperatives surveyed, 172 (84 percent) declared that they were primarily engaged in marketing mem-bers’ grain production, and these cooperatives are used in this analysis. Because the samplings conducted under ESCS 2005 and ECS 2006 did not sufficiently overlap, household and cooperative data cannot be matched in our analysis. The regression analyses presented in the following chapters are therefore limited to one dataset at a time. Moreover, a full year separates the data collection undertaken for these two surveys. Nevertheless, we believe that the phenomena investigated in this monograph are sufficiently stable to allow for statistical analysis of data from both surveys to be used in the same discussion.

CHAPTER 2
Ethiopian Cooperatives
Agriculture, Commercialization, and Public Policy
Agriculture is the backbone of Ethiopia’s economy, accounting for 40 percent of GDP, 85 percent of employment, and 90 percent of export earnings. Furthermore, agriculture in Ethiopia is largely a smallholder
phenomenon: as of 2001/02, about 37 percent of the farming households in the country cultivate less than 0.5 hectares and about 87 percent cultivate less than 2 hectares; only 0.9 percent cultivate more than 5 hectares (CSA 2003). Consequently, the agriculture sector in Ethiopia is host to 90 percent of the country’s poor. Cereals (mainly teff, wheat, maize, barley, sorghum, and millet) constitute the most important crop for smallholder livelihoods in Ethiopia. Some 98 percent of all cereals produced in Ethiopia are produced by small-scale farmers. Cereals are cultivated on 75 percent of cropped land and represent 69 percent of total crop production (Gabre-Madhin 2001).1
Cereal production by smallholders is primarily for subsistence in Ethiopia. Only 28 percent of the country’s total agricultural output and 30 percent of smallholder grain production is marketed (Dessalegn, Jayne, and Shaffer 1998; CSA 2003). More recent estimates suggest that among all teff producers, only 38 percent sell part or all of their production; other estimates suggest even lower figures for other cereals (Alemu, Gabre-Madhin, and Dejene 2006). Accordingly, the Government of Ethiopia’s (GoE’s) economic growth strat-egy, Agriculture Development–Led Industrialization, has placed high priority since the early 1990s on accelerating agricultural growth through the com-mercialization of smallholder production (FDRE 2002, 2005). The strategy has driven the introduction of policies to promote (1) a more supportive macro-economic framework for growth and development; (2) liberalized markets for agricultural products; and (3) a strong extension- and credit-led push to
13
1 In terms of value, the share of permanent crops is greater, given their higher market prices. This is particularly true of coffee and khat. Figures in this paragraph are computed from data generated by the Ethiopian Sample Enumeration Survey 2001/02 (CSA 2003).
intensify staple production with modern inputs, especially seed and fertilizer. The resulting reforms have liberalized many aspects of the economy: lower-ing tariffs and relaxing import quotas, simplifying licensing procedures and privatizing state enterprises, establishing private banks and easing foreign exchange controls, discontinuing compulsory grain delivery and forced mem-bership in cooperatives by smallholders, and developing input-supply programs to intensify cereal output and efficiency. Although these reforms increased market integration, market competi-tion, and private trading in local grain markets, wider systemic and structural constraints may have limited the impact of reforms. A fundamental problem facing the country is the persistently high transaction costs associated withtrading agricultural commodities (Dercon 1995; Negassa and Jayne 1997; Gabre-Madhin 2001). Inadequate market information systems that do not provide smallholders and traders with price information, when coupled with poor infrastructure and weak private-sector capacity, significantly impede com-mercialization of the country’s largely subsistence-oriented smallholder population (Gabre-Madhin et al. 2003; Alemu, Gabre-Madhin, and Dejene 2006). Indeed, these factors are believed to have contributed to a farming crisis in 2002–03 when, following a good harvest and sizable grain surpluses,grain prices dropped dramatically by 60–80 percent (Gabre-Madhin et al. 2003).These factors may have also played a significant role in the 2007–08 food crisis when, despite good harvests in previous years, grain consumer prices increased by up to 50 percent. This chapter describes the historical development of agricultural coopera-tives in Ethiopia until their recent redeployment. We assess their relevance for the challenge of smallholder commercialization, their organizational features, and their prevalence. Finally, we present a series of statistics along with case studies, to describe “typical” agricultural cooperatives in Ethiopia today.
Public Support for Cooperative Development in EthiopiaIn spite of the challenges mentioned above, the GoE has placed coop-eratives at the forefront of its efforts to boost agricultural productivity and smallholder commercialization. The GoE’s current strategy aims to extend cooperative services throughout the country to supply production inputs to smallholders and to market surplus output from them.
Historical Legacy of Cooperatives in EthiopiaRPOs have a long history in Ethiopia, particularly in the form of traditional collective action organizations, such as work groups (jiges, wonfels, debos), rotating savings and credit associations (iquobs), and burial societies (idirs), which are still very much present (Table 2.1). It was not until the early 1950s
14 CHAPTER 2

that a formal cooperative movement began in the country, and only in 1961 did the imperial government introduce the first formal proclamation on coop-eratives that gave rise to the institution in its modern sense (Couture et al. 2002; Kodama 2007). During the imperial era, cooperatives were primarily created to support the production of high-value agricultural exports, such as coffee. Membership consisted of farmers with large landholdings and tended to exclude small-holders. By 1974, the end of the imperial era, only 149 cooperatives existedin the entire country, including 94 multipurpose, 19 savings and credit, 19 con-sumer, and 17 handicraft cooperatives (Lelisa 2000, cited in Lemma 2008). The military (Derg) regime that ruled Ethiopia from 1974 to 1991 introduced a new type of cooperative, based on more Marxist principles aimed at ending capitalist exploitation of the peasantry (Rahmato 1990; Kodama 2007). During this period, the government established a massive network of cooperatives to organize peasants, manage production and purchasing, and sell inputs and consumer goods to members. At its height, the network included more than 7,700 primary (that is, community-level) cooperatives and 4.8 million mem-bers (Table 2.2). There were two main types of farmers’ cooperative during the Derg: service cooperatives and producer cooperatives. The former were charged with managing input supply, credit, output purchasing, milling services, and the sale of consumer goods for smallholders. The latter were collective production units that were ultimately found to be one-third less produc-tive than individual farms (Rahmato 1994b; Kodama 2007). Both types of cooperatives played a central role, alongside the kebele administration, in levying and collecting taxes from smallholders, extending state control to the
ETHIOPIAN COOPERATIVES 15
Table 2.1 Households reporting membership in traditional institutions
Percentage ofInstitution sampled households
Traditional institutions Idir (burial society) 42.2 Iquob (rotating savings and credit association) 6.9 Other credit and savings association 0.3 Mahaber (traditional collective-action organization) 3.8 Senbete (church group) 2.8 Mosque group 0.1 Other 0.3Formal cooperative 9.1 Households reporting membership in at least one traditional institution 47.0
Source: Based on data from ESCS (2005).

local level, and promoting a socialist ideology. Farmers came to view these cooperatives—as well as their state-appointed leaders—as synonymous with government oppression. It was not until 1989 that some degree of liberaliza-tion was introduced, though it proved to be too little and too late, as the Derg was overthrown by 1991.
Policies Supporting a New Generation of CooperativesSince 1994, the GoE has made efforts to promote a generation of coopera-tives that differ from their predecessors. The new type of cooperative should be (1) based on “peasants’ free will to organize”; (2) able to fully participate in the free market; and (3) free of government intervention in their internal affairs (Proclamation 85/1994, published in FDRE [1994], 1). Legal reforms in 1998 and 2004 were introduced to reinforce these principles and strengthen membership incentives by improving members’ rights in the areas of owner-ship, voting, share transfers, and risk management (Proclamations 147/1998and 402/2004, published in FDRE [1998] and FDRE [2004], respectively; Rah-mato 2002). The reforms are meant to ensure that cooperatives are governed in accordance with standard bylaws that provide for regular election of chair-persons and management committees and for voting based on the principle of one member, one vote. In the broadest terms, these reforms are designed to create a new generation of cooperatives in Ethiopia that are voluntary, inclusive, and accountable, in stark contrast to the cooperatives formed under Ethiopia’s previous regime. The GoE’s various poverty-reduction strategy papers also reflect its sup-port for cooperatives. For example, Ethiopia’s Sustainable Development and Poverty Reduction Program (FDRE 2002, 43) includes cooperatives as one of its main goals for agricultural development: “to organize, strengthen and diversify autonomous cooperatives to provide better marketing services and serve as a bridge between small farmers (peasants) and the non-peasant pri-vate sector.” Cooperatives are also expected to
16 CHAPTER 2
Table 2.2 Rural organizations during Ethiopia’s Derg regime, 1988–89
Number of household Number of Type of organization Number members (million) kebeles covered
Peasant associations 20,455 5.7 n.a.Producer cooperatives 3,732 0.3 n.a.Service cooperatives 4,052 4.5 17,785
Sources: Adapted from Rahmato (1994a); Kodama (2007).Note: n.a. means not available. A kebele is a peasant association, the smallest administrative
unit in Ethiopia.

render vital services other than those related to agricultural marketing, including the following: (i) Expanding financial services in rural areas; (ii) Purchase of agricultural machinery, equipment and implements, and lease them to farmers; (iii) Setting up of small agro-processing industries where processed agricultural products with greater value added could be produced and (iv) Establishing various social institu-tions to provide different kinds of social services. (FDRE 2002, 59)
This thrust continues in the current poverty-reduction strategy, which explicitly emphasizes the need to support producer cooperatives as a means of strengthening and empowering smallholders’ market participation in the liberalized market environment (FDRE 2005). Running parallel to this state-led promotion of cooperatives is the effort by civil society to encourage farmer organizations at the grassroots level. Dif-ferent types of these community-based organizations (CBOs) exist throughout Ethiopia, ranging from savings and credit associations that provide rural micro-finance services to groups that organize the marketing of such crops as honey and organic coffee. A motivating force behind the growth of CBOs is the exten-sive community of NGOs in Ethiopia. NGOs are important actors in Ethiopia: although their activities were generally limited to famine relief in the 1970s and 1980s, many are now working on issues related to sustainable agriculture and rural development. As of 2000, some 368 NGOs operated in Ethiopia, of which one-third were international organizations (Rahmato 2002).
Administrative Structures to Promote CooperativesIn 2002, the GoE established the Federal Cooperatives Commission (now the Federal Cooperatives Agency, or FCA) with a broad mandate: to oversee the appropriate implementation of cooperative legislation, to design policies and legal procedures consistent with international conventions on coopera-tives, and to ensure the coherence of cooperative policy with other relevant sectors (land, labor and employment, customs and taxation, and financial regulations) (Lemma 2008). The FCA guides cooperative promotion efforts throughout the country, working through regional state Bureaus of Coopera-tive Promotion (BoCPs), whose mandate extends down to the woreda and kebele levels.2 Cooperative promotion efforts at the woreda level are man-
ETHIOPIAN COOPERATIVES 17
2 This allocation of responsibilities reflects Ethiopia’s wider process of political, fiscal, and administrative decentralization, introduced following the downfall of the Derg in 1991 and codi-fied in the 1994 Constitution. The process led to a novel reallocation of powers to the country’s nine regions and the urban administrations of Addis Ababa and Dire Dawa. Today each region and administration enjoys wide executive and legislative powers and is financed through a com-bination of transfers from the federal level and regional tax revenues.

18 CHAPTER 2
Ministry of agricultureand rural development
Federal cooperativeagency
Regional cooperativebureaus
Agricultural extension:Development agentsand farmer training
centers
Primarycooperatives
Withunion
Withoutunion
Woreda cooperativepromotion offices
Woreda bureau ofagriculture and rural
development
Nongovernmentalorganizations
Cooperativeunions
Privateindustry
Figure 2.1 Actors and relationships in cooperative promotion and development, Ethiopia, 2007
Source: Authors.
aged through woreda offices of the BoCPs—typically, an office housed in the woreda offices of the Bureaus of Agriculture and Rural Development (BoARDs). Promotion efforts at the kebele level are conducted through direct interac-tions with local community leaders and farmers themselves. These efforts are often supported by the BoARDs’ development agents (as extension agents are known in Ethiopia), working individually or through farmer training centers. (These centers, introduced over the past several years, are meant to serve
ETHIOPIAN COOPERATIVES 19
as focal points for training and extension activities.) Given the integrated nature of their work, BoCPs and BoARDs maintain close working relationships that are supported by formal accountability systems at both the woreda and regional levels (Spielman et al. 2010). Increasingly, cooperatives are organized as part of larger cooperative unions, which are umbrella organizations that provide input supply and mar-keting services to their member cooperatives. These cooperative unions are playing an increasingly central role in importing and packaging chemical fer-tilizer and other inputs and in distributing inputs to cooperatives throughout the country (Byerlee et al. 2007). Figure 2.1 summarizes the interaction of the various bodies involved in cooperative promotion in Ethiopia.
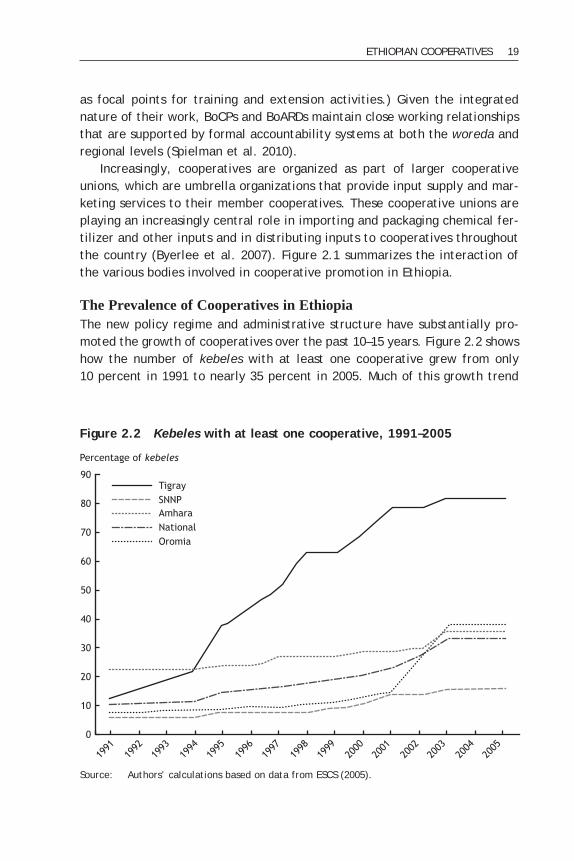
The Prevalence of Cooperatives in EthiopiaThe new policy regime and administrative structure have substantially pro-moted the growth of cooperatives over the past 10–15 years. Figure 2.2 shows how the number of kebeles with at least one cooperative grew from only 10 percent in 1991 to nearly 35 percent in 2005. Much of this growth trend
Percentage of kebeles
0
50
1991
1993
1995
1997
1999
2001
2003
2005
1992
1994
1996
1998
2000
2002
2004
30
60
90
40
20
10
70
80
TigraySNNPAmharaNationalOromia
Figure 2.2 Kebeles with at least one cooperative, 1991–2005
Source: Authors’ calculations based on data from ESCS (2005).

20 CHAPTER 2
Table 2.3 Number of registered primary cooperatives and members by region, Ethiopia, 2007
Number of primary Total capitalRegion cooperatives Male Female Total (birr)
Amhara 4,223 1,637,069 258,996 1,896,065 165,040,320Oromia 2,957 658,763 58,284 717,047 104,763,293SNNP 5,512 892,788 126,076 1,018,864 201,079,907Benshangul 1,32 6,675 1,742 8,417 4,058,904Harrari 216 5,288 2,258 7,546 11,424,448Gambella 81 1,144 2,553 3,697 946,443Afar 202 4,971 3,649 8,620 6,115,598Tigray 1,335 356,868 282,425 639,293 42,334,481Addis Ababa 7,262 n.a. n.a. 338,321 60,426,253Dire Dawa 7,15 10,685 5,672 163,57 8,093,956Somali 449 7,776 6,939 147,15 8,335,264 Total 23,084 3,582,027 748,594 4,668,942 612,618,867
Source: Adapted from Meherka (2008).Notes: n.a. means not available; SNNP means Southern Nations, Nationalities, and Peoples
regional state.
Members
Table 2.4 Household participation in cooperatives among smallholder farmers in Ethiopia
Smallholders Smallholders Smallholders participating when they participating in with a cooperative have a cooperative a cooperative in their kebele in their kebele
Percentage Percentage Percentage of of ofRegion households Differencea households Differencea households Differencea
Ethiopia 9.14 — 39.59 — 16.87 —
Tigray 20.40 0.0057 87.99 0.0000 20.93 0.3511Amhara 14.48 0.0630 46.34 0.0000 24.29 0.1362Oromia 7.35 0.3026 42.54 0.0046 12.18 0.1446SNNP 3.69 0.0000 18.49 0.0000 8.96 0.0391
Source: Authors’ calculations based on data from ESCS (2005).Notes: — means not applicable; SNNP means Southern Nations, Nationalities, and Peoples regional
state. A kebele is a peasant association, the smallest administrative unit in Ethiopia.aTest of difference from national average: probability > F.
is explained by the expansion of cooperatives in Tigray, where cooperative prevalence grew from 12 to 83 percent during 1991–2005. As of 2007, there were more than 23,000 primary cooperatives in Ethiopia, with membership totaling more than 4.6 million (Table 2.3). These figures, however, include urban as well as rural cooperatives. In Table 2.4, we use data from the ESCS (2005) survey to investigate the actual prevalence of agricultural cooperatives in rural areas; we show the per-centage of households participating in at least one cooperative involved in agriculture. As indicated in column 1, only 9 percent of all farm households report participating in a cooperative at a national level. We also note signifi-cant differences in membership rates across regions: 20 percent of the small-holders in Tigray region participate in cooperatives, whereas less than 4 percentof people in the SNNP region participate. Part of this variation is driven bydifferences in the level of access to cooperatives. Thus, as reported in col-umn 3 of the table, 88 percent of smallholders in Tigray have at least one coop-erative in their kebele, compared to less than 20 percent in SNNP. However, even when there is an organization in their kebele, smallholders in SNNP are still less likely to participate in cooperatives: only 9 percent participate—below the national average of 17 percent (column 5 in the table).
Descriptions of Agricultural Cooperatives in Ethiopia: Data and NarrativesBoxes 2.1 and 2.2 describe two agriculture marketing cooperatives encoun-tered during fieldwork. They are characteristic of the diversity and hetero-geneity found among cooperatives in Ethiopia and help to illustrate some of the issues being raised in this study. Table 2.5 shows that Ethiopian coopera-tives are engaged in a vast array of activities. Multipurpose and savings and credit cooperatives are the most prevalent, followed by housing and small/medium enterprise cooperatives. (Note, however, that these figures include both rural and urban cooperatives; the vast majority of housing and small/medium enterprise cooperatives are urban.) From these figures, one can estimate that about one-third to half of the cooperatives in the country are directly involved with agriculture. Focusing on those cooperatives with an agricultural emphasis, we use the ECS (2006) data to provide average characteristics of grain-marketing coop-eratives in the four main regions of the country (Table 2.6). These organiza-tions are rather large, with average membership close to 1,000 (ranging from 21 to 3,664 members). Land cultivated per member averages 1.75 hectares, a figure that is consistent with the notion that cooperative members are largely smallholders, although not necessarily the smallest, as the average
ETHIOPIAN COOPERATIVES 21

22 CHAPTER 2
Box 2.1 Amecha Area Multipurpose Cooperative
The Amecha Area Multipurpose Cooperative is located 17 kilometers from Wolenchiti, the capital of the food-insecure woreda of Boset. Founded in 1980 under the Derg regime, its activities were then limited to col-lecting farmers’ produce for the Agricultural Marketing Corporation of the government at below-market prices. The organization was there-fore considered exploitative of farmers and was dismantled with the fall of the regime in 1991. The Cooperative was re-established in 1995 with the objective of providing members with output marketing services as well as enhanced access to agricultural inputs and credit. This time, however, the organi-zation was meant to be free of any external control and to be governed democratically in accordance with the interests of the members. At present, the Cooperative’s contacts with the administration are limited to management training, market information, and audit services pro-vided by the Woreda Cooperative Office. In return, the Cooperative is obligated to present its audited financial report annually to the Zonal Cooperative Office. At the time of the Cooperative’s re-establishment, it was also made clear that membership should be voluntary, in contrast with forced par-ticipation under the previous regime. As of today, membership is open to anyone, provided they accept and respect the Cooperative’s bylaws, understand and accept its objectives, and pay 67 birr (1 birr as a regis-tration fee and 66 birr as the price of a share). The Cooperative today counts 984 members, mostly elderly people. Younger individuals typically do not control land and are thus less interested in the services offered; moreover, the organization is often still perceived as a government entity similar to the cooperatives under the Derg regime rather than a farmer-owned organization. Currently, the Cooperative is only involved in input supply and crop purchase. It receives agricultural inputs (fertilizer and credit) from the Lume-Adama-Boset Union and sells to members and nonmembers (but only members may purchase on credit). In marketing members’ output, the Cooperative gives priority to the Union, provided the prices offered are competitive with the nearby markets of Nazareth and Wolenchiti. Nonmembers may also sell their products through the Cooperative, but they do not benefit from the proceeds of the organization. (Dividends have been distributed twice to members since the re-establishment.)

ETHIOPIAN COOPERATIVES 23
The main constraint faced by the Cooperative is the dearth of appro-priate financial resources. Because of the lack of appropriate storage and transportation, the organization is forced to sell outputs in May instead of waiting for higher prices in September. Although there are several potential partners operating in the woreda (such as the Rural Financial Intermediation Program and World Vision, an international NGO), the Cooperative has not yet been able to secure credit to invest in needed equipment.
Source: Key informant interviews conducted by the authors as part of ECS (2006).
Box 2.2 Awara Cooperative
The Awara Cooperative is located 8 kilometers from Aje, capital of the remote woreda of Siraro. The organization was created in February 2005to help farmers get timely access to seeds and fertilizers. The organi-zation significantly benefited from initial help from the woreda office of the regional BoCP, which gave members training on the importance of cooperatives in helping smallholders. Immediately after its establish-ment, the Cooperative received 127 quintals of fertilizer on credit from the woreda office of the BoARD. The organization also aims to provide marketing services to its mem-bers, buying from them at higher-than-market prices after the harvest and selling on the market when prices are more favorable. Safe storage is ensured through renting appropriate local warehouse facilities (1,000 birr per year for 214 quintals of maize). Price information is collected on the nearby markets of Shashemene and Aje through an informal net-work of individual traders who are known to the members. In 2005 the Cooperative purchased maize from its members at 105 birr per quintal at a time when the market price was 100 birr per quintal. Members are not forced to supply all their produce to the Coopera-tive; in the future, however, dividends will be paid according to the volume of grain supplied. To date, nonmembers have not been permit-ted to sell their produce to the Cooperative; this should change once the organization’s financial capacity is stronger. Membership in the Cooperative is open to anyone, provided he or she is free of debt and can reliably repay a loan. Initially the registra-

tion fee was 25 birr and a share cost 100 birr. Today new members must also contribute a quintal of maize to strengthen the financial capacity of the Cooperative. There are now 130 members in all. Reasons for not joining the organization include the high level of entrance fees, the mis-taken identification of the Cooperative with previous Derg organiza-tions, and suspicions of corruption in the Cooperative management. The woreda office of the BoCP offers continuous support to the Awara Cooperative, as does the Negele-Shashemene-Siraro Cooperative Union, which monitors and controls the Cooperative and, in particular, its management procedures. The main bottleneck to the organization’s development is its lack of access to credit; a request was filed with the woreda office of the BoCP, but the loan was refused. Other constraints include the lack of information and marketing links in potentially lucra-tive markets, such as Addis Ababa. One-quarter of the profit of the Cooperative is retained to fund its further development. Plans include providing greater quantities of improved seeds and fertilizers to members, opening shops in the town of Aje, developing marketing links to larger markets, providing oxen forthose who lack one, and purchasing grain from the market to sell when prices rise.
Source: Key informant interviews conducted by the authors as part of ECS (2006).
24 CHAPTER 2

ETHIOPIAN COOPERATIVES 25
Tabl
e 2.
5 T
ypes
of
coop
erat
ives
in
Ethi
opia
, 20
07
Ty
pe o
f co
oper
ativ
e
Live
stoc
kRe
gion
M
ulti
purp
ose
Irri
gati
on
SACC
O
Hou
sing
SM
E Co
nsum
er
Dai
ry
mar
keti
ng
Oth
er
Tota
l
Amha
ra
1,71
2 18
8 54
3 1,
060
n.a.
14
45
n.
a.
661
4,22
3SN
NP
1,02
5 n.
a.
869
119
n.a.
52
59
n.
a.
3,38
8 5,
512
Oro
mia
1,
468
77
515
n.a.
2,
012
59
2 29
3 53
1 2,
957
Tigr
aye
580
225
232
32
n.a.
13
10
0 n.
a.
153
1,33
5Be
nsha
ngul
55
n.
a.
70
1 n.
a.
1 n.
a.
n.a.
5
132
Dir
e D
awa
71
5 79
24
8 n.
a.
42
13
n.a.
25
7 71
5H
arar
i 12
1
13
93
n.a.
2
13
n.a.
82
21
6G
ambe
lla
14
n.a.
27
n.
a.
2,03
9 9
n.a.
7 15
81
Som
ali
230
n.a.
20
16
2,
037
12
10
68
56
449
Afar
10
4 3
4 15
n.
a.
n.a.
n.
a.
14
n.a.
35
20
2Ad
dis
Abab
a n.
a.
n.a.
2,
852
2,32
3 2,
053
34
n.a.
n.
a.
n.a.
7,
262
To
tal
5,27
1 53
0 5,
235
3,89
2 2,
111
238
256
368
5,18
3 23
,084
Sour
ce:
Adap
ted
from
Meh
erka
(20
08).
Not
es:
n.a.
mea
ns n
ot a
vaila
ble;
SAC
CO m
eans
sav
ings
and
cre
dit
coop
erat
ive;
SM
E m
eans
sm
all/
med
ium
ent
erpr
ise;
SN
NP
mea
ns S
outh
ern
Nat
ions
, N
atio
nalit
ies,
and
Peo
ples
reg
iona
l st
ate.

26 CHAPTER 2
landholding in Ethiopia is 0.8 hectares. Most of the cooperatives were created or re-established (following the downfall of the Derg in 1991) within the past 10 years. About 59 percent of the cooperatives surveyed stated that theyhad received significant help from external partners at the time of their(re)establishment; in 80 percent of these cases, this help came from the government. About 20 percent of the cooperatives surveyed stated that they had received significant financial help at the time of their (re)establishment, also primarily from the government. And about 74 percent of these marketing cooperatives were also engaged in providing social services to their members.
Table 2.6 Grain-marketing cooperatives in Ethiopia, descriptive statistics
25th 75thCooperative percentile percentilecharacteristic Unit/Description Mean value value
Membership Number of members 942.23 335 1,290 in 2005 Aggregated product Total hectares 1,541.45 397.50 2,207.50 cultivated by members Holdings per member Hectare 1.75 0.85 2.43Age of cooperative Year 8.18 3.00 14.00Partner at origin 1 = received external 59.30% 0 1 help at creation Financial help at origin 1 = received financial 20.34% 0 0 help at creation
Source: Authors’ calculations based on data from ECS (2006).Note: Characteristics based on a sample of 172 cooperatives surveyed in 2006.

CHAPTER 3
Impact of Cooperatives on Members’ Commercialization
Can cooperatives secure greater benefits of commercialization for smallholder farmers? We use household-level data from the ESCS (2005) to compare the actual extent of commercialization of cooperative
members against their likely level had they not participated in such an orga-nization. Care is taken to minimize biases caused by the nonrandom location of cooperatives and the nonrandom selection of members, as described in detail below.
Identification StrategyOur empirical strategy aims to overcome three potential sources of biases. First, participants may significantly differ from nonparticipants in commu-nity- and household-level observable characteristics that may have a direct effect on commercialization (such as geographic remoteness, or a house-hold’s physical and human capital stock). As a result, the observed differ-ences between members and nonmembers may, either totally or partially, reflect initial differences between them rather than the effects of coopera-tive membership. Second, such selection bias may also result from unobservable community or household characteristics. At the community level, for instance, it may be that the existence of a cooperative is in part driven by particularly dynamic local leaders. At the member level, a household’s risk preference, its entre-preneurial spirit, or its relationship with other cooperative members may significantly influence behavior. Such biases are most often accounted for using an instrumental variables approach. However, instrumental variable methods are of limited help in the presence of a third source of bias: local general equilibrium effects, as would occur (for example) if the presence of a cooperative (the treatment) signifi-cantly affects the relevant outcome even for nonmembers (the nontreated), through externalities or spillover effects.
27

This third source of bias can arise from the likely externalities exerted by cooperatives on the commercialization capacities and choices of non-members. For instance, cooperatives may significantly affect the price offeredby local traders to cooperative nonmembers. This effect is likely to be enhanced if nonmembers have the option of using cooperatives as an outlet for their output. To minimize these biases, we employ propensity score matching tech-niques, extensively used in the recent literature on economic impact evalu-ation (Jalan and Ravallion 2003a). Relevant applications of these techniques include impact assessments of farmers’ field schools (Gotland et al. 2004), community-driven development (Rao and Ibanez 2003), pipe water (Jalan and Ravallion 2003b), and road rehabilitation (Van de Walle and Cratty 2002). Specifically, our approach involves a two-step matching estimator. First, kebeles with cooperatives are matched to similar kebeles without coopera-tives, on the basis of marketing-relevant characteristics, such as remoteness, agricultural potential, and population density. In a second step, we match cooperative members to similar households living in kebeles without coop-eratives. The matching is based on a unique variable, the propensity score, defined as the probability that a given household would participate in a coop-erative, given a set of observable characteristics.1
Overall, controlling for the households’ observable characteristics mini-mizes the incidence of the first bias described above. Furthermore, because our strategy compares cooperative members to similar households located in other kebeles, it is also likely that the third bias is also limited. We are there-fore left with the second source of bias, namely, the effect of nonobservable characteristics influencing both the presence of cooperatives in particular kebeles and households’ decisions to participate. In Ethiopia, however, most cooperatives were initiated under the influ-ence of an external partner (see Table 2.6). According to data from the ECS(2006), 63 percent of the agricultural marketing cooperatives were created by government institutions, 11 percent by a donor agency or NGO, and only26 percent by members themselves. Dropping from our sample those kebelesin which cooperatives were member-created, we assume that the establish-ment of cooperatives is exogenous to communities’ unobservable characteris-tics as well as to that of their members. Indeed, it became clear from several discussions with woreda-level cooperative promotion officers that encourage-ment for the creation of cooperatives mostly follows a top-down approach.
28 CHAPTER 3
1 Rosenbaum and Rubin (1983) show that households with similar propensity scores also have similar distributions of covariates.

In other words, kebeles with cooperatives created by government institutions do not self-select but instead are externally selected by the cooperative promotion agents. It was also clear from discussions with the agents from the FCA that no clear directions were given to woreda-level offices as to how to select kebeles to be targeted first. Overall, controlling for relevant observ-able characteristics appears sufficient to ensure comparability of kebeles with and kebeles without cooperatives. Furthermore, because in this sample the existence of a cooperative is assumed independent of its members’ characteristics, there is no a priori reason to believe that the distribution of household-level unobservable char-acteristics systematically differs across kebeles that share similar observable characteristics. It follows that differences in unobservable characteristics between cooperative members and households with similar propensity scores (but living in kebeles without cooperatives) may be considered here as ran-dom and will not bias the estimator.2
Finally, to further ensure the validity of such an approach, one must verify that treatment and comparison households are operating in the same mar-kets (Heckman, Ichimura, and Todd 1998). In the present case, however, this requirement has to be tempered by the need to minimize spillover effects within markets, from kebeles with cooperatives to those without. We address this double requirement with three arguments:1. Our matching procedure ensures that sample kebeles are sufficiently similar
by taking into account important determinants of price, such as remote-ness, agro-ecological potential, and population density.
2. Cooperatives may generate spillover effects that are particularly strong at the local market level; by ensuring that treatment and comparison kebeles are linked to different local markets, we ensure that the likeli-hood of spillover effects is minimized.
3. An extensive literature has shown the important increase in grain-market integration in Ethiopia (Dercon 1995; Jayne, Negassa, and Myers 1998; Negassa 1998; World Bank 2006; Negassa and Myers 2007)—and in particu-lar in the three regions considered in our final sample (Rashid, Gabre-Madhin, and Getnet 2007). Grain-market integration ensures that treatment and comparison kebeles are indeed exposed to similar market conditions. In any case, the operation of cooperatives is unlikely to significantly affect regional prices: as of 2005, less than 10 percent of agricultural output marketed in the country passed through cooperatives (FCA 2005).
IMPACT ON COMMERCIALIZATION 29
2 The greater the number of kebeles considered, the more likely this assumption will hold.

Matching
Matching KebelesAmong the 293 kebeles in the sample, 94 had at least one cooperative at the time of the survey. However, not all of them satisfy the identification assumption that the present spatial distribution of cooperatives is exogenous. Specifically, this assumption may not hold for kebeles with member-created cooperatives; such kebeles were therefore removed from our sample. In addi-tion, in some kebeles without cooperatives, it was reported that households had access to one in a nearby kebele. To further add to the robustness of our estimates, these kebeles were also removed from the sample. The remaining sample consists of 68 treatment kebeles, where at least one cooperative can be found, and 134 comparison kebeles where no cooperatives exist. The next step is to ensure that the treatment kebeles are sufficiently similar to the comparison ones. To do so, we apply the notion of develop-ment domains, as adapted to Ethiopia by Chamberlin, Pender, and Yu (2006). Development domains are defined as geographic locations sharing broadly similar rural development constraints and opportunities. The classification is based on four characteristics that best capture livelihood heterogeneity among smallholders in Ethiopia: altitude, population density, distance to the closest market, and moisture reliability. Their aggregation is based on thresholds spe-cifically established to maximize the predictive power of the domains.3
In our sample, kebeles can be classified into 22 different domains. To test the validity of these domains as predictors for the existence of externally created cooperatives, we use a probit estimation, where the dependent vari-able is the existence or absence of a cooperative and the independent variables are dummy variables for each of the domains. Overall, this test performs relatively well: domains successfully predict 70 percent of the incidence of cooperatives. Next, according to our matching procedure, we need to ensure that a suf-ficient number of treatment and comparison kebeles exist in each domain. The distribution is reported in Table 3.1, showing that five domains (1, 2, 5, 12, and 15) capture more than 70 percent of the kebeles with at least one externally created cooperative, while the remaining 30 percent are dispersed among 12 of the remaining 17 domains. It appears that each of the five pre-dominant domains includes enough comparison kebeles to perform the analy-sis. Finally, although selective, these five domains are quite heterogeneous:
30 CHAPTER 3
3 Whereas Chamberlin, Pender, and Yu (2006) conduct the necessary computation at the woreda level, the present analysis is based on the analogous computation at the kebele level.

IMPACT ON COMMERCIALIZATION 31
Table 3.1 Treatment and comparison kebeles, by development domains
Percentage PercentageDomain of comparison of treatmentnumber Domain kebeles kebeles
1 Highland, moisture reliable, high market 8.21 13.24 access, high population density 2 Highland, moisture reliable, high market 23.13 20.59 access, medium population density 3 Highland, moisture reliable, high market 2.24 4.41 access, low population density 4 Highland, moisture reliable, low market access, 4.48 0.00 high population density 5 Highland, moisture reliable, low market access, 19.40 10.29 medium population density 6 Highland, moisture reliable, low market access, 2.99 0.00 low population density 7 Lowland, moisture reliable, high market access, 3.73 1.47 medium population density 8 Lowland, moisture reliable, high market access, 0.75 0.00 low population density 9 Lowland, moisture reliable, low market access, 1.49 2.94 medium population density 10 Lowland, moisture reliable, low market access, 5.22 0.00 low population density 11 Highland, drought prone, high market access, 1.49 1.47 high population density 12 Highland, drought prone, high market access, 2.99 13.24 medium population density 13 Highland, drought prone, high market access, 1.49 1.47 low population density 14 Highland, drought prone, low market access, 1.49 1.47 high population density 15 Highland, drought prone, low market access, 2.99 14.71 medium population density 16 Highland, drought prone, low market access, 2.24 2.94 low population density 17 Lowland, drought prone, high market access, 1.49 0.00 high population density 18 Lowland, drought prone, high market access, 0.75 2.94 medium population density 19 Lowland, drought prone, high market access, 2.99 1.47 low population density 20 Lowland, drought prone, low market access, 2.24 2.94 medium population density 21 Lowland, drought prone, low market access, 5.22 2.94 low population density 22 Lowland, pastoralist, high market access, low 2.99 1.47 population density Total 100.00 100.00
Source: Authors’ calculations based on data from ESCS (2005).Notes: A kebele is a peasant association, the smallest administrative unit in Ethiopia. The data
for comparison kebeles are based on 134 observations; the data for treatment kebeles are based on 68 observations.
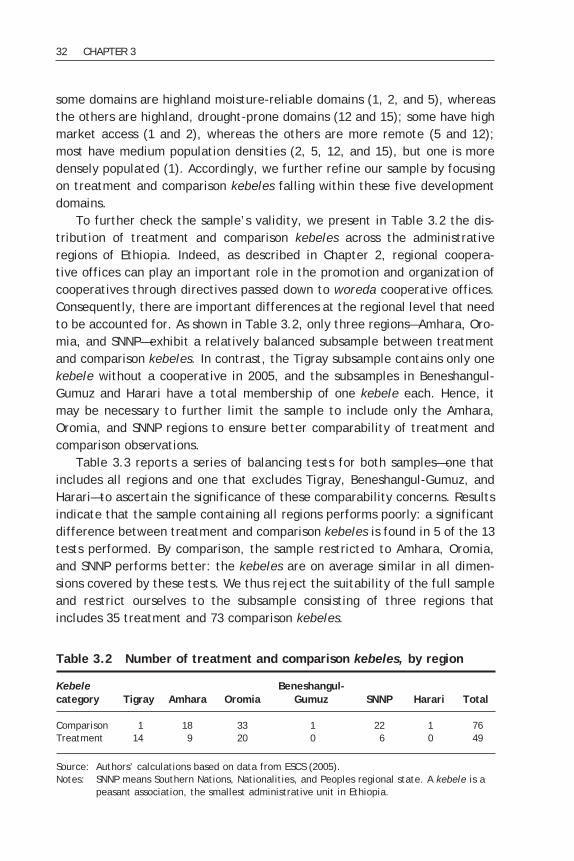
some domains are highland moisture-reliable domains (1, 2, and 5), whereas the others are highland, drought-prone domains (12 and 15); some have high market access (1 and 2), whereas the others are more remote (5 and 12); most have medium population densities (2, 5, 12, and 15), but one is more densely populated (1). Accordingly, we further refine our sample by focusing on treatment and comparison kebeles falling within these five development domains. To further check the sample’s validity, we present in Table 3.2 the dis-tribution of treatment and comparison kebeles across the administrative regions of Ethiopia. Indeed, as described in Chapter 2, regional coopera-tive offices can play an important role in the promotion and organization of cooperatives through directives passed down to woreda cooperative offices. Consequently, there are important differences at the regional level that need to be accounted for. As shown in Table 3.2, only three regions—Amhara, Oro-mia, and SNNP—exhibit a relatively balanced subsample between treatment and comparison kebeles. In contrast, the Tigray subsample contains only one kebele without a cooperative in 2005, and the subsamples in Beneshangul-Gumuz and Harari have a total membership of one kebele each. Hence, it may be necessary to further limit the sample to include only the Amhara, Oromia, and SNNP regions to ensure better comparability of treatment and comparison observations. Table 3.3 reports a series of balancing tests for both samples—one that includes all regions and one that excludes Tigray, Beneshangul-Gumuz, and Harari—to ascertain the significance of these comparability concerns. Results indicate that the sample containing all regions performs poorly: a significant difference between treatment and comparison kebeles is found in 5 of the 13 tests performed. By comparison, the sample restricted to Amhara, Oromia, and SNNP performs better: the kebeles are on average similar in all dimen-sions covered by these tests. We thus reject the suitability of the full sample and restrict ourselves to the subsample consisting of three regions that includes 35 treatment and 73 comparison kebeles.
32 CHAPTER 3
Table 3.2 Number of treatment and comparison kebeles, by region
Kebele Beneshangul-category Tigray Amhara Oromia Gumuz SNNP Harari Total
Comparison 1 18 33 1 22 1 76Treatment 14 9 20 0 6 0 49
Source: Authors’ calculations based on data from ESCS (2005).Notes: SNNP means Southern Nations, Nationalities, and Peoples regional state. A kebele is a
peasant association, the smallest administrative unit in Ethiopia.

IMPACT ON COMMERCIALIZATION 33
Tabl
e 3.
3 B
alan
cing
tes
ts:
trea
tmen
t an
d co
mpa
riso
n ke
bele
s
Sa
mpl
e w
ith
all
regi
ons
Sam
ple
wit
h A
mha
ra,
Oro
mia
, an
d SN
NP
only
Co
mpa
riso
n Tr
eatm
ent
Dif
fere
nce
Com
pari
son
Trea
tmen
t D
iffe
renc
eTe
st c
hara
cter
isti
c ke
bele
s ke
bele
s p
> t
kebe
les
kebe
les
p >
t
Popu
lati
on
4,54
8.29
5,
359.
72
0.09
66
4,52
6.18
4,
622.
91
0.85
50Fe
mal
e-he
aded
hou
seho
lds
(%)
14.0
1 21
.52
0.01
16
13.9
8 18
.60
0.16
07O
rtho
dox
hous
ehol
ds (
%)
45.9
7 57
.77
0.17
25
45.0
8 43
.06
0.82
98M
uslim
hou
seho
lds
(%)
38.0
9 26
.21
0.22
08
37.4
4 33
.70
0.73
06Am
hari
c-sp
eaki
ng h
ouse
hold
s (%
) 50
.95
48.1
5 0.
7010
52
.90
61.2
8 0.
2875
Exis
tenc
e of
com
mer
cial
ban
k 9.
21
12.2
4 0.
5910
9.
58
17.1
4 0.
2630
Exis
tenc
e of
mic
rofi
nanc
e in
stit
utio
n 21
.05
46.9
3 0.
0021
19
.17
31.4
2 0.
1607
Impo
rtan
ce o
f tr
adit
iona
l in
stit
utio
nsa
46.6
4 46
.16
0.91
93
46.5
0 50
.91
0.40
53N
umbe
r of
dev
elop
men
t (e
xten
sion
) ag
ents
1.
83
2.52
0.
0023
1.
84
2.05
0.
3444
Prod
ucti
ve S
afet
y N
et w
ored
asb
(%)
27.6
3 38
.77
0.19
52
26.0
2 28
.57
0.78
25Ex
iste
nce
of p
rim
ary
scho
ol
86.8
4 91
.83
0.39
14
86.3
0 88
.57
0.74
52D
irec
t ac
cess
to
seas
onal
/dry
roa
d 55
.26
69.3
8 0.
1161
56
.16
60.0
0 0.
7019
Acce
ss t
o sa
fe w
ater
44
.73
67.3
4 0.
0131
45
.20
57.1
4 0.
2495
N
umbe
r of
obs
erva
tion
s 76
49
—
73
35
—
Sour
ce:
Auth
ors’
cal
cula
tion
s ba
sed
on d
ata
from
ESC
S (2
005)
.N
otes
: —
mea
ns n
ot a
pplic
able
. A
kebe
le i
s a
peas
ant
asso
ciat
ion,
the
sm
alle
st a
dmin
istr
ativ
e un
it i
n Et
hiop
ia.
A w
ored
a, o
r di
stri
ct,
is t
he s
econ
d sm
alle
st.
a Val
ue d
efin
ed a
s th
e pe
rcen
tage
of
conf
licts
res
olve
d th
roug
h th
e Sh
imag
ile (
coun
cil
of e
lder
s) a
s op
pose
d to
loc
al c
ourt
s.b T
he P
rodu
ctiv
e Sa
fety
Net
Pro
gram
is
inte
nded
to
prov
ide
food
or
cash
thr
ough
pub
lic w
ork
and,
to
a le
sser
ext
ent,
dir
ect
supp
ort
to 8
.3 m
illio
n ch
roni
-ca
lly f
ood-
inse
cure
ind
ivid
uals
in
268
wor
edas
.

One last validity check is undertaken to ensure that treatment and com-parison kebeles correspond to sufficiently close locations. Figure 3.1 shows the geographic location of each kebele in our subsample against a shaded back-ground that indicates the level of market access based on the development domain calculations. We find that (1) treatment and comparison groups are geographically mixed, thereby ensuring that the impact of cooperatives will not be driven by area-specific characteristics; and (2) the distribution of treatment and comparison kebeles by level of market access is also fairly balanced.
Matching HouseholdsAs a result of the sample reduction, the subsample now contains 2,532 house-holds, including 1,702 in comparison kebeles and 830 in treatment kebeles; 150 are cooperative members (Table 3.4). Propensity scores are used to match the 150 household members in the treatment kebeles—the treated households—to those households among the 1,702 in the comparison kebeles that most resemble them. For this purpose, we first estimate each house-hold’s propensity score (its likelihood of joining a cooperative in the treat-ment kebeles) using a flexible probit model where the dependent variable
34 CHAPTER 3
Control kebeles
Treatment kebeles
High market accessLow market access
Regional boundaries
Woreda boundaries
Figure 3.1 Geographic location of treatment and comparison kebeles

is the household’s membership status. Domain dummies are used to ensure matching within the domains. Household characteristics include measures of the household’s assets (such as education level, radio ownership, nonfarm income, landholding, and livestock) that are introduced linearly as well as quadratically to augment the model’s predictive power. Finally, a set of dummy variables is included to account for the household’s cultivation of particular cereal crops.4
We must also consider that a household’s production of a particular cereal may be in response to participation in the cooperative. The estimated impact would then be downward biased, as it might not take into account a house-hold’s switch into production of higher profit crops. However, the focus of the present monograph is the cooperatives’ impact on smallholders’ market-ing behavior. As such, one wants to compare marketing behavior of house-holds engaged in similar production, regardless of whether this was driven by the cooperative. In addition, the production of particular cereals is largely driven by soil and weather conditions in Ethiopia: teff is mainly cultivated in highland areas north of Addis Ababa, maize in the lowlands south of Addis Ababa, sorghum in the northwest and east, and barley along a north-south meridian in the middle of the country (CSA, EDRI, and IFPRI 2006). The probit estimation is better identified when undertaken on treatment kebeles only, where the choice to join a cooperative exists (see Gotland et al. 2004 for a discussion). We report estimates of the coefficients in Table 3.5. We also report the associated p-values, although the purpose here is not to identify particular relationships but rather to maximize the predictive power of the model. Such an approach relies on out-of-sample prediction to gener-ate a propensity score for the comparison households, however. To assess
IMPACT ON COMMERCIALIZATION 35
Table 3.4 Distribution of households across treatment and comparison kebeles
Comparison TreatmentHousehold type kebeles kebeles Total
Cooperative nonmembers 1,702 680 2,382Cooperative members 0 150 150 Total 1,702 830 2,532
Source: Authors’ calculations based on data from ESCS (2005).Note: A kebele is a peasant association, the smallest administrative unit in
Ethiopia.
4 All households in this sample are involved in cereal production.
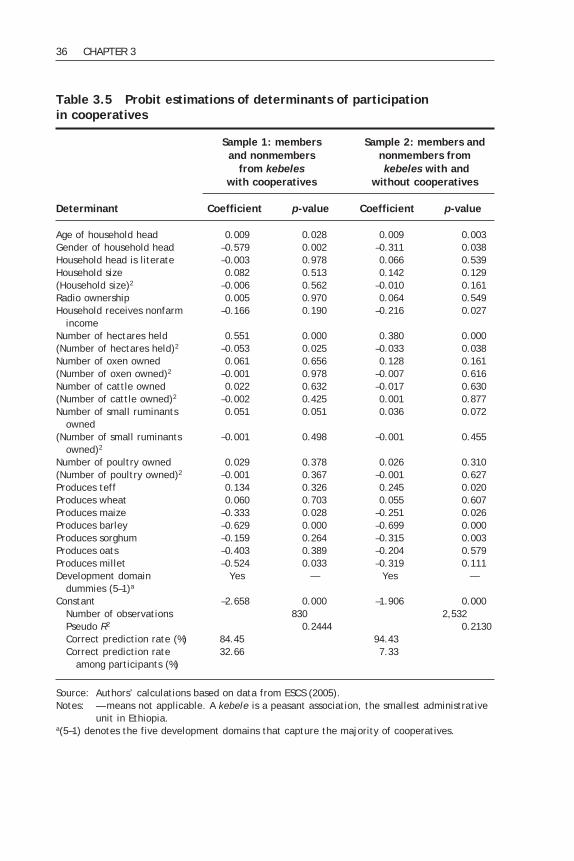
36 CHAPTER 3
Table 3.5 Probit estimations of determinants of participation in cooperatives
Sample 1: members Sample 2: members and and nonmembers nonmembers from from kebeles kebeles with and with cooperatives without cooperatives
Determinant Coefficient p-value Coefficient p-value
Age of household head 0.009 0.028 0.009 0.003Gender of household head –0.579 0.002 –0.311 0.038Household head is literate –0.003 0.978 0.066 0.539Household size 0.082 0.513 0.142 0.129(Household size)2 –0.006 0.562 –0.010 0.161Radio ownership 0.005 0.970 0.064 0.549Household receives nonfarm –0.166 0.190 –0.216 0.027 income Number of hectares held 0.551 0.000 0.380 0.000(Number of hectares held)2 –0.053 0.025 –0.033 0.038Number of oxen owned 0.061 0.656 0.128 0.161(Number of oxen owned)2 –0.001 0.978 –0.007 0.616Number of cattle owned 0.022 0.632 –0.017 0.630(Number of cattle owned)2 –0.002 0.425 0.001 0.877Number of small ruminants 0.051 0.051 0.036 0.072 owned (Number of small ruminants –0.001 0.498 –0.001 0.455 owned)2 Number of poultry owned 0.029 0.378 0.026 0.310(Number of poultry owned)2 –0.001 0.367 –0.001 0.627Produces teff 0.134 0.326 0.245 0.020Produces wheat 0.060 0.703 0.055 0.607Produces maize –0.333 0.028 –0.251 0.026Produces barley –0.629 0.000 –0.699 0.000Produces sorghum –0.159 0.264 –0.315 0.003Produces oats –0.403 0.389 –0.204 0.579Produces millet –0.524 0.033 –0.319 0.111Development domain Yes — Yes — dummies (5–1)a Constant –2.658 0.000 –1.906 0.000 Number of observations 830 2,532 Pseudo R2 0.2444 0.2130 Correct prediction rate (%) 84.45 94.43 Correct prediction rate 32.66 7.33 among participants (%)
Source: Authors’ calculations based on data from ESCS (2005).Notes: — means not applicable. A kebele is a peasant association, the smallest administrative
unit in Ethiopia.a(5–1) denotes the five development domains that capture the majority of cooperatives.

the importance of associated concerns, we also report estimates from the same model applied to the entire sample. Overall, parameter estimates and their statistical significance are similar, except for variables linked to non-farm income and type of cereals production, which may well be influenced by kebele-level characteristics. We find, however, that estimates based on the restricted sample are better able to predict the rare event (membership in cooperatives) than those based on the full sample. We therefore use the restricted sample to generate propensity scores for households living in com-parison kebeles, determining which ones would probably participate, given access to a cooperative. The distribution of propensity scores among the treatment and compari-son groups are reported in Figure 3.2. As is clear from the figure, the distri-butions appear quite different, so that matching techniques will be necessary to ensure the robustness of our estimates. Several techniques can be used. Here we focus on two broadly used methods: (1) nonparametric kernel regres-sion matching proposed by Heckman, Ichimura, and Todd (1998); and (2) five-nearest-neighbors matching. In the first case, each treated household is
IMPACT ON COMMERCIALIZATION 37
Figure 3.2 Propensity-score distribution among treatment and comparison observations
Source: Authors’ calculations based on data from ESCS (2005).
Propensity score
00.0 0.2 0.4 0.6 0.8 1.0
2
5
1
3
4
Members in treatment kebelesFarmers in control kebeles
Percentage of farmers

Tabl
e 3.
6 B
alan
cing
tes
ts o
f m
atch
ed s
ampl
es
U
nmat
ched
sam
ples
Ke
rnel
-bas
ed m
atch
ing
Five
-nea
rest
-nei
ghbo
rs m
atch
ing
Tr
eatm
ent
Com
pari
son
Dif
fere
nce
Trea
tmen
t Co
mpa
riso
n D
iffe
renc
e Tr
eatm
ent
Com
pari
son
Dif
fere
nce
ke
bele
s ke
bele
s p-
valu
ea ke
bele
s ke
bele
s p-
valu
ea ke
bele
s ke
bele
s p-
valu
ea
Age
of h
ouse
hold
hea
d
47.7
9 42
.82
0.00
0*
47.6
0 47
.79
0.91
5 47
.60
48.5
5 0.
608
(y
ears
) G
ende
r of
hou
seho
ld
1.10
1.
17
0.01
5*
1.10
1.
06
0.33
6 1.
10
1.05
0.
185
he
adb
Hou
seho
ld h
ead
liter
atec
39.5
9 30
.69
0.02
5*
40.0
0 36
.43
0.54
1 40
.00
32.7
1 0.
207
Hou
seho
ld s
ize
6.04
5.
19
0.00
0*
5.92
5.
84
0.76
8 5.
92
5.74
0.
513
Radi
o ow
ners
hipc
1.40
1.
21
0.00
0*
1.37
1.
31
0.34
3 1.
37
1.32
0.
368
Non
farm
inc
omec
1.48
1.
53
0.26
2 1.
48
1.49
0.
920
1.48
1.
49
0.86
8La
nd o
wne
d (h
ecta
res)
2.
10
1.34
0.
000*
1.
95
2.07
0.
449
1.95
2.
06
0.47
5O
xen
(num
ber)
1.
63
0.90
0.
000*
1.
47
1.38
0.
553
1.47
1.
38
0.58
3Ca
ttle
(nu
mbe
r)
5.16
3.
50
0.00
0*
4.80
4.
55
0.59
3 4.
80
4.54
0.
587
Rum
inan
ts (
num
ber)
3.
42
2.44
0.
003*
2.
84
3.73
0.
089*
2.
84
3.70
0.
075*
Poul
try
(num
ber)
3.
66
2.11
0.
000*
3.
60
3.39
0.
688
3.60
3.
41
0.71
5Ce
real
pro
duct
ion
(kg)
1,
148.
9 65
0.94
0.
000*
1,
073.
0 89
6.39
0.
135
1,07
3.0
897.
6 0.
115
Sour
ce:
Auth
ors’
cal
cula
tion
s ba
sed
on d
ata
from
ESC
S (2
005)
.N
otes
: *
indi
cate
s di
ffer
ence
s si
gnif
ican
t at
the
10
perc
ent
or l
ower
lev
el.
A ke
bele
is
a pe
asan
t as
soci
atio
n, t
he s
mal
lest
adm
inis
trat
ive
unit
in
Ethi
opia
.a S
igni
fica
nce
test
res
ults
(us
ing
p-va
lues
) of
the
dif
fere
nce
betw
een
the
trea
tmen
t an
d co
mpa
riso
n sa
mpl
e va
lues
.b 1
= m
ale;
2 =
fem
ale.
c 1 =
yes
; 2
= no
.

matched with the entire sample of comparisons. However, each comparison observation enters the estimate with a weight inversely proportional to its distance to the treatment one, based on the propensity score distribution. In the second method, each treatment observation is matched with the average value of its five nearest comparison neighbors, again based on the propensity score distribution. To ensure maximum comparability of the treatment and comparison groups, the sample is restricted to the common support region, defined as the interval of propensity score values where both treatment and comparison observations can be found. A straightforward way to test the validity of the matching procedure is to compare an average household’s characteristics in the treatment sample to the corresponding characteristics of the comparison group generated. Accord-ingly, the absence of significant differences between the treatment and com-parison groups is indicative of a valid matching. We thus undertake a series of statistical tests for differences in household characteristics on three differ-ent samples: (1) cooperative members in treatment kebeles compared to all households in the comparison kebeles (an unmatched sample); (2) cooperative members in treatment kebeles compared to the subset of households satisfying the common support restriction in the comparison kebeles, with kernel-based matching; and (3) cooperative members in treatment kebeles compared to the subset of households satisfying the common support restriction in the compari-son kebeles, selected through the five-nearest-neighbors matching method. As shown in Table 3.6, the unmatched sample fails to satisfy the balanc-ing properties: households in treatment kebeles are on average significantly different from the households in the comparison kebeles in all but one of the aspects considered. By comparison, only one such significant difference is observed in the matched samples, that is, the number of ruminants owned by the household. Overall, these results suggest that the two matched sam-ples suit our comparability requirements, whereas the nonmatched sample does not.
Average Impact
Indicators of ImpactWe assess the impact of cooperatives on smallholders’ commercialization using two related indicators. The first one captures the extent to which cooperatives provide smallholders with better market conditions in the form of higher output prices. The second one measures smallholders’ actual mar-keting response to cooperative membership, as reflected in the percentage of output being commercialized.
IMPACT ON COMMERCIALIZATION 39
The impact of cooperatives on output prices is intended to capture whether cooperatives effectively enable their members to obtain a higher price for their output. This indicator is fundamental, because policies promoting coopera-tives often highlight, as a rationale, the possibility that such organizations can help smallholders obtain higher prices for their output through reduced trans-action costs, increased bargaining power vis-à-vis traders, or the ability to reach more attractive markets. The price indicator that we use is an acreage-share weighted sum, over all types of cereal sold, of the difference between the price received by the member household and the corresponding average price in the sample:
pij – p–j
PDi = Σlij × (—————— × 100), j p–j
where PDi is the price indicator for household i, lij is the proportion of land that is allocated to cereal j by household i in 2005, pij is the unit price receivedby household i for crop j, and p–j is the average unit price of crop j received bythe sample households.5
The second indicator aims to capture whether smallholders’ participation in marketing cooperatives leads to more market-oriented behavior. We use the share of the cereal output that was sold by a household in 2005, denoted PS, and defined as:
Sij PSi = Σ ———, j Qij
where Qij is the quantity of crop j that was produced by household i and Sij is the quantity of crop j that was sold by household i, both in 2005. If coop-eratives are able to enhance market participation, then their impact on this indicator will be positive.
EstimatorsBecause the impact estimates may be sensitive to the estimator chosen, we use two separate classes of estimators to assess the robustness of our results. In the first one, we simply compute the difference in outcome between treatment and comparison households that are matched according to the
40 CHAPTER 3
5 The aggregation process across crops is meant to capture the effects of the household’s crop production profile.

two procedures described above. Because analytical standard errors are not computable for the kernel density matching method, we use 100 bootstrap replications stratified at the development domain level to compute robust estimates of them. The second estimator is based on ordinary least squares and tobit estimations, including several control variables. To further ensure comparability of the treatment and comparison groups, we restrict the sam-ple to the common support region of the five-nearest-neighbors matching, as described above.
Results: Average Impact of Cooperatives on Their MembersPanel A of Table 3.7 gives the nonparametric estimates of the average treat-ment effect on the treated—that is, the mean impact that cooperative mem-bership has had on members’ output commercialization and price. Starting with the price difference indicator, we find that, on average, cooperative members receive between 7.2 and 8.9 percent higher prices for their cereal products than did their nonmember counterparts. This effect is statistically significant and robust across both matching techniques; it is consistent with the idea that cooperatives may increase the returns to commercialization for smallholder farmers. Regarding the share of production sold, however, we find that cooperative membership does not have an impact significantly different from zero. The implication of these results appears surprising: despite a higher aver-age price received for their outputs, cooperative members apparently do not tend to supply more of their output to the market. Two types of biases may be at play, however. First, the obtained estimates may be influenced by the estimation procedures adopted and the indicators used. Second, given the reduction in the size of the sample, the estimates obtained may lack representativeness of the general situation in Ethiopia. To account for these sources of bias, we present in panels B and C of Table 3.7 a series of robust-ness and representativeness checks. For instance, one may argue that the use of the sample average as the reference point in the price indicator is problematic. Although our estima-tions control for important determinants of output prices via the develop-ment domains, it could still be the case that, if cooperatives are located in areas with higher prices to start with, a higher price for cooperative members may wrongly be attributed to the presence of cooperatives instead of to local conditions. To avoid such biases, using zonal or regional level aggregates as the reference point instead of the entire sample might be recommended. In this case, however, the relatively small size of our sample at the zonal level as well as in some regions would provide us with imprecise estimates
IMPACT ON COMMERCIALIZATION 41

42 CHAPTER 3
Table 3.7 Effect of cooperatives on members’ cereals commercialization
Kernel-based Five-nearest- matching neighbors matching
Standard Standard Number of ATT error ATT error observations
MeasureA. Two-step matching, final sample
Price difference (%) 7.249 3.229** 8.901 4.361** 862 Production sold (%) –0.122 1.862 –1.116 2.202 1,817
B. Checks of robustness B-1. Two-step matching, final sample limited to Oromia region only
Price difference (%) 8.545 3.952** 7.141 6.373 454 Production sold (%) –2.881 3.671 –2.914 3.141 787
B-2. Two-step matching, final sample excluding kebeles with NGO-created cooperatives
Price difference (%) 5.567 3.674 6.196 4.366 861 Production sold (%) 0.761 1.876 –1.402 2.442 1,805
B-3. Two-step matching, final sample, with propensity scores estimated on whole sample
Price difference (%) 7.206 3.229** 7.562 3.771** 862 Production sold (%) –1.180 1.964 –3.224 2.550 1,817
C. Checks of representativeness C-1. Two-step matching, sample with all regions
Price difference (%) 11.451 2.060*** 10.607 2.765*** 1,449 Production sold (%) –1.174 1.147 –0.944 1.340 2,993
C-2. Two-step matching, sample with member-created cooperatives
Price difference (%) 9.294 1.831*** 8.626 2.327*** 1,471 Production sold (%) 0.005 1.07 –0.084 1.325 2,972
C-3. Two-step matching, sample with all regions and member-created cooperatives
Price difference (%) 13.120 1.923*** 12.118 2.206*** 1,504 Production sold (%) –1.380 0.923 –1.295 1.093 3,105
C-4. One-step matching, final sample within treatment kebeles only
Price difference (%) 7.606 3.980* 7.259 3.571** 368 Production sold (%) –1.083 1.811 –1.410 2.135 822
Source: Authors’ calculations based on data from ESCS (2005).Notes: Stratified bootstrap with 100 replications is used to estimate the standard errors.
Numbers are significant at the * 10 percent, ** 5 percent, and *** 1 percent levels, respectively. ATT means average treatment effect on the treated; NGO means non-governmental organization. A kebele is a peasant association, the smallest admini-strative unit in Ethiopia.

of the mean price, which in turn may severely affect the precision of our estimates. To test the importance of such potential bias, we compute the average treatment effects when only the Oromia region is considered in the analysis. (As shown in Table 3.2, Oromia is the only region where a suf-ficiently large sample of treatment and comparison kebeles exist.) Results reported in panel B-1, although less precise, are qualitatively similar to those of panel A. Second, we investigate whether the inclusion of NGO-created coopera-tives in the final sample may affect the results. Indeed, if NGOs deliberately choose the kebeles in which they intervene based on criteria linked to the likely performance of the organizations they help set up, results may be artificially high. In panel B-2, we present estimates from a sample excluding kebeles where NGO-created cooperatives exist. The estimates are reduced in their magnitude and precision, although the main features remain. Third, we check whether our use of the sample of kebeles with coopera-tives only, to derive the propensity score estimates, may have affected the results. Results are reported in panel B-3; they do not show any meaningful differences from those of panel A. Next we investigate how the estimates may be affected by more represen-tative but arguably more biased samples. A first concern may come from our limitation to cereal crop cooperatives, when evidence suggests that coopera-tives are often more efficient when operating with high-value products, such as coffee. As discussed in Chapters 1 and 2, cereals do, however, constitute the most important crops for smallholders’ livelihood in many Sub-Saharan African countries, particularly in Ethiopia. Further, in panel C-1, we use a sample containing all regions, including Tigray, Beneshangul-Gumuz, and Harari. Again, the results do not clearly differ from those of panel A, although the impact of cooperatives on output prices seems greater in magnitude than for the fully restricted sample. The same conclusions are drawn from panels C-2 and C-3, where the sample includes all kebeles with member-created cooperatives, first restricted to only three regions (Amhara, Oromia, and SNNP) and then extended to cover all regions. Finally, in panel C-4, results are based on the sample of panel A but are further restricted to only kebeles where an externally created cooperative exists. The comparison is then done between cooperative members and nonmembers living in the same kebeles. Again, the results do not change in nature. Another robustness check uses parametric estimations that control for several household- and community-level characteristics (Table 3.8). Because participation in a cooperative may directly affect the production levels of
IMPACT ON COMMERCIALIZATION 43
members, we use the number of hectares of farm land “owned” by the household as a proxy for its actual level of production. Given the land own-ership regime in Ethiopia, this variable is considered as exogenous, at least in the short or medium term.6 Other variables in the estimation include the household head’s reading ability, household size, and the set of kebele-level control variables used in the definition of the development domains. The sample is the same as that used in the estimates reported in panel A of Table 3.7, except that a few observations with missing data were dropped. Estima-tors used are the ordinary least squares and tobit specifications described above. Coefficients in the upper part of Table 3.8 indicate that households living close to markets sell more of their production and at higher prices, whereas the opposite is true for households living in areas with higher population densities. Favorable agroclimatic conditions (that is, areas that produce sur-pluses) tend to have depressing effects on prices. From among the household-level characteristics, the amount of land owned positively affects the share of production that is commercialized by a household, and the education of the household head has a clear and significant effect on the price he or she is able to obtain for a unit of output. In the middle part of the table, we report the coefficients on a membership dummy (“Treatment ×”). Coop-erative membership does have a significant positive impact on output price, similar in magnitude to the results presented in Table 3.7. In contrast, the effect on the share of production sold cannot be distinguished from zero, further supporting the conclusions of the previous table. Overall, the robustness and representativeness checks support the general conclusion that, although cooperatives may provide significantly higher prices to their members, the average impact on fraction of output marketed is not statistically different from zero. However, these estimates capture average outcomes and do not capture potentially important heterogeneities across farmers’ responses to their participation in cooperatives.
Heterogeneous ImpactThere is no reason to believe a priori that membership in a cooperative implies homogenous responses for different categories of farmers. To see this, we plot in Figure 3.3 the distribution of the impact that cooperatives have on
44 CHAPTER 3
6 Land in Ethiopia is the property of the state and cannot be owned by individual farmers. Never-theless, land is allocated to households on a usufructuary basis for an undetermined period. Although land cannot be sold, it can be rented out and eventually passed on to heirs. The vari-able we use here as “landholding” is the amount of land allocated by the state to the house-hold. For a detailed description of the Ethiopian land-tenure system, see Gebreselassie (2006).
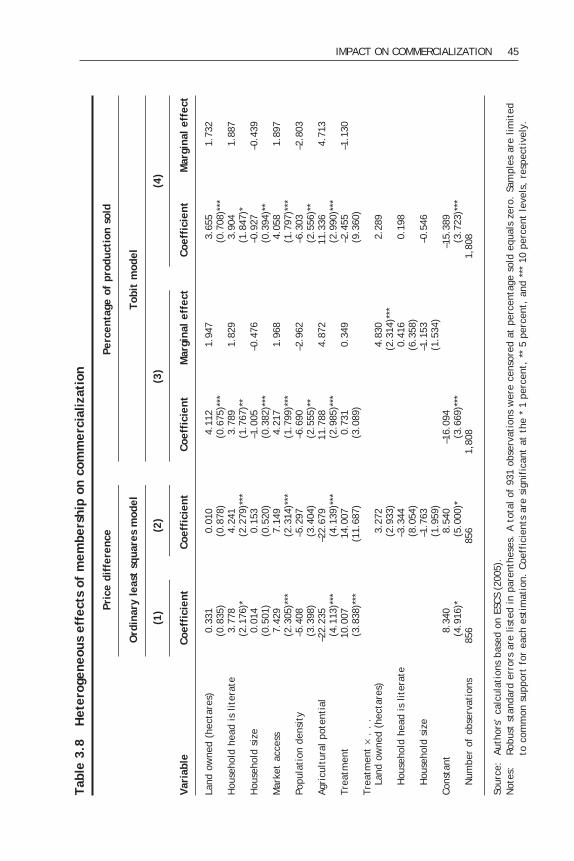
IMPACT ON COMMERCIALIZATION 45
Tabl
e 3.
8 H
eter
ogen
eous
eff
ects
of
mem
bers
hip
on c
omm
erci
aliz
atio
n
Pr
ice
diff
eren
ce
Perc
enta
ge o
f pr
oduc
tion
sol
d
O
rdin
ary
leas
t sq
uare
s m
odel
To
bit
mod
el
(1
) (2
) (3
) (4
)
Vari
able
Co
effi
cien
t Co
effi
cien
t Co
effi
cien
t M
argi
nal
effe
ct
Coef
fici
ent
Mar
gina
l ef
fect
Land
ow
ned
(hec
tare
s)
0.33
1 0.
010
4.11
2 1.
947
3.65
5 1.
732
(0
.835
) (0
.878
) (0
.675
)***
(0.7
08)*
**H
ouse
hold
hea
d is
lit
erat
e 3.
778
4.24
1 3.
789
1.82
9 3.
904
1.88
7
(2.1
76)*
(2
.279
)***
(1
.767
)**
(1
.847
)*H
ouse
hold
siz
e 0.
014
0.15
3 –1
.005
–0
.476
–0
.927
–0
.439
(0
.501
) (0
.520
) (0
.382
)***
(0.3
94)*
*M
arke
t ac
cess
7.
429
7.14
9 4.
217
1.96
8 4.
058
1.89
7
(2.3
05)*
**
(2.3
14)*
**
(1.7
99)*
**
(1
.797
)***
Popu
lati
on d
ensi
ty
–5.4
08
–5.2
97
–6.6
90
–2.9
62
–6.3
03
–2.8
03
(3.3
98)
(3.4
04)
(2.5
55)*
*
(2.5
56)*
*Ag
ricu
ltur
al p
oten
tial
–2
2.23
5 –2
2.67
9 11
.788
4.
872
11.3
36
4.71
3
(4.1
13)*
**
(4.1
39)*
**
(2.9
85)*
**
(2
.990
)***
Trea
tmen
t 10
.007
14
.007
0.
731
0.34
9 –2
.455
–1
.130
(3
.838
)***
(1
1.68
7)
(3.0
89)
(9
.360
)Tr
eatm
ent
× .
. .
La
nd o
wne
d (h
ecta
res)
3.27
2
4.83
0 2.
289
(2.9
33)
(2
.314
)***
H
ouse
hold
hea
d is
lit
erat
e
–3.3
44
0.
416
0.19
8
(8
.054
)
(6.3
58)
H
ouse
hold
siz
e
–1.7
63
–1
.153
–0
.546
(1.9
59)
(1
.534
)Co
nsta
nt
8.34
0 8.
540
–16.
094
–1
5.38
9
(4.9
16)*
(5
.000
)*
(3.6
69)*
**
(3
.723
)***
N
umbe
r of
obs
erva
tion
s 85
6 85
6 1,
808
1,
808
Sour
ce:
Auth
ors’
cal
cula
tion
s ba
sed
on E
SCS
(200
5).
Not
es:
Robu
st s
tand
ard
erro
rs a
re l
iste
d in
par
enth
eses
. A
tota
l of
931
obs
erva
tion
s w
ere
cens
ored
at
perc
enta
ge s
old
equa
ls z
ero.
Sam
ples
are
lim
ited
to
com
mon
sup
port
for
eac
h es
tim
atio
n. C
oeff
icie
nts
are
sign
ific
ant
at t
he *
1 p
erce
nt,
** 5
per
cent
, an
d **
* 10
per
cent
lev
els,
res
pect
ivel
y.

members’ percentage of production sold.7 The figure displays marked hetero-geneity in member response to participation in cooperatives. Although for some cooperative members, the share of production sold is almost double that of their nonmember counterparts, for many other members, this level is significantly lower than that for their estimated counterparts—possibly despite higher prices within the cooperative. We further investigate this heterogeneity by interacting the treatment dummy (“Treatment ×”) with household-level variables, in columns (2) and (4) of Table 3.8. In column (2), none of the obtained coefficients on the interacted terms differs significantly from zero, indicating that no obvious heterogeneity exists between cooperative members regarding the impact on output price received. In column (4), however, we find that the effect of membership on the percentage of production sold increases significantly
46 CHAPTER 3
7 Letting PS measure the household’s share of production sold and PS— the share of production sold by its generated counterfactual, the curves graphed in Figure 3.3 represent the distribution of the difference (PS – PS—), expressed as a percentage of PS—, across households.
Figure 3.3 Distribution of cooperative membership impact across households, kernel-density estimates
Source: Authors’ calculations based on data from ESCS (2005).
Percentage difference in share of produce sold, betweenactual observation and corresponding match
0�50 0 50 100
0.01
0.04
0.02
0.03
Kernel-based matchingFive-nearest-neighbors matching
Propensity score

8 Evidence has been uncovered suggesting that preference for food self-sufficiency falls with increasing income and/or wealth in Ethiopia (Taffesse, Bernard, and Yu 2007).
IMPACT ON COMMERCIALIZATION 47
with the size of the landholding, indicating that the larger a household’s landholding—standing in for potential production—the more responsive it will be to the price incentive secured by the cooperative. With an average impact of null, these results suggest that smaller farmers tend to be the ones substi-tuting out of the market in response to the price increases. Given the staple nature of the crops considered, this phenomenon may be explained by the potentially counteracting effects of the price increase on the household’s production and consumption choices. Although a price increase will probably lead to a positive (or zero) production response, its effect on consumption is more ambiguous. As a consequence, the impact on marketed output is uncertain. This ambiguity may be the case particu-larly for poorer households with lower capabilities of supply response and greater (positive) income elasticity of cereals consumption.8 Further research is needed, however, to elicit this hypothesis.
ConclusionIn Chapter 1 we hypothesized that collective action mechanisms can help small-holders overcome marketing constraints. The results presented here offer a somewhat contrasting picture. Although cooperatives can effectively secure higher prices for their members’ output, this ability does not necessarily lead to an increase in the quantity of output commercialized by their members, suggesting (as indicated elsewhere in the literature) that price incentives may not be sufficient to ensure greater market participation by the poorest farmers.

CHAPTER 4
Cooperatives for Whom?
This chapter investigates the extent to which RPOs constitute an effec-tive means for reaching the rural poor. We explore the second issue presented in Chapter 1: do poorer households participate in Ethiopian
cooperatives, and if not, do they nonetheless benefit indirectly from some of the cooperative’s activities?
Determinants of Household ParticipationOnly 17 percent of farm households with access to a cooperative in their kebele participated in it. Several reasons may explain this low level of parti-cipation. Under the previous regime, cooperatives were used to extend strong government control to the local level and to promote socialist ideology through compulsory participation. Field observations suggest that a long pro-cess of trust recovery is required for present-day cooperatives to overcome persisting suspicion and wariness on the part of potential members. Other reasons may be linked to a household’s economic incentive or the cooperative’s exclusive membership. Table 4.1 shows responses to the question (asked of nonmember households in kebeles that have a coopera-tive): “Why did you decide not to join the cooperative?” For 59 percent of the respondents, the benefit of participation did not seem worth the effort or fee required. Another 39 percent would have participated had they been accepted. We analyze these two mechanisms below.
Household-Level Self-ExclusionSmall- and large-scale farmers tend not to participate in these organiza-tions, resulting in what might be referred to as a “middle class” participa-tion effect. As discussed in Chapter 1, this pattern of self-exclusion can be linked to a nonlinear (inverted U-shaped) relationship between the level of a household’s production and the benefit it may derive from participating in such organizations. Using the subset of kebeles with at least one cooperative,
48
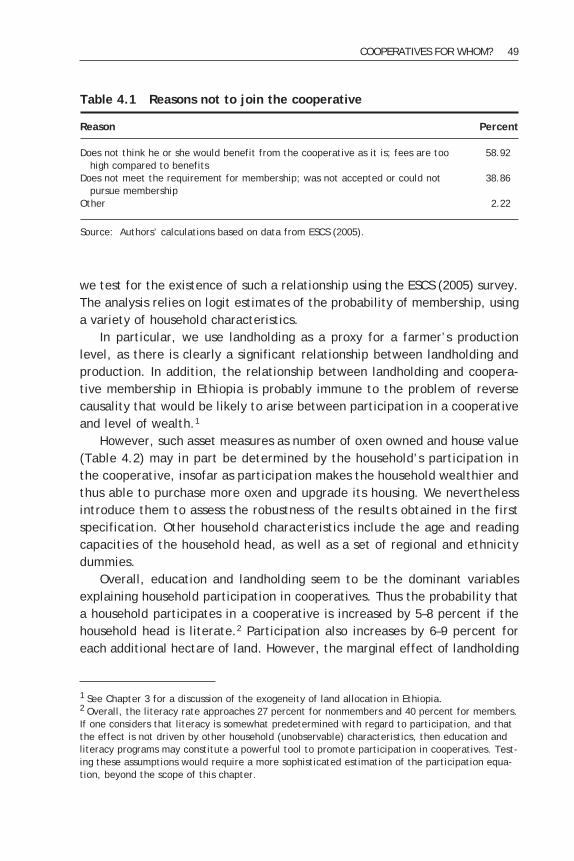
we test for the existence of such a relationship using the ESCS (2005) survey. The analysis relies on logit estimates of the probability of membership, using a variety of household characteristics. In particular, we use landholding as a proxy for a farmer’s production level, as there is clearly a significant relationship between landholding and production. In addition, the relationship between landholding and coopera-tive membership in Ethiopia is probably immune to the problem of reverse causality that would be likely to arise between participation in a cooperative and level of wealth.1
However, such asset measures as number of oxen owned and house value (Table 4.2) may in part be determined by the household’s participation in the cooperative, insofar as participation makes the household wealthier and thus able to purchase more oxen and upgrade its housing. We nevertheless introduce them to assess the robustness of the results obtained in the first specification. Other household characteristics include the age and reading capacities of the household head, as well as a set of regional and ethnicity dummies. Overall, education and landholding seem to be the dominant variables explaining household participation in cooperatives. Thus the probability that a household participates in a cooperative is increased by 5–8 percent if the household head is literate.2 Participation also increases by 6–9 percent for each additional hectare of land. However, the marginal effect of landholding
COOPERATIVES FOR WHOM? 49
Table 4.1 Reasons not to join the cooperative
Reason Percent
Does not think he or she would benefit from the cooperative as it is; fees are too 58.92 high compared to benefits Does not meet the requirement for membership; was not accepted or could not 38.86 pursue membership Other 2.22
Source: Authors’ calculations based on data from ESCS (2005).
1 See Chapter 3 for a discussion of the exogeneity of land allocation in Ethiopia.2 Overall, the literacy rate approaches 27 percent for nonmembers and 40 percent for members. If one considers that literacy is somewhat predetermined with regard to participation, and that the effect is not driven by other household (unobservable) characteristics, then education and literacy programs may constitute a powerful tool to promote participation in cooperatives. Test-ing these assumptions would require a more sophisticated estimation of the participation equa-tion, beyond the scope of this chapter.

50 CHAPTER 4Ta
ble
4.2
Det
erm
inan
ts o
f ho
useh
olds
’ pa
rtic
ipat
ion
in c
oope
rati
ves
Dep
ende
nt v
aria
ble:
ho
useh
old
part
icip
ates
in
at l
east
one
coo
pera
tive
M
eanb
(1)
(2)
(3)
(4)
Hou
seho
ld s
ize
5.13
0.
016
0.00
8 0.
010
0.01
1
(2.2
3)
(0.0
03)*
**
(0.0
03)*
**
(0.0
3)**
* (0
.003
)***
Age
of h
ouse
hold
hea
d (y
ears
) 44
.31
0.00
1 0.
001
0.00
1 0.
001
(1
5.28
) (0
.000
)***
(0
.000
)***
(0
.001
) (0
.000
)G
ende
r of
hou
seho
ld h
ead
0/1
–0.0
47
–0.0
49
–0.0
40
–0.0
39
(0
.018
)***
(0
.018
)***
(0
.016
)**
(0.0
15)*
*H
ouse
hold
hea
d is
lit
erat
e 0/
1 0.
080
0.06
4 0.
054
0.05
8
(0
.017
)***
(0
.017
)***
(0
.015
)***
(0
.015
)***
Land
ow
ned
(hec
tare
s)
1.24
0.
092
0.08
9 0.
065
0.05
9
(0.9
5)
(0.0
22)*
**
(0.0
23)*
**
(0.0
21)*
**
(0.0
20)*
*(L
and
owne
d)2
–0
.011
–0
.012
–0
.007
–0
.007
(0.0
05)*
* (0
.005
)**
(0.0
04)
(0.0
05)
Num
ber
of o
xen
0.88
0.02
2 0.
018
0.01
7
(1.1
2)
(0
.008
)***
(0
.007
)**
(0.0
07)*
*(N
umbe
r of
oxe
n)2
–0.0
01
–0.0
01
–0.0
01
(0.0
01)
(0.0
01)
(0.0
01)
Hou
se v
alue
(bi
rr)
835.
20
0.
559
× 10
–5
0.44
5 ×
10–5
0.
463
× 10
–5
(1
,486
.86)
(0.1
× 1
0–5)**
* (0
.1 ×
10–5
)***
(0.1
× 1
0–5)**
*
(Hou
se v
alue
)2
–0
.465
× 1
0–8
–0.3
40 ×
10–8
–0
.347
× 1
0–8
(0
.000
)***
(0.0
00)**
* (0
.000
)***
Et
hnic
ity
dum
mie
s
Yes
Yes
Re
gion
al f
ixed
eff
ects
Ye
s
Num
ber
of o
bser
vati
ons
2,
674
2,54
1 2,
486
2,48
6
Sour
ce:
Auth
ors’
cal
cula
tion
s ba
sed
on d
ata
from
ESC
S (2
005)
.N
otes
: M
argi
nal
effe
cts
are
repo
rted
at
the
mea
n of
the
ind
epen
dent
var
iabl
e af
ter
logi
t es
tim
atio
ns.
Coef
fici
ents
are
sig
nifi
cant
at
the
* 10
per
cent
, **
5 p
erce
nt,
and
***
1 pe
rcen
t le
vels
, re
spec
tive
ly.
The
valu
es f
or “
Gen
der
of h
ouse
hold
hea
d” a
nd “
Hou
seho
ld h
ead
is l
iter
ate”
den
ote
the
rang
e of
pos
sibl
e re
spon
ses,
wit
h 0
equa
l to
mal
e, 1
equ
al t
o fe
mal
e fo
r th
e ge
nder
var
iabl
e, a
nd 0
equ
al t
o ye
s an
d 1
equa
l to
no
for
the
lit-
erac
y va
riab
le.
a Sta
ndar
d er
rors
are
lis
ted
in p
aren
thes
es.
b Sta
ndar
d de
viat
ions
are
lis
ted
in p
aren
thes
es.
M
argi
nal
effe
ct a
t m
ean
of i
ndep
ende
nt v
aria
blea

decreases with the amount of land: very large farm households (holding more than 14 hectares) are less likely to participate.3
Cooperative ExclusivenessThe overall low participation in cooperatives may also be driven by their reluctance to include all potential members. As discussed earlier, inclusive membership implies two potentially opposing effects: (1) economies of scale in marketing surpluses and procuring inputs and (2) the offsetting increases in coordination costs that result from an increase in the number of members. Coordination costs may be particularly significant if increased membership is directly correlated with growing heterogeneity and divergent interests among members concerning the cooperative’s operations. In Table 4.3, we report on cooperative-level indicators of inclusiveness. We find that, although most cooperatives declare that their membership is open to all individuals, all of them condition membership on the fulfillment of particular criteria. For instance, 87 percent of the organizations only accept members living in the same kebele, a criterion that may be intended as a way of reducing monitoring costs among members. Surprisingly, asset ownership is not often cited as a primary criterion. But as these cooperatives are all mainly linked to agriculture, and most households control at least some land, an asset criterion would not be a discriminant in most cases. A more constraining criterion may be that all members must buy a share of the cooperative, which costs on average 45 birr (US$4.95) but can reach 1,000 birr (US$110.00).4
We investigate the potential effect of these membership criteria on actual membership structure in Table 4.4.5 Column (1) shows a positive rela-tionship between both the kebele and the age criteria and the total number of members in the organization (expressed in log values). However, an oppo-site effect is found with respect to the financial criterion. In column (2) we replace the financial criterion with the actual price of the cooperative share. Results are clearly robust, indicating that an increase of 1 birr (US$0.11) in the price of a cooperative share is typically associated with a 0.4 percent decrease in the size of the organization. Columns (3) and (4) report similar
COOPERATIVES FOR WHOM? 51
3 Such “middle-class effects” are often observed in the collective action literature. See, for example, Weinberger and Juttin (2001).4 Data limitations prevent us from relating cooperative membership fees (cooperative-level dataset) to the household decision to join the organization (household-level dataset).5 Note that the reported coefficients are likely subject to various endogeneity biases and should only be interpreted as correlates.

52 CHAPTER 4
Table 4.4 Membership criteria and actual membership
Heterogeneity (coefficient of variation Total membership (log) for landholding)
Dependent variable (1) (2) (3) (4)
Kebele criteria 0.477 0.287 0.018 0.027 (0.256)* (0.242) (0.066) (0.071)Age criteria 0.336 0.379 –0.043 –0.002 (0.200)* (0.175)** (0.052) (0.051)Asset criteria –0.305 –0.422 –0.032 –0.016 (0.345) (0.317) (0.089) (0.093)Financial criteria –0.482 –0.095 (0.176)*** (0.045)** Share price –0.004 0.0002 (0.001)*** (0.0002)Constant 6.040 6.136 0.462 0.364 (0.314)*** (0.263)*** (0.081)*** (0.077)*** Number of observations 171 169 171 169
Source: Data are from ECS (2006).Notes: A kebele is a peasant association, the smallest administrative unit in Ethiopia. Least
square coefficients are reported. Standard errors are listed in parentheses. Coefficients are significant at the * 10 percent, ** 5 percent, and *** 1 percent levels, respectively.
Table 4.3 Cooperative-level indicators of inclusiveness
StandardIndicator Unit Mean deviation
Can anybody join the cooperative? Percentage yes 73.26 Are there any criteria to join the cooperative? Percentage yes 100.00 Buy cooperative share and pay annual fee Percentage yes 56.97 Live in the same kebele Percentage yes 87.20 Minimum and/or maximum age requirement Percentage yes 65.69 Ownership of specific asset Percentage yes 7.55 Price of cooperative share Birr 45.24 96.39Annual fee Birr 5.56 9.62Has anybody ever been refused membership Percentage yes 8.77 in the cooperative? Percentage of women in the cooperative Percentage of 13.15 13.36 members
Source: Authors’ calculations based on data from ECS (2006).Note: A kebele is a peasant association, the smallest administrative unit in Ethiopia.

estimates, this time using the landholding heterogeneity—measured as the coefficient of variation of members’ landholdings—as the dependent variable. Although we do not find a clear negative effect of personal membership cri-teria (location, age, or assets), financial criteria appear to be a statistically significant factor in membership. By and large, these results do support the hypothesis that cooperative membership is driven partly by household self-selection and partly by cooper-ative exclusion policies. We find interesting that the exclusion of community members is not clearly stated as a policy but rather is implemented through potentially disqualifying financial criteria. This tacit approach may be related to the organization’s need to gain social acceptance and establish its legiti-macy as well as to reduce the potential for intracommunity disharmony and jealousy—a phenomenon also observed in RPO studies in West Africa (for example, Bernard et al. 2008). The desire for such social acceptance may also explain the range of activities undertaken by the organization.
Public Goods and Services, and Spillover EffectsAn organization’s inclusiveness may be defined more broadly than simply in terms of its membership. It may also be measured by whether an RPO’s bene-fits extend beyond its membership base. For instance, ECS (2006) data reveal that 90 percent of nonmembers living in a kebele where a cooperative exists declared that they benefit “somehow” from the presence of the organization. This level is all the more important considering that only 24 percent of these organizations reported being engaged in any type of provision of public goods for the community. As shown in Table 4.5, an average marketing cooperative in Ethiopia reports being simultaneously engaged in more than four separate activities.6 Some of these are clearly complementary to marketing, shown in the upper part of the table. For instance, 84 percent of these organizations are also engaged in input provision, and 54 percent aim to provide credit to their members. Other activities are more remote from the marketing objective of the organi-zation; these appear in the lower part of the table. Overall, 74 percent of the marketing organizations are also involved in nonmarketing-related activities, ranging from consumption services to HIV prevention.
COOPERATIVES FOR WHOM? 53
6 This figure does not imply that the cooperative is effectively providing this service, but rather that the service is part of its declared objectives. For instance, as discussed in the next chap-ter, a large proportion of the cooperatives that declare being engaged in output marketing had not actually provided such service to their members for at least 2 years.

54 CHAPTER 4
Tabl
e 4.
5 A
ctiv
itie
s un
dert
aken
by
agri
cult
ural
mar
keti
ng c
oope
rati
ves
25
th
75th
Type
of
acti
vity
D
efin
itio
n an
d un
it
Mea
n pe
rcen
tile
pe
rcen
tile
All
acti
viti
es
Tota
l nu
mbe
r, i
nclu
ding
mar
keti
ng
4.63
3
6M
arke
ting
-rel
ated
act
ivit
ies
N
umbe
r of
mar
keti
ng-r
elat
ed a
ctiv
itie
s To
tal
num
ber,
inc
ludi
ng m
arke
ting
3.
51
3 4
In
put
prov
isio
n 1
= pr
ovid
es t
his
serv
ice
(%)
83.7
2 1
1
Cred
it
1 =
prov
ides
thi
s se
rvic
e (%
) 54
.06
0 1
Ex
tens
ion
1 =
prov
ides
thi
s se
rvic
e (%
) 23
.25
0 0
Pr
ice
info
rmat
ion
1 =
prov
ides
thi
s se
rvic
e (%
) 70
.93
0 1
Pr
oces
sing
1
= pr
ovid
es t
his
serv
ice
(%)
19.1
8 0
0N
onm
arke
ting
act
ivit
ies
En
gage
s in
non
mar
keti
ng a
ctiv
itie
s 1
= at
lea
st o
ne (
%)
74.4
1 0
1
Num
ber
of n
onm
arke
ting
act
ivit
ies
Tota
l nu
mbe
r 1.
12
0 2
Co
nsum
ptio
n se
rvic
es
1 =
prov
ides
thi
s se
rvic
e (%
) 62
.20
0 1
Li
tera
cy t
rain
ing
1 =
prov
ides
thi
s se
rvic
e (%
) 11
.62
0 0
H
IV p
reve
ntio
n tr
aini
ng
1 =
prov
ides
thi
s se
rvic
e (%
) 23
.25
0 0
Pu
blic
inf
rast
ruct
ure
1 =
prov
ides
thi
s se
rvic
e (%
) 15
.11
0 0
Sour
ce:
Auth
ors’
cal
cula
tion
s ba
sed
on d
ata
from
ECS
(20
06).
Not
e:
Type
s of
act
ivit
y ba
sed
on a
sam
ple
of 1
72 c
oope
rati
ves
surv
eyed
in
2006
.

Thus the extent to which nonmembers benefit from a cooperative depends on the cooperative’s portfolio of activities. Three categories of activities can be identified: activities directly beneficial to nonmembers, activities neutral to nonmembers, and those indirectly beneficial to nonmembers (Table 4.6).
Activities Directly Beneficial to NonmembersThese are activities that allow the cooperative to benefit from scale econo-mies. With regard to product aggregation, for instance, these activities may include the supply of production inputs (such as fertilizer) or the sale of surplus cereal output. Often the only difference in benefits accruing to mem-bers versus nonmembers is limited to the distribution to members of profits or dividends that are generated from these services. For example, a study by Tendler (1983) finds that among cooperatives in Bolivia, nonmembers benefited, because RPOs tended to extend their services to nonmembers to establish larger economies of scale.
COOPERATIVES FOR WHOM? 55
Table 4.6 Who benefits from cooperative activities?
MeanIndicator (% yes)
Do you feel that you benefit from the cooperative even though you are not a member?a 89.59
Activities directly beneficial to nonmembers Has the cooperative provided fertilizers to its members in 2005? 74.27 Has it also provided fertilizers to nonmembers in 2005? 71.65 Has the cooperative provided pesticides to its members in 2005? 14.04 Has it also provided pesticides to nonmembers in 2005? 58.33 Has the cooperative provided seeds to its members in 2005? 53.22 Has it also provided seeds to nonmembers in 2005? 57.14Activities neutral to nonmembers Does the cooperative provide training to its members? 10.00 Can nonmembers access this training? 50.00 Does the cooperative formally share price information with its members? 80.00 Can nonmembers formally access the information? 30.00 Does the cooperative informally share price information with its members? 68.96 Can nonmembers informally access the information? 75.86Activities not beneficial to nonmembers Has the cooperative ever given credit in cash to its members? 60.00 Do nonmembers have access? 10.71Other activities Has the cooperative bought agricultural output from its members in 2005? 23.39 Has it also bought agricultural output from nonmembers in 2005? 2.50
Source: Authors’ calculations based on data from ESCS (2005) and ECS (2006).aFrom household-level interviews of nonmembers.

Activities Neutral to NonmembersThese activities may cover services for which nonmember participation entails only a low marginal cost to the organization. They include the provision of technical training in production techniques or information sharing on commod-ity prices, for which an additional nonmember participating in the training or sharing incurs little in the way of incremental costs. For example, a study by Bernard, de Janvry, and Sadoulet (2010) finds that among cooperatives in Burkina Faso, there is a tendency to provide services to nonmembers as a way of assuring acceptance of the cooperative in its village communities.
Activities Indirectly Beneficial to NonmembersNonmembers may also benefit from unintended consequences of cooperative activities. For example, if an RPO successfully bargains for higher prices for its members’ output, local commodity prices that are offered to nonmembers may also increase as a result.7 Similarly, if an RPO contributes to public goods that serve their members and are nonexcludable to nonmembers (such as the construction of local roads, schools, or health centers), then nonmembers are indirect beneficiaries of the RPO’s contributions. In both cases, nonmembers may enjoy indirect benefits from the mere existence of the cooperative—a benefit they cannot be prevented from enjoying. We investigate the relevance of this classification in Table 4.6. Both theactivities undertaken by the organizations and the extent to which non-members may benefit are given in the table. As expected, when activities are unambiguously associated with economies of scale, the corresponding service is often open to nonmembers. Such is the case for input provision services by cooperatives: nonmembers have access in the majority of cases. We also find that nonmembers tend to benefit from activities neutral to nonmembers, such as training (for instance, HIV/AIDS awareness and prevention) or the dis-semination of price information. Regarding the latter benefit, it is interesting to note that, even if the cooperative is not willing to provide such servicesto nonmembers, it is likely that outsiders would access it anyway, given thenonexcludable and nonrivalrous nature of information. Although only 27 percent of the cooperatives share price information formally beyond their member-ship, in 56 percent of the cases, outsiders can access it informally—through friends and family networks, for instance. Similarly, although robust empiri-cal estimates are lacking, it is often reported that the simple presence of a
56 CHAPTER 4
7 This effect may be particularly important in the case of input provision, where markets are often characterized by monopolistic competition. In these cases, RPOs tend to provide their members with inputs at cost, thereby exerting a downward pressure on the prices that other input suppliers can ask.

cooperative involved in marketing significantly affects the price local traders offer to nonmembers. Table 4.6 also shows the more restricted benefits in activities not benefi-cial to nonmembers—for example, the allocation of credit, typically in short supply in rural Ethiopia. In 72 percent of the cases where a cooperative gave credit to its members, it was unable to satisfy all its members’ demands. Accordingly, nonmembers access credit from the cooperative in less than 20 percent of all cases. Finally, we report statistics on the purchase of outputs as an unclassified activity. Indeed, although there are clearly potential economies of scale in output marketing, there are also several risks involved. In many cases, coop-eratives only broker a relationship between buyers (typically, local traders and cooperative unions) and sellers as a means of minimizing the risk of holding unsold output. When a cooperative actually buys smallholders’ surplus output, it often restricts this service to members who share the risk of unsold output (for instance, through a lower share of the profits generated from the collec-tive marketing margins). Thus Table 4.6 shows that in only 2.5 percent of cases does a cooperative buy output from both its members and from nonmembers. Overall, the extent to which cooperatives benefit nonmembers depends on their willingness to engage in activities that are friendly or neutral to outsiders. In many cases, it is likely that poorer households will benefit less, because the gains are likely to be positively linked to the level of production (for instance, access to fertilizer at better prices will be more beneficial to an individual with larger fertilizer needs, that is, someone with a larger farm or landholding). In other cases, where no complementary asset determines the level of benefits—such as training on HIV/AIDS awareness and prevention—poorer nonmembers may benefit just as much as their richer counterparts.
ConclusionIn conclusion, the findings presented here are broadly consistent with Issue 2 of Chapter 1: they suggest that the poorest of the poor tend to face considerable constraints on membership in marketing cooperatives. However, poorer non-member households still benefit from positive spillovers generated by some types of cooperative activities, although these benefits are often limited in comparison to those accruing to members. Finally, it is important to note that data availability limited the nature and depth of the analysis. The geographic spread and role of cooperatives in Ethiopia are also changing. Both consider-ations indicate the need for further data collection and analysis.
COOPERATIVES FOR WHOM? 57

CHAPTER 5
Commercialization Performance of Cooperatives
This chapter investigates the actual marketing performance of coopera-tives. We analyze the extent to which activity portfolio and member-ship structure can account for the overall limited number of commer-
cially active organizations. We then examine how governance structure can be adapted to mitigate these effects.
Marketing Performance of Ethiopian CooperativesAlthough the cooperative movement in Ethiopia has chalked up successes in traditional export sectors, such as coffee (see Gabre-Madhin et al. 2003; Kodama 2007), its successes in the food staple sector are far fewer. During 2003–07, cooperatives marketed 282,000 metric tons of grain, less than 1 percent of total grain production in the country (Meherka 2008). In contrast, cooperatives marketed 357,000 metric tons of fertilizer, or 67 percent of all fertilizer imports and 85 percent of domestic fertilizer distribution (Meherka 2008). Similar conclusions can be reached using the ECS (2006) data. As shown in Table 5.1, only 59 percent of the cooperatives that claimed to be engaged in marketing members’ output actually performed this activity during the 12 months prior to the survey. For those cooperatives that did market output, the average value sold per member was 1,116 birr (about US$122.76), although for 75 percent of them, the value was below 200 birr (about US$22.00).1
We might hypothesize that this pattern reflects the organizations’ in-capacities to effectively market their members’ products. However, the results presented in the previous chapter indicate that cooperatives that provide marketing services are relatively well organized to do so. As shown in Table 5.1, these organizations tend to specialize in one or two products, storing
58
1 This measure was often not recorded in the cooperative registries; it was therefore collected from estimates by the woreda-level cooperative office, resulting in potentially large biases. For this reason, the following estimations are restricted to the binary performance indicator: “The cooperative has provided marketing services to its members over the past 12 months.”

them for more than 3 months (on average) to secure higher prices. Price information is generally collected on one to three markets, including markets that are fairly distant from the location of the cooperative. No intermedi-ary is used for transactions, which may contribute to the improved prices obtained by cooperatives for their members. We examined the knowledge of actual price levels for the Addis Ababa market and found it somewhat limit-ed.2 This ignorance may be due, however, to the timing of our survey—about 5 months before harvest.3 Overall, lack of marketing capacity does not seem to explain the finding that more than 40 percent of cooperatives officially engaged in output marketing did not sell any of their members’ output over the past 2 years. Another hypothesis is that members may be unwilling to sell their prod-ucts through the organization. Although 82 percent of cooperative members said they were satisfied with their participation in the organization, only 40
COMMERCIALIZATION PERFORMANCE 59
Table 5.1 Marketing performance of Ethiopian cooperatives
Description 25th 75thIndicator and unit Mean percentile percentile
Sold members product over past 1 = yes (%) 58.72 0 1 12 months Value sold last year Birr 256,408 22,800 150,294Value sold last year, per member Birr 1,116.30 30.39 188.88Number of product commercialized Number 1.55 1 2Stored product before selling? 1 = yes (%) 95.58 1 1 Number of days of storage Number 105.03 30 150Collect price info before selling? 1 = yes (%) 85.29 1 1 On how many markets? Number 2.25 1 3 Farthest market on which Kilometers 99.6 5.5 69.25 information is collected Knows price in Addis Ababa, 1 = yes (%) 37.27 0 1 Ethiopia, today? Knows price in nearest woreda 1 = yes (%) 63.31 0 1 market today? Used intermediary for transaction? 1 = yes (%) 4.14 0 0Cooperative transported product for 1 = yes (%) 21.32 0 0 transaction?
Source: Authors’ calculations based on data from ECS (2006).Note: Woredas, or districts, are one of the smallest administrative units in Ethiopia.
2 Addis Ababa is by far the largest grain market in the country and is often considered to lead price evolution in other regional markets (Gabre-Madhin 2001).3 The survey attempted to collect accounts of cooperative financial performance. Cooperative-level data were, however, scarce and often of low reliability. Audits by woreda cooperative offices of primary cooperatives were also collected but proved insufficient in number and often concerned only the best-performing organizations.

percent indicated that the main benefits they gain from cooperatives relate to the commercialization of their output. According to data from ESCS (2005), 60 percent do not feel obligated to sell their product through the coopera-tive, and of this group 71 percent sold none of their past season production to the cooperatives and only 14 percent sold all of it to these organizations. A possible conclusion is that the marketing functions of the cooperatives are not the primary attraction for their members. Note that cooperatives are also involved in other types of activities: 74 percent were engaged in activities with no apparent direct link to marketing.
Cooperative Activities, Membership, and Marketing PerformanceIn Table 5.2 we report the results of a series of tests of difference related to the activities undertaken by cooperatives and their marketing performance. The first three columns of the table relate characteristics of the coopera-tive to its portfolio of activities—economic only versus mixed economic and social. Cooperatives with mixed portfolios have a significantly larger number of members but a lower average landholding than specialized organizations have. Thus multiple activities tend to attract more members but with less individual potential for product aggregation. Multipurpose cooperatives are, on average, older than their specialized counterparts. The last three columns of Table 5.2 show the results of similar tests of dif-ferences, this time between cooperatives that provided marketing services to their members over the 12 months prior to the survey and those that did not. Although there are no significant differences in terms of membership, aver-age landholding is greater for cooperatives providing marketing services. We further investigated whether large portfolios of activities may in part explain the apparently low marketing performance of cooperatives. Indeed, several studies have argued that by broadening their portfolio of activities, cooperatives often jeopardize their capacity to fulfill their initial purposes, especially when these activities are more diverse (Lele 1981; Collion and Rondot 2001). There have been two main explanations for this phenomenon. First, for a given size of organization, engaging in new activities increases management difficulties, which may negatively affect the quality of the service initially provided (Stringfellow et al. 1997). Second, for cooperatives spe-cialized in a given activity, an increase in the heterogeneity of membership can lead to increased coordination costs, offsetting the benefits linked to economies of scale (Stockbridge, Dorward, and Kydd 2003). The analysis here focuses on the impact on coordination costs rather than on general manage-ment problems. The rationale is as follows. By providing extra services, marketing cooper-atives may become attractive to households that are otherwise uninterested
60 CHAPTER 5
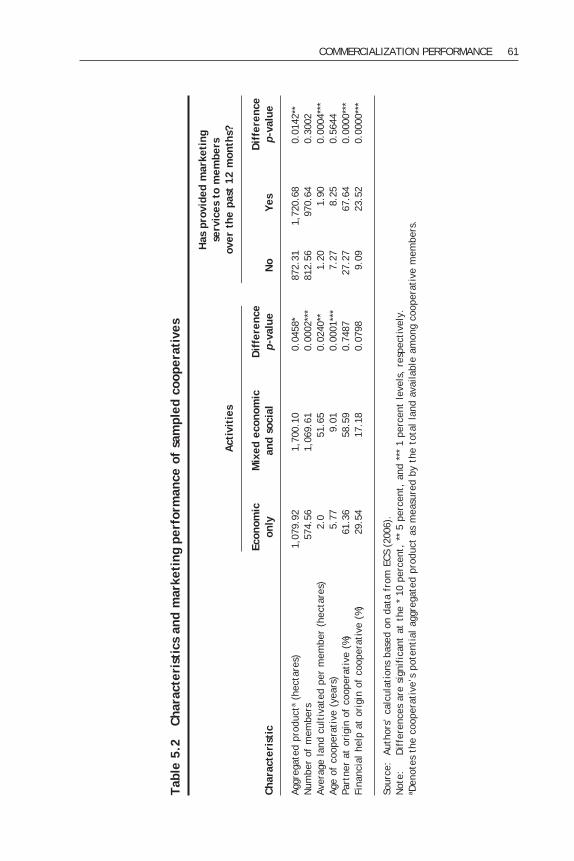
COMMERCIALIZATION PERFORMANCE 61
Tabl
e 5.
2 C
hara
cter
isti
cs a
nd m
arke
ting
per
form
ance
of
sam
pled
coo
pera
tive
s
Has
pro
vide
d m
arke
ting
serv
ices
to
mem
bers
A
ctiv
itie
s ov
er t
he p
ast
12 m
onth
s?
Ec
onom
ic
Mix
ed e
cono
mic
D
iffe
renc
e
D
iffe
renc
eCh
arac
teri
stic
on
ly
and
soci
al
p-va
lue
No
Yes
p-va
lue
Aggr
egat
ed p
rodu
cta
(hec
tare
s)
1,07
9.92
1,
700.
10
0.04
58*
872.
31
1,72
0.68
0.
0142
**N
umbe
r of
mem
bers
57
4.56
1,
069.
61
0.00
02**
* 81
2.56
97
0.64
0.
3002
Aver
age
land
cul
tiva
ted
per
mem
ber
(hec
tare
s)
2.0
51.6
5 0.
0240
**
1.20
1.
90
0.00
04**
*Ag
e of
coo
pera
tive
(ye
ars)
5.
77
9.01
0.
0001
***
7.27
8.
25
0.56
44Pa
rtne
r at
ori
gin
of c
oope
rati
ve (
%)
61.3
6 58
.59
0.74
87
27.2
7 67
.64
0.00
00**
*Fi
nanc
ial
help
at
orig
in o
f co
oper
ativ
e (%
) 29
.54
17.1
8 0.
0798
9.
09
23.5
2 0.
0000
***
Sour
ce:
Auth
ors’
cal
cula
tion
s ba
sed
on d
ata
from
ECS
(20
06).
Not
e:
Dif
fere
nces
are
sig
nifi
cant
at
the
* 10
per
cent
, **
5 p
erce
nt,
and
***
1 pe
rcen
t le
vels
, re
spec
tive
ly.
a Den
otes
the
coo
pera
tive
’s p
oten
tial
agg
rega
ted
prod
uct
as m
easu
red
by t
he t
otal
lan
d av
aila
ble
amon
g co
oper
ativ
e m
embe
rs.

in its marketing activities. Additional members will increase the coordination costs (through an increase in size) without contributing to increased com-mercialization benefits (through added output to be marketed). As a conse-quence, some households that are uninterested in the additional service and only marginally interested in the commercialization services will revise their cost–benefit comparisons and leave the organization, further lowering com-mercialization benefits for the remaining members. This in turn may prompt additional departures from the cooperative. In the extreme case, the mar-keting cooperative will end up providing only noncommercialization services to its members. Only if there is substantial overlap between the two groups of members (those interested in commercialization and those attracted by the additional services)—in other words, if many households are likely to be interested in both services—can these supplementary activities reinforce the organization by providing more than one service at essentially constant costs. We test these relationships below.
Activities and MembershipTable 5.3 reports estimates of the correlation between various social activi-ties and the size of cooperatives (columns (1) and (2)), and with the potential aggregated product as measured by the total land available among coopera-tive members.4 Presumably, the introduction of these activities should lead to an increase in membership. However, if poorer households may be more interested in such social services, it follows that the overall product aggre-gation should only slightly increase as a result of the introduction of these activities. In columns (1) and (3) we test for the effective significant influence of these activities on the size and product aggregation of the organization. The results indicate that consumption-related services as well as literacy training exert a strong positive influence on the size of the organization. The effect is somewhat weaker for product aggregation. Columns (2) and (4) assess the robustness of these results by adding a series of additional explana-tory variables. In particular, we use the initial size of the organization as a proxy measure for members mostly interested in the marketing services of the organization. (Thus we assume that social activities were added later to the cooperatives, which is the case for nearly all of them.) The results on social activities are robust across all estimations as well as the coefficients obtained on the initial membership variable. In contrast, the effect of social activities on product aggregation vanishes once the impact of initial product
62 CHAPTER 5
4 See Chapter 3 for a discussion of the exogeneity of land allocation in Ethiopia.

aggregation is accounted for. In all estimations, partial F-tests indicate the joint significance of the variables to be used as instruments later.
Membership and PerformanceTable 5.4 further tests the above theory by relating the marketing perfor-mance of a cooperative to its membership and aggregated product. Results from ordinary least squares estimates are shown in the table, with the basic model reported in column (1) and the more controlled one in column (2).5 The
COMMERCIALIZATION PERFORMANCE 63
Table 5.3 Social activities and size of cooperative
Log na Log Qb
Characteristic (1) (2) (3) (4)
Consumptionc 0.908 0.407 0.560 0.046 (0.210)*** (0.133)*** (0.242)** (0.174)Literacyc 0.759 0.273 0.537 0.118 (0.282)*** (0.163)* (0.307)* (0.183)HIV preventionc –0.316 0.055 –0.257 0.211 (0.254) (0.110) (0.309) (0.141)Public infrastructurec –0.100 –0.277 0.210 0.048 (0.275) (0.233) (0.338) (0.277)Log (initial number of members) 0.511 0.535 (0.085)*** (0.096)***Age 0.040 0.054 (0.017)** (0.022)**Partner at origin 0.204 0.446 (0.122)* (0.185)**Financial help at origin –0.384 –0.226 (0.172)** (0.234)Controls for market access Yes Yes Controls for population density Yes Yes Constant 5.821 2.453 6.333 2.759 (0.217)*** (0.477)*** (0.236)*** (0.725)*** Number of observations 171 158 171 158 R2 0.19 0.71 0.07 0.46 F-test on significance 0.0004*** 0.000*** 0.0716 0.0000***
Source: Authors’ calculations based on data from ECS (2006).Notes: Robust standard errors are computed with clustering at the woreda level. Standard
errors are listed in parentheses. A woreda, or district, is one of the smallest adminis-trative units in Ethiopia. Numbers are significant at the * 10 percent, ** 5 percent, and *** 1 percent levels, respectively.
aDenotes the log value of the cooperative’s membership size.bDenotes the log value of the cooperative’s potential aggregate product.cF-test data given at end of table pertain to this characteristic.
5 The basic model is the simplest estimation containing the fewest number of variables and employing ordinary least squares.

results are rather clear: for a given level of potential volume traded, a 1 per-cent increase in the size of the organization typically leads to a decrease of 14 percent in the chance that it provides marketing services to its members. Furthermore, a 1 percent increase in the level of overall potential volume-traded aggregation leads to a 16 percent greater chance that the organization has performed marketing activities during the past 12 months. These effects are robust with the introduction, in the more controlled model (column (2)), of woreda-level characteristics controlling for the market opportunities faced by the cooperative, as well as the organization’s age, external partners, and financial support.6 These last characteristics may well influence member-ship and be decisive in terms of marketing performance. The results are now slightly lower than initially, but remain with the expected sign and are sta-tistically different from zero. Overall we find a rather clear correlation between a cooperative’s port-folio of activities, its type of membership, and its marketing performance.
64 CHAPTER 5
Table 5.4 Marketing performance of cooperatives
Ordinary least squares Two-stage least squares
Variable (1) (2) (3) (4)
Log (number of members) –0.143 –0.124 –0.589 –0.520 (0.073)** (0.061)* (0.206)*** (0.195)***Log (aggregated product) 0.164 0.132 0.637 0.540 (0.059)*** (0.056)** (0.221)*** (0.205)***Age of cooperative (years) 0.002 –0.001 (0.009) (0.010)Partner at origin 0.202 0.112 (0.064)*** (0.094)Financial help at origin 0.069 –0.032 (0.088) (0.111) Controls for market access Yes Yes Controls for population density Yes Yes Number of observations 168 162 162 156 R-squared 0.07* 0.19*** 0.17 Sargan test, p-value 0.8417 0.7868 Basmann test, p-value 0.8481 0.8049
Source: Authors’ calculations based on data from ECS (2006).Note: Numbers are significant at the * 10 percent, ** 5 percent, and *** 1 percent levels,
respectively.
6 We use the cooperative’s partners and financial help at inception to avoid two-way relation-ships with the organization’s performance.

These correlations face significant potential endogeneity problems, however, as the marketing performance of the cooperative may itself influence both the number and type of members. For instance, an organization that performs well may attract more members than does a weakly performing one.7 As a result, the estimates of membership on performance are likely to understate the magnitude of the (negative) relationship. Similar arguments may apply to aggregated product, although the sign would then be undetermined. Such biases can be overcome using an external source of variation in both member-ship and aggregated product. To overcome this potential bias, we use the above theory to justify the use of social activities as instruments for the size of the cooperative. To be valid, however, these instruments must respect the following three criteria:1. a cooperative’s engagement in such activities was not driven by its mar-
keting performance;2. there are no other unaccounted-for factors that may have driven both a
cooperative’s marketing performance and its portfolio of activities; and3. the effect of these social activities on marketing performance is uniquely
driven by their effects on membership.
The strong governmental and external partners’ support for social activities in cooperatives tend to support criterion 1. For instance, the Federal Coop-erative Commission requires that all registered cooperatives allocate between 1 and 5 percent of their earnings to a social fund that finances such activi-ties as HIV/AIDS awareness and prevention training. Further, controlling for a cooperative’s external partner may address concerns regarding criterion 2. However, criterion 3 cannot be directly tested unless other sets of instru-ments are also available. As described below, we use a cooperative’s original number of members as an extra instrument to perform such tests. These results are presented in columns (3) and (4) in Table 5.4, where we report two-stage least square estimates of a linear probability model of marketing performance. The results suggest that the relationships identified in the left part of the table hold, once one accounts for potential sources of endogeneity. In addition, the numbers tend to be higher in magnitude, sup-porting the idea of a reverse causality. Overall, the results suggest that a 1 percent increase in the size of the organization may lead to a 0.3 percent decrease in the probability that it provides marketing services to its mem-bers. Finally, we use Sargan’s (1958) and Basmann’s (1960) overidentification
COMMERCIALIZATION PERFORMANCE 65
7 However, most of the organizations (75 percent) have increased their memberships since their creation.

tests to verify that social activities are in effect not directly correlated with marketing performance. Accordingly, we cannot reject the exogeneity of our instruments at any reasonable confidence level. Overall, these results tend to support the claim that a wide scope of activi-ties may significantly affect membership structure. This structure may in turn impinge on the organization’s capacity to effectively provide marketing ser-vices to its members. Governance structure may help mitigate these effects, as we explore in the next section.
Governance StructureUnder the Federal Cooperative Agency’s guidance, efforts to promote coop-eratives in Ethiopia are designed to follow the principles set down by the International Cooperative Alliance and are meant to replicate global best practices. Use of such guidelines introduces a certain degree of standardiza-tion in the design of cooperative governance, management, and membership. The reforms are meant to ensure that cooperatives are governed in accordance with standard bylaws that provide for the regular election of chairpersons and management committees, and voting based on the principle of one member–one vote. For example, to receive a registration certificate from the regional BoCP, a cooperative must demonstrate that it has at least 10 members, is owned by its membership, and has put in place certain bylaws that govern the election of leaders, management of cooperative affairs, and so on. Thus, for example, ECS (2006) data show that in 99 percent of cases, all members are authorized to vote in their cooperative’s election for chairman, and in 97 percent of cases, the vote is organized on a one-member–one-vote basis. How-ever, anecdotal evidence suggests that beyond elections, members are some-times left with little influence on the direction taken by the cooperative. These divergences may be related to the possible existence of trade-offs between the various dimensions of inclusiveness, on the one hand, and the organization’s performance, on the other. For instance, a cooperative may choose to explicitly or implicitly exclude new members to maintain cohesive-ness among its existing members, minimize transaction costs that result from participatory decisionmaking, and ensure effective performance. Alterna-tively, cooperatives may choose to cast their membership more widely and allow both the size and the interests of the membership to expand. Increased size and diversified interests may lead to an expansion of the cooperative’s portfolio of activities, and may incur higher transaction costs for the coopera-tive’s participatory decisionmaking processes. We empirically investigate the decisionmaking process in Ethiopian coop-eratives through participation indicators, based on a series of questions meant
66 CHAPTER 5

to identify who the decisionmakers are for a series of commonly taken deci-sions on 1. the inclusion of new members, 2. the expulsion of existing members, 3. the start of a new activity in the cooperative, 4. the collaboration with a new partner, 5. the amount of dividends to be distributed, 6. the investment in new materials or infrastructure, 7. the amount of output to buy, 8. the amount of output to sell, 9. the amount of output to store,10. the amount of input to buy,11. the amount of input to sell,12. the time to sell,13. the price given to members for their outputs,14. the person or organization to buy input from,15. the person or organization to sell output to, and16. the market on which to sell.
For each decision, we recorded whether all members participated in the decision process (for example, through a vote in the general assembly) or the decision was left to a restricted number of individuals (such as the management committee or the president). We then computed participation indicators as the percentage of decisions that were open to all members. Three indicators are specifically considered: a general indicator taking all decisions into account, an indicator limited to general organizational deci-sions (decisions 1–6 above), and an indicator limited to technical decisions (decisions 7–16). Our results show that on average 19 percent of all decisions are open to all members. For general organizational decisions, the average reaches 38 percent, compared to only 8 percent for technical decisions. The low level of participation in technical decisions is to be expected. More surprising, how-ever, is the low level of participation in general decisions. More information can be drawn from the distributions of these variables, as shown in Figure 5.1. Clearly, in the vast majority of cooperatives, most—if not all—technical decisions are taken by the management committee. In contrast, the distribu-tion of the indicator for general decisions is clearly bimodal: some coopera-tives are more or less fully participatory, whereas others are almost fully nonparticipatory. We classify the former as high-participation and the latter as low-participation organizations.
COMMERCIALIZATION PERFORMANCE 67

Trade-Offs?We now investigate the relationship among membership, governance, and per-formance. The results are reported in Table 5.5. The results do not account for likely endogeneity biases and should therefore be interpreted only as correla-tions. Nevertheless, they are useful in pinpointing eventual trade-offs relevant for future, and more robust, analysis. In column (4), we also introduce proxies for the quality of cooperative management with two additional variables: share of committee members who can read and the maximum level of education among committee members. The estimated parameters for these proxies are not significant, but the param-eters estimated for our original set of variables remain robust. Overall, these results clearly show some trade-off between two objectives: (1) the extent to which a cooperative can open its membership (and allow more heterogeneity) or give voice to its members through participatory decisionmaking and (2) the extent to which it can maintain a minimum performance level in its economic activities.
68 CHAPTER 5
Percentage of decisions
00 100908070605040302010
40
70
30
20
10
50
60
Density of cooperatives
All decisionsGeneral decisions onlyTechnical decisions only
Figure 5.1 Participatory decisionmaking
Source: Authors’ calculations based on data from ESCS (2005).Note: Density distribution of cooperatives is calculated according to the percentage of
decisions taken by the general assembly.

ConclusionAs noted while exploring Issue 3 in Chapter 1, a large portfolio of activities may jeopardize a cooperative’s capacity to provide marketing services to its members. Results presented here tend to support this conjecture, via the effect of an organization’s scope of activities on its membership structure. We found, however, that this effect may—in part—be counteracted by appro-priate decisionmaking structures.
COMMERCIALIZATION PERFORMANCE 69
Table 5.5 Membership, governance, and performance (ordinary least squares)
Cooperative has sold members’ output in 2005 (0/1)
Dependent variable (1) (2) (3) (4)
Total landholding in the cooperative (log) 0.144 0.142 0.144 0.138 (0.049)*** (0.050)*** (0.049)*** (0.051)***Total membership (log) –0.139 –0.138 –0.141 –0.134 (0.058)** (0.058)** (0.062)** (0.065)**Heterogeneity (coefficient of variation 0.193 0.196 0.390 0.390 for landholding) (0.112)* (0.112)* (0.145)** (0.151)**High participation (0/1) –0.047 0.055 0.048 (0.068) (0.347) (0.360)High participation × Total membership 0.030 0.030 (0.052) (0.054)High participation × Heterogeneity –0.497 –0.484 (0.217)** (0.227)**Percentage of committee members who –0.092 can read (0.225)Maximum education level in committee 0.021 (0.057)Age Yes Yes Yes YesMarket access is high (0/1) Yes Yes Yes YesPopulation density Yes Yes Yes YesNumber of observations 162 162 162 161
Source: Authors’ calculations based on data from ECS (2006).Note: Numbers are significant at the * 10 percent, ** 5 percent, and *** 1 percent levels,
respectively.

CHAPTER 6
Conclusions
Over the past few years, policymakers, international donors, and devel-opment practitioners have shown a renewed interest in RPOs as a means to attain several goals: connecting smallholders to markets, allevi-
ating rural poverty, and promoting agricultural development and economy-wide growth. This interest has re-emerged, despite the rather troubled his-tory of RPOs in the region from the postcolonial era of the 1960s through the structural adjustment programs of the 1980s. With the recent emergence of a new type of RPO—one that is more respon-sive to the priorities of the community it serves, more independent of state control, and more oriented to the provision of market-related services—there is hope that collective action organizations can play a larger and more sup-portive role in smallholder commercialization than they currently do. How-ever, in spite of success stories accumulating around RPOs engaged in high-value crop marketing, there is scarce evidence to suggest that RPOs are playing the same role with respect to the marketing of cereals. And it is precisely these cereals that are the key to large-scale poverty reduction, agricultural development, and economywide growth in Sub-Saharan Africa. This study provides new insights into the question of what RPOs can and cannot do to support smallholder cereal producers in Sub-Saharan Africa. The study identifies the conditions under which RPOs engaged in cereal marketing are successfully promoting smallholder commercialization and examines how the benefits of this commercialization process are distributed. Specifically, this study investigates three broad issues. First, what role does collective action play in helping smallholders overcome marketing con-straints? Second, to what extent do poorer households tend to participate in RPOs? Third, what are the principal constraints on an RPO’s marketing per-formance? Our findings suggest the following. First and foremost, collective action can indeed be an effective means to provide marketing services to farmers facing prohibitive transaction costs. In fact, cooperatives deliver, on average, a 7 percent price premium for their members’ output, relative to what these farmers would have received had
70

they decided to market their output individually. Cooperatives are able to do this by collecting price information on several markets before choosing which market to sell in, storing members’ surpluses as a hedge against low postharvest prices, and eschewing the use of market intermediaries. Second, the downside to this premium is that the smallest farmers tend to market only the quantity necessary to meet their basic needs; and, because of the premium offered by the cooperative, this amount is less than the total quantity they would otherwise market individually. As a result, the actual quantity of grain coming to market from this cohort of farmers is less than it would be without the cooperative’s services. In a country where the supply of grain regularly falls short of demand, this issue is of strategic importance. Third, smaller farmers tend to self-exclude from participating in coop-eratives, as their returns from membership are less than the costs of mem-bership. This tendency may be partly attributable to membership fees that exceed the gains accruing from the price premium generated from collective marketing of smallholder surpluses. Fourth, some degree of exclusion is necessary for cooperatives to main-tain a certain degree of homogeneity in the cooperative’s membership—that is, homogeneity in members’ interests or levels of commitment. This neces-sity has implications for those who view cooperatives as a means of mobilizing entire rural communities or want to leverage cooperatives for the expression of the community voice. Fifth—and in spite of the practice of exclusion—there is evidence to sug-gest that for some services, excluded poorer farmers may still benefit from the presence of cooperatives. For example, cooperatives may exert upward pres-sure on output prices among local traders or provide public goods from which noindividual can be excluded. However, these spillover benefits for nonmembers tend to be small compared to the total benefits accruing to members. Sixth, the evidence suggests that grain-marketing cooperatives in Ethiopia are engaged in a wide range of nonmarketing activities. A striking feature of these organizations is their involvement in such activities as HIV/AIDS pre-vention and awareness and literacy training. Such social activities are often promoted by external partners—both state and nonstate actors—because they view cooperatives as an efficient way of reaching the rural poor. However, the evidence suggests that inclusion of such nonmarketing activities may significantly affect membership structure, thus reducing the cooperative’s capacity to provide marketing services to its members. Seventh, the evidence also suggests that different types of cooperative governance can similarly affect the cooperative’s capacity to provide market-ing services to its members. This finding illustrates the difficulties that RPOs face in balancing social inclusion and participatory decisionmaking on the one
CONCLUSIONS 71

hand against more professional, business-oriented management practices on the other. Thus the burgeoning interest in farmer cooperatives in Ethiopia is not amenable to the one-size-fits-all strategy that is rapidly evolving. Critics may argue that these findings are specific to grain-marketing coop-eratives in Ethiopia and are an exception to the general trend found in the rest of Sub-Saharan Africa. In response, we would suggest that the Ethiopian experience provides more of a model than critics might recognize. Apart from the historical similarities with other Sub-Saharan African countries—the imposition of state control over grain marketing and the manipulation of cooperatives for political ends—Ethiopia’s more recent experience suggests that large-scale investment in promoting smallholder cooperatives and com-mercialization is not without significant challenges. Nevertheless, provided that these challenges are acknowledged and ac-counted for in the design of policies and choices for investment, there is great potential for RPOs to play a central role in smallholder commercializa-tion. With this in mind, we offer the following recommendations based on the findings of this study.1. Cooperatives are not a silver bullet for removing the constraints to small-
holder commercialization. Cooperatives are beset by unique—and often intractable—challenges relating to their agenda, structure, membership, management, and governance.
2. Cooperatives are not necessarily an efficient means of targeting the poor-est of the poor. Alternative and complementary support mechanisms must be used to protect more vulnerable social groups and, over time, increase their capacity to participate effectively in cooperatives.
3. Cooperatives must be free to choose their own agendas and to develop the management and governance systems that are most appropriate to their agendas. Although external actors, such as public agencies and NGOs, may have a role to play in building cooperative members’ capacity to govern and manage their own organization, they can do irreparable harm to the organization’s future capacity to serve its members by imposing their own agenda. This issue is particularly important with respect to the imposition of nonmarketing activities on cooperatives that are formed for and dedi-cated to commercialization.
Although more theoretical and empirical work is needed to fully understand the inherent challenges and trade-offs in smallholder organization, there are lessons to be learned here for other initiatives promoting RPOs in Sub-Saharan Africa. Sovereign governments, international donors, and development prac-titioners have moved to reinstate RPOs squarely on the global development agenda. As these actors move forward with investments based on a limited
72 CHAPTER 6

number of success stories, there is a need for more robust empirical evidence of what RPOs can and cannot achieve. At present, there is little empirical data to suggest that due consideration has been given to the trade-offs inherent in grain-marketing cooperatives—a class of RPOs that is highly relevant to many small-scale, resource-poor farmers in the region. There remains a sizable knowledge gap with respect to grain-marketing cooperatives and the trade-offs inherent in their design, promotion, and impact.
CONCLUSIONS 73

References
Agrawal, A. 2001. Common property institutions and sustainable governance of resources. World Development 29 (1): 1649–1672.
Alemu, D., E. Z. Gabre-Madhin, and S. Dejene. 2006. From farmers to market and market to farmers: Characterizing smallholder commercialization in Ethiopia. Washing-ton, D.C.: International Food Policy Research Institute.
Ariga, J., T. S. Jayne, and J. Nyoro. 2006. Factors driving the growth in fertilizer consumption in Kenya, 1990–2005: Sustaining the momentum in Kenya and lessons for broader replicability in Sub-Saharan Africa. Working Paper 24. Nairobi: Egerton University, Tegemeo Institute.
Attwood, D., and B. Baviskar. 1987. Why do some co-operatives work but not others? A comparative analysis of sugar co-operatives in India. Economic and Political Weekly 22 (26): 38–45.
Banerjee, A., D. Mookherjee, K. Munshi, and D. Ray. 2001. Inequality, control rights, and rent seeking: Sugar cooperatives in Maharashtra. Journal of Political Economy 109 (1): 138–190.
Barrett, C. B. 2008. Smallholder market participation: Concepts and evidence from eastern and southern Africa. Food Policy 33: 299–317.
Barrett, C. B., and P. A. Dorosh. 1996. Nonparametric evidence from rice in Madagas-car. American Journal of Agricultural Economics 78: 656–669.
Basmann, C. 1960. On finite sample distribution of generalized classical linear identifi-ability test statistics. Journal of the American Statistical Association 55: 650–659.
Bebbington, A. 1996. Organizations and intensifications: Campesino federations, rural livelihoods and agricultural technology in the Andes and Amazonia. World Develop-ment 24 (7): 1161–1177.
Berdegue, J. 2001. Cooperating to compete: Associative peasant business firms in Chile. Wageningen: Wageningen University, Department of Social Sciences, Communication and Innovation Group.
Bernard, T., A. de Janvry, and E. Sadoulet. 2010. When does community conservatism constrain village organizations? Economic Development and Cultural Change 58 (4): 609–641.
Bernard, T., A. de Janvry, M. H. Collion, P. Rondot, and E. Sadoulet. 2008. Do village organizations make a difference in African rural development? A study for Senegal and Burkina Faso. World Development 36 (11): 2188–2204.
Bianchi, T. 2002. Leaders and intermediaries as economic development agents in pro-ducers’ associations. In Group behavior and development, ed. S. T. Heyer. Oxford: Oxford University Press.
Bosc, P.-M., J. Berthome, B. Losch, and M.-R. Mercoiret. 2003. Le grand saut des organi-sations de producteurs africains: De la protection sous tutelle à la mondialisation.
74

REFERENCES 75
In La décentralisation en Afrique de l’Ouest, entre politique et développement, ed. M. Totte, T. Dahou, and R. Billaz. Paris: Karthala.
Boughton, D., D. Mather, C. B. Barrett, R. Benfica, D. Abdula, D. Tschirley, and B. Cun-guara. 2007. Market participation by rural households in a low-income country: An asset-based approach applied to Mozambique. Faith and Economics 50: 64–101.
Bratton, M. 1986. Farmer organizations and food production in Zimbabwe. World Devel-opment 13 (3): 367–384.
Braverman, A., J. L Guasch, and M. Huppi. 1991. Promoting rural cooperatives in devel-oping countries: The case of Sub-Saharan Africa. Economics Working Paper Series 90–36. San Diego, Calif., U.S.A.: University of California at San Diego.
Byerlee, D., D. J. Spielman, D. Alemu, and M. Gautam. 2007. Policies to promote cereal intensification in Ethiopia: A review of evidence and experience. International FoodPolicy Research Institute Discussion Paper 707. Washington, D.C.: International Food Policy Research Institute.
Chamberlin, J., J. Pender, and B. Yu. 2006. Development domains for Ethiopia: Captur-ing the geographical context of smallholder development options. Development Strategy and Governance Division Dicussion Paper 43. Washington, D.C.: Inter-national Food Policy Research Institute.
Chirwa, E., A. Dorward, R. Kachule, I. Kumwenda, J. Kydd, N. Poole, C. Poulton, and M. Stockbridge. 2005. Walking tightropes: Supporting farmer organizations for market access. Natural Resource Perspective 99: 1–6.
Cochrane, W. W. 1958. Farm prices: Myth and reality. Minneapolis: University of Min-nesota Press.
Collion, M.-H., and P. Rondot. 1998. Background, discussions, and recommendations. In Agricultural producer organizations, their contribution to rural capacity building and poverty reduction, ed. P. Rondot and M.-H. Collion. Washington, D.C.: World Bank.
———. 2001. Investing in rural producers organizations, contributing to sustainable agricultural production. Washington, D.C.: World Bank.
Coulter, J. 2007. Farmer groups enterprises and the marketing of staple food com-modities in Africa. Collective Action and Property Rights Working Paper 72. Wash-ington, D.C.: International Food Policy Research Institute.
Coulter, J., A. Goodland, A. Tallontire, and R. Stringfellow. 1999. Marrying farmer cooperation and contract farming for service provision in a liberalising Sub-Saharan Africa. Natural Resource Perspective 48: 1–4.
Couture, M.-F., D. Faver, M. Levin, and A.-B. Nippierd. 2002. Transition to cooperative entrepreneurship: Case studies from Armenia, China, Ethiopia, Ghana, Poland, Russia, Uganda and Vietnam. Geneva: International Labor Office.
CSA (Central Statistical Agency). 2003. Ethiopian agricultural sample enumeration (2001/02) (1994 E.C.): Results at the country level. Addis Ababa, Ethiopia.
CSA, EDRI, and IFPRI (Central Statistical Agency, Ethiopian Development Research Insti-tute, and International Food Policy Reseach Institute). 2006. Atlas of the Ethiopian rural economy. Washington, D.C.: International Food Policy Research Institute.
Damiani, O. 2000. The state and nontraditional agricultural exports in Latin America: Results and lessons of three case studies. Washington, D.C.: Inter-American Devel-opment Bank.

76 REFERENCES
———. 2001. Organic agriculture in Costa Rica: The case of cacao and banana produc-tion in Talamanca. Rome: International Fund for Agricultural Development.
Deininger, K. 1995. Collective agriculture production: A solution for transition econo-mies? World Development 23 (8): 1317–1334.
de Janvry, A., M. Fafchamps, and E. Sadoulet. 1991. Peasant behavior with missing markets: Some paradoxes explained. Economic Journal 101: 1400–1417.
Delion, J. 2000. Producer organizations–donor partnership in project implementa-tion in Africa: Risks and precautions from a social perspective. Washington, D.C.: World Bank.
Dercon, S. 1995. On market integration and liberalization: Methods and application to Ethiopia. Journal of Development Studies 32 (1): 1317–1334.
Dessalegn, D., T. Jayne, and J. Shaffer. 1998. Market structure, conduct and perfor-mance: Constraints on performance of Ethiopian grain markets. East Lansing: Michi-gan State University.
Develtere, P., I. Pollet, and F. Wanyama, eds. 2008. Cooperating out of poverty: The renaissance of the African cooperative movement. Geneva: International Labor Office and World Bank Institute.
Donnelly-Roark, P., K. Ouedraogo, and X. Ye. 2001. Rural decentralization in Burkina Faso, local level institutions, and poverty eradication. World Bank Findings 178. Washington, D.C.: World Bank.
Dorward, A., J. Kydd, J. Morrison, and I. Urey. 2004. A policy agenda for pro-poor agricultural growth. World Development 32 (1): 73–89.
ECS (Ethiopian Cooperatives Survey). 2006. Unpublished data from a survey conducted by the Ethiopian Development Research Institute and International Food Policy Research Institute. Addis Ababa.
ESCS (Ethiopian Smallholders Commercialization Survey). 2005. Unpublished data from a survey conducted by the Ethiopian Development Research Institute, the Central Statistical Authority, and the International Food Policy Research Institute. Addis Ababa.
Fafchamps, M. 2005. Market institutions in Sub-Saharan Africa. Cambridge, Mass., U.S.A.: MIT Press.
Fafchamps, M., and R. V. Hill. 2005. Selling at the farmgate or traveling to market. American Journal of Agricultural Economics 87 (3): 717–734.
FCA (Federal Cooperative Agency). 2005. Five-year development plan. Addis Ababa, Ethiopia: Federal Cooperative Agency of Ethiopia.
FDRE (Federal Democratic Republic of Ethiopia). 1994. Agricultural Cooperative Societ-ies Proclamation No. 85/1994. Federal Negarit Gazeta. Addis Ababa, Ethiopia.
———. 1998. Establishment of Cooperative Societies Proclamation No. 147/1998. Fed-eral Negarit Gazeta. Addis Ababa, Ethiopia.
———. 2002. Ethiopia: Sustainable development and poverty reduction program. Addis Ababa, Ethiopia.
———. 2004. Cooperatives Societies (Amendment) Proclamation No. 402/2004. Federal Negarit Gazeta. Addis Ababa, Ethiopia.

REFERENCES 77
———. 2005. Plan for accelerated and sustained development to end poverty (PASDEP). Addis Ababa, Ethiopia.
Ferris, S., P. Engoru, and E. Kaganzi. 2008. Making market information services work better for the poor in Uganda. Collective Action and Property Rights Working Paper 77. Washington, D.C.: International Food Policy Research Institute.
Foster, A., and M. Rosenzweig. 2001. Democratization, decentralization, and the dis-tribution of local public goods in a poor rural economy. Penn Institute for Economic Research (PIER) Working Paper 01-056. Philadelphia: University of Pennsylvania.
Gabre-Madhin, E. Z. 2001. Market institutions, transaction costs, and social capital in the Ethiopian grain market. Washington, D.C.: International Food Policy Research Institute.
Gabre-Madhin, E. Z., C. B. Barrett, and P. Dorosh. 2003. Technological change and price effects in agriculture: Conceptual and comparative perspectives. Markets, Trade and Institutions Division Discussion Paper 62. Washington, D.C.: Inter-national Food Policy Research Institute.
Gabre-Madhin, E. Z., W. Amha, E. Tafara, J. Schluter, T. Teshome, and G. Kilkile. 2003. Getting markets right in Ethiopia: An institutional and legal analysis of grain and coffee marketing. International Fund for Agricultural Development project docu-ment. Washington, D.C.: International Food Policy Research Institute.
Gebreselassie, S. 2006. Land, land policy and smallholder agriculture in Ethiopia: Options and scenarios. Addis Ababa: Ethiopian Economic Asociation.
Goetz, S. 1992. A selectivity model of household food marketing behavior in Sub-Saharan Africa. American Journal of Agricultural Economics 74: 444–452.
Gotland, E. M., E. Sadoulet, A. de Janvry, R. Murgai, and O. Ortiz. 2004. The impact of farmer field schools on knowledge and productivity: A study of potato farmers in the Peruvian Andes. Economic Development and Cultural Change 53: 63–92.
Govereh, J., and T. S. Jayne. 2003. Cash cropping and food crop productivity: Syner-gies or trade-offs? Agricultural Economics 28 (1): 39–50.
Hazell, P., and L. Haddad. 2001. Agricultural research and poverty reduction. 2020 Vision Discussion Paper 34. Washington, D.C.: International Food Policy Research Institute.
Hazell, P., and C. Ramasamy. 1991. The Green Revolution reconsidered: The impact of high-yielding rice varieties in South India. Baltimore, Md., U.S.A.: Johns Hopkins University Press.
Heckman, J., O. Ichimura, and P. Todd. 1998. Matching as an econometric evaluation estimator. Review of Economic Studies 65: 261–294.
Heltberg, R., and F. Tarp. 2002. Agricultural supply response and poverty in Mozam-bique. Food Policy 27: 103–124.
Jalan, J., and M. Ravallion. 2003a. Estimating the benefit incidence of anti-poverty programs by propensity score matching. Journal of Business and Economic Statis-tics 21 (1): 19–30.
———. 2003b. Does piped water reduce diarrhea for children in rural India? Journal of Econometrics 112 (1): 153–173.
Jayne, T. S., and S. Jones. 1997. Food marketing and pricing policy in eastern and southern Africa: A survey. World Development 25 (9): 1505–1527.

78 REFERENCES
Jayne, T. S., A. Negassa, and R. Myers. 1998. The effect of liberalization on grain prices and marketing margins in Ethiopia. Michigan State University International Development Working Paper 68. East Lansing: Michigan State University.
Jayne, T. S., B. Zulu, and J. Nijhoff. 2006. Stabilizing food markets in eastern and southern Africa. Food Policy 31: 328–341.
Kabuga, C. 2005. Cooperative traditions in Anglophone countries. Report on essential research for a cooperative facility for Africa. Geneva: International Labor Organi-zation. Mimeo.
Key, N., E. Sadoulet, and A. de Janvry. 2000. Transaction costs and agricultural house-hold supply response. American Journal of Agricultural Economics 82: 1273–1279.
KIT and IIRR (Royal Tropical Institute and International Institute of Rural Reconstruc-tion). 2008. Trading up: Building cooperation between farmers and traders in Africa. Nairobi, Kenya.
Kodama, Y. 2007. New role of cooperatives in Ethiopia: The case of Ethiopian coffee farmers cooperatives. African Study Monographs 35 (suppl.): 87–108.
Lele, U. 1975. The design of rural development: Lessons from Africa. Baltimore, Md., U.S.A.: Johns Hopkins University Press.
———. 1981. Co-operatives and the poor: A comparative perspective. World Develop-ment 9 (1): 55–72.
Lelisa. 2000. Cooperative entrepreneurship in transition economies: The case of Ame-cha multi purpose agricultural cooperative. Addis Ababa, Ethiopia: International Labor Organization. Mimeo.
Lemma, T. 2008. Growth without structure: The cooperative movement in Ethiopia. In Cooperating out of poverty: The renaissance of the African cooperative move-ment, ed. P. Develtere, I. Pollet, and F. Wanyama. Geneva: International Labor Office and World Bank Institute.
Levinsohn, J., and M. McMillan. 2007. Does food aid harm the poor? Household evidence from Ethiopia. In Globalization and poverty, ed. A. Harrison. National Bureau of Economic Research Conference Report. Chicago: University of Chicago Press.
Malassis, L. 2000. La longue marche des paysans français. Paris: Fayard.
Markelova, H., R. Meinzen-Dick, J. Hellin, and S. Dohrn. 2008. Collective action for small-holder market access. Food Policy 34: 1–7.
Meherka, A. 2008. The role and functions of cooperatives and rural producer orga-nizations in Ethiopia. Paper presented at the workshop “Rural institutions and sustainable livelihoods” organized by the World Bank and International Food Policy Research Institute, April 10–11, Addis Ababa, Ethiopia.
Meinzen-Dick, R., A. Knox, F. Place, and B. Swallow, eds. 2002. Innovation in natural resource management. Baltimore, Md., U.S.A.: Johns Hopkins University Press.
Mercoiret, M.-R., and J.-M. Mfou’ou. 2006. Rural producers organizations for pro-poor sustainable agricultural development. Background paper for World Develop-ment Report 2008. Montpellier, France: Centre de Coopération Internationale en Recherche Agronomique pour le Développement (CIRAD).
Mercoiret, M.-R., D. Pesche, and P.-M. Bosc. 2006. Rural producer organizations (RPOs) for pro-poor sustainable development. Background paper for World Develop-

REFERENCES 79
ment Report 2008. Montpellier, France: Centre de Cooperation Internationale en Recherche Agronomique pour le Développement (CIRAD).
Minten, B., and C. Barrett. 2008. Agricultural technology, productivity, and poverty in Madagascar. World Development 36 (5): 797–822.
Narrod, C., D. Roy, J. Okello, B. Avendaño, and K. Rich. 2008. The role of public–private partnerships and collective action in ensuring smallholder participation in high value fruit and vegetable supply chains. Collective Action and Property Rights Working Paper 70. Washington, D.C.: International Food Policy Research Institute.
Negassa, A. 1998. Vertical and spatial integration of grain markets in Ethiopia: Implica-tions for grain and food security policies. Grain marketing project research project working paper. East Lansing: Michigan State University.
Negassa, A., and T. S. Jayne. 1997. The response of Ethiopian grain market to liber-alization. East Lansing: Michigan State University.
Negassa, A., and R. Myers. 2007. Estimating policy effects on spatial market efficiency: An extension to the parity bounds model. American Journal of Agricultural Econom-ics 89: 338–352.
Neven, D., T. Reardon, and R. Hopkins. 2005. Case studies of farmer linking to dynamic markets in Southern Africa: The Fort Hare Farmers Group. East Lansing: Michigan State University.
Nyoro, J., M. W. Kiiru, and T. S. Jayne. 1999. Evolution of Kenya’s maize marketing systems in the post liberalization era. Working Paper 2. Nairobi, Kenya: Egerton University, Tegemeo Institute.
Omamo, S. W., X. Diao, S. Wood, J. Chamberlin, L. You, S. Benin, U. Wood-Sichra, and A. Tatwangire. 2006. Strategic priorities for agricultural development in eastern and central Africa. Research Report 150. Washington, D.C.: International Food Policy Research Institute.
Piesse, J., D. Tobias, T. Colin, and N. Vink. 2005. The changing role of grain coopera-tives in the transition to competitive markets in South Africa. Journal of Compara-tive Economics 33: 197–218.
Poulton, C., A. Dorward, and J. Kydd. 2005. The future of small farms: New directions for services, institutions and intermediation. Paper presented at the workshop “The Future of Small Farms,” June 26–29, Wye, U.K.
Rahmato, D. 1990. Cooperatives, state farms and smallholder production. In Ethiopia: Rural development options, ed. S. Pausewang, F. Cheru, S. Brune, and E. Chole. London: Zed Books.
———. 1994a. The unquiet countryside: The collapse of “Socialism” and rural agitation, 1990 and 1991. In Ethiopia in change: Peasantry, nationalism and democracy, ed. A. Zegeye and S. Pausewang. London: British Academic Press.
———. 1994b. Land, peasants and the drive for collectivization in Ethiopia. In Land in African agrarian systems, ed. T. J. Bassett and D. E. Crummey. Madison: University of Wisconsin Press.
———. 2002. Civil society organizations in Ethiopia. In Ethiopia: The challenge of democ-racy from below, ed. B. Zewde and S. Pausewang. Stockholm: Nordiska Afrkainsti-tute and Forum for Social Studies.

80 REFERENCES
Rao, V., and A. Ibanez. 2003. The social impact of social funds in Jamaica: A mixed-methods analysis of participation, targeting, and collective action in community-driven development. Washington, D.C.: World Bank.
Rashid, S., E. Gabre-Madhin, and K. Getnet. 2007. Which commodity matters? Price dynamic implications for the Ethiopian cereal market. Washington, D.C.: Inter-national Food Policy Research Institute. Mimeo.
Renkow, M., D. G. Hallstrom, and D. D. Karanja. 2004. Rural infrastructure, trans-actions costs and market participation in Kenya. Journal of Development Econom-ics 73 (1): 349–367.
Resnick, D. 2004. Smallholder African agriculture: Progress and problems in confront-ing hunger and poverty. Development Strategy and Governance Division Discussion Paper 9. Washington, D.C.: International Food Policy Research Institute.
Rosegrant, M., and P. Hazell. 2000. Transforming the rural Asian economy: The unfinished revolution. Hong Kong: Oxford University Press.
Rosenbaum, P., and D. Rubin. 1983. The central role of propensity score in observa-tional studies for causal effects. Biometrika 70 (1): 41–55.
Sargan, J. 1958. The estimation of economic relationship using instrumental variables. Econometrica 26: 393–415.
Sarris, A., S. Savastano, and L. Christiaensen. 2006. Agriculture and poverty in commodity-dependent African countries: A rural household perspective from the United Republic of Tanzania. FAO Commodities and Trade Technical Paper 9. Rome: Food and Agricultural Organization of the United Nations.
Schultz, T. W. 1978. Politics vs. economics in food and agriculture throughout the world. In Portfolio: International economic perspective, ed. A. O. Krueger. Wash-ington, D.C.: International Communication Agency.
Sharma, V., and A. Gulati. 2003. Trade liberalization, market reforms and competi-tiveness of India’s dairy sector. Markets, Trade and Institutions Division Discussion Paper 61. Washington, D.C.: International Food Policy Research Institute.
Shiferaw, B., G. Obare, and G. Muricho. 2008. Rural market imperfections and the role of institutions in collective action to improve markets for the poor. Natural Resources Forum 32 (1): 25–38.
Sinja, J., L. Njoroge, H. Mbaya, H. Magara, E. Mwangi, I. Baltenweck, D. Romney, and A. Omore. 2006. Milk market access for smallholders: A case of informal milk trader groups in Kenya. Paper presented at the research workshop “Collective Action and Market Access for Smallholders,” October 2–6, Cali, Colombia.
Spielman, D. J., D. Byerlee, D. Alemu, and D. Kelemework. 2010. Policies to promote cereal intensification in Ethiopia: A review of evidence and experience. Food Policy 35 (3): 185–194.
Stockbridge, M., A. Dorward, and J. Kydd. 2003. Farmer organizations for market access. Briefing paper for the Crop Post-Harvest Research Programme of the Natu-ral Resources Research Programme of the UK. London: United Kingdom Depart-ment of International Development.
Streeten, P. 1987. What price food? Agricultural price policies in developing coun-tries. Washington, D.C.: Economic Development Institute of the World Bank.

REFERENCES 81
Stringfellow, R., J. Coulter, T. Lucey, C. McKone, and A. Hussain. 1997. Improving the access of smallholders to agricultural services in Sub-Saharan Africa: Farmer cooperation and the role of the donor community. Natural Resource Perspective 20: 1–10.
Taffesse, A., T. Bernard, and B. Yu. 2007. Risk, consumption preferences and produc-tion choices of Ethiopian farm households. Addis Ababa, Ethiopia: African Center for Economic and Historical Studies.
Taylor, L. 1980. Macro models for developing countries. New York: McGraw-Hill.
Tefft, J. 2004. Mali’s white revolution: Smallholder cotton from 1960 to 2003. 2020 Vision Focus Brief 12(5). Washington, D.C.: International Food Policy Research Institute.
Tendler, J. 1983. What to think about cooperatives, a guide from Bolivia. Washington, D.C.: Inter-American Foundation.
Thorp, R., F. Stewart, and A. Heyer. 2005. When and how far is group formation a route out of chronic poverty? World Development 33 (6): 907–920.
Timmer, C. P. 1988. The agricultural transformation. In Handbook of development economics, vol. 1, ed. H. Chenery and T. Srinavasan. Amsterdam: North Holland.
———. 1997. Farmers and markets: The political economy of new paradigms. American Journal of Agricultural Economics 79: 621–627.
Tschirley, D., and D. Abdula. 2007. Toward improved maize marketing and trade policies to promote household food security in central and southern Mozambique: 2007 update. Paper presented at the conference “Trade Policy for Food Products Conducive to Development in Eastern and Southern Africa,” held at the Food and Agriculture Organization of the United Nations (FAO), March, Rome.
Uphoff, N. 1993. Grassroots organizations and NGOs in rural development: Opportuni-ties with diminishing states and expanding markets. World Development 21 (4): 607–622.
Van de Walle, D., and D. Cratty. 2002. Impact evaluation of a rural road rehabilitation project. Washington, D.C.: World Bank.
Weber, M. T., J. M. Staatz, J. S. Holtzman, E. W. Crawford, and R. H. Bernsten. 1988. Informing food security decisions in Africa: Empirical analysis and policy dialogue. American Journal of Agricultural Economics 70: 1044–1052.
Weinberger, K., and J. Juttin. 2001. Determinants of participation in local develop-ment groups: Experience from group-based projects in Kashmir and Chad. Bonn: University of Bonn Center for Development Research.
World Bank. 2003. Reaching the rural poor, a renewed strategy for rural development. Washington, D.C.
———. 2006. Ethiopia: Policies for pro-poor agricultural growth. Washington, D.C.
———. 2008. World development report. Washington, D.C.

About the Authors
Tanguy Bernard is with the Research Department of the Agence Française de Développement, Paris. He was previously a research fellow in the Markets, Trade, and Institutions Division of the International Food Policy Research Institute, Washington, D.C., and was based in Addis Ababa, Ethiopia.
David J. Spielman is a research fellow in the Knowledge, Capacity, and Innovation Division of the International Food Policy Research Institute, Wash-ington, D.C., and is based in Addis Ababa, Ethiopia.
Alemayehu Seyoum Taffesse is a research fellow in the Development Strat-egy and Governance Division of the International Food Policy Research Insti-tute, Washington, D.C., and is based in Addis Ababa, Ethiopia.
Eleni Z. Gabre-Madhin is chief executive officer of the Ethiopian Commodity Exchange in Addis Ababa, Ethiopia. She was previously a senior research fel-low in the Development Strategy and Governance Division of the International Food Policy Research Institute, Washington, D.C.
82

Index
83
Page numbers for entries occurring in boxes are suffixed by b, those for entries occurring in figures by f, those for entries occurring in notes by n, and those for entries in tables by t.
Activities of rural producer organizations: credit provision, 15, 22b, 23b, 53, 57; direct beneficiaries of, 55, 55t; of Ethiopian cooperatives, 21, 22b, 23b, 26, 53–57, 54t; indirect beneficiaries of, 55t, 56–57; input provision services, 53, 55, 56, 56n; marketing performance and, 63–66, 69; marketing-related, 53, 54t, 58–60, 64; membership size and, 60–66, 63t, 65; nonmarketing-related, 53, 54t, 71; output purchases by, 57; scale economies in, 2, 51, 55; social, 10–11, 26, 62–63, 63t, 65, 71; social acceptability motives for, 10n, 53, 56; storage, 23b; variety of, 6, 10, 66, 69
Addis Ababa market, 59Agricultural cooperatives, in industrialized
countries, 3. See also Cooperatives; Rural producer organizations
Amecha Area Multipurpose Cooperative, 22–23bAmhara region: cooperative participation in,
20t; growth of cooperatives in, 19f; number of cooperatives in, 20t; surveys of, 12; treatment and comparison kebeles in, 32t
Asia, rural producer organizations in, 4Awara Cooperative, 23–24b
Bernard, T., 10BoARDs. See Bureaus of Agriculture and Rural
DevelopmentBoCP. See Bureau of Cooperative PromotionBolivia, rural producer organizations in, 55Bureau of Cooperative Promotion (BoCP),
17–19, 23b, 24bBureaus of Agriculture and Rural Development
(BoARDs), 18–19, 23bBurkina Faso, rural producer organizations in,
10, 56
CBOs. See Community-based organizationsCentral Statistical Agency of Ethiopia, 12Cereals. See FoodgrainsChirwa, E., 9
Collective action: costs of, 10; role of, 8, 70–71
Colombia, National Federation of Coffee Growers, 4
Commercialization. See Smallholder commercialization
Community-based organizations (CBOs), 17Cooperatives: credit, 14, 15, 17, 21; in
industrialized countries, 3. See also Ethiopian cooperatives; Rural producer organizations
Coordination costs: of Ethiopian cooperatives, 51, 60–62; membership heterogeneity and, 60–62; of rural producer organizations, 10, 11
Costs: cooperative fees and share prices, 22b, 23–24b, 51–53, 52t; coordination, 10, 11, 51, 60–62; transaction, 8, 9, 10, 14
Credit cooperatives, 14, 15, 17, 21Credit provision by grain-marketing
cooperatives, 15, 22b, 23b, 53, 57
Decisionmaking. See GovernanceDerg regime, 15–16, 22b, 48Development domains, 30–32, 31t
Economies of scale: in input supply, 55; in marketing, 2, 51
ECS. See Ethiopian Cooperatives SurveyEDRI. See Ethiopian Development Research
InstituteEducation levels: of committee members, 68;
of heads of households, 44, 49. See also Literacy
Efficiency-equity trade-offs, 7ESCS. See Ethiopian Smallholders
Commercialization SurveyEthiopia: agriculture in, 13–14; Derg regime
of, 15–16, 22b, 48; grain market integration in, 29; imperial era in, 15; land allocation system of, 44n; regions of, 12, 34f. See also Government of Ethiopia

Ethiopian cooperatives: administrative structures for promotion of, 17–19, 18f; characteristics of, 21, 26, 26t; coffee, 6; constraints of, 23b, 24b; coordination costs of, 51, 60–62; under Derg regime, 15–16, 16t, 22b, 48; examples of, 22–24b; external supporters of, 16–17, 24b, 26, 28–29, 65; fees and share prices of, 22b, 23–24b, 51–53, 52t; governance of, 16, 66–68; history of, 14–16; household participation in, 20t, 21, 35, 36t, 48–53, 50t; lessons learned from, 72–73; marketing performance of, 58–60, 59t, 61t, 63–66, 64t, 68–69, 69t; member satisfaction with, 59–60; membership criteria of, 51–53, 52t, 66, 71; membership policies of, 22b, 23–24b; membership rates of, 20t, 21; membership sizes of, 21, 26t, 60, 62–64; as model, 72; number of, 19–21, 19f, 20t; promotion of, 14; research data and methods, 11–12; self-exclusion of households from, 24b, 48–51, 49t; smallholder participation in, 20t, 21; social acceptance motives of, 53; specialization by, 58–59; spillover effects of, 53–57; types of, 21, 25t; unions of, 19, 24b. See also Activities; Smallholder commercialization, effects of cooperatives
Ethiopian Cooperatives Survey (ECS), 12Ethiopian Development Research Institute
(EDRI), 12Ethiopian Smallholders Commercialization
Survey (ESCS), 11–12European Union, agricultural cooperatives
in, 3Externalities. See Spillover effects
Farmers’ organizations. See Rural producer organizations
Federal Cooperatives Agency (FCA), 17, 29, 65, 66
Foodgrains: Ethiopian cultivation of, 13; income elasticity of consumption of, 47; markets for, 29; prices of, 14, 39; production locations of, 35; smallholder commercialization of, 2, 3t; subsistence production of, 13. See also Grain-marketing cooperatives
Food staples: rural producer organizations involved in, 6; smallholder commercialization of, 2, 3t
GoE. See Government of EthiopiaGovernance: decisionmaking, 66–67, 68f,
71–72; of Ethiopian cooperatives, 16, 66–68;
membership, marketing performance, and, 68, 69t; quality of, 68; of rural producer organizations, 11, 71–72
Government of Ethiopia (GoE): administrative decentralization by, 17n; economic growth strategy of, 12–13; poverty-reduction strategy of, 16–17; support of cooperatives, 14, 16–17, 26, 28–29. See also Federal Cooperatives Agency
Grain-marketing cooperatives: in Ethiopia, 21, 26, 26t, 58–59; marketing performance of, 58, 59t; research on, 6–7; specialization by, 58–59. See also Ethiopian cooperatives
Grains. See Foodgrains
Heyer, A., 9Households: assets of, 49, 51; benefits of
RPOs for, 9; cooperative participation rates of, 20t, 21; determinants of cooperative participation by, 35, 36t, 48–53, 50t; education levels of heads of, 44, 49; landholdings of, 44, 47, 49–51; matching techniques for, 28, 34–39, 35t, 38t; nonobservable characteristics of, 27, 28; observable characteristics of, 27, 28, 35, 43–44, 45t; production levels of, 48–51; propensity scores of, 28, 34–35, 36, 37f; selection bias and, 27; self-exclusion from cooperative membership by, 24b, 48–51, 49t. See also Poor households
IFPRI. See International Food Policy Research Institute
India, rural producer organizations in, 4International Cooperative Alliance, 66International Food Policy Research Institute
(IFPRI), 11–12
Kebeles (peasant associations), Ethiopia: cooperative promotion efforts of, 18–19; cooperatives in, 19–21, 19f; definition, 12n; geographic locations of sample, 34, 34f; matching techniques for, 28, 30–34, 31t; treatment and comparison, 30–34, 31t, 32t, 33t, 34f
Kenya, rural producer organizations in, 4, 6, 6t, 7t
Landholdings: average in Ethiopia, 21, 26; of cooperative members, 53; Ethiopian system of, 44n; of households, 44, 47, 49–51
Latin America, rural producer organizations in, 4
84 INDEX

Literacy: of committee members, 68; of cooperative members and nonmembers, 49, 49–51n. See also Education levels
Marketing activities: capacity of cooperatives, 59, 66, 69, 71; of Ethiopian cooperatives, 22b, 23b, 53, 54t, 58–60, 59t; performance of, 58–60, 59t, 61t, 63–66, 64t, 68–69, 69t
Markets, integration of, 29. See also Prices
National Federation of Coffee Growers, Colombia, 4
Natural resources management, 4Nongovernmental organizations (NGOs), 17,
28, 43, 72
Oromia region: cooperative participation in, 20t; growth of cooperatives in, 19f; number of cooperatives in, 20t; surveys of, 12; treatment and comparison kebeles in, 32, 32t
Participatory decisionmaking, 66–67, 68fPeasant associations. See KebelesPoor households: constraints on cooperative
membership by, 57; food consumption by, 47; rural producer organization participants, 9–10; spillover benefits of cooperatives for, 57, 71. See also Households
Poverty, chronic, 9Prices: collecting information on, 14, 23b,
56, 59; consumption effects of, 47; impact of cooperatives, 39, 40, 41–43, 42t, 56–57, 70–71
Producers’ associations. See Rural producer organizations
Propensity scores, 28, 34–35, 36, 37fPublic goods. See Spillover effects
Rural producer organizations (RPOs): benefits of, 2, 3; changes in 1990s, 6; coordination costs of, 10, 11, 51; failures of, 4; future roles of, 72; governance of, 11, 71–72; history in Sub-Saharan Africa, 4–7; household gains from, 9; in industrialized countries, 3; interest in, 2, 70, 72; membership criteria of, 6, 9–10, 11; membership heterogeneity in, 60–62; membership numbers of, 6, 6t, 7t; natural resources management by, 4; number of, 6, 6t, 7t; poor household participation in, 9–10; research on, 6–7; spillover effects of, 10, 27–28, 53, 71; successes, 6; trade-
offs in, 72–73; traditional, 14–15, 15t; transaction costs of, 10. See also Activities; Cooperatives
Savings and credit associations, 14, 15, 17, 21
Scale economies. See Economies of scaleSenegal, rural producer organizations in, 6t,
7t, 10Services. See ActivitiesSmallholder commercialization: factors in,
8; of food staples, 2, 3t; promotion in Ethiopia, 13–14; in Sub-Saharan Africa, 1–2; transaction costs of, 8; welfare and, 1
Smallholder commercialization, effects of cooperatives: average impact of, 39–44, 42t; heterogeneous impact of, 44–47, 45t, 46f; household characteristics and, 43–44, 45t; identification strategy, 27–29; matching techniques for, 28–29, 30–39; member satisfaction with, 59–60; price impact of, 39, 40, 47, 70–71; selection bias and, 27; share of output marketed, 40, 41, 44–46, 71
Smallholders in Ethiopia: cooperative membership of, 20t, 21, 26; foodgrain production by, 13; reasons for not joining cooperatives, 24b, 48–51, 49t. See also Households
SNNP. See Southern Nations, Nationalities, and Peoples regional state
Social activities, 10–11, 26, 62–63, 63t, 65, 71Southern Nations, Nationalities, and Peoples
regional state (SNNP): cooperative participation in, 20t, 21; growth of cooperatives in, 19f; number of cooperatives in, 20t; surveys of, 12; treatment and comparison kebeles in, 32, 32t
Spillover effects: benefits, 10, 53, 55t, 56–57, 71; of Ethiopian cooperatives, 53–57; of rural producer organizations, 10, 27–28, 53, 71
Staple crops. See Food staplesStewart, F., 9
Tendler, J., 55Thorp, R., 9Tigray region: cooperative participation in,
20t; growth of cooperatives in, 19f, 21; number of cooperatives in, 20t; surveys of, 12; treatment and comparison kebeles in, 32, 32t
Traditional institutions, 14–15, 15t
INDEX 85

Transaction costs: in Ethiopia, 14; reducing, 8, 9; of rural producer organizations, 10; of smallholder commercialization, 8
Unions, cooperative, 19, 24bUnited States, agricultural cooperatives in, 3
Woredas (districts), cooperative promotion efforts of, 17–18, 22b, 23b, 24b, 28–29
World Bank, 7
Zimbabwe, rural producer organizations in, 5
86 INDEX

Rural producer organizations (RPOs), such as farmers’ organizations or rural co-operatives, offer a means for smallholder farmers in developing countries to sell their crops commercially. RPOs hold particular promise for Sub-Saharan Africa,
where small-scale farming is the primary livelihood but commercialization of foodcrops is very limited. Using the experience of smallholders in Ethiopia as a case study, this research monograph identifies the benefits of RPOs for small farmers, as well as the conditions under which such organizations most successfully promote smallholder com-mercialization. The evidence from Ethiopia indicates that RPOs do increase farmers’ profits from crop sales, but that the beneficiaries do not tend to be the poorest small-holders. Moreover, an RPO’s marketing effectiveness is precarious: it can easily diminish if the number or diversity of its members increases or if it provides more nonmarketing services. The authors conclude that RPOs have a role to play in the agricultural develop-ment of Sub-Saharan Africa, but that role should be complemented by other programs that directly target the poorest farmers. Further, the effectiveness of RPOs should be preserved by allowing them to follow their own agendas rather than being encouraged to take on nonmarketing activities. The assessment of RPOs presented in this mono-graph should be a valuable resource for policymakers and researchers concerned with economic development and poverty reduction in Sub-Saharan Africa.
2033 K Street, NW • Washington, DC 20006-1002 USATel.: +1.202.862.5600 • Skype: ifprihomeofficeFax: +1.202.467.4439 • [email protected]
www.ifpri.org
Tanguy Bernard is with the Research De-partment of the Agence Française de Dével-oppement, Paris. He was previously a research fellow in the Markets, Trade, and Institutions Division of the International Food Policy Re-search Institute, Washington, D.C., and was based in Addis Ababa, Ethiopia.
David J. Spielman is a research fellow in the Knowledge, Capacity, and Innovation Division of the International Food Policy Research In-stitute, Washington, D.C., and is based in Addis Ababa, Ethiopia.
Alemayehu Seyoum Taffesse is a research fel-low in the Development Strategy and Governance Division of the International Food Policy Research Institute, Washington, D.C., and is based in Addis Ababa, Ethiopia.
Eleni Z. Gabre-Madhin is chief executive of-ficer of the Ethiopian Commodity Exchange in Addis Ababa, Ethiopia. She was previously a senior research fellow in the Development Strategy and Governance Division of the International Food Policy Research Institute, Washington, D.C.
Related Documents