Original Article Proc IMechE Part D: J Automobile Engineering 226(10) 1289–1302 Ó IMechE 2012 Reprints and permissions: sagepub.co.uk/journalsPermissions.nav DOI: 10.1177/0954407012441884 pid.sagepub.com Cooperative control of regenerative braking and hydraulic braking of an electrified passenger car Junzhi Zhang, Chen Lv, Jinfang Gou and Decong Kong Abstract With the aims of regeneration efficiency and brake comfort, three different control strategies, namely the maximum- regeneration-efficiency strategy, the good-pedal-feel strategy and the coordination strategy for regenerative braking of an electrified passenger car are researched in this paper. The models of the main components related to the regenerative brake and the frictional blending brake of the electric passenger car are built in MATLAB/Simulink. The control effects and regeneration efficiencies of the control strategies in a typical deceleration process are simulated and analysed. Road tests under normal deceleration braking and an ECE driving cycle are carried out. The simulation and road test results show that the maximum-regeneration-efficiency strategy, which causes issues on brake comfort and safety, could hardly be utilized in the regenerative braking system adopted. The good-pedal-feel strategy and coordination strategy are advantageous over the first strategy with respect to the brake comfort and regeneration efficiency. The fuel economy enhanced by the regenerative braking system developed is more than 25% under the ECE driving cycle. Keywords Regenerative braking, cooperative control, brake comfort, regeneration efficiency, electrified passenger car, road test Date received: 6 December 2011; accepted: 17 February 2012 Introduction As one of the key technologies of electrified vehicles, regenerative braking, which has been applied in various types of electric vehicle (EV), hybrid electric vehicle (HEV) and plug-in hybrid electric vehicle, results in an effective improvement in the fuel economy by recuper- ating the braking energy. 1 All road vehicles, including electrified vehicles, should be equipped with a frictional brake system to guarantee the vehicle’s deceleration performance. Thus, for electrified vehicles, coordination of the regenerative brake and the frictional brake is crucial for brake com- fort and brake safety as well as for regeneration effi- ciency. Based on those issues above, a series of solutions in regenerative braking system design and control have been carried out. In the system design of the regenerative brake sys- tem, automakers and parts manufacturers worldwide have proposed several implementations, which can be categorized into two types. 1. One type is based on the brake pressure modulator. The regenerative braking system which has been applied in the Toyota Prius is based on an electric hydraulic brake system. 2 TRW’s solution which has been employed in commercialized hybrid vehi- cles is based on an electric stability control system. 3 2. The other type is based on an improved master cylinder. Honda adopted a new master cylinder which has been employed in the Civic Hybrid. 4 Continental Teves 5 and Hyundai 6 have also devel- oped this type of regenerative braking system. In regenerative braking control, present research mainly concentrates on two different braking scenarios. One is the normal deceleration process, with the aims of improving the regeneration efficiency and the coordi- nated control effect between the regenerative brake and the frictional brake. Gao 7 and Gao et al. 8 put forward two regenerative braking strategies. However, neither of the two strategies can achieve good brake stability State Key Laboratory of Automotive Safety and Energy, Tsinghua University, People’s Republic of China Corresponding author: Junzhi Zhang, State Key Laboratory of Automotive Safety and Energy, Tsinghua University, Beijing 100084, People’s Republic of China. Email: [email protected] by guest on September 12, 2016 pid.sagepub.com Downloaded from

Welcome message from author
This document is posted to help you gain knowledge. Please leave a comment to let me know what you think about it! Share it to your friends and learn new things together.
Transcript
Original Article
Proc IMechE Part D:J Automobile Engineering226(10) 1289–1302� IMechE 2012Reprints and permissions:sagepub.co.uk/journalsPermissions.navDOI: 10.1177/0954407012441884pid.sagepub.com
Cooperative control of regenerativebraking and hydraulic braking of anelectrified passenger car
Junzhi Zhang, Chen Lv, Jinfang Gou and Decong Kong
AbstractWith the aims of regeneration efficiency and brake comfort, three different control strategies, namely the maximum-regeneration-efficiency strategy, the good-pedal-feel strategy and the coordination strategy for regenerative braking ofan electrified passenger car are researched in this paper. The models of the main components related to the regenerativebrake and the frictional blending brake of the electric passenger car are built in MATLAB/Simulink. The control effectsand regeneration efficiencies of the control strategies in a typical deceleration process are simulated and analysed. Roadtests under normal deceleration braking and an ECE driving cycle are carried out. The simulation and road test resultsshow that the maximum-regeneration-efficiency strategy, which causes issues on brake comfort and safety, could hardlybe utilized in the regenerative braking system adopted. The good-pedal-feel strategy and coordination strategy areadvantageous over the first strategy with respect to the brake comfort and regeneration efficiency. The fuel economyenhanced by the regenerative braking system developed is more than 25% under the ECE driving cycle.
KeywordsRegenerative braking, cooperative control, brake comfort, regeneration efficiency, electrified passenger car, road test
Date received: 6 December 2011; accepted: 17 February 2012
Introduction
As one of the key technologies of electrified vehicles,regenerative braking, which has been applied in varioustypes of electric vehicle (EV), hybrid electric vehicle(HEV) and plug-in hybrid electric vehicle, results in aneffective improvement in the fuel economy by recuper-ating the braking energy.1
All road vehicles, including electrified vehicles,should be equipped with a frictional brake system toguarantee the vehicle’s deceleration performance. Thus,for electrified vehicles, coordination of the regenerativebrake and the frictional brake is crucial for brake com-fort and brake safety as well as for regeneration effi-ciency. Based on those issues above, a series ofsolutions in regenerative braking system design andcontrol have been carried out.
In the system design of the regenerative brake sys-tem, automakers and parts manufacturers worldwidehave proposed several implementations, which can becategorized into two types.
1. One type is based on the brake pressure modulator.The regenerative braking system which has beenapplied in the Toyota Prius is based on an electric
hydraulic brake system.2 TRW’s solution whichhas been employed in commercialized hybrid vehi-cles is based on an electric stability control system.3
2. The other type is based on an improved mastercylinder. Honda adopted a new master cylinderwhich has been employed in the Civic Hybrid.4
Continental Teves5 and Hyundai6 have also devel-oped this type of regenerative braking system.
In regenerative braking control, present researchmainly concentrates on two different braking scenarios.One is the normal deceleration process, with the aims ofimproving the regeneration efficiency and the coordi-nated control effect between the regenerative brake andthe frictional brake. Gao7 and Gao et al.8 put forwardtwo regenerative braking strategies. However, neitherof the two strategies can achieve good brake stability
State Key Laboratory of Automotive Safety and Energy, Tsinghua
University, People’s Republic of China
Corresponding author:
Junzhi Zhang, State Key Laboratory of Automotive Safety and Energy,
Tsinghua University, Beijing 100084, People’s Republic of China.
Email: [email protected]
by guest on September 12, 2016pid.sagepub.comDownloaded from
and high regenerative brake efficiency simultaneouslyin various driving conditions. Aoki et al.9 used thesliding-mode control method, modulating the hydraulicbraking force to obtain the maximum regeneration effi-ciency and good brake comfort. Targeting the brakeintention of the driver and the regeneration efficiencyand adopting the optimum control strategy, Luo et al.10
designed a distribution model of the regenerative brakeand the frictional brake. The other focus is the emer-gency braking process. Taking advantage of the quickresponse and accurate control of the motor torque,researchers worldwide have explored a way to introducethe motor torque into anti-lock brake system (ABS)control, expecting a better control effect. Tur andUstun,11 Okano et al.,12 Chu et al.13 and others havecarried out research studies in this field. Nevertheless,the existing research on regenerative braking control ismainly in the stage of simulation and bench tests; aroad test study has rarely been seen.
The present authors have made much effort over along time to research and develop regenerative braking.A regenerative braking system based on a pneumaticABS has been developed and applied in three fuel cellcity buses serving in Beijing;14 another regenerative brak-ing system for an electrified passenger car based on anelectronic stability program (ESP) modulator has beenproposed and hardware-in-the-loop (HIL) tested.15
Integrated and optimized control strategies for regenera-tive braking with a pneumatic ABS during emergencybraking have been proposed and HIL tested.16,17 Furtherstudy on regenerative braking technology is ongoing foran electrified passenger car with a hydraulic braking sys-tem. Distinguished from other technologies and studiescited above, comprehensive research on a combinationof system design and control was carried out, and fueleconomy enhancement by regenerative braking under adriving cycle was measured and is reported in this article.With the aims of brake comfort and regeneration effi-ciency, three different cooperative control strategies,namely the maximum-regeneration-efficiency strategy(control strategy 1), the good-pedal-feel strategy (controlstrategy 2) and the coordination strategy (control strategy3), were researched. The vehicle, the motor, the batteryand the hydraulic brake system were modelled for simu-lating typical deceleration processes in order to verify thecontrol effects and the regeneration efficiencies. A real-time brake controller was developed and applied in ademonstration electric vehicle with the regenerative brak-ing system developed on the basis of the ESP modulator.Road tests under normal deceleration braking and anECE driving cycle were carried out. Some simulationand road test results are presented in this article.
Regenerative braking control strategy
Hydraulic brake system with regenerative braking
As mentioned in the introduction, a new type of regen-erative braking system for an electrified passenger car
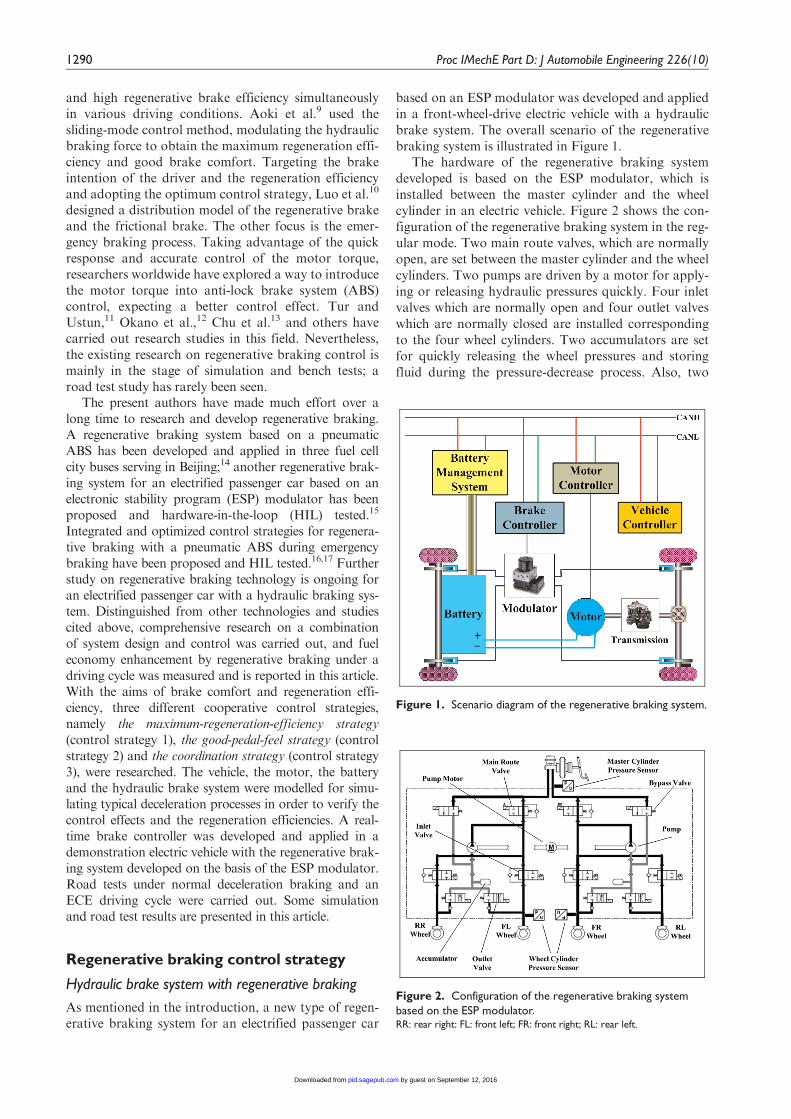
based on an ESP modulator was developed and appliedin a front-wheel-drive electric vehicle with a hydraulicbrake system. The overall scenario of the regenerativebraking system is illustrated in Figure 1.
The hardware of the regenerative braking systemdeveloped is based on the ESP modulator, which isinstalled between the master cylinder and the wheelcylinder in an electric vehicle. Figure 2 shows the con-figuration of the regenerative braking system in the reg-ular mode. Two main route valves, which are normallyopen, are set between the master cylinder and the wheelcylinders. Two pumps are driven by a motor for apply-ing or releasing hydraulic pressures quickly. Four inletvalves which are normally open and four outlet valveswhich are normally closed are installed correspondingto the four wheel cylinders. Two accumulators are setfor quickly releasing the wheel pressures and storingfluid during the pressure-decrease process. Also, two
Figure 1. Scenario diagram of the regenerative braking system.
Figure 2. Configuration of the regenerative braking systembased on the ESP modulator.RR: rear right: FL: front left; FR: front right; RL: rear left.
1290 Proc IMechE Part D: J Automobile Engineering 226(10)
by guest on September 12, 2016pid.sagepub.comDownloaded from
bypass valves installed in the ESP modulator, whichare normally closed, are not utilized in the regenerationmode. Three pressure sensors monitoring the mastercylinder pressure and two front-wheel pressures areinstalled respectively.
With the integrated hardware mentioned previouslyand the software for regenerative braking to be intro-duced, the regenerative braking system featuring a fric-tional brake, a regenerative brake and an anti-lockbrake is developed.
Regenerative braking control strategy
The regenerative braking control strategy is crucial tothe regeneration efficiency and braking performance ofthe vehicle.
For the blending brake system which coordinatesthe frictional brake with the regenerative brake, consis-tent modulation of the frictional brake pressure maycause fluctuation in the master cylinder pressure, wor-sening the brake pedal feel and even causing the driverto panic. Many of the regenerative braking systemsapplied in commercialized vehicles are equipped with abrake pedal stroke simulator, which decouples thebrake pedal force with the wheel cylinder pressure; thisavoids the problems mentioned above but will increasethe manufacturing cost and the complexity of thesystem.
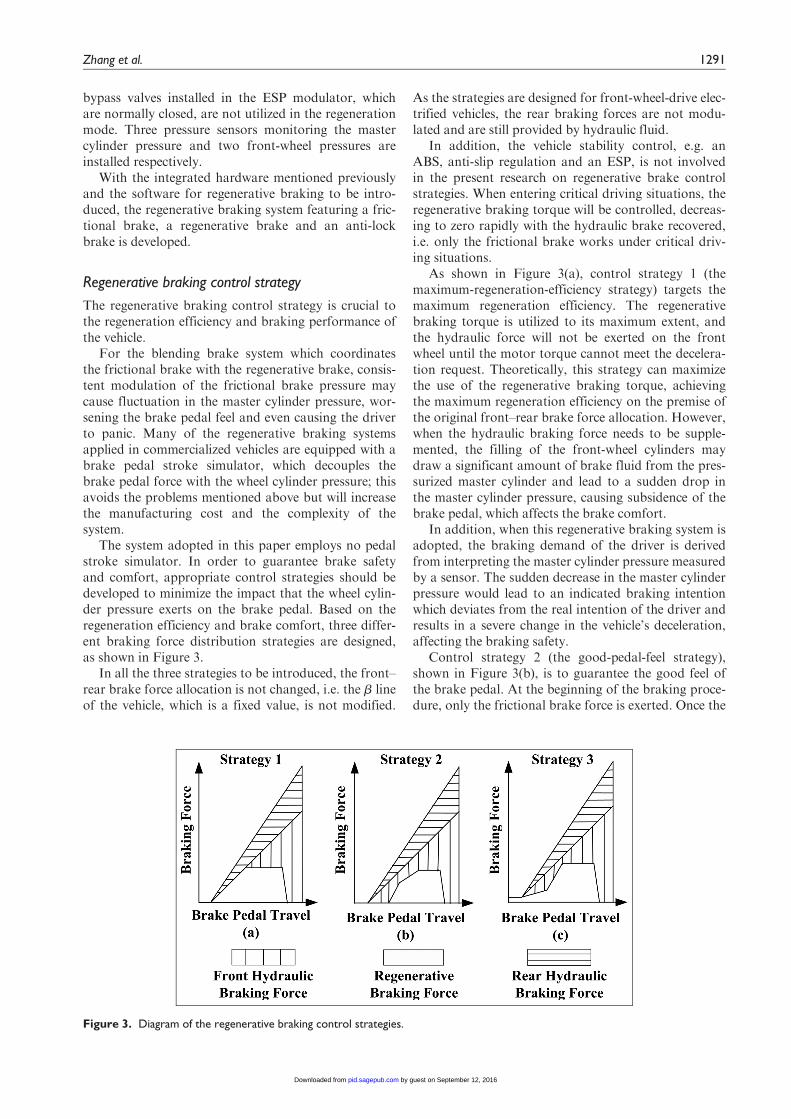
The system adopted in this paper employs no pedalstroke simulator. In order to guarantee brake safetyand comfort, appropriate control strategies should bedeveloped to minimize the impact that the wheel cylin-der pressure exerts on the brake pedal. Based on theregeneration efficiency and brake comfort, three differ-ent braking force distribution strategies are designed,as shown in Figure 3.
In all the three strategies to be introduced, the front–rear brake force allocation is not changed, i.e. the b lineof the vehicle, which is a fixed value, is not modified.
As the strategies are designed for front-wheel-drive elec-trified vehicles, the rear braking forces are not modu-lated and are still provided by hydraulic fluid.
In addition, the vehicle stability control, e.g. anABS, anti-slip regulation and an ESP, is not involvedin the present research on regenerative brake controlstrategies. When entering critical driving situations, theregenerative braking torque will be controlled, decreas-ing to zero rapidly with the hydraulic brake recovered,i.e. only the frictional brake works under critical driv-ing situations.
As shown in Figure 3(a), control strategy 1 (themaximum-regeneration-efficiency strategy) targets themaximum regeneration efficiency. The regenerativebraking torque is utilized to its maximum extent, andthe hydraulic force will not be exerted on the frontwheel until the motor torque cannot meet the decelera-tion request. Theoretically, this strategy can maximizethe use of the regenerative braking torque, achievingthe maximum regeneration efficiency on the premise ofthe original front–rear brake force allocation. However,when the hydraulic braking force needs to be supple-mented, the filling of the front-wheel cylinders maydraw a significant amount of brake fluid from the pres-surized master cylinder and lead to a sudden drop inthe master cylinder pressure, causing subsidence of thebrake pedal, which affects the brake comfort.
In addition, when this regenerative braking system isadopted, the braking demand of the driver is derivedfrom interpreting the master cylinder pressure measuredby a sensor. The sudden decrease in the master cylinderpressure would lead to an indicated braking intentionwhich deviates from the real intention of the driver andresults in a severe change in the vehicle’s deceleration,affecting the braking safety.
Control strategy 2 (the good-pedal-feel strategy),shown in Figure 3(b), is to guarantee the good feel ofthe brake pedal. At the beginning of the braking proce-dure, only the frictional brake force is exerted. Once the
Figure 3. Diagram of the regenerative braking control strategies.
Zhang et al. 1291
by guest on September 12, 2016pid.sagepub.comDownloaded from
front-wheel pressures tend to be stable, the regenerativebraking torque would be exerted. Meanwhile, the frontinlet valves would be closed and the hydraulic fluid ofthe front wheels would be extracted and stored in theaccumulator. When the hydraulic braking force needsto be supplemented, the fluid stored in the accumulatorwill be pumped into the wheel cylinder through the inletvalve with the main route valves turned off and themain cylinder insulated from the wheel cylinder toincrease the wheel cylinder pressure. Thus the mastercylinder pressure would not fluctuate while the wheelcylinder pressure changes. The stability of the pedal feeland indicated driver braking intention are guaranteedat the cost of the regeneration efficiency by exerting ahydraulic braking force at the beginning of the brakingprocedure.
As shown in Figure 3(c), control strategy 3 (coordi-nation strategy) is a combination of the former twostrategies which coordinates the regenerative efficiencywith the brake pedal feel. Within the free travel of thebrake pedal, a slight motor braking torque is exerted onthe front axle to imitate the engine brake of the conven-tional internal combustion engine (ICE) vehicle. Onceentering the operational travel of the brake pedal, thefront-wheel cylinder pressure is increased under controlslowly, providing part of the overall brake request, whilethe regenerative braking torque supplies the remainingbraking request. After the braking pressure reaches acertain threshold, the regenerative braking torque is uti-lized to its maximum extent, the front inlet valves will beclosed and the excessive fluid of the front-wheel cylinderwill be extracted to the accumulator. When the fronthydraulic brake needs to be supplemented, the fluidstored in accumulator will be pumped into the front-wheel cylinders. Therefore, a good brake pedal feel, astability of the indicated braking intention and a rela-tively high regeneration efficiency are all obtained.
Hydraulic pressure control algorithm
The modulating effect of the hydraulic pressure influ-ences the regeneration efficiency, the brake comfort andthe brake safety simultaneously. Thus, for regenerativebraking, the hydraulic pressure control algorithm is ofgreat importance.
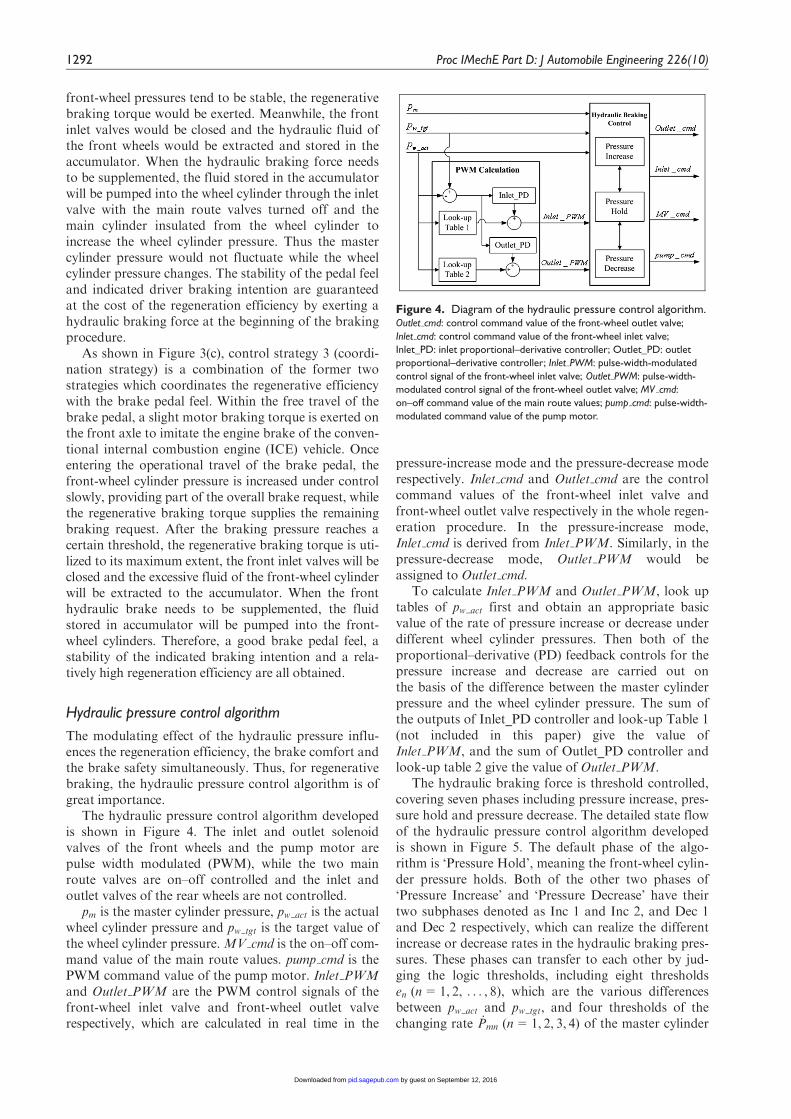
The hydraulic pressure control algorithm developedis shown in Figure 4. The inlet and outlet solenoidvalves of the front wheels and the pump motor arepulse width modulated (PWM), while the two mainroute valves are on–off controlled and the inlet andoutlet valves of the rear wheels are not controlled.
pm is the master cylinder pressure, pw act is the actualwheel cylinder pressure and pw tgt is the target value ofthe wheel cylinder pressure. MV cmd is the on–off com-mand value of the main route values. pump cmd is thePWM command value of the pump motor. Inlet PWMand Outlet PWM are the PWM control signals of thefront-wheel inlet valve and front-wheel outlet valverespectively, which are calculated in real time in the
pressure-increase mode and the pressure-decrease moderespectively. Inlet cmd and Outlet cmd are the controlcommand values of the front-wheel inlet valve andfront-wheel outlet valve respectively in the whole regen-eration procedure. In the pressure-increase mode,Inlet cmd is derived from Inlet PWM. Similarly, in thepressure-decrease mode, Outlet PWM would beassigned to Outlet cmd.
To calculate Inlet PWM and Outlet PWM, look uptables of pw act first and obtain an appropriate basicvalue of the rate of pressure increase or decrease underdifferent wheel cylinder pressures. Then both of theproportional–derivative (PD) feedback controls for thepressure increase and decrease are carried out onthe basis of the difference between the master cylinderpressure and the wheel cylinder pressure. The sum ofthe outputs of Inlet_PD controller and look-up Table 1(not included in this paper) give the value ofInlet PWM, and the sum of Outlet_PD controller andlook-up table 2 give the value of Outlet PWM.
The hydraulic braking force is threshold controlled,covering seven phases including pressure increase, pres-sure hold and pressure decrease. The detailed state flowof the hydraulic pressure control algorithm developedis shown in Figure 5. The default phase of the algo-rithm is ‘Pressure Hold’, meaning the front-wheel cylin-der pressure holds. Both of the other two phases of‘Pressure Increase’ and ‘Pressure Decrease’ have theirtwo subphases denoted as Inc 1 and Inc 2, and Dec 1and Dec 2 respectively, which can realize the differentincrease or decrease rates in the hydraulic braking pres-sures. These phases can transfer to each other by jud-ging the logic thresholds, including eight thresholdsen (n=1, 2, . . . , 8), which are the various differencesbetween pw act and pw tgt, and four thresholds of thechanging rate _Pmn (n=1, 2, 3, 4) of the master cylinder
Figure 4. Diagram of the hydraulic pressure control algorithm.Outlet cmd: control command value of the front-wheel outlet valve;
Inlet cmd: control command value of the front-wheel inlet valve;
Inlet_PD: inlet proportional–derivative controller; Outlet_PD: outlet
proportional–derivative controller; Inlet PWM: pulse-width-modulated
control signal of the front-wheel inlet valve; Outlet PWM: pulse-width-
modulated control signal of the front-wheel outlet valve; MV cmd:
on–off command value of the main route values; pump cmd: pulse-width-
modulated command value of the pump motor.
1292 Proc IMechE Part D: J Automobile Engineering 226(10)
by guest on September 12, 2016pid.sagepub.comDownloaded from
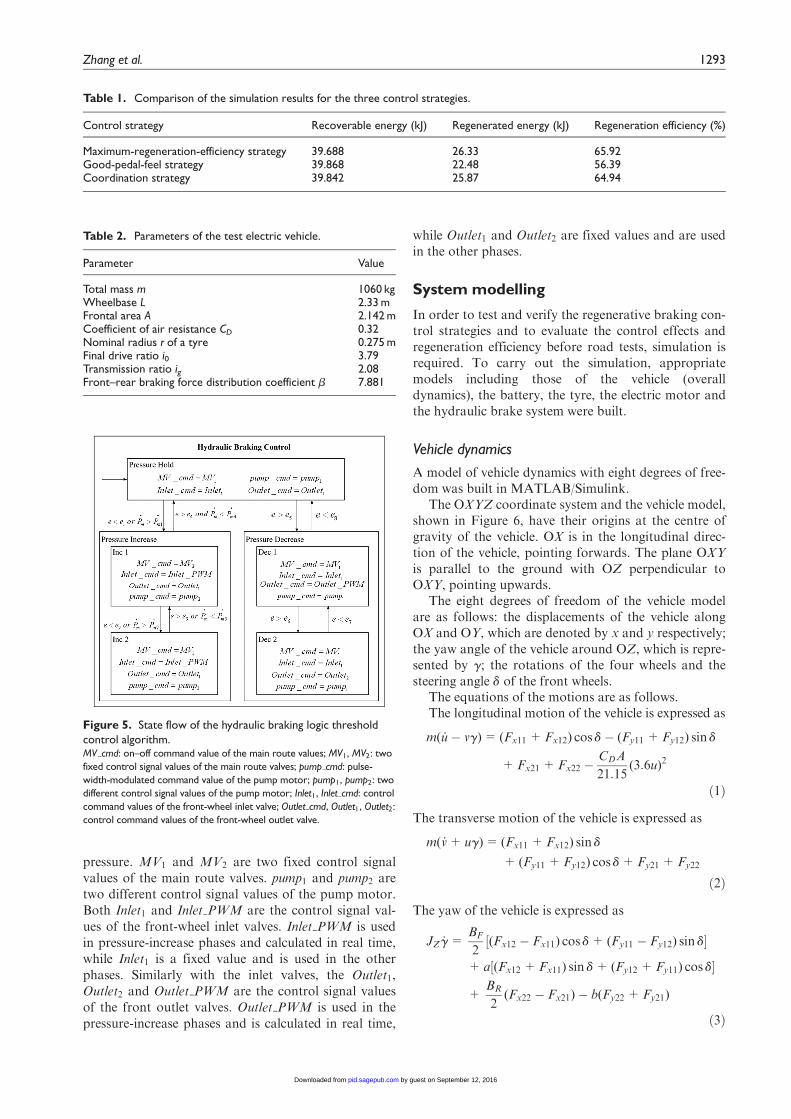
pressure. MV1 and MV2 are two fixed control signalvalues of the main route valves. pump1 and pump2 aretwo different control signal values of the pump motor.Both Inlet1 and Inlet PWM are the control signal val-ues of the front-wheel inlet valves. Inlet PWM is usedin pressure-increase phases and calculated in real time,while Inlet1 is a fixed value and is used in the otherphases. Similarly with the inlet valves, the Outlet1,Outlet2 and Outlet PWM are the control signal valuesof the front outlet valves. Outlet PWM is used in thepressure-increase phases and is calculated in real time,
while Outlet1 and Outlet2 are fixed values and are usedin the other phases.
System modelling
In order to test and verify the regenerative braking con-trol strategies and to evaluate the control effects andregeneration efficiency before road tests, simulation isrequired. To carry out the simulation, appropriatemodels including those of the vehicle (overalldynamics), the battery, the tyre, the electric motor andthe hydraulic brake system were built.
Vehicle dynamics
A model of vehicle dynamics with eight degrees of free-dom was built in MATLAB/Simulink.
The OXYZ coordinate system and the vehicle model,shown in Figure 6, have their origins at the centre ofgravity of the vehicle. OX is in the longitudinal direc-tion of the vehicle, pointing forwards. The plane OXYis parallel to the ground with OZ perpendicular toOXY, pointing upwards.
The eight degrees of freedom of the vehicle modelare as follows: the displacements of the vehicle alongOX and OY, which are denoted by x and y respectively;the yaw angle of the vehicle around OZ, which is repre-sented by g; the rotations of the four wheels and thesteering angle d of the front wheels.
The equations of the motions are as follows.The longitudinal motion of the vehicle is expressed as
m( _u� vg)= (Fx11 +Fx12) cos d� (Fy11 +Fy12) sin d
+Fx21 +Fx22 �CDA
21:15(3:6u)2
ð1Þ
The transverse motion of the vehicle is expressed as
m( _v+ ug)= (Fx11 +Fx12) sin d
+(Fy11 +Fy12) cos d+Fy21 +Fy22
ð2Þ
The yaw of the vehicle is expressed as
JZ _g =BF
2½(Fx12 � Fx11) cos d+(Fy11 � Fy12) sin d�
+ a½(Fx12 +Fx11) sin d+(Fy12 +Fy11) cos d�
+BR
2(Fx22 � Fx21)� b(Fy22 +Fy21)
ð3Þ
Figure 5. State flow of the hydraulic braking logic thresholdcontrol algorithm.MV cmd: on–off command value of the main route values; MV1, MV2: two
fixed control signal values of the main route valves; pump cmd: pulse-
width-modulated command value of the pump motor; pump1, pump2: two
different control signal values of the pump motor; Inlet1, Inlet cmd: control
command values of the front-wheel inlet valve; Outlet cmd, Outlet1, Outlet2:
control command values of the front-wheel outlet valve.
Table 1. Comparison of the simulation results for the three control strategies.
Control strategy Recoverable energy (kJ) Regenerated energy (kJ) Regeneration efficiency (%)
Maximum-regeneration-efficiency strategy 39.688 26.33 65.92Good-pedal-feel strategy 39.868 22.48 56.39Coordination strategy 39.842 25.87 64.94
Table 2. Parameters of the test electric vehicle.
Parameter Value
Total mass m 1060 kgWheelbase L 2.33 mFrontal area A 2.142 mCoefficient of air resistance CD 0.32Nominal radius r of a tyre 0.275 mFinal drive ratio i0 3.79Transmission ratio ig 2.08Front–rear braking force distribution coefficient b 7.881
Zhang et al. 1293
by guest on September 12, 2016pid.sagepub.comDownloaded from

The motion of the tyre of a drive wheel can beexpressed as
(Jw+12Jpt) _vij=Tdij�Tbij+Fxijr (i=1, j=1,2) ð4Þ
The motion of the tyre of an idle wheel can be repre-sented as
Jw _vij = � Tbij+ fFzijr (i=2, j=1, 2) ð5Þ
In the equations above, m is the overall mass of thevehicle, u is the velocity along OX and v is the velocityalong OY. Fxij is the tangential force of the wheel ij, Fyij
is the transverse force of the wheel ij, Fzij is the verticalforce of the wheel ij, where ij=11 for the front leftwheel, ij=12 for the front right wheel, ij=21 for therear left wheel and ij=22 for the rear right wheel. CD
is the coefficient of the air resistance, A is the frontalarea and JZ is the moment of inertia of the vehicle inthe OZ direction. a is the longitudinal distance from thecentre of gravity of the vehicle to the front axle, b is thelongitudinal distance from the centre of gravity of thevehicle to the rear axle and L is the wheelbase; thus,a+ b=L. BF and BR are the widths of the front trackand the rear track respectively, Jw is the moment ofinertia of tyre, Jpt is the moment of inertia of the power-train which is shared by the two drive wheels, vij is therotational speed of the wheel, r is the nominal radius of
the tyre and Tdij and Tbij are the driving and brakingtorques respectively exerted on the wheel.
The tyre
The tyre model, which is of great importance forresearch on braking, should be able to simulate the realtyre in both adhesion and sliding. There have been vari-ous theories developed to estimate the tyre–road force.In this article, the ‘magic formula’ model is adopted.18
In the single condition, the tyre’s longitudinal forcecan be expressed as
Fx0 =D sin½C arctan (Bf)� ð6Þ
where D is the peak factor, C is the shape factor and Bis the stiffness factor which are obtained from theequations
f=(1� E)sx +E
Barctan (Bsx)
D= a1F2z + a2Fz
C=1:65
B=a3F
2z + a4Fz
CDea5Fz
E= a6F2z + a7Fz + a8 ð7Þ
In the single condition, the tyre’s lateral force can beexpressed as
Fy0 =D sin½C arctan (Bf)�+DSv ð8Þ
where Sv is the shifting value. The factors in equation(8) are obtained from
f=(1� E)(a+DSh)+E
Barctan½B(a+DSh)�
D= a1F2z + a2Fz
C=1:30
B=a3 sin½a4 arctan (a5Fz)�
CD(1� a12juj)
E= a6F2z + a7Fz + a8
DSh = a9u
DSv =(a10F2z + a11Fz)u ð9Þ
where u is the camber angle of the wheel.In the combined condition, restricted by the friction
circle which is the comprehensive limit both longitudin-ally and laterally, the longitudinal force and the lateralforce can be represented as
Fx =dx
dFx0 ð10Þ
and
Fy =dy
dFy0 ð11Þ
respectively where d, dx and dy can be calculated fromthe equations
Figure 6. Diagram of the OXYZ coordinate system and thevehicle model.
1294 Proc IMechE Part D: J Automobile Engineering 226(10)
by guest on September 12, 2016pid.sagepub.comDownloaded from
d=ffiffiffiffiffiffiffiffiffiffiffiffiffiffiffiffid2x + d2
y
q
dx =jsxj
1+ jsxj, dy = � j tanaj
1+ jsxjð12Þ
The slip angle a and longitudinal slip ratio sx of the tyrecan be expressed as
aij = arctanvyij
vxij
� �(i, j=1, 2)
sxij=vijr� vxij
max (vijr, vxij)(i, j=1, 2) ð13Þ
where vxij and vyij can be obtained from the equations
b1 = arctanBF
2a
� �, l1 =
ffiffiffiffiffiffiffiffiffiffiffiffiffiffiffiffiffiffiffiffiffiffiffiffiffiffiBF
2
� �2
+ a2
s
b2 = arctanBR
2b
� �, l2 =
ffiffiffiffiffiffiffiffiffiffiffiffiffiffiffiffiffiffiffiffiffiffiffiffiffiffiBR
2
� �2
+ b2
s
vx11 = u cos d+ v sin d� l1g sin (b1 � d)
vy11 = v cos d� u sin d+ l1g cos (b1 � d)
vx12 = u cos d+ v sin d+ l1g sin (b1 + d)
vy12 = v cos d� u sin d+ l1g cos (b1 + d)
vx21 = u� l2g sinb2, vy21 = v� l2g cosb2
vx22 = u+ l2g sinb2, vy22 = v� l2g cosb2 ð14Þ
The vertical loads on the tyres can be expressed as
Fz11 =0:5mgb
L� 0:5m _uh
L� 0:5mh( _v+ ug)
BF
Fz12 =0:5mgb
L� 0:5m _uh
L+
0:5mh( _v+ ug)
BF
Fz21 =0:5mga
L+
0:5m _uh
L� 0:5mh( _v+ ug)
BR
Fz22 =0:5mga
L+
0:5m _uh
L+
0:5mh( _v+ ug)
BR
ð15Þ
Electric motor
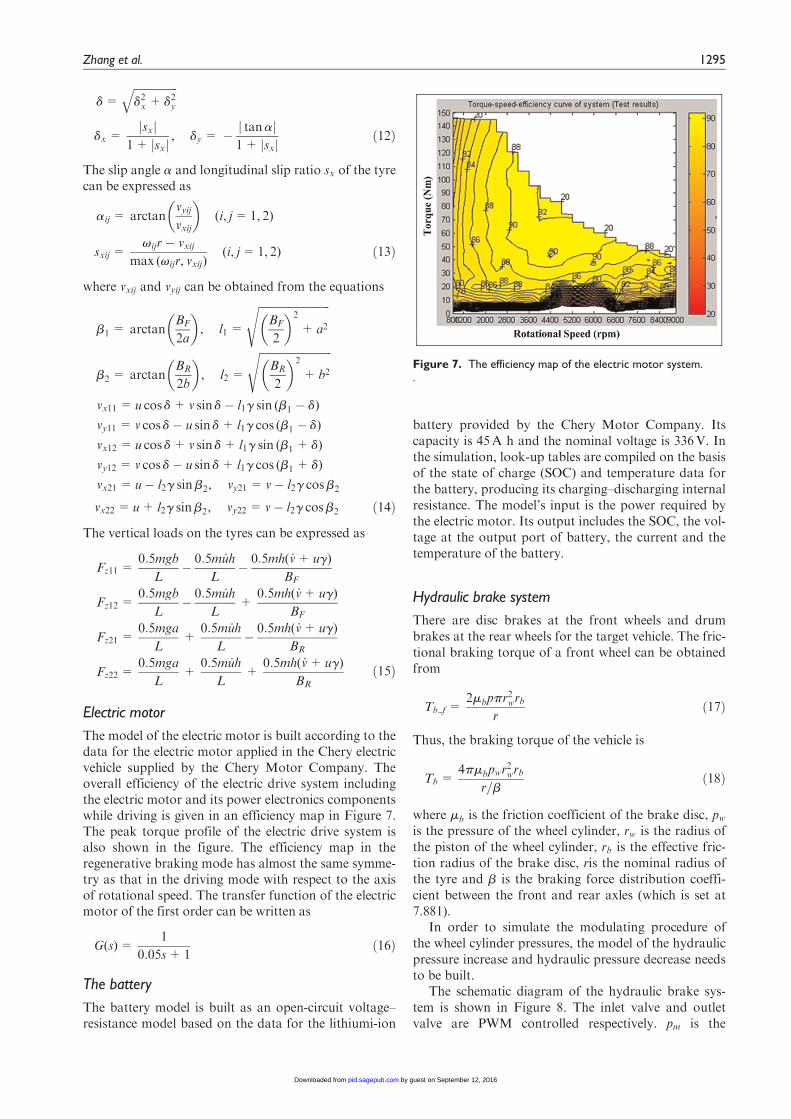
The model of the electric motor is built according to thedata for the electric motor applied in the Chery electricvehicle supplied by the Chery Motor Company. Theoverall efficiency of the electric drive system includingthe electric motor and its power electronics componentswhile driving is given in an efficiency map in Figure 7.The peak torque profile of the electric drive system isalso shown in the figure. The efficiency map in theregenerative braking mode has almost the same symme-try as that in the driving mode with respect to the axisof rotational speed. The transfer function of the electricmotor of the first order can be written as
G(s)=1
0:05s+1ð16Þ
The battery
The battery model is built as an open-circuit voltage–resistance model based on the data for the lithiumi-ion
battery provided by the Chery Motor Company. Itscapacity is 45A h and the nominal voltage is 336V. Inthe simulation, look-up tables are compiled on the basisof the state of charge (SOC) and temperature data forthe battery, producing its charging–discharging internalresistance. The model’s input is the power required bythe electric motor. Its output includes the SOC, the vol-tage at the output port of battery, the current and thetemperature of the battery.
Hydraulic brake system
There are disc brakes at the front wheels and drumbrakes at the rear wheels for the target vehicle. The fric-tional braking torque of a front wheel can be obtainedfrom
Tb f =2mbppr2wrb
rð17Þ
Thus, the braking torque of the vehicle is
Tb =4pmbpwr
2wrb
r=bð18Þ
where mb is the friction coefficient of the brake disc, pwis the pressure of the wheel cylinder, rw is the radius ofthe piston of the wheel cylinder, rb is the effective fric-tion radius of the brake disc, ris the nominal radius ofthe tyre and b is the braking force distribution coeffi-cient between the front and rear axles (which is set at7.881).
In order to simulate the modulating procedure ofthe wheel cylinder pressures, the model of the hydraulicpressure increase and hydraulic pressure decrease needsto be built.
The schematic diagram of the hydraulic brake sys-tem is shown in Figure 8. The inlet valve and outletvalve are PWM controlled respectively. pm is the
Figure 7. The efficiency map of the electric motor system..
Zhang et al. 1295
by guest on September 12, 2016pid.sagepub.comDownloaded from
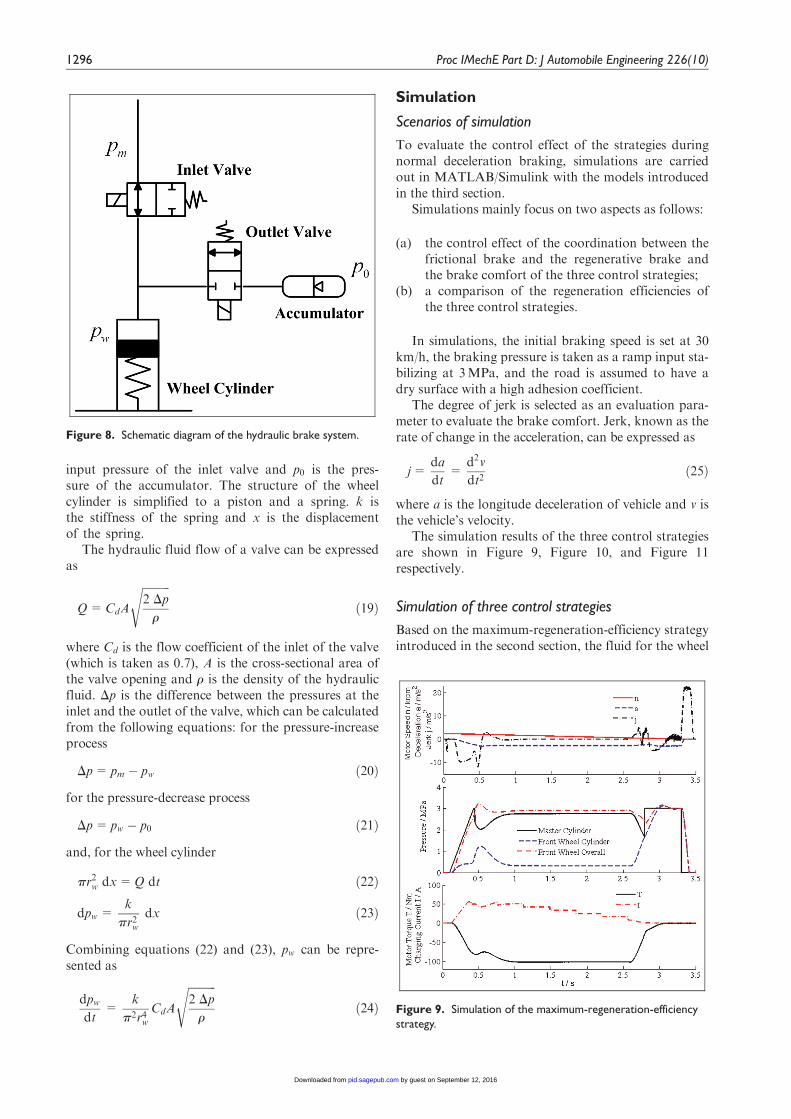
input pressure of the inlet valve and p0 is the pres-sure of the accumulator. The structure of the wheelcylinder is simplified to a piston and a spring. k isthe stiffness of the spring and x is the displacementof the spring.
The hydraulic fluid flow of a valve can be expressedas
Q=CdA
ffiffiffiffiffiffiffiffiffiffi2 Dp
r
sð19Þ
where Cd is the flow coefficient of the inlet of the valve(which is taken as 0.7), A is the cross-sectional area ofthe valve opening and r is the density of the hydraulicfluid. Dp is the difference between the pressures at theinlet and the outlet of the valve, which can be calculatedfrom the following equations: for the pressure-increaseprocess
Dp= pm � pw ð20Þ
for the pressure-decrease process
Dp= pw � p0 ð21Þ
and, for the wheel cylinder
pr2w dx=Q dt ð22Þ
dpw =k
pr2wdx ð23Þ
Combining equations (22) and (23), pw can be repre-sented as
dpwdt
=k
p2r4wCdA
ffiffiffiffiffiffiffiffiffiffi2 Dp
r
sð24Þ
Simulation
Scenarios of simulation
To evaluate the control effect of the strategies duringnormal deceleration braking, simulations are carriedout in MATLAB/Simulink with the models introducedin the third section.
Simulations mainly focus on two aspects as follows:
(a) the control effect of the coordination between thefrictional brake and the regenerative brake andthe brake comfort of the three control strategies;
(b) a comparison of the regeneration efficiencies ofthe three control strategies.
In simulations, the initial braking speed is set at 30km/h, the braking pressure is taken as a ramp input sta-bilizing at 3MPa, and the road is assumed to have adry surface with a high adhesion coefficient.
The degree of jerk is selected as an evaluation para-meter to evaluate the brake comfort. Jerk, known as therate of change in the acceleration, can be expressed as
j=da
dt=
d2v
dt2ð25Þ
where a is the longitude deceleration of vehicle and v isthe vehicle’s velocity.
The simulation results of the three control strategiesare shown in Figure 9, Figure 10, and Figure 11respectively.
Simulation of three control strategies
Based on the maximum-regeneration-efficiency strategyintroduced in the second section, the fluid for the wheel
Figure 9. Simulation of the maximum-regeneration-efficiencystrategy.
Figure 8. Schematic diagram of the hydraulic brake system.
1296 Proc IMechE Part D: J Automobile Engineering 226(10)
by guest on September 12, 2016pid.sagepub.comDownloaded from
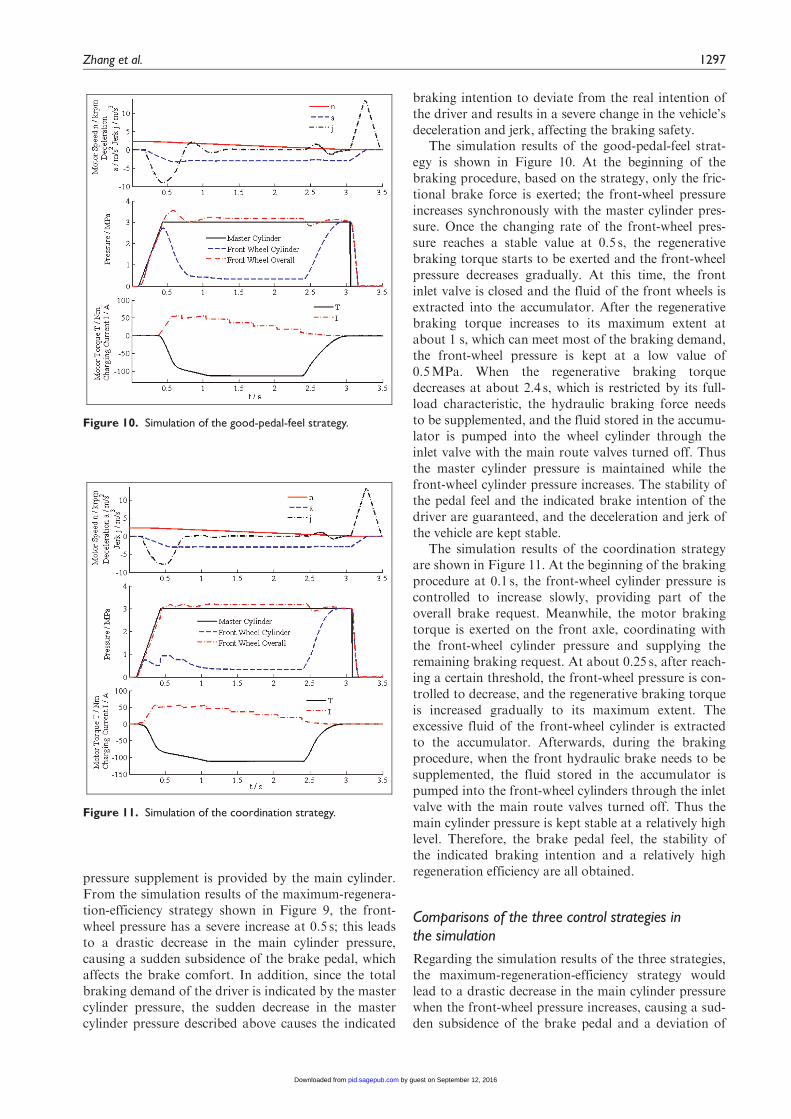
pressure supplement is provided by the main cylinder.From the simulation results of the maximum-regenera-tion-efficiency strategy shown in Figure 9, the front-wheel pressure has a severe increase at 0.5 s; this leadsto a drastic decrease in the main cylinder pressure,causing a sudden subsidence of the brake pedal, whichaffects the brake comfort. In addition, since the totalbraking demand of the driver is indicated by the mastercylinder pressure, the sudden decrease in the mastercylinder pressure described above causes the indicated
braking intention to deviate from the real intention ofthe driver and results in a severe change in the vehicle’sdeceleration and jerk, affecting the braking safety.
The simulation results of the good-pedal-feel strat-egy is shown in Figure 10. At the beginning of thebraking procedure, based on the strategy, only the fric-tional brake force is exerted; the front-wheel pressureincreases synchronously with the master cylinder pres-sure. Once the changing rate of the front-wheel pres-sure reaches a stable value at 0.5 s, the regenerativebraking torque starts to be exerted and the front-wheelpressure decreases gradually. At this time, the frontinlet valve is closed and the fluid of the front wheels isextracted into the accumulator. After the regenerativebraking torque increases to its maximum extent atabout 1 s, which can meet most of the braking demand,the front-wheel pressure is kept at a low value of0.5MPa. When the regenerative braking torquedecreases at about 2.4 s, which is restricted by its full-load characteristic, the hydraulic braking force needsto be supplemented, and the fluid stored in the accumu-lator is pumped into the wheel cylinder through theinlet valve with the main route valves turned off. Thusthe master cylinder pressure is maintained while thefront-wheel cylinder pressure increases. The stability ofthe pedal feel and the indicated brake intention of thedriver are guaranteed, and the deceleration and jerk ofthe vehicle are kept stable.
The simulation results of the coordination strategyare shown in Figure 11. At the beginning of the brakingprocedure at 0.1 s, the front-wheel cylinder pressure iscontrolled to increase slowly, providing part of theoverall brake request. Meanwhile, the motor brakingtorque is exerted on the front axle, coordinating withthe front-wheel cylinder pressure and supplying theremaining braking request. At about 0.25 s, after reach-ing a certain threshold, the front-wheel pressure is con-trolled to decrease, and the regenerative braking torqueis increased gradually to its maximum extent. Theexcessive fluid of the front-wheel cylinder is extractedto the accumulator. Afterwards, during the brakingprocedure, when the front hydraulic brake needs to besupplemented, the fluid stored in the accumulator ispumped into the front-wheel cylinders through the inletvalve with the main route valves turned off. Thus themain cylinder pressure is kept stable at a relatively highlevel. Therefore, the brake pedal feel, the stability ofthe indicated braking intention and a relatively highregeneration efficiency are all obtained.
Comparisons of the three control strategies inthe simulation
Regarding the simulation results of the three strategies,the maximum-regeneration-efficiency strategy wouldlead to a drastic decrease in the main cylinder pressurewhen the front-wheel pressure increases, causing a sud-den subsidence of the brake pedal and a deviation of
Figure 11. Simulation of the coordination strategy.
Figure 10. Simulation of the good-pedal-feel strategy.
Zhang et al. 1297
by guest on September 12, 2016pid.sagepub.comDownloaded from
the indicated brake demand, which would affect thebrake comfort and brake safety. However, the good-pedal-feel and coordination strategies are more advan-tageous in their cooperative control effects between theregenerative and the frictional brakes than themaximum-regeneration-efficiency strategy is. The wheelcylinder pressures are modulated gradually and accu-rately; a relatively stable master cylinder pressure isguaranteed, indicating that a good brake pedal feel andindicated brake intention can be obtained. In addition,the overall brake forces of the front wheel combiningthe regenerative and the frictional brakes in these twostrategies remain consistent with the change in the mas-ter cylinder pressure; this demonstrates the validity andfeasibility of the hydraulic braking control algorithm.
In order to evaluate the regeneration capabilities ofthe three control strategies, an evaluation parameter ofregeneration braking efficiency hreg is adopted accord-ing to
hreg =Ereg
EBK3100% ð26Þ
where Ereg is the energy regenerated by the electricmotor during regenerative braking and EBK is the maxi-mum value of the recoverable energy, i.e. the kineticenergy left after subtracting all the energy that wouldbe dissipated by the road drag and the air resistance.
The regenerated energy is expressed by
Ereg =
ðt1t0
UI dt ð27Þ
and the recoverable energy by
EBK =1
2mv2 �
ðt1t0
fmgv dt�ðt1t0
CDA
21:15(3:6v)2v dt
ð28Þ
where t0 is the initial braking time, t1 is the final brak-ing time, U is the output voltage of battery pack, I isthe charging current of battery, m is the total mass ofvehicle, f is the coefficient of rolling resistance (taken asequal to 0.012), CD is the coefficient of air resistanceand A is the frontal area of the vehicle.
The simulation results of the regenerative brakingefficiency are shown in Table 1. Comparing the simu-lation results, the regeneration efficiency of themaximum-regeneration-efficiency strategy is the high-est, followed by the coordination strategy, and then thegood-pedal-feel strategy.
Road tests
To study further the influences of the regenerative brak-ing on the vehicle braking performance and the fueleconomy enhancement, road tests under both normaldeceleration braking and the ECE driving cycle are car-ried out.
Test vehicle
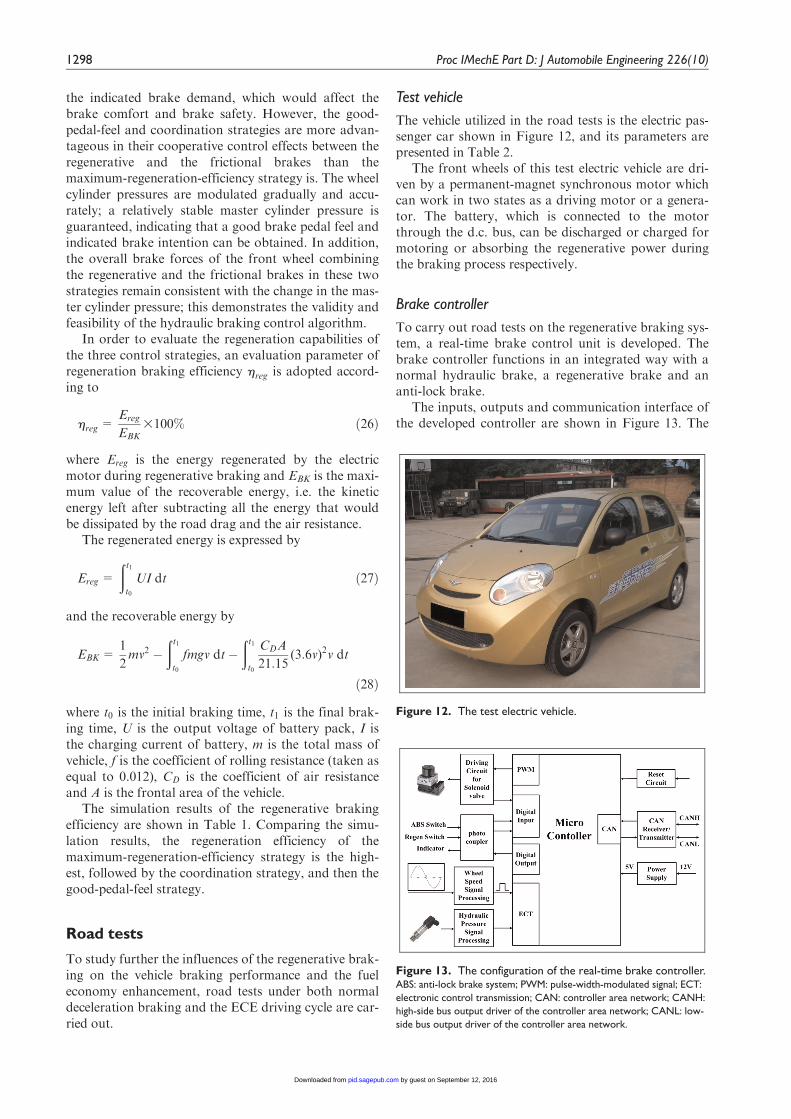
The vehicle utilized in the road tests is the electric pas-senger car shown in Figure 12, and its parameters arepresented in Table 2.
The front wheels of this test electric vehicle are dri-ven by a permanent-magnet synchronous motor whichcan work in two states as a driving motor or a genera-tor. The battery, which is connected to the motorthrough the d.c. bus, can be discharged or charged formotoring or absorbing the regenerative power duringthe braking process respectively.
Brake controller
To carry out road tests on the regenerative braking sys-tem, a real-time brake control unit is developed. Thebrake controller functions in an integrated way with anormal hydraulic brake, a regenerative brake and ananti-lock brake.
The inputs, outputs and communication interface ofthe developed controller are shown in Figure 13. The
Figure 13. The configuration of the real-time brake controller.ABS: anti-lock brake system; PWM: pulse-width-modulated signal; ECT:
electronic control transmission; CAN: controller area network; CANH:
high-side bus output driver of the controller area network; CANL: low-
side bus output driver of the controller area network.
Figure 12. The test electric vehicle.
1298 Proc IMechE Part D: J Automobile Engineering 226(10)
by guest on September 12, 2016pid.sagepub.comDownloaded from
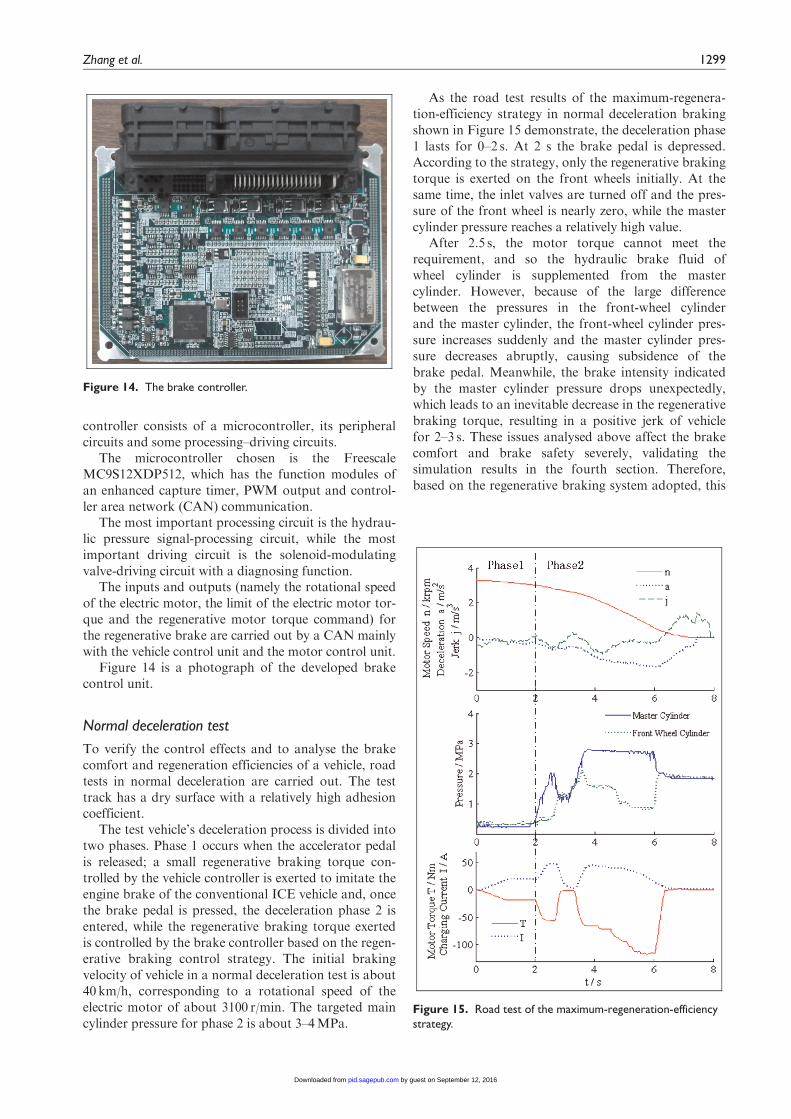
controller consists of a microcontroller, its peripheralcircuits and some processing–driving circuits.
The microcontroller chosen is the FreescaleMC9S12XDP512, which has the function modules ofan enhanced capture timer, PWM output and control-ler area network (CAN) communication.
The most important processing circuit is the hydrau-lic pressure signal-processing circuit, while the mostimportant driving circuit is the solenoid-modulatingvalve-driving circuit with a diagnosing function.
The inputs and outputs (namely the rotational speedof the electric motor, the limit of the electric motor tor-que and the regenerative motor torque command) forthe regenerative brake are carried out by a CAN mainlywith the vehicle control unit and the motor control unit.
Figure 14 is a photograph of the developed brakecontrol unit.
Normal deceleration test
To verify the control effects and to analyse the brakecomfort and regeneration efficiencies of a vehicle, roadtests in normal deceleration are carried out. The testtrack has a dry surface with a relatively high adhesioncoefficient.
The test vehicle’s deceleration process is divided intotwo phases. Phase 1 occurs when the accelerator pedalis released; a small regenerative braking torque con-trolled by the vehicle controller is exerted to imitate theengine brake of the conventional ICE vehicle and, oncethe brake pedal is pressed, the deceleration phase 2 isentered, while the regenerative braking torque exertedis controlled by the brake controller based on the regen-erative braking control strategy. The initial brakingvelocity of vehicle in a normal deceleration test is about40 km/h, corresponding to a rotational speed of theelectric motor of about 3100 r/min. The targeted maincylinder pressure for phase 2 is about 3–4MPa.
As the road test results of the maximum-regenera-tion-efficiency strategy in normal deceleration brakingshown in Figure 15 demonstrate, the deceleration phase1 lasts for 0–2 s. At 2 s the brake pedal is depressed.According to the strategy, only the regenerative brakingtorque is exerted on the front wheels initially. At thesame time, the inlet valves are turned off and the pres-sure of the front wheel is nearly zero, while the mastercylinder pressure reaches a relatively high value.
After 2.5 s, the motor torque cannot meet therequirement, and so the hydraulic brake fluid ofwheel cylinder is supplemented from the mastercylinder. However, because of the large differencebetween the pressures in the front-wheel cylinderand the master cylinder, the front-wheel cylinder pres-sure increases suddenly and the master cylinder pres-sure decreases abruptly, causing subsidence of thebrake pedal. Meanwhile, the brake intensity indicatedby the master cylinder pressure drops unexpectedly,which leads to an inevitable decrease in the regenerativebraking torque, resulting in a positive jerk of vehiclefor 2–3 s. These issues analysed above affect the brakecomfort and brake safety severely, validating thesimulation results in the fourth section. Therefore,based on the regenerative braking system adopted, this
Figure 15. Road test of the maximum-regeneration-efficiencystrategy.
Figure 14. The brake controller.
Zhang et al. 1299
by guest on September 12, 2016pid.sagepub.comDownloaded from
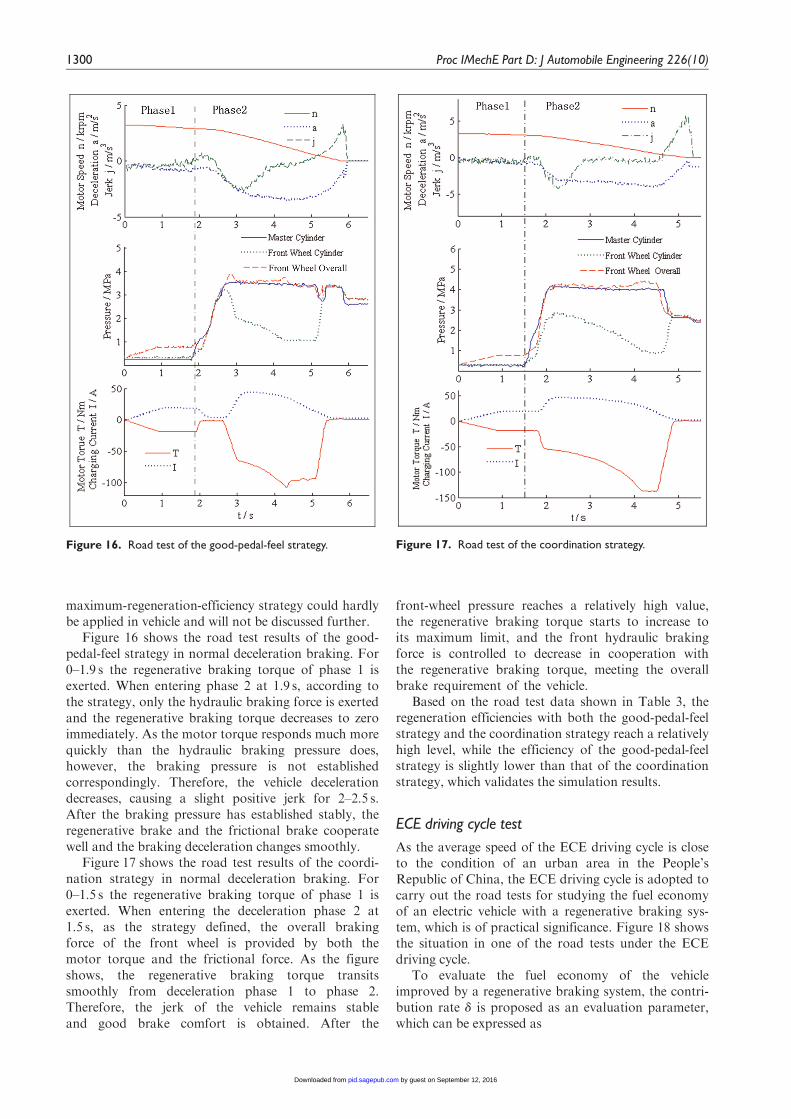
maximum-regeneration-efficiency strategy could hardlybe applied in vehicle and will not be discussed further.
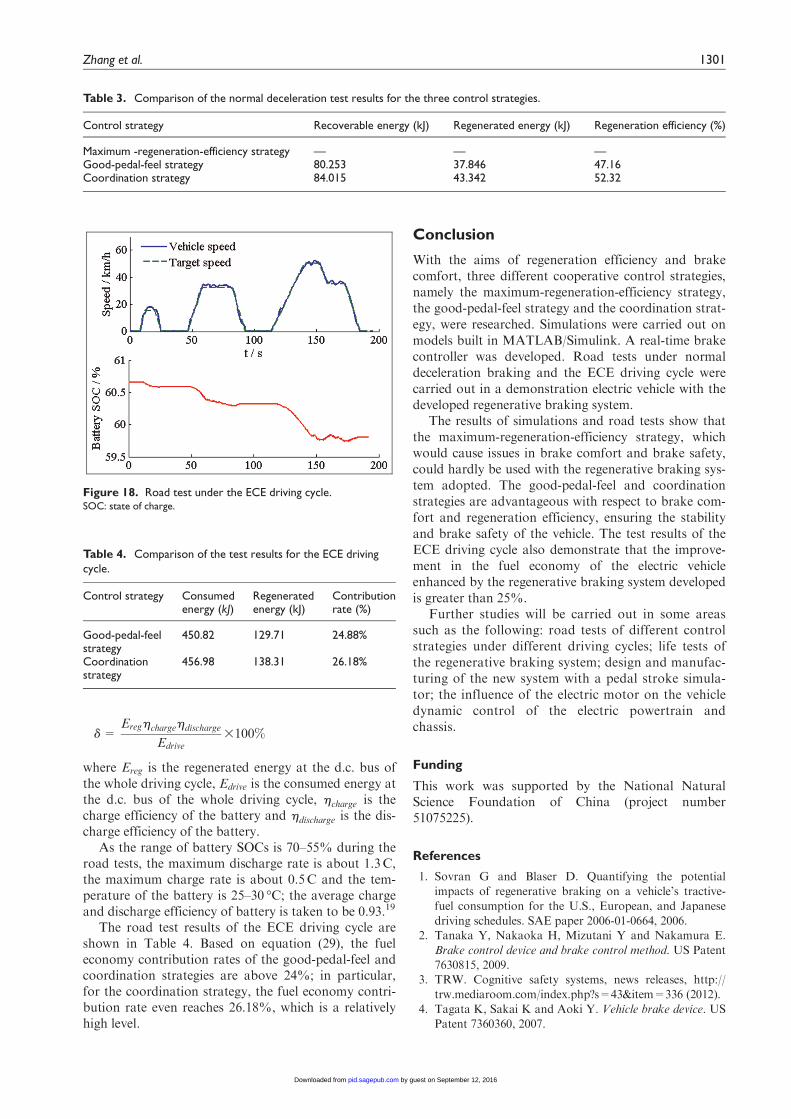
Figure 16 shows the road test results of the good-pedal-feel strategy in normal deceleration braking. For0–1.9 s the regenerative braking torque of phase 1 isexerted. When entering phase 2 at 1.9 s, according tothe strategy, only the hydraulic braking force is exertedand the regenerative braking torque decreases to zeroimmediately. As the motor torque responds much morequickly than the hydraulic braking pressure does,however, the braking pressure is not establishedcorrespondingly. Therefore, the vehicle decelerationdecreases, causing a slight positive jerk for 2–2.5 s.After the braking pressure has established stably, theregenerative brake and the frictional brake cooperatewell and the braking deceleration changes smoothly.
Figure 17 shows the road test results of the coordi-nation strategy in normal deceleration braking. For0–1.5 s the regenerative braking torque of phase 1 isexerted. When entering the deceleration phase 2 at1.5 s, as the strategy defined, the overall brakingforce of the front wheel is provided by both themotor torque and the frictional force. As the figureshows, the regenerative braking torque transitssmoothly from deceleration phase 1 to phase 2.Therefore, the jerk of the vehicle remains stableand good brake comfort is obtained. After the
front-wheel pressure reaches a relatively high value,the regenerative braking torque starts to increase toits maximum limit, and the front hydraulic brakingforce is controlled to decrease in cooperation withthe regenerative braking torque, meeting the overallbrake requirement of the vehicle.
Based on the road test data shown in Table 3, theregeneration efficiencies with both the good-pedal-feelstrategy and the coordination strategy reach a relativelyhigh level, while the efficiency of the good-pedal-feelstrategy is slightly lower than that of the coordinationstrategy, which validates the simulation results.
ECE driving cycle test
As the average speed of the ECE driving cycle is closeto the condition of an urban area in the People’sRepublic of China, the ECE driving cycle is adopted tocarry out the road tests for studying the fuel economyof an electric vehicle with a regenerative braking sys-tem, which is of practical significance. Figure 18 showsthe situation in one of the road tests under the ECEdriving cycle.
To evaluate the fuel economy of the vehicleimproved by a regenerative braking system, the contri-bution rate d is proposed as an evaluation parameter,which can be expressed as
Figure 16. Road test of the good-pedal-feel strategy. Figure 17. Road test of the coordination strategy.
1300 Proc IMechE Part D: J Automobile Engineering 226(10)
by guest on September 12, 2016pid.sagepub.comDownloaded from
d=Ereghchargehdischarge
Edrive3100%
where Ereg is the regenerated energy at the d.c. bus ofthe whole driving cycle, Edrive is the consumed energy atthe d.c. bus of the whole driving cycle, hcharge is thecharge efficiency of the battery and hdischarge is the dis-charge efficiency of the battery.
As the range of battery SOCs is 70–55% during theroad tests, the maximum discharge rate is about 1.3C,the maximum charge rate is about 0.5C and the tem-perature of the battery is 25–30 �C; the average chargeand discharge efficiency of battery is taken to be 0.93.19
The road test results of the ECE driving cycle areshown in Table 4. Based on equation (29), the fueleconomy contribution rates of the good-pedal-feel andcoordination strategies are above 24%; in particular,for the coordination strategy, the fuel economy contri-bution rate even reaches 26.18%, which is a relativelyhigh level.
Conclusion
With the aims of regeneration efficiency and brakecomfort, three different cooperative control strategies,namely the maximum-regeneration-efficiency strategy,the good-pedal-feel strategy and the coordination strat-egy, were researched. Simulations were carried out onmodels built in MATLAB/Simulink. A real-time brakecontroller was developed. Road tests under normaldeceleration braking and the ECE driving cycle werecarried out in a demonstration electric vehicle with thedeveloped regenerative braking system.
The results of simulations and road tests show thatthe maximum-regeneration-efficiency strategy, whichwould cause issues in brake comfort and brake safety,could hardly be used with the regenerative braking sys-tem adopted. The good-pedal-feel and coordinationstrategies are advantageous with respect to brake com-fort and regeneration efficiency, ensuring the stabilityand brake safety of the vehicle. The test results of theECE driving cycle also demonstrate that the improve-ment in the fuel economy of the electric vehicleenhanced by the regenerative braking system developedis greater than 25%.
Further studies will be carried out in some areassuch as the following: road tests of different controlstrategies under different driving cycles; life tests ofthe regenerative braking system; design and manufac-turing of the new system with a pedal stroke simula-tor; the influence of the electric motor on the vehicledynamic control of the electric powertrain andchassis.
Funding
This work was supported by the National NaturalScience Foundation of China (project number51075225).
References
1. Sovran G and Blaser D. Quantifying the potential
impacts of regenerative braking on a vehicle’s tractive-
fuel consumption for the U.S., European, and Japanese
driving schedules. SAE paper 2006-01-0664, 2006.2. Tanaka Y, Nakaoka H, Mizutani Y and Nakamura E.
Brake control device and brake control method. US Patent
7630815, 2009.3. TRW. Cognitive safety systems, news releases, http://
trw.mediaroom.com/index.php?s=43&item=336 (2012).
4. Tagata K, Sakai K and Aoki Y. Vehicle brake device. US
Patent 7360360, 2007.
Figure 18. Road test under the ECE driving cycle.SOC: state of charge.
Table 3. Comparison of the normal deceleration test results for the three control strategies.
Control strategy Recoverable energy (kJ) Regenerated energy (kJ) Regeneration efficiency (%)
Maximum -regeneration-efficiency strategy — — —Good-pedal-feel strategy 80.253 37.846 47.16Coordination strategy 84.015 43.342 52.32
Table 4. Comparison of the test results for the ECE drivingcycle.
Control strategy Consumedenergy (kJ)
Regeneratedenergy (kJ)
Contributionrate (%)
Good-pedal-feelstrategy
450.82 129.71 24.88%
Coordinationstrategy
456.98 138.31 26.18%
Zhang et al. 1301
by guest on September 12, 2016pid.sagepub.comDownloaded from
5. Drumm SA and Schiel L. Braking system for motor vehi-
cles. US Patent 8061786, 2010.6. Ajiro K. Vehicle brake device. US Patent Application
20070132312A1, 2010.7. Gao Y. Electronic braking system of EV and HEV-inte-
gration of regenerative braking, automatic braking forcecontrol and ABS. SAE paper 2001-01-2478, 2001.
8. Gao H, Yimin Gao Y and Ehsani M. A neural networkbased SRM drive control strategy for regenerative brak-ing in EV and HEV. In: IEEE international electric
machines and drives conference, Cambridge, MA, USA,17–20 June 2001, pp.571–575. New York: IEEE.
9. Aoki Y, Suzuki K, Nakano H, et al. Development ofhydraulic servo brake system for cooperative controlwith regenerative brake. SAE paper 2007-01-0868, 2007.
10. Luo Y, Li P, Jin D and Li K. A study on regenerativebraking strategy based on optimal control theory. Auto-
mot Engng 2006; 28(4): 356–360.11. Tur O, Ustun O and Tuncay RN. An introduction to
regenerative braking of electric vehicles as anti-lock brak-ing system. In: 2007 IEEE intelligent vehicles symposium,Istanbul, Turkey, 13–15 June 2007, pp.944–948. NewYork: IEEE.
12. Okano T, Sakai S, Uchida T, et al. Braking performanceimprovement for hybrid electric vehicle based on electric
motor’s quick torque response. In: 19th international bat-
tery hybrid and fuel cell electric vehicle symposium, Busan,Republic of Korea, 19–23 October 2002, pp.1285–1296.
13. Chu L, Zhang YS, Zhu YJ, et al. Pneumatic anti-lockbraking system for hybrid commercial vehicles. ChinesePatent 200610017245, 2007.
14. Zhang JZ, Lu X, Zhang PJ and Chen X. Road test ofhybrid electric bus with regenerative braking system. JMech Engng 2009; 45(2): 25–30.
15. Zhang B, Zhang J and Li S. Regenerative braking systembased on ESP pressure modulator. J Tsinghua Univ Sci
Technol 2011; 51(5): 710–714.16. Zhang JZ, Chen X and Zhang PJ. Integrated control of
braking energy regeneration and pneumatic anti-lockbraking. Proc IMechE Part D: J Automobile Engineering
2010; 224(5): 587–610.17. Zhang J, Kong D, Chen L and Chen X. Optimization of
control strategy for regenerative braking of electrified busequipped with ABS. Proc IMechE Part D: J Automobile
Engineering 2012; 226(4): 494–506.18. Pacejka HB and Bakker E. The magic formula tyre
model. Veh System Dynamics 1992; 21(Suppl): 1–18.19. Wei Y, Lin YI, Lin C, et al. The study on charge–
discharge characteristics and application of Li-ion batteryfor vehicle. Veh Power Technol 2005; (2): 28–31.
1302 Proc IMechE Part D: J Automobile Engineering 226(10)
by guest on September 12, 2016pid.sagepub.comDownloaded from
Related Documents


![REGENERATIVE BRAKING SYSTEM IN ELECTRIC VEHICLES · REGENERATIVE BRAKING SYSTEM IN ELECTRIC VEHICLES ... REGENERATIVE BRAKING SYSTEM ... Regenerative action during braking[9].](https://static.cupdf.com/doc/110x72/5adccef67f8b9a1a088c7cf0/regenerative-braking-system-in-electric-vehicles-braking-system-in-electric-vehicles.jpg)

