Cooperative Behavior and the Frequency of Social Interaction John Duffy and Jack Ochs Department of Economics University of Pittsburgh Pittsburgh, PA 15260 USA This Draft: June 2006 Abstract: We report results from an experiment that examines play in an indefinitely repeated, 2-player Prisoner’s Dilemma game. Each experimental session involves N subjects and a sequence of indefinitely repeated games. The main treatment consists of whether agents are matched in fixed pairings or matched randomly in each indefinitely repeated game. Within the random matching treatment, we vary the information that players have about their opponents. Contrary to a theoretical possibility suggested by Kandori (1992), a cooperative norm does not emerge in the treatments where players are matched randomly. On the other hand, in the fixed pairings treatment, the evidence suggests that a cooperative norm does emerge as players gain more experience. JEL Codes: C72, C73, C78, C92, D83. Keywords: Cooperation, Matching, Repeated Prisoner’s Dilemma, Folk Theorem, Information, Social Norms.

Welcome message from author
This document is posted to help you gain knowledge. Please leave a comment to let me know what you think about it! Share it to your friends and learn new things together.
Transcript
Cooperative Behavior and the Frequency of Social Interaction
John Duffy and Jack Ochs
Department of Economics University of Pittsburgh
Pittsburgh, PA 15260 USA
This Draft: June 2006
Abstract: We report results from an experiment that examines play in an indefinitely repeated, 2-player Prisoner’s Dilemma game. Each experimental session involves N subjects and a sequence of indefinitely repeated games. The main treatment consists of whether agents are matched in fixed pairings or matched randomly in each indefinitely repeated game. Within the random matching treatment, we vary the information that players have about their opponents. Contrary to a theoretical possibility suggested by Kandori (1992), a cooperative norm does not emerge in the treatments where players are matched randomly. On the other hand, in the fixed pairings treatment, the evidence suggests that a cooperative norm does emerge as players gain more experience. JEL Codes: C72, C73, C78, C92, D83. Keywords: Cooperation, Matching, Repeated Prisoner’s Dilemma, Folk Theorem, Information, Social Norms.

1
“Sometimes cooperation emerges where it is least expected.” -Robert Axelrod, The Evolution of Cooperation (1984, p. 73). 1. Introduction Cooperative behavior can expose individuals to possible exploitation by others who are willing
to act opportunistically. Nevertheless, cooperation can be sustained if opportunistic behavior
triggers a punishment that makes ‘cheating’ unattractive. Much cooperative behavior is
sustained by decentralized informal enforcement mechanisms. These mechanisms rely on
individuals having an interest in how their current actions affect future social interactions. As
Kandori (1992) notes, there are two general classes of informal mechanisms: Personal
enforcement, where opportunistic behavior today destroys the possible benefits of future
cooperation between the individual who has been cheated and the cheater; Community
enforcement, where a cheater is sanctioned by other members of the community who have not
themselves been victims of that cheater, but nevertheless refuse to engage in cooperative
endeavors with any cheater. The Folk Theorem holds for personal enforcement when a
particular pair of agents has an indefinite number of future interactions with one another and the
discount factor is sufficiently large. Kandori shows that public observability is sufficient for the
folk theorem to hold for community enforcement mechanisms as well. If the identity of the
cheater is common knowledge then it does not make any difference if the cheater will have
repeated future interactions with any particular member of the community or if the cheater will
simply have an indefinite number of future interactions with various members of the community.
That is, regardless of matching protocol, with public observability, there exist equilibrium
strategy profiles that will support the same payoffs as are attainable under a fixed matching
protocol.1 More remarkably, Kandori shows that for groups of any fixed size there exist payoff
1 Under public observability, an individual who has been labeled a ‘cheater’ has no incentive to act cooperatively in any particular interaction, as long as s/he believes that others will not cooperate with a known ‘cheater’. Non-cheaters, in turn, will have little incentive to risk taking a cooperative action with a known ‘cheater’, if they also believe that others will not cooperate with this particular individual in the future. Kandori provides two different ways of making individual deviations from cooperation unprofitable. One way depends upon individuals having group labels, independent of their actions. Individuals of one group are always matched with individuals of another group and once any member of a given group deviates, all members of that group are treated as ‘cheaters’, by all members of the other group. Alternatively, individuals need not have group labels and only ‘cheaters’ are labeled. To prevent those who have not yet been labeled as a ‘cheater’ from finding it profitable to avoid acquiring this label,

2
functions such that there is a community enforcement mechanism that will sustain cooperation in
an indefinitely repeated number of plays of a Prisoner’s Dilemma stage game even when
individual histories are purely private, individuals are anonymous, and the matching mechanism
for each stage game is purely random.
In the anonymous, random matching case, it is the threat that one deviation from
cooperation will trigger a contagious process of future defections by all who have experienced a
defection – rather than the threat of being branded a ‘cheater’ – that acts as a deterrent. For this
threat to be credible, an individual who has experienced a defection must find it more profitable
to defect at the next opportunity, even though this will keep the contagious process going, than to
continue to act cooperatively and stop the process. Of course, if only a small fraction of the
population has already been infected, an individual may lose a considerable amount of future
benefit from the eventual destruction of the cooperative norm. Therefore, for large groups, the
threat of starting a contagious process will not be a credible unless either the one time gain from
cheating is very large, or there is some means of stopping the contagious process thereby limiting
the loss from the destruction of the social norm. Ellison (1994) shows how the availability of a
publicly observable randomization device may be used as a correlation device to signal the end
of a punishment phase and resumption of a potentially new cooperative phase.2
While Kandori shows that a social norm of cooperation can be sustained as a non-
cooperative equilibrium even when individual pairings are both random and anonymous, whether
or not such norms are likely to emerge under such conditions is clearly an empirical question.
The experiment described below was specifically designed to address that question.
Kandori’s (1992) theorem applies to indefinitely repeated two-person games with
minimal observation of the past actions of the individuals with whom a player is currently paired
to play a stage game. Our experiment is designed, therefore, to study the behavior of individuals
drawn from a fixed population who play an indefinite sequence of two-person Prisoner’s
it must be the case that a non-cheater can expect to meet other non-cheaters sufficiently frequently in the future to make it profitable to give up the one time gain from cheating. This can be assured with strategies in which a cheater’s label is removed after some finite number of stage games. 2 As Ellison shows, it is not necessary to have a public randomization device to limit the period in which a contagion process is operating. But such a device does serve as a signal upon which all individuals can coordinate their departure from a punishment phase.

3
Dilemma games under different matching protocols and different amounts of information
transmission. The objective of varying the matching protocol (fixed pairings versus random
matching) is to determine empirically how much difference in the level of cooperative play is
associated with these different matching protocols. The objective of varying the information
transmitted to players (under the random matching protocol only) is to determine whether
information on the payoff or action history of a player’s opponent, prior to play of the stage
game, has any effect on the level of cooperative play. The design also incorporates a randomly
generated, publicly observable signal that could be used by agents as a device to coordinate the
end of a punishment phase, if they were to choose strategies of the type described by Ellison
(1994).
To foreshadow our experimental results, we find that the initial play of subjects is quite
similar under both fixed and random matching protocols. With experience, under fixed pairings,
cooperation emerges as a norm. However, under random pairings, non-cooperation is quickly
established as a norm. Under random pairings, there is evidence that some individuals attempt to
coax members of their group to break out of a non-cooperative norm, as Ellison suggests. But,
these attempts are futile. We also find that a social norm of cooperation that is established under
fixed pairings will be immediately broken when the matching protocol is switched to random
pairings, while a social norm of non-cooperation under random pairings is also easily displaced
when the same group is matched under fixed pairings. Finally, we find little evidence that
smaller group sizes or the provision of information about an opponent’s past actions or payoff
history increases the likelihood of a cooperative social norm developing under a random
matching protocol.
2. Related Work
2.1 Indefinitely Repeated Stage Games
By definition, indefinitely repeated stage games have no (predictable) last stage. Therefore, if
cooperative play is reciprocated in the early stages, a belief in future reciprocity will be
reinforced and cooperative behavior may be sustained indefinitely. The concept of an
indefinitely repeated stage game is implemented experimentally by use of a randomization

4
device to determine after each stage game is played whether the game has ended or another stage
game is to be played. The probability of continuation determines whether or not there exists a
cooperative equilibrium in the supergame. This device was introduced by Roth and Murnighan
(1978).3 There are surprisingly few experiments that have been conducted with indefinitely
repeated stage games.4 Van Huyck et al. (2002) report an experiment conducted with
supergames constructed of an indefinite sequence of repetitions of dominance solvable stage
games, followed by a small fixed number of repetitions of the same stage game. They observed
that during the probabilistic continuation phase of a supergame whose stage game has an
equilibrium in strictly dominant strategies, the cooperation level rose dramatically with
experience. In the Van Huyck et al experiment, all observations were made under a fixed
pairings protocol.5 To our knowledge, the only other experiment with an indefinitely repeated
game played under different matching protocols is reported in Palfrey and Rosenthal (1994).
They conducted an experiment using an indefinitely repeated N-person provision point voluntary
contribution game. This game was played under both fixed and anonymous random matching
protocols. Unlike a Prisoners’ Dilemma, non-cooperation is not a dominant strategy in their
stage game and the stage game has a multiplicity of cooperative equilibria. They found that
under random matching, subjects “adhere to cut-point decision rules that are, on average, very
close to those predicted by the Bayesian equilibrium (of the one-shot game). Repetition (i.e., 3 In their experiments subjects played an indefinitely repeated Prisoners’ Dilemma stage game against a pre-programmed strategy, either tit-for tat, or grim response. They were interested in testing how responsive cooperative play was to variations in the continuation probability. While they found the rate of cooperative play to be positively related to the continuation probability, the levels of cooperation they observed were quite far from 100%. 4 Dal Bó (2005) considers whether the responsiveness of cooperation to an increase in the continuation probability observed by Roth and Murnighan is simply a reflection of the increase in the expected number of repetitions of the stage game before a relationship is terminated, or whether behavior in games of indefinite length is fundamentally different from behavior in games of finite repetitions of a prisoners’ dilemma stage game. He finds that the percentage of cooperative play in finitely repeated games of a given length is lower than indefinitely repeated games of the same expected length. 5 Holt (1985) also reports an experiment with an indefinitely repeated duopoly game conducted under fixed pairings. Like Van Huyck et al, a basic treatment variable was whether the game was an indefinitely repeated supergame or a finitely repeated game. In the supergame treatment, the median of the distribution of final period outputs was much closer to the Nash equilibrium than to a collusive, joint profit maximizing output. Aoyagi and Frechette (2003) also report an experiment conducted with supergames constructed from an indefinite sequence of a prisoner’s dilemma game with noisy public signals. Their subjects also played under fixed pairings. They found that cooperation increases as the noise in the signal decreases.

5
fixed matching) leads to more cooperative behavior (than observed with random
matching)...(but) the observed magnitudes of improvement are much smaller than predicted
(assuming that random matching corresponds to the play of a one-shot game).” The fact that
subjects did not come close to fully exploiting the opportunities for coordination and cooperation
under either the fixed or random matching protocols in the Palfrey-Rosenthal experiment is,
perhaps, not surprising. Their stage game is a game of incomplete information. The symmetric
cut-point strategy that maximizes expected joint profits is not transparent. That game has a
multiplicity of equilibria in non-symmetric pure strategies and there is no evidence of any effort
to coordinate on a pure strategy equilibrium. By using a prisoner’s dilemma as our stage game in
our own experiment we expect the cooperative equilibrium of the supergame to be much more
salient.
2.2 Information
The Kandori theorem implies that a cooperative norm can develop even in the absence of any
information being transmitted about one player’s past actions or experience to the other player
with whom he is currently paired. Nevertheless, one might expect players to act differently if
such information is transmitted than if it is not. Bolton, Katok and Ockenfels (2001) report an
experiment with a finitely repeated stage game in which each player may carry with him an
image score that reflects some information about the past experience of that player. This
information, but not the identity of the player, is observable to the other person with whom s/he
is matched in the current stage game. At the beginning of each stage game individuals are
randomly paired, and once paired a random draw determines the choice of dictator. The dictator
can either ‘Give’ the receiver a large payoff and receive no payoff himself, or ‘Take’ a small
payoff himself and give the receiver nothing. The issue they explore is whether a concern for
one’s future image influences the current behavior of a ‘dictator’. They find that when the
opportunity cost of being nice is high, ‘giving’ is much lower when there is no image score than
when there is an image score. Because their stage game is finitely repeated, Kandori’s theorem
does not directly apply. Indeed, in their game, the only sequentially perfect equilibrium is to

6
‘Take’. Nevertheless, this experiment suggests that information transmission may make a
difference in the play of a game under a random matching protocol.
Another related experiment was conducted by Schwartz, Young and Zvinakis (2000).
They use a modified Prisoner’s Dilemma as the stage game in their experimental design. Their
stage game is played for an indefinite number of times under a random matching protocol.
Subjects remain anonymous. However, under different treatments, different portions of a
player’s past history are revealed to the person with whom s/he is currently matched. They find
that these disclosure conditions have a large effect on the initial levels of cooperation observed.
However, under either information condition, they observe a decline in cooperation as subjects
gain experience. Like Bolton, et al., the results of Schwartz and his associates indicate that
among inexperienced subjects, in environments where cooperation can only be reciprocated
indirectly, information transmission can have significant effects on behavior. What is left open
is whether these effects can sustain a cooperative equilibrium as subjects gain experience.
Conversely, it is still unknown whether anonymous random matching with no information
transmission about one’s current partner’s history will reliably produce a non-cooperative
equilibrium.6
3. The Experiment
3.1 Experimental Design
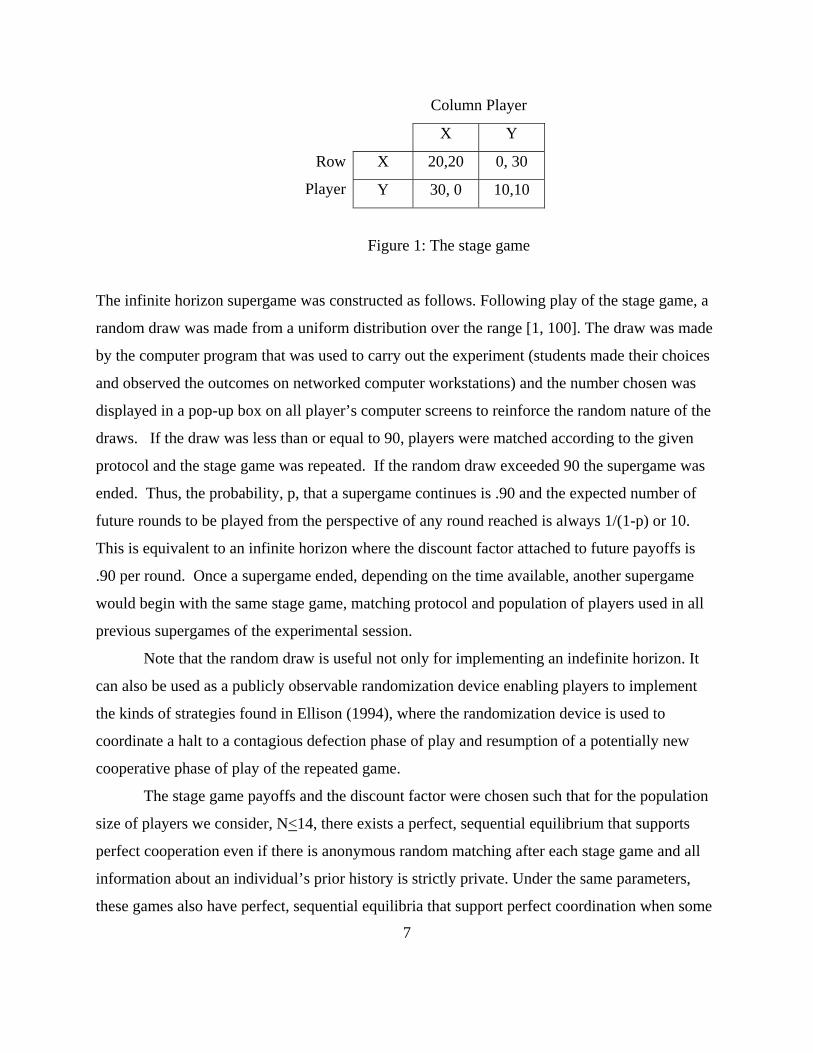
In all sessions of our experiment we use an indefinite repetition of the Prisoner’s dilemma stage
game shown in Figure 1.
6 Andreoni and Croson (2002) assess the effect of random re-matching (strangers) versus fixed matchings (partners) in the context of finitely repeated, n>2-player voluntary public good game experiments. Examining several different studies, they find inconsistent evidence on the effect that random (fixed) matching has on the level of contributions to a public good. By contrast, in this paper, we focus on two-player, indefinitely repeated prisoner dilemma games under fixed and random matching protocols, and we vary the level of information in the case of random pairings.
7
The infinite horizon supergame was constructed as follows. Following play of the stage game, a
random draw was made from a uniform distribution over the range [1, 100]. The draw was made
by the computer program that was used to carry out the experiment (students made their choices
and observed the outcomes on networked computer workstations) and the number chosen was
displayed in a pop-up box on all player’s computer screens to reinforce the random nature of the
draws. If the draw was less than or equal to 90, players were matched according to the given
protocol and the stage game was repeated. If the random draw exceeded 90 the supergame was
ended. Thus, the probability, p, that a supergame continues is .90 and the expected number of
future rounds to be played from the perspective of any round reached is always 1/(1-p) or 10.
This is equivalent to an infinite horizon where the discount factor attached to future payoffs is
.90 per round. Once a supergame ended, depending on the time available, another supergame
would begin with the same stage game, matching protocol and population of players used in all
previous supergames of the experimental session.
Note that the random draw is useful not only for implementing an indefinite horizon. It
can also be used as a publicly observable randomization device enabling players to implement
the kinds of strategies found in Ellison (1994), where the randomization device is used to
coordinate a halt to a contagious defection phase of play and resumption of a potentially new
cooperative phase of play of the repeated game.
The stage game payoffs and the discount factor were chosen such that for the population
size of players we consider, N<14, there exists a perfect, sequential equilibrium that supports
perfect cooperation even if there is anonymous random matching after each stage game and all
information about an individual’s prior history is strictly private. Under the same parameters,
these games also have perfect, sequential equilibria that support perfect coordination when some
Column Player
X Y
X 20,20 0, 30 Row
Player Y 30, 0 10,10
Figure 1: The stage game

8
information about an individual’s history is transmitted to the individual with whom that person
is currently matched. Appendix A provides further details. Given that the expected length of a
supergame is 10 repetitions of the stage game, subjects have experience with several supergames
over the course of a two-hour session.
There are three treatment variables in our main design. The first treatment variable is the
matching protocol (fixed pairings; random pairings). The second treatment variable is the size of
the population (N=14 or N=6). The third treatment variable is the information conveyed to each
member of a pair playing a stage game regarding the history of the other member of the pair.
Since, in fixed pairings each member of a pair shares a complete history with the other member
and is aware of this fact, the information treatment is varied only in the random matching
protocol sessions.
3.2 Hypotheses
The basic hypothesis to be tested is that there is no significant difference in the level of
cooperative play observed under anonymous-fixed and anonymous-random matching protocols.
In a given session, the matching protocol is made public through the instructions that are read out
loud. In most sessions, the protocol does not change during the course of a session. Subjects are
either assigned to a fixed pairing at the beginning of a supergame or are randomly paired after
each stage of a supergame. In sessions in which a fixed pairing protocol is used, the fixed
pairings changed from one supergame to the next in a round robin format; prior to the first round
of each new supergame, each player was anonymously matched with one of the N-1 players with
whom s/he had not previously played a supergame.7 In some sessions, one matching protocol is
used at the beginning of a session and then the second protocol is used for the remainder of the
session. In those sessions in which two protocols are used, subjects are not informed of the
7 Hence, for the fixed-pairings treatment, up to N-1 supergames could be played where in each supergame, the players in a anonymous fixed pairing have not previously met one another. This consideration motivated our choice of N=14, as we typically played no more than 13 supergames in a session (see Table 1). If more than N-1 supergames were played in a session, (as in sessions where N=6), then players were matched with players with whom they had played before. However, as these matchings were anonymous, players could not condition on their past history of play with any other player.

9
change in protocol until the point in the session at which the switch is made. This treatment
allows us to observe how a given group of subjects responds to a change in matching protocol.
A second hypothesis to be tested is that in an anonymous, random matching environment
the relative frequency of cooperative play is unaffected by the amount of information about an
individual’s own history that is available to the person with whom that individual is matched. A
competing hypothesis is that the more information an individual has available to label a player a
non-cooperator, the greater likelihood that individuals will refrain from non-cooperative play in
the random matching environment. The amount of information about one player’s history that is
transmitted to the other player is a second treatment variable in our design. This variable, I, can
take on one of three values: 0 (no information is transmitted); 1 (the average payoff in the
individual’s last game is transmitted); 2 (the action chosen by the individual last period is
transmitted). Under all conditions, the matching and information transmission are done so as to
preserve the anonymity of each person. When I = 0, each player can only condition his/her own
strategy on his/her own history. Only an individual who has actually experienced non-
cooperative play has any reason to update his/her own priors about the relative frequency of
playing future games with another individual who has had the same experience. This is the case
considered by Kandori (1992). Intuitively, among the information treatments we consider, the
I=0 case would seem to be the least conducive to the development of a fear of contagion
necessary to sustain cooperation. When I > 0, each player can condition his action on not only
her/his own history, but on the information provided about his opponent’s history. Furthermore,
when I>0, each player knows that the player with whom they will be matched next period will
possess information that may (when I= 1) or will (I = 2) be sufficient to label her/him a ‘non-
cooperator’ if s/he chooses to defect this period. The more nearly complete is the information on
an opponents’ immediate past history, the greater is the likelihood that past non-cooperative acts
will be met with non-cooperation in the present game and induce a contagious reaction that
would make current deviation from cooperation unprofitable. Indeed, giving players information
on other players’ histories prior to the play of a stage game should serve to speed up the onset of
the contagious equilibrium thereby strengthening the threat by which a norm of cooperative
behavior is sustained. On the other hand, Kandori’s theorem does not require that players posses
10
such information on their opponent’s immediate past history of play. Hence our null hypothesis
is that the frequency of cooperative play is unaffected by either I>0 treatment.
3.3 Results
We report results from 24 experimental sessions involving a total of 274 subjects. A description
of the characteristics of these experimental sessions is given in Table 1. In most sessions we
used a population size of N=14. In six sessions we considered a smaller population of size N=6
as a robustness check on our results with the larger population size.
[Insert Table 1 here]
Our aim was to get approximately 100 rounds of data per session. As the length of each
indefinitely repeated game (supergame) should average 10 rounds, our goal of 100 rounds per
session was satisfied by playing an average of 10 indefinitely repeated games per session. Of
course, due to the random end of each indefinitely repeated game, there is some variation in the
number of games and rounds as indicated in Table 1. Subjects were not told of our objective of
100 rounds, nor were they told in advance which indefinitely repeated game would be the last
one played. Subjects were recruited for a two-hour session but our goal of 100 rounds was
always achieved well before this two-hour limit, typically after around 90 minutes.
The subjects were recruited from the undergraduate population at the University of
Pittsburgh. Each group of subjects had no prior experience participating in any treatment of our
experiment. Subjects were read instructions pertaining to the single treatment they were
participating in and then began playing, entering their choices, X or Y, on a computer screen
when prompted. Copies of the instructions used in the fixed and the random pairings (I=0)
treatments are included in Appendix B. All treatments involved the same stage game as shown
in Figure 1. Following their choice of action, X or Y, subjects were informed of the other
player’s action and their payoff. The payoff numbers for the game, as shown in Figure 1 were
interpreted as monetary payoffs in terms of cents (US$). Thus, if two players chose Y,Y in a
round, each player earned 10 cents, etc. Subjects were paid their payoffs from all rounds of all

11
games played and in addition were given a show-up payment of $5. Average total earnings
depended on the treatment. In the fixed pairings treatment, subject’s total earnings (including the
$5 showup fee) averaged $18.64. In the random pairings treatment (I=0, N=14) subjects’ total
earnings averaged $14.86.
3.3.1 Fixed Versus Random Pairings with No Information, 14 Subjects
[Insert Figure 2 here]
The left column of Figure 2 presents data on the aggregate frequency of cooperation in each
round of each game played in four sessions that were conducted under a fixed pairings matching
protocol with 14 subjects. The horizontal axis reports round numbers. A round number of 1,
represented in Figure 2 (and subsequent figures) by a vertical bar, indicates the start of a new
supergame. The right column of Figure 2 presents the aggregate frequency of cooperation in
each round of each game played in the four sessions that were conducted under the random
pairings matching protocol when subjects received no information (I=0) regarding the past
experience of anyone with whom they were currently matched. While subjects who played under
the random pairings protocol were randomly paired after each round of play, the procedure was
to terminate a sequence of rounds with the same stopping rule as was used in the fixed pairings
matching protocol sessions. When a sequence ended, the end of the ‘game’ was announced. If
our criteria of obtaining approximately 100 rounds of play had not yet been reached, we
announced that a new game would begin. Therefore, a round number of 1 on these graphs also
indicates when a new sequence of rounds was begun. In the graphs shown in Figure 2, we report
both the aggregate frequency of cooperation—% choice of action X— together with a fitted line
from a regression of %X on a constant and time, t,=1,2…T (where T is the total number of
rounds played in all supergames of the session). A tabular display of the aggregate frequencies of
cooperation for the fixed and random, I=0 matching sessions with 14 subjects is presented in
Table 2. For comparison purposes, Table 2 also reports statistics for the random matching I=1
and I=2 treatments which are discussed later in the text.
[Insert Table 2 here]

12
The column in Table 2 labeled “Game 1, Round 1” reports the aggregate frequency of
cooperative play (i.e., choice of X) in the first round of the first game played in each session
involving 14 subjects. According to nonparametric, robust rank-order tests8, there is no
significant difference (p>.10) in the distribution of these Game 1, Round 1 cooperation
frequencies between the Fixed and Random, I=0 (or between the Fixed and Random, I=1)
treatments. Thus, the difference between the fixed and random matching protocols is not
immediately taken into account by subjects.
While there is no difference in the way inexperienced subjects first play these games,
experience under the fixed protocol drives each group of subjects to a much higher level of
cooperative play than is observed under any of the random pairings treatments (I=0,1,2). Under
random pairings, as subjects gain experience, the frequency of cooperation plummets towards
zero. By contrast, under fixed pairings, as a session progresses, the frequency of cooperative
play increases. Indeed, as subjects gain experience, the difference in cooperative frequencies
between fixed and the random pairing treatments increases.
More precisely, robust rank-order tests of the null hypothesis of no difference between
treatments confirm that the aggregate cooperation frequencies over the first half, over the second
half, and over all rounds of a session (as reported in Table 2) are significantly higher in the fixed
pairings treatment than in either the random, I=0 or I=1 treatments (p =.014, smallest critical
value for paired samples with 4 observations each).9 Furthermore, in the fixed pairings
treatment, the cooperation frequencies in the second half of the sessions are significantly higher
than those in the first half (p=.014). By contrast, in the Random I=0 treatment, the cooperation
frequencies in the second half of the sessions are only marginally significantly lower than those
in the first half (p=.10), and in the Random I=1 treatment, one cannot reject the null hypothesis
of no difference in the cooperation frequencies between the first and second halves of sessions
(p>.10).
8 See Siegel and Castellan (1988) or Feltovich (2003) for a discussion of the robust rank order test. This test is used throughout this paper, wherever p-values are reported in the text. 9 As there is only one session/observation for the random pairings, I=2 treatment, we cannot use the robust rank order test to test for differences between this treatment and the others. Results from the single session of the random I=2 treatment suggest that cooperation levels are likely to be substantially lower in this environment than under fixed pairings, but not dissimilar from cooperation levels observed in the random pairings I=0,1 treatments.

13
An interesting property of the data in all sessions is the increase in cooperation observed
in the first round of many of the supergames relative to the level of cooperation in the final
rounds of the preceding supergame. This ‘restart’ phenomenon shows up in all of our treatments
as revealed in Figure 2 (see also Figures 5, 6, 7). It is clearly seen in Figure 3a, which shows the
aggregate frequency of cooperation in the first round of all supergames as well as the aggregate
frequency of cooperation in all other rounds, excluding the first round of all supergames across
the fixed and random treatments with 14 subjects. The figure reveals that on average,
cooperation is greater in the first round than over all subsequent rounds of each supergame.
[Insert Figures 3a-3b here]
In the random pairings treatment, the restart effect reflects repeated efforts by just a few
subjects to encourage a social norm of cooperation. Some evidence for the existence of such
cooperating types can be found in Table 3, which reports the cumulative number (cumulative
percent) of players in each fixed or random pairings session with 14 subjects whose individual
frequencies of cooperation fell below various threshold levels, using data from all rounds of all
supergames of a session, as well as for the first and second halves of a session. For instance, in
Session 2 of the Random, I=0 pairings treatment, there were 2 subjects who cooperated (chose
action X) in 10 to 25 percent of all rounds played, while in session 4 of this same treatment, there
were 3 subjects who cooperated in 25 to 50 percent of all rounds played. In session 2 of the
Random, I=1 treatment, one subject chose to cooperate in more than 75 percent of all rounds
played. However most of these cooperating-types are cooperating with low frequency, typically
in the first round of each new supergame. As a random-pairings session continues, some of these
first-round cooperators get discouraged, and shift to defecting in the first round. This has the
effect of dampening out the restart effect and reducing first-round cooperation frequencies in the
random matching treatments as shown in Figure 3b.
To see that this is the case, let us (arbitrarily) label a player who cooperates more than 10
percent of the time in the first half of a random matching session (I=0 or 1) a “hopeful” player.
For instance, in session 1 of the Random, I=0 treatment, Table 3 reveals that there is exactly 1
hopeful player; in session 2 there are 3 hopeful players, in session 3, there are 6 hopeful players
and in session 4 there are 12 hopeful players. A similar count of hopeful players can be made for
the Random, I=1 treatment; in session 1 there are 9, in session 2, there are 8, in session 3 there

14
are 8 and in session 4 there are 13. In all 8 of these sessions, Table 3 reveals that the number of
hopeful players always declines from the first to the second half of the session.
This reduction in the number of hopeful players tends to dampen out the ‘restart’
phenomenon as additional supergames are played, as the hopeful players are mainly cooperating
in the first round of a supergame. This dampening out of the restart phenomenon in the random
matchings treatments is illustrated in Figure 3b, which shows the aggregate frequency of
cooperation in the first rounds of supergame numbers 1-10 using pooled data from all sessions of
a treatment.10
[Insert Table 3 here]
In the fixed pairings treatment, the aggregate level of cooperation within a given
sequence of rounds (supergame) tends to diminish as the number of rounds played in that
sequence increases, as can be seen in Figure 2 or in the aggregate frequencies shown in Figure
3a. The decline in the aggregate frequency of cooperation over time is due to the presence of
just a few players, who very frequently chose to defect, despite being in the fixed pairings
treatment. The presence of these defecting players can again be seen in Table 3. For instance,
in Sessions 1, 2 and 3 of the fixed pairings sessions, we see that there are always 1 or 2
individuals who were choosing action X (cooperating) in less than 10 percent of all rounds
played, (defecting more than 90 percent of the time). As in the random pairings treatment, there
is a “restart” phenomenon where the aggregate level of cooperation increases at the beginning of
a new sequence with new pairings, from the level observed at the end of the previous sequence.
Unlike the random pairings treatment, there is an upward trend in the aggregate level of
cooperation observed the first time new pairings interact, in the first round of each supergame –
see Figure 3b.
[Insert Figure 4 here]
10 As noted above in the discussion of Table 1, some sessions had more than 10 supergames, and some had less. In Figure 3b, we have reported the average frequency of cooperation in supergame number 1,2,…10 for all sessions of a treatment for which that supergame was actually played.
15
As Figure 4 makes clear, on average, the aggregate frequency of cooperation is a little
more than 10 percent lower at the end of each supergame relative to the start of that supergame.
The reason for this finding is that in each fixed pairing session there is typically a small core of
players – ‘defectors’ – who defect with a high frequency as can be seen in Table 3. In the first
rounds of play of a new supergame, these defectors’ impact on the aggregate frequency of
cooperation is at its weakest. However, if the defectors are in fixed pairings with subjects
playing conditionally cooperative strategies, these conditional cooperators will quickly switch
from cooperating to defecting, thereby further lowering the aggregate frequency of cooperation
as the supergame proceeds. Nevertheless, the upward trend in the frequency of cooperation in
the first round of each new supergame is sufficiently strong that the aggregate frequency of
cooperation increases over time.
This upward trend in first-round cooperation under fixed pairings – as shown in Figure
3b- is due to a reduction in the number of ‘near-unconditional’ defectors as a session proceeds.
To see that this is the case, let us (again, arbitrarily) label a player who cooperates less than 10
percent of the time in the first half of a fixed pairing session a “pessimistic” player. As Table 3
reveals, in two of the four fixed pairing sessions, (numbers 2 and 4), the number of these
pessimists drops from 1 or 2 in the first half of the session to 0 in the second half of the session.
If pessimists were alternatively defined as those who cooperated less than 50% of the time, a
starker drop-off in the number of pessimists would be found from the first to the second half of
all four fixed pairings sessions.11
We conclude that, under fixed pairings there appears to develop a social norm of
cooperation as a given group of subjects gains experience, while under the various random
pairings treatments, experience tends to drive groups toward a far more competitive norm.
3.3.2 The Effect of Group Size A group size of 14 is, theoretically, sufficiently small for the existence of a cooperative
equilibrium under random matching with no information transmission. Indeed, as detailed in
11 We have verified that this drop-off in the number of pessimists is due to changes in the actions chosen by the players labeled as pessimists in the first half of the session. Players who were not labeled as pessimists in the first half of a session are almost never labeled as pessimists in the second half of a session.
16
Appendix A, our parameterization of the indefinitely repeated prisoner’s dilemma game admits a
cooperative equilibrium under random pairings and no information for any group of size 2-30.
However, the threat of setting off a contagion process does not appear to be sufficient to sustain
cooperation in random matching environments with a group of size 14. Figure 5 below displays
the results observed in sessions in which a smaller group of 6 subjects were matched either in
fixed pairings for the duration of a supergame or randomly in each round of a supergame with no
information about their opponent’s prior history of play – 3 sessions of each treatment. In the
experimental sessions with groups of 6 subjects, we followed the same experimental procedures
as in the sessions with 14 subjects. With a smaller group size, a contagion process will get back
to its originator much more quickly and the threat of setting off such a process should provide a
correspondingly larger incentive to cooperate. As the data in Figure 5 reveal, when there is no
information feedback, under random matching the smaller groups behave as competitively as the
larger groups.
[Insert Figure 5 here]
A tabular display of the aggregate frequency of cooperation in the eight sessions with 6 subjects
is presented in Table 4.
[Insert Table 4 here]
As in the sessions with 14 subjects, robust rank-order tests reveal that the distribution of
cooperation frequencies in the first stage game played in the fixed pairings treatment is no
different than that observed for the random, I=0 pairings treatment. Under the fixed matching
protocol, the aggregate frequency of cooperation increases with experience in all four sessions
with 6 subjects, while under the random matching protocol the aggregate frequency of
cooperation diminishes with experience in two of the three sessions.12 Rank-order tests further
12 In session #3 of the random, I=0 treatment with 6 subjects, there was a slight increase the aggregate frequency of cooperation over time-see Figure 5; the slope of the fitted line for this session is positive, though not significantly different from zero. This slight upward trend is owing to the increase, over time, in cooperation frequencies in the first few rounds of each new supergame. However, there continues to be a dramatic fall-off in the cooperation over the course of each supergame, contrary to the findings in the fixed pairings treatment.

17
confirm that the aggregate cooperation frequencies over the first half, over the second half, and
over all rounds of a session (as reported in Table 4) are significantly higher in the fixed pairings
treatment than in the random, I=0 treatment. (p≤ .029). A comparison of the aggregate
cooperation frequencies (over the first half, second half, or all rounds of a session) achieved by
groups of 14 subjects in the random, I=0 treatment with those achieved by groups of 6 subjects
in the same treatment (cf. Tables 2 and 4) yields no significant differences (p>.10). Similarly, a
comparison of the cooperation frequencies achieved by groups of size 14 or 6 under the fixed
pairings protocol also yields no significant differences. We conclude that group size has no
statistically significant effect on aggregate cooperation rates.
3.3.3 The Effect of Prior Conditioning
A group of subjects who gain experience with the fixed pairings protocol tends to exhibit a high
degree of cooperation. It is natural to ask whether the social norm of cooperation such a group
had exhibited under fixed pairings will be sustained when the group is switched to a random
matching protocol. Conversely, if a group has exhibited a social norm of non-cooperation under
a random matching protocol will that experience inhibit the formation of a cooperative norm if
they are switched to a fixed pairings protocol? To study the effect of prior conditioning on the
nature of the social norm developed under a given matching protocol we conducted five sessions
in which subjects were first matched under one protocol and then, sometime during the middle of
each experimental session, they were switched to another matching protocol. This type of design
is referred to as a “within-subjects” design and stands in contrast to the “between-subjects”
design we have used up to now.13 The switch in matching protocols was not announced in
advance. When the switch was made, we handed out and read aloud a brief change in the
instructions, which explained to subjects the new matching protocol that would be in effect in all
subsequent rounds. We then played several supergames under this new protocol. All other
procedures were as before.
13 Within-subject designs yield findings that are less susceptible to individual differences than between-subject designs, e.g., a subject who had too little sleep before an experimental session is nevertheless present in all treatments of a within-subjects design, but is only in one treatment of a between-subjects design. On the other hand, between-subject designs allow subjects to acquire more experience with a particular treatment than within-subject design sessions of the same duration.

18
Figure 6 shows data on cooperation frequencies from the five within-subjects sessions we
conducted with 14 inexperienced subjects per session. The left column of Figure 6 displays data
from three sessions in which subjects were first matched according to the fixed pairings protocol
and then, without prior announcement switched to a random pairings protocol in the manner
describe above. The right column of Figure 6 displays data from two sessions with the opposite
order of use of protocol.
[Insert Figure 6 here]
When subjects are first matched under fixed pairings, they quickly achieve a high level of
cooperation. However, the switch to the random matching protocol produces an immediate,
dramatic decline in the rate of cooperation and, as the session continues, the rate of cooperation
quickly tends to zero. In short, there is no evidence that a group of people who have learned to
cooperate under fixed pairings will develop a social norm of cooperation that persists when
matched randomly. Conversely, as shown in the right column of Figure 6, experience with
random matching that has led members of a group to behave competitively does not prevent the
group from immediately making a marked increase in the cooperation rates in response to a
switch to the fixed pairing protocol and, with experience, achieving very high sustained levels of
cooperation. Indeed, the data suggest that a group that has experienced the competitive
outcomes under random matching may learn to cooperate under fixed pairings even more rapidly
than groups who have not had such experience.
3.3.4 The Effect of Information Transmission
In the random pairings, I=1 treatment, prior to play of the stage game, each player is told the
average payoff received by his opponent and the person with whom his opponent was paired in
the last stage game. There are just three possibilities for this average payoff: 10, 15 or 20. If the
report is 10 (20), then it is known that the opponent played Y (X) in the last stage game. If the
report is 15, then it is known that either the opponent, or his matched pair, but not both, played Y
in the last period. In this information treatment, a player who was seeking to signal to a future
opponent her determination (say) to play the cooperative action X by choosing X this period
19
would be unable to do so unambiguously. Figure 7 displays the aggregate frequency of
cooperation achieved in four sessions conducted under this information condition with groups of
14 subjects who were matched under the random matching protocol.
[Insert Figure 7 here]
The aggregate cooperation frequencies for this treatment were reported earlier in Table 2. As
we noted in the discussion of Table 2, a comparison of the behavior of subjects in their first
round of experience under the fixed matching protocol and the random matching protocol with
information feedback (I=1) indicates that there is no statistically significant difference in initial
behavior (game 1, round 1). As in the random matching protocol sessions with no information
feedback (I=0), there is no indication of any trend increase in cooperation rates with experience
and the level of cooperation achieved is quite low relative to that observed under the fixed
pairings matching protocol. While cooperation frequencies in the fixed pairings treatment are
significantly higher than those achieved in the random, I=1 treatment, the cooperation
frequencies in the random, I=1 treatment are significantly higher than those achieved in the
random, I=0 treatment (over the first half, second half and all rounds of a session - probability of
rejecting the null of no difference, p =.014, lowest value possible with four observations). These
findings do not appear to change if the group consists of just 6 rather than 14 subjects. Figure 8
shows aggregate cooperation frequencies in a single session we conducted with 6 subjects under
the random matching, I=1 protocol. The aggregate cooperation frequency in this session looks
very similar to that shown in Figure 7 for the same treatment with 14 subjects or to the random
I=0 sessions with 6 subjects shown in Figure 5. We conclude that the additional information
given in the I=1 treatment yields some increase in cooperative play, but that the trend in
cooperative behavior as subjects gain experience is much more similar to the random, I=0
treatment than to the fixed pairings treatment, regardless of group size.
[Insert Figure 8 here]
A similar finding obtains for the random pairings protocol under information condition I=2,
which corresponds to the case where, prior to play of the stage game, players are informed of the
action (X or Y) that their opponent chose in the previous round of play when matched with
another player. This is a different kind of information than is given in the I=1 treatment; in the
I=2 treatment, there is no ambiguity about the action chosen by a player’s opponent in the

20
previous period. Providing unambiguous information on an opponent’s action choice prior to
play of the stage game makes it straightforward to label that opponent as a cooperator/defector
before playing the game. However, the payoff information in the I=1 treatment reveals whether
the opponent or his partner defected in the last round and therefore provides more information
about whether a contagious process has started than does the information provided in the I=2
treatment.14 For this reason, we conducted just one session of the random pairings, I=2 treatment
with 14 subjects, and the aggregate outcome is presented in Figure 9.
[Insert Figure 9 here]
Again we see that there is no indication of any trend increase in cooperation rates as subjects
gain experience. Aggregate statistics for this session are given in Table 2. While we do not have
enough observations of this treatment to make any definitive conclusions, it appears on the basis
of the single observation that we do have that there is not much difference in aggregate outcomes
between the random pairings, I=2 and I=1 treatments. As was the case with the random I=1
treatment, cooperation levels might be higher in the random I=2 treatment relative to the random,
no information treatment I=0. Nevertheless the random I=2 treatment gives rise to the same trend
decrease in cooperation rates over time that is observed in both the random I=0 and I=1
treatments.
4. Concluding Observations
Ellison (1994) observed that Kandori’s theorem cast doubt on claims that the development of
private local institutions, providing information on the reputations of individuals who participate
in trade with various partners in the absence of enforceable contracts, were essential for the
continued success of medieval trade fairs (Milgrom, et al. (1990)) and the international trading
ventures of Maghribi traders (Grief (1989)). The experiment we report on in this paper shows
that under anonymous random matching there is no evidence of the development of a
cooperative norm even under the conditions of small group interaction or limited information
about an opponent’s past actions or histories. This finding gives weight to the argument that 14 Unambiguously labeling a player as a cooperator or defector may enhance reputational concerns as stressed, e.g., by Bolton et al. (2004). However, such reputational concerns play no role in Kandori’s theory.

21
without the development of the kinds of institutions that can make an individual’s reputation
public, the systems of trading at medieval fairs and international trade conducted amongst
members of the same tribe could not have been sustained.
Ellison also observed that Kandori’s theorem cast doubt on claims by experimenters that
random, anonymous matching was sufficient to prevent subjects from treating all repetitions of a
game played during an experimental session as a single supergame.15 Our findings indicate that,
as a matter of fact, the behavior of subjects who are in fixed pairings for the duration of a
supergame is markedly different from the behavior of subjects who play a sequence of one shot
games with random re-matching of anonymous players after each game is played. This finding
suggests that random matching amongst anonymous players does, in fact, tend to suppress the
inclination of subjects to treat all trials in a given session as a single supergame.
Finally, the results of our experiment establish empirically that in indefinitely repeated PD
games played with fixed pairings, a community norm of cooperation becomes possible as
subjects gain experience. This norm is achieved in both large and small groups, despite the
anonymity of pairings and the presence of some `pessimistic’ players, and even in cases where
players have prior experience, under a random matching protocol, with a competitive norm.
Appendix A In this appendix we explain how we verified the existence of a “contagious” equilibrium as described in Kandori (1992, section 4) for the parameterization of the prisoner’s dilemma game we examined in the pilot experiment and which we intend to use in further experimental sessions. We also establish that under this same parameterization, the cooperative outcome can be supported as equilibrium of the indefinitely repeated game if both players in a fixed pairing adhere to a grim trigger strategy.
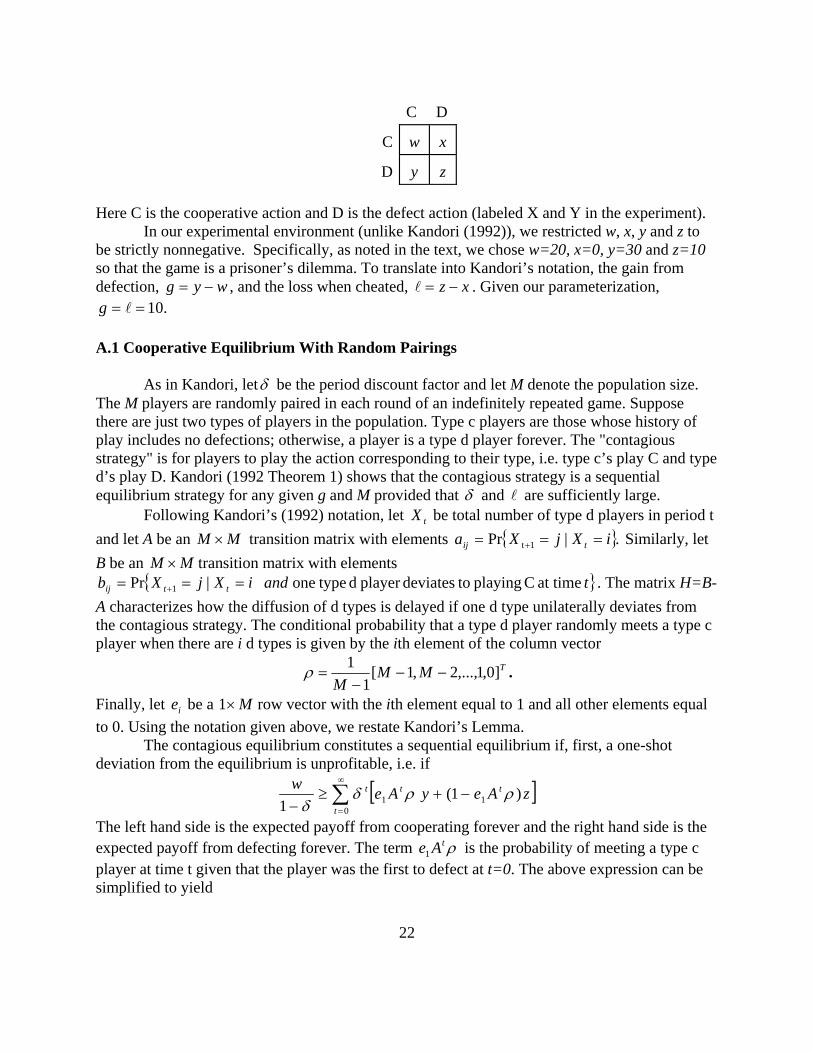
Let the stage game be described by the following symmetric payoff table showing the payoffs to the row player only
15 Experimenters know that subject behavior changes with experience. They wish to give subjects experience with a game without creating a supergame. A concern that subjects may treat all of the repetitions of a game played during an experimental session as a supergame, even when the intent is simply to give subjects experience with the game, has a long history. In commenting on the early Prisoner’s Dilemma experiment conducted by Flood and Dresher, John Nash claimed that “The flaw in this experiment as a test of equilibrium point theory is that the experiment really amounts to having the players play one large multimove game…..Since 100 trials are so long that (backward induction is likely to fail) …it is fairly clear that one should expect (behavior) which is most appropriate for indeterminate end games...” Flood (1958, p. 16).
22
C D
C w x
D y z Here C is the cooperative action and D is the defect action (labeled X and Y in the experiment).
In our experimental environment (unlike Kandori (1992)), we restricted w, x, y and z to be strictly nonnegative. Specifically, as noted in the text, we chose w=20, x=0, y=30 and z=10 so that the game is a prisoner’s dilemma. To translate into Kandori’s notation, the gain from defection, wyg −= , and the loss when cheated, xz −=l . Given our parameterization,
.10== lg A.1 Cooperative Equilibrium With Random Pairings
As in Kandori, letδ be the period discount factor and let M denote the population size. The M players are randomly paired in each round of an indefinitely repeated game. Suppose there are just two types of players in the population. Type c players are those whose history of play includes no defections; otherwise, a player is a type d player forever. The "contagious strategy" is for players to play the action corresponding to their type, i.e. type c’s play C and type d’s play D. Kandori (1992 Theorem 1) shows that the contagious strategy is a sequential equilibrium strategy for any given g and M provided that δ and l are sufficiently large.
Following Kandori’s (1992) notation, let tX be total number of type d players in period t and let A be an MM × transition matrix with elements { }.|Pr 1t iXjXa tij === + Similarly, let B be an MM × transition matrix with elements
{ }tandiXjXb ttij at time C playing todeviatesplayer d typeone |Pr 1 === + . The matrix H=B-A characterizes how the diffusion of d types is delayed if one d type unilaterally deviates from the contagious strategy. The conditional probability that a type d player randomly meets a type c player when there are i d types is given by the ith element of the column vector
TMMM
]0,1,...,2,1[1
1−−
−=ρ .
Finally, let ie be a M×1 row vector with the ith element equal to 1 and all other elements equal to 0. Using the notation given above, we restate Kandori’s Lemma. The contagious equilibrium constitutes a sequential equilibrium if, first, a one-shot deviation from the equilibrium is unprofitable, i.e. if
[ ]∑∞
=
−+≥− 0
11 )1( 1 t
ttt zAeyAew ρρδδ
The left hand side is the expected payoff from cooperating forever and the right hand side is the expected payoff from defecting forever. The term ρtAe1 is the probability of meeting a type c player at time t given that the player was the first to defect at t=0. The above expression can be simplified to yield

23
,) ()1( 11 ρδδ −−−≥
−− AIe
zyzw (1)
which is comparable to equation (1) in Kandori (1992) under his normalization of w=1, z=0 and using the definition y=w+g. A second, sufficient condition for the contagious equilibrium strategy to be equilibrium is that a one-shot deviation off the equilibrium path (a type d plays C) is unprofitable under any consistent belief. Specifically, the condition is that a type d player finds a one-shot deviation from playing D forever to be unprofitable given :,...,3,2 allfor , MkkX t ==
[ ] [ ]∑ ∑∞
=
∞
=
−++⎟⎠⎞
⎜⎝⎛
−−
+⎟⎠⎞
⎜⎝⎛
−−
≥−+0 0
)1( 1
11
)1( t t
tk
tk
ttk
tk
t zBAeyBAexMkw
MkMzAeyAe ρρδδρρδ .
The left hand side is the expected payoff from defecting forever when there are k d-type players including the player himself. The right hand side is what the player earns by deviating in the current period --playing C -- and then playing D forever; )1/()( −− MkM is the probability of meeting a type c player and )1/()1( −− Mk is the probability of meeting a type d player. Finally,
Bek is the distribution of the number of type d players in the next period given that in the current period there are k type d players and one of them (the player under consideration) deviates to playing C in the current period. The above expression can be simplified to yield
,,...3,2for )( ) ( )(11)(
11 MkzyAIHexz
Mkwy
MkM
k =−−≥−⎟⎠⎞
⎜⎝⎛
−−
+−⎟⎠⎞
⎜⎝⎛
−− − ρδδ (2)
which is again comparable to equation (2) in Kandori (1992) under his normalization of w=1, z=0 and using the definition wyg −= and .xz −=l To check whether conditions (1-2) are satisfied under our parameterization of the stage game and for our choices of M and δ , we require the transition matrices A and H. Formulas for constructing these matrices are provided in Kandori (1989) and for completeness we reproduce these formulas here. First, define the number of different ways of forming M/2 pairs out of M individuals,
∏=
−=2/
1
)12()(M
m
mMS .
Using this definition, a closed form solution for the MM × transition matrix A is given by the following formula. For j=i, i+2, i+4,..., min[2i, M], if i is even and for j=i+1, i+3, i+5,..., min[2i, M] if i is odd,
)(
)( )2( ! )(
MS
jMSjiSijijiM
iji
aij
−−−⎟⎟⎠
⎞⎜⎜⎝
⎛−−
⎟⎟⎠
⎞⎜⎜⎝
⎛−
= ,
otherwise .0=ija
A closed form solution for the MM × transition matrix ABhH ij −== )( is given by the following formula. For j=i+2, i+4,..., min[2i, M], if i is even, and for j=i+1, i+3,..., min[2i, M] if i is odd,

24
, and 1, ijjiijij hhai
ijh =⎟⎠⎞
⎜⎝⎛ −
= −
otherwise .0=ijh
Using these definitions for the matrices A and H, we have verified that conditions (1-2) are satisfied for our parameter choices ,90.=δ w=20, x=0, y=30 z=10 for even integer values of M over the range .302 ≤≤ M 16 (The maximum number of computers we have available in our computer laboratory is 30). A.2 Cooperative Equilibrium with Fixed Pairings
When players remain paired with the same player for the duration of an indefinitely repeated game, a strategy where each player plays C in all rounds of the game is an equilibrium under our parameterization if players adhere to a “grim trigger” strategy, i.e. begin by cooperating and if the history of play ever includes a defection, defect forever, otherwise continue cooperating.
Specifically, consider a player who decides to deviate from playing C in the current round. His one time gain from doing so, g=y-w. Since the other player is playing a grim trigger strategy, the deviant player faces a loss of w-z in the following period and forever after. Hence, the cooperative strategy is equilibrium provided that:
∑∞
=
−<−0t
or ),( zwwy tδδ
).(1
zwwy −−
<−δ
δ
This is simply the condition that a deviation from the grim trigger strategy is unprofitable. Since y-w=w-z=10 in our parameterization, this condition reduces to ,50. δ< which is readily satisfied by our choice of .90.=δ Hence, the grim trigger strategy supporting cooperative play is an equilibrium in the fixed pairings environment that we consider.
16 A Mathematica program that checks these conditions is available at http://www.pitt.edu/~jduffy/pd/

25
Appendix B
This appendix provides the written instructions used in the two main treatments of the experiment, the fixed pairings treatment and the random matching I=0 treatment. Instructions for these and all other treatments may be found at http://www.pitt.edu/~jduffy/pd/ B.1 Instructions used in the fixed pairings treatment
Overview
This is an experiment in decision-making. The National Science Foundation has provided funds for this research. During the course of the experiment, you will be called upon to make a series of decisions. If you follow the instructions carefully and make good decisions, you can earn a considerable amount of money which will be paid to you in cash at the end of the experiment. We ask that you not talk with one another for the duration of the experiment. Specifics
The experiment is divided into a series of games. A game will consist of an indefinite number of rounds. At the beginning of each game you will be paired with someone else in this room. You will be paired with this player for one game. In each round both of you will play the game described in the upper center portion of your screen. In this game each of you can make either of two choices, X or Y. The points you earn in a round depends upon both the choice you make and the choice made by the other person with whom you are matched. As the payoff table on your screen indicates: If both of you choose X this round then: you both earn 20 points. If you choose X this round and the other person chooses Y then: you earn 0 points and the other person earns 30 points. If you choose Y this round and the other person chooses X then: you earn 30 points and the other person earns 0 points. If you both choose Y this round then: you both earn 10 points.
To make your choice in each round, click the radio button next to either X or Y. You may change your mind any time prior to clicking the submit button by simply clicking on the button next to X or Y. You are free to choose X or Y in every round. When you are satisfied with your choice, click on the submit button. The computer program will record your choice and the choice made by the player with whom you are matched. After all players have made their choices, the results of the round will appear on the lower portion of your screen. You will be reminded of your own choice and will be shown the choice of the player with whom you are matched as well as the number of points you have earned for the

26
round. Record the results of the round on your RECORD SHEET under the appropriate headings.
Immediately after you have received information on your choice and the choice of the person with whom you are matched for a given round, the computer program will randomly select a number from 1 to 100. The selected number will appear on a popup box in the middle of your screen. If this random number is less than 91, the game will continue into the next round. If the number selected is greater than 90 the game is over. Therefore, after each round there is a 90% chance that you will play another round with the same individual and a 10% chance that the game will end.
Suppose that a number less than 91 has been drawn. Then you click on the OK button, eliminating the popup box, and the next round is played. You will play the same game with the same individual as in the previous rounds Before making you choice, you may review all the outcomes of all of the prior games in the sequence by scrolling down the history record. You then choose either X or Y. Your choice and the choice of the person with whom you are matched are recorded and added to the history record at the lower portion of your screen. You record the outcome and your point earnings for the round. The computer then randomly selects a number between 1 and 100 to determine whether the game continues for another round.
If the number drawn is greater than 90 then the game ends. The experimenter will announce whether or not a new game will be played. If a new game is to be played then you will be matched with someone different from those you have been matched with in prior games. You will be matched with that person for all rounds in the new game. Earnings
Each point that you earn is worth 1 cent ( $.01). Therefore, the more points you earn the more money you earn. You will be paid your earnings from all rounds played today in cash, and in private, at the end of today’s session. Final Comments
First, do not discuss your choices or your results with anyone at any time during the experiment.
Second, your ID# is private. Do not reveal it to anyone.
Third, remember that you are paired with the same individual for the entire sequence of rounds in a given game. Since there is a 90% chance that at the end of a round the sequence will continue, you can expect, on average, to play 10 rounds with the same individual. However, since the stopping decision is made randomly, some sequences may be much longer than 10 rounds and others may be much shorter. Questions? Now is the time for questions. Does anyone have any questions before we begin?

27
B.2 Instructions used in the random pairings, no information (I=0) treatment Overview
This is an experiment in decision-making. The National Science Foundation has provided funds for this research. During the course of the experiment, you will be called upon to make a series of decisions. If you follow the instructions carefully and make good decisions, you can earn a considerable amount of money which will be paid to you in cash at the end of the experiment. We ask that you not talk with one another for the duration of the experiment. Specifics
The experiment is divided into a series of games. A game will consist of an indefinite number of rounds. At the beginning of each round you will be paired with someone else in this room. You will be paired with this player for one round. In each round you will play the game described in the upper center portion of your screen. In this game each of you can make either of two choices, X or Y. The points you earn in a round depends upon both the choice you make and the choice made by the other person with whom you are matched. As the payoff table on your screen indicates: If both of you choose X this round then: you both earn 20 points. If you choose X this round and the other person chooses Y then: you earn 0 points and the other person earns 30 points. If you choose Y this round and the other person chooses X then: you earn 30 points and the other person earns 0 points. If you both choose Y then: you both earn 10 points.
To make your choice in each round, click the radio button next to either X or Y. You may change your mind any time prior to clicking the submit button by simply clicking on the button next to X or Y. You are free to choose X or Y in every round. When you are satisfied with your choice, click the submit button. The computer program will record your choice and the choice made by the player with whom you are matched. After all players have made their choices, the results of the round will appear on the lower portion of your screen. You will be reminded of your own choice and will be shown the choice of the player with whom you are matched as well as the number of points you have earned for the round. Record the results of the round on your RECORD SHEET under the appropriate headings.
Immediately after you have received information on your choice and the choice of
the person with whom you are matched for the round, the computer program will randomly select a number from 1 to 100. The selected number will appear on a popup box in the middle of your screen. If this random number is less than 91, the game will continue into

28
the next round. If the number selected is greater than 90 the sequence is over. Therefore, after each round there is a 90% chance that you will play another round and a 10% chance that the game will end.
Suppose that a number less than 91 has been drawn. Then you press the OK button eliminating the popup box and the next round is played. You will play the same game as in the previous round, but with an individual selected at random from all the individuals in the room. Before making your choice, you may review all the outcomes of all of the prior games in the sequence by scrolling down the history record. You then choose either X or Y. Your choice and the choice of the person with whom you are matched this round are recorded and added to the history record at the lower portion of your screen. You record the outcome and your point earnings for the round. The computer then randomly selects a number between 1 and 100 to determine whether the game continues for another round.
If the number drawn is greater than 90 then the game ends. The experimenter will announce whether or not a new game will be played. If a new game is to be played then you will be matched with someone drawn at random from the other people in the room. The new game will then be played as described above. Earnings
Each point that you earn is worth 1 cent ( $.01). Therefore, the more points you earn the more money you earn. You will be paid your earnings from all rounds played today in cash and in private at the end of today’s session. Final Comments
First, do not discuss your choices or your results with anyone at any time during the experiment.
Second, your ID# is private. Do not reveal it to anyone.
Third, since there is a 90% chance that at the end of a round the sequence will continue, you can expect, on average, to play 10 rounds in a given game sequence. However, since the stopping decision is made randomly, some sequences may be much longer than 10 rounds and others may be much shorter.
Fourth, remember that after each round of a game you will be matched randomly with someone in this room. Therefore, if there are N people in the room the probability of you being matched with the same individual in two consecutive rounds of a game is 1/(N-1). Questions? Now is the time for questions. Does anyone have any questions before we begin?

29
References
Aoyagi, M. and G. Frechette (2003). “Collusion in Repeated Games With Imperfect Monitoring,” unpublished working paper, Osaka University and Harvard University. Andreoni, J. and R. Croson (2002). “Partners versus Strangers: The Effect of Random Rematching in Public Goods Experiments.” to appear in C. Plott and V. Smith, eds., Handbook of Results in Experimental Economics Results Axelrod, R. (1984). The Evolution of Cooperation, Basic Books: New York. Bolton, G.E., E. Katok, and A. Ockenfels (2001). “What’s in a Reputation? Indirect Reciprocity in an Image Scoring Game,” unpublished working paper, Pennsylvania State University and University of Magdeburg. Bolton, G.E. , E. Katok, and A. Ockenfels (2004). “How Effective are Electronic Reputation Mechanisms? An Experimental Investigation.” Management Science 50, 1587-1602 Cooper, R., D. DeJong and R. Forsythe (1996). “Cooperation Without Reputation: Experimental Evidence from Prisoner’s Dilemma Games.” Games and Economic Behavior 12, 187-218. Dal Bó, P. (2005). “Cooperation under the Shadow of the Future: Experimental Evidence from Infinitely Repeated Games,” American Economic Review 95, 1591-1604. Ellison, G. (1994). “Cooperation in the Prisoner's Dilemma with Anonymous Random Matching.” Review of Economic Studies 61, 567-88. Feltovich, N. (2003). “Nonparametric Tests of Differences in Medians: Comparison of the Wilcoxan-Mann-Whitney and Robust Rank-Order Tests.” Experimental Economics 6, 273-297. Flood, M.M. (1958). “Some Experimental Games,” Management Science, 5, 5-26. Greif, A. (1989). “Reputation and Coalitions in Medieval Trade: Evidence on the Maghribi Traders Coalition,” Journal of Economic History, 49, 857-82. Kandori, M. (1989). “Social Norms and Community Enforcement.” CARESS Working Paper No. 89-14, University of Pennsylvania. Kandori, M. (1992). “Social Norms and Community Enforcement.” Review of Economic Studies 59, 63-80. Kreps, D. and R. Wilson (1982). “Reputation and Imperfect Information.” Journal of Economic Theory 27, 253-279.

30
Milgrom, P.R., D.C. North and B.R. Weingast (1990). “The Role of Institutions in the Revival of Trade: The Law Merchant, Private Judges, and the Champagne Fairs.” Economics and Politics 1, 1-23. Palfrey, T.R., and H. Rosenthal (1994). “Repeated Play, Cooperation and Coordination: An Experimental Study.” Review of Economic Studies 61, 545-565. Roth, A.E., and K. Murnighan (1978). “Equilibrium Behavior and Repeated Play of the Prisoner’s Dilemma.” Journal of Mathematical Psychology 17, 189-98. Sabater-Grande, G. and N. Georgantzis (2002). “Accounting for Risk Aversion in Repeated Prisoner’s Dilemma Games: An Experimental Test.” Journal of Economic Behavior and Organization 48, 37-50. Schwartz, S., R. Young, and K. Zvinakis (2000). “Reputation Without Repeated Interaction: A Role for Public Disclosures.” Review of Accounting Studies 5, 351-375. Siegel, S. and N.J. Castellan, Jr. (1988). Nonparametric Statistics for the Behavioral Sciences, 2nd Ed., New York: McGraw Hill. Van Huyck, J.B., J.M. Wildenthal and R.C. Battalio (2002). “Tacit Cooperation, Strategic Uncertainty, and Coordination Failure: Evidence From Repeated Dominance Solvable Games.” Games and Economic Behavior 38, 156-175.
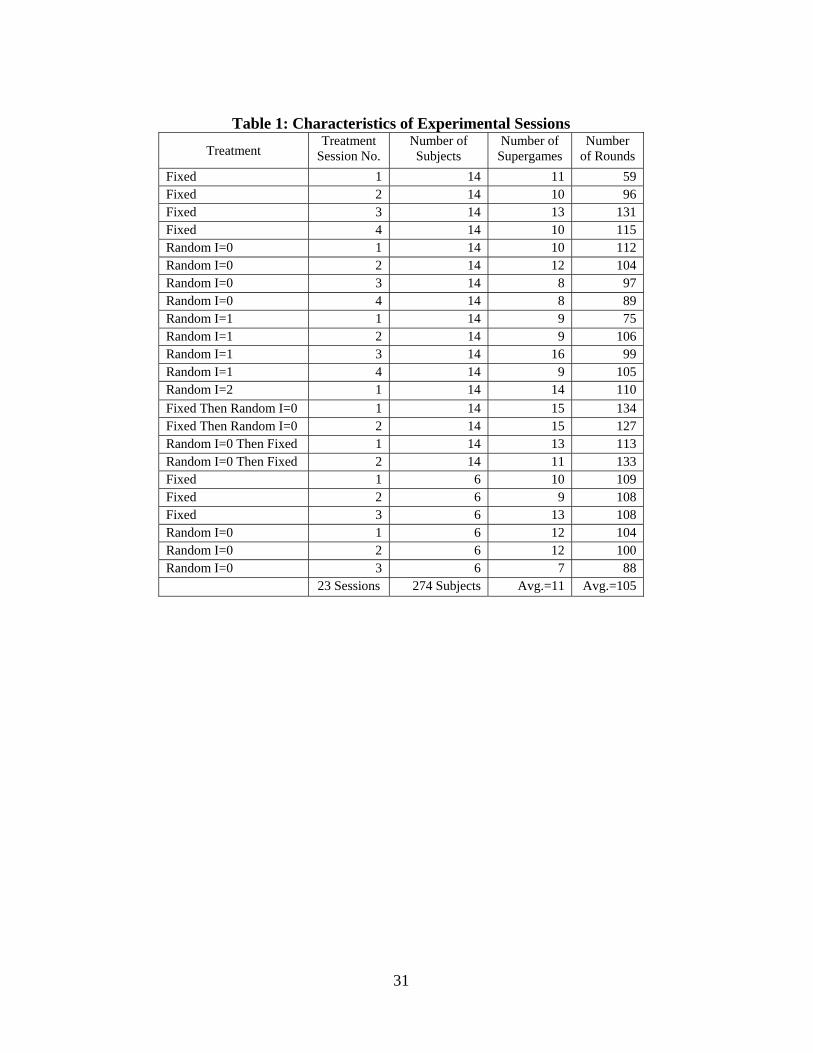
31
Table 1: Characteristics of Experimental Sessions
Treatment Treatment
Session No. Number of Subjects
Number of Supergames
Number of Rounds
Fixed 1 14 11 59 Fixed 2 14 10 96 Fixed 3 14 13 131 Fixed 4 14 10 115 Random I=0 1 14 10 112 Random I=0 2 14 12 104 Random I=0 3 14 8 97 Random I=0 4 14 8 89 Random I=1 1 14 9 75 Random I=1 2 14 9 106 Random I=1 3 14 16 99 Random I=1 4 14 9 105 Random I=2 1 14 14 110 Fixed Then Random I=0 1 14 15 134 Fixed Then Random I=0 2 14 15 127 Random I=0 Then Fixed 1 14 13 113 Random I=0 Then Fixed 2 14 11 133 Fixed 1 6 10 109 Fixed 2 6 9 108 Fixed 3 6 13 108 Random I=0 1 6 12 104 Random I=0 2 6 12 100 Random I=0 3 6 7 88 23 Sessions 274 Subjects Avg.=11 Avg.=105

32
Table 2: Aggregate Frequencies of Cooperation
All Sessions with 14 Subjects and a Single Matching Protocol Game 1, All Rounds First Half of Second Half Fixed Round 1 of All Games the Session of the Session Session 1 0.786 0.548 0.478 0.617 Session 2 0.286 0.576 0.457 0.695 Session 3 0.571 0.477 0.408 0.545 Session 4 0.286 0.608 0.520 0.695 All Sessions 0.482 0.549 0.462 0.634 Game 1, All Rounds First Half of Second Half Random I=0 Round 1 of All Games the Session of the Session Session 1 0.214 0.022 0.034 0.010 Session 2 0.429 0.042 0.080 0.004 Session 3 0.429 0.063 0.097 0.029 Session 4 0.643 0.173 0.211 0.137 All Sessions 0.429 0.075 0.105 0.045 Game 1, All Rounds First Half of Second Half Random I=1 Round 1 of All Games the Session of the Session Session 1 0.429 0.135 0.197 0.075 Session 2 0.500 0.185 0.168 0.202 Session 3 0.571 0.144 0.143 0.144 Session 4 0.571 0.225 0.236 0.214 All Sessions 0.518 0.176 0.186 0.166 Game 1, All Rounds First Half of Second Half Random I=2 Round 1 of All Games the Session of the Session Session 1 0.571 0.158 0.203 0.109
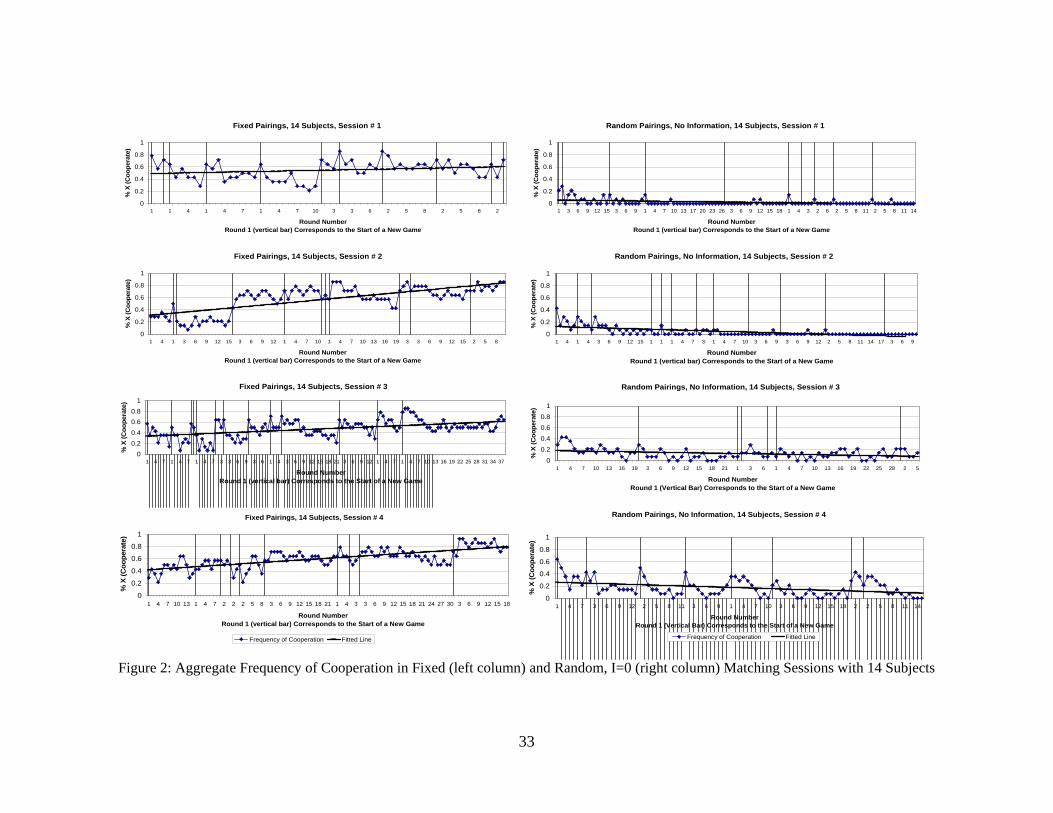
33
Fixed Pairings, 14 Subjects, Session # 1
0
0.2
0.4
0.6
0.8
1
1 1 4 1 4 7 1 4 7 10 3 3 6 2 5 8 2 5 8 2
Round Number Round 1 (vertical bar) Corresponds to the Start of a New Game
% X
(Coo
pera
te)
Fixed Pairings, 14 Subjects, Session # 2
0
0.2
0.4
0.6
0.8
1
1 4 1 3 6 9 12 15 3 6 9 12 1 4 7 10 1 4 7 10 13 16 19 3 3 6 9 12 15 2 5 8
Round Number Round 1 (vertical bar) Corresponds to the Start of a New Game
% X
(Coo
pera
te)
Fixed Pairings, 14 Subjects, Session # 3
00.20.40.60.8
1
1 4 7 1 4 7 1 4 7 3 3 6 9 3 6 1 4 3 6 9 12 15 18 21 3 6 9 12 1 4 7 1 4 7 10 13 16 19 22 25 28 31 34 37
Round Number Round 1 (vertical bar) Corresponds to the Start of a New Game
% X
(Coo
pera
te)
Fixed Pairings, 14 Subjects, Session # 4
0
0.2
0.4
0.6
0.8
1
1 4 7 10 13 1 4 7 2 2 2 5 8 3 6 9 12 15 18 21 1 4 3 3 6 9 12 15 18 21 24 27 30 3 6 9 12 15 18
Round Number Round 1 (vertical bar) Corresponds to the Start of a New Game
% X
(Coo
pera
te)
Frequency of Cooperation Fitted Line
Random Pairings, No Information, 14 Subjects, Session # 1
0
0.2
0.4
0.6
0.8
1
1 3 6 9 12 15 3 6 9 1 4 7 10 13 17 20 23 26 3 6 9 12 15 18 1 4 3 2 6 2 5 8 11 2 5 8 11 14
Round Number Round 1 (vertical bar) Corresponds to the Start of a New Game
% X
(Coo
pera
te)
Random Pairings, No Information, 14 Subjects, Session # 2
0
0.2
0.4
0.6
0.8
1
1 4 1 4 3 6 9 12 15 1 1 1 4 7 3 1 4 7 10 3 6 9 3 6 9 12 2 5 8 11 14 17 3 6 9
Round Number Round 1 (vertical bar) Corresponds to the Start of a New Game
% X
(Coo
pera
te)
Random Pairings, No Information, 14 Subjects, Session # 3
0
0.2
0.40.6
0.8
1
1 4 7 10 13 16 19 3 6 9 12 15 18 21 1 3 6 1 4 7 10 13 16 19 22 25 28 2 5
Round NumberRound 1 (Vertical Bar) Corresponds to the Start of a New Game
% X
(Coo
pera
te)
Random Pairings, No Information, 14 Subjects, Session # 4
0
0.2
0.4
0.6
0.8
1
1 4 7 3 6 9 12 2 5 8 11 3 6 9 1 4 7 10 3 6 9 12 15 18 2 2 5 8 11 14
Round NumberRound 1 (Vertical Bar) Corresponds to the Start of a New Game
% X
(Coo
pera
te)
Frequency of Cooperation Fitted Line
Figure 2: Aggregate Frequency of Cooperation in Fixed (left column) and Random, I=0 (right column) Matching Sessions with 14 Subjects

34
0
0.2
0.4
0.6
0.8%
Coo
pera
tion
Fixed Random(I=0)
Random(I=1)
Random(I=2)
Treatment
Figure 3a: Frequency of Cooperation in First Rounds Versus All Remaining Rounds of All SuperGames, Pooled Data, All
Sessions of a Treatment
All First Rounds All Rounds But First
Figure 3b: Frequency of Cooperation in First Rounds of Supergames 1-10, Pooled Data, All Sessions of a Treatment
00.10.20.30.40.50.60.7
1 2 3 4 5 6 7 8 9 10
Supergame Number
% C
oope
ratio
n
Fixed Random I=0 Random I=1 Random I=2

35
Table 3: Individual Frequencies of Cooperation Fixed Pairings
Cumulative Number (Cum %) of the 14 Subjects Whose Frequency of Cooperation Falls Below Various Thresholds Over All Rounds and Over the 1st Half and the 2nd Half of Each Session
Session 1 Session 2 Session 3 Session 4 Frequency of Cooperation Is:
All Rounds 1st Half 2nd Half
All Rounds 1st Half 2nd Half
All Rounds 1st Half 2nd Half
All Rounds 1st Half 2nd Half
All 4 Sessions Combined Cumulative Frequency All Rounds
<.05 1 (.071) 1 (.071) 1 (.071) 0 (.000) 2 (.143) 0 (.000) 0 (.000) 0 (.000) 1 (.071) 0 (.000) 0 (.000) 0 (.000) 0.018
<.10 1 (.071) 1 (.071) 1 (.071) 1 (.071) 2 (.143) 0 (.000) 2 (.143) 2 (.143) 2 (.143) 0 (.000) 1 (.071) 0 (.000) 0.071
<.25 2 (.143) 3 (.339) 2 (.143) 1 (.071) 2 (.143) 1 (.071) 3 (.214) 4 (.286) 4 (.286) 0 (.000) 1 (.071) 0 (.000) 0.107
<.50 4 (.286) 7 (.500) 5 (.357) 5 (.357) 9 (.643) 2 (.143) 7 (.500) 9 (.643) 7 (.500) 3 (.214) 7 (.500) 3 (.214) 0.339
<.75 11 (.786) 11 (.786) 8 (.571) 11 (.786) 13 (.929) 7 (.500) 10 (.714) 14 (1.00) 8 (.571) 10 (.714) 12 (.857) 6 (.429) 0.750
<=1.0 14 (1.00) 14 (1.00) 14 (1.00) 14 (1.00) 14 (1.00) 14 (1.00) 14 (1.00) 14 (1.00) 14 (1.00) 14 (1.00) 14 (1.00) 14 (1.00) 1.000
Random Pairings I=0
Cumulative Number (Cum %) of the 14 Subjects Whose Frequency of Cooperation Falls Below Various Thresholds Over All Rounds and Over the 1st Half and the 2nd Half of Each Session
Session 1 Session 2 Session 3 Session 4 Frequency of Cooperation Is:
All Rounds 1st Half 2nd Half
All Rounds 1st Half 2nd Half
All Rounds 1st Half 2nd Half
All Rounds 1st Half 2nd Half
All 4 Sessions Combined Cumulative Frequency All Rounds
<.05 13 (.929) 10 (.714) 13 (.929) 9 (.643) 8 (.571) 13 (.929) 4 (.286) 1 (.071) 10 (.714) 1 (.071) 1 (.071) 4 (.286) 0.482 <.10 13 (.929) 13 (.929) 14 (1.00) 12 (.857) 11 (.786) 14 (1.00) 14 (1.00) 8 (.571) 14 (1.00) 3 (.214) 2 (.143) 5 (.357) 0.750 <.25 14 (1.00) 14 (1.00) 14 (1.00) 14 (1.00) 13 (.929) 14 (1.00) 14 (1.00) 14 (1.00) 14 (1.00) 11 (.786) 9 (.643) 12 (.857) 0.946 <.50 14 (1.00) 14 (1.00) 14 (1.00) 14 (1.00) 14 (1.00) 14 (1.00) 14 (1.00) 14 (1.00) 14 (1.00) 14 (1.00) 14 (1.00) 14 (1.00) 1.000 <.75 14 (1.00) 14 (1.00) 14 (1.00) 14 (1.00) 14 (1.00) 14 (1.00) 14 (1.00) 14 (1.00) 14 (1.00) 14 (1.00) 14 (1.00) 14 (1.00) 1.000
<=1.0 14 (1.00) 14 (1.00) 14 (1.00) 14 (1.00) 14 (1.00) 14 (1.00) 14 (1.00) 14 (1.00) 14 (1.00) 14 (1.00) 14 (1.00) 14 (1.00) 1.000
Random Pairings I=1
Cumulative Number (Cum %) of the 14 Subjects Whose Frequency of Cooperation Falls Below Various Thresholds Over All Rounds and Over the 1st Half and the 2nd Half of Each Session
Session 1 Session 2 Session 3 Session 4 Frequency of Cooperation Is:
All Rounds 1st Half 2nd Half
All Rounds 1st Half 2nd Half
All Rounds 1st Half 2nd Half
All Rounds 1st Half 2nd Half
All 4 Sessions Combined Cumulative Frequency All Rounds
<.05 5 (.357) 4 (.286) 8 (.571) 4 (.286) 2 (.143) 7 (.500) 5 (.357) 2 (.143) 7 (.500) 1 (.071) 0 (.000) 5 (.357) 0.268 <.10 7 (.500) 5 (.357) 9 (.643) 6 (.429) 6 (.429) 7 (.500) 6 (.429) 6 (429) 9 (.571) 3 (.214) 1 (.071) 5 (.357) 0.393 <.25 10 (.714) 8 (.571) 14 (1.00) 10 (.714) 9 (.643) 10 (.714) 11 (.786) 12 (.857) 10 (.714) 8 (.571) 6 (.429) 7 (.500) 0.696 <.50 14 (1.00) 14 (1.00) 14 (1.00) 13 (.929) 13 (.929) 12 (.857) 14 (1.00) 14 (1.00) 13 (.929) 14 (1.00) 13 (.929) 13 (.929) 0.982 <.75 14 (1.00) 14 (1.00) 14 (1.00) 13 (.929) 14 (1.00) 13 (.929) 14 (1.00) 14 (1.00) 14 (1.00) 14 (1.00) 14 (1.00) 14 (1.00) 0.982
<=1.0 14 (1.00) 14 (1.00) 14 (1.00) 14 (1.00) 14 (1.00) 14 (1.00) 14 (1.00) 14 (1.00) 14 (1.00) 14 (1.00) 14 (1.00) 14 (1.00) 1.000

36
Figure 4: Change in the Aggregate Frequency of Cooperation from the First to the Last Round of Each Supergame*
(Pooled Data from 4 Fixed Pairing Sessions with 14 Subjects Each)
-0.25
-0.2
-0.15
-0.1
-0.05
0
1 2 3 4 5 6 7 8
Supergame number**
Cha
nge
in %
Coo
pera
tion
* Change is: Avg. % Cooperation in Final Round of Supergame - Avg. % Cooperation in First Round of Supergame. ** Supergames are in the order played, excluding any 1-round supergames.

37
Figure 5: Aggregate Frequency of Cooperation in Fixed (left column) and Random, I=0, (right column) Matching Sessions with 6 Subjects
Random Pairings, No Information, 6 Subjects, Session # 1
0
0.2
0.4
0.6
0.8
1
1 4 7 10 2 2 5 3 6 9 12 1 2 5 8 11 14 3 6 9 12 15 1 1 4 1 4 7 10 13 16 1 4 7 10
Round Number Round 1 (vertical bar) Corresponds to the Start of a New Game
% X
(Coo
pera
te)
Random Pairings, No Information, 6 Subjects, Session # 2
0
0.2
0.4
0.6
0.8
1
1 2 5 8 1 4 1 4 7 2 5 8 11 14 1 4 1 2 5 3 3 6 9 12 15 18 1 4 7 10 13 16 19 1
Round Number Round 1 (vertical bar) Corresponds to the Start of a New Game
% X
(Coo
pera
te)
Fixed Pairings, 6 Subjects, Session # 1
0
0.2
0.4
0.6
0.8
1
1 4 1 2 4 5 7 9 12 15 18 1 3 1 4 7 10 13 16 19 1 3 6 9 12 1 4 7 10 13 16 19 22 25 28 31 34
Round Number Round 1 (vertical bar) Corresponds to the Start of a New Game
% X
(Coo
pera
te)
Fixed Pairings, 6 Subjects, Session # 2
0
0.2
0.4
0.6
0.8
1
1 4 3 6 9 12 1 2 1 4 7 10 13 16 19 22 25 28 31 2 5 8 11 14 17 3 6 9 3 2 5 8 11 14 17 20
Round Number Round 1 (vertical bar) Corresponds to the Start of a New Game
% X
(Coo
pera
te)
Fixed Pairings, 6 Subjects, Session # 3
0
0.2
0.4
0.6
0.8
1
1 5 9 13 1 3 7 11 15 19 4 8 1 2 6 10 2 6 3 7 4 8 12 16 20 24 28
Round NumberRound 1 (vertical bar) corresponds to the Start of a New Game)
% X
(Coo
pera
te)
Frequency of Cooperation Fitted Line
Random Pairings, No Information, 6 Subjects, Session # 3
0
0.2
0.4
0.6
0.8
1
1 3 6 9 12 15 18 21 24 27 30 2 5 8 2 1 4 7 10 13 16 19 22 25 28 3 6 9 2 5
Round Number Round 1 (vertical bar) Corresponds to the Start of a New Game
% X
(Coo
pera
te)
Frequency of Cooperation Fitted Line
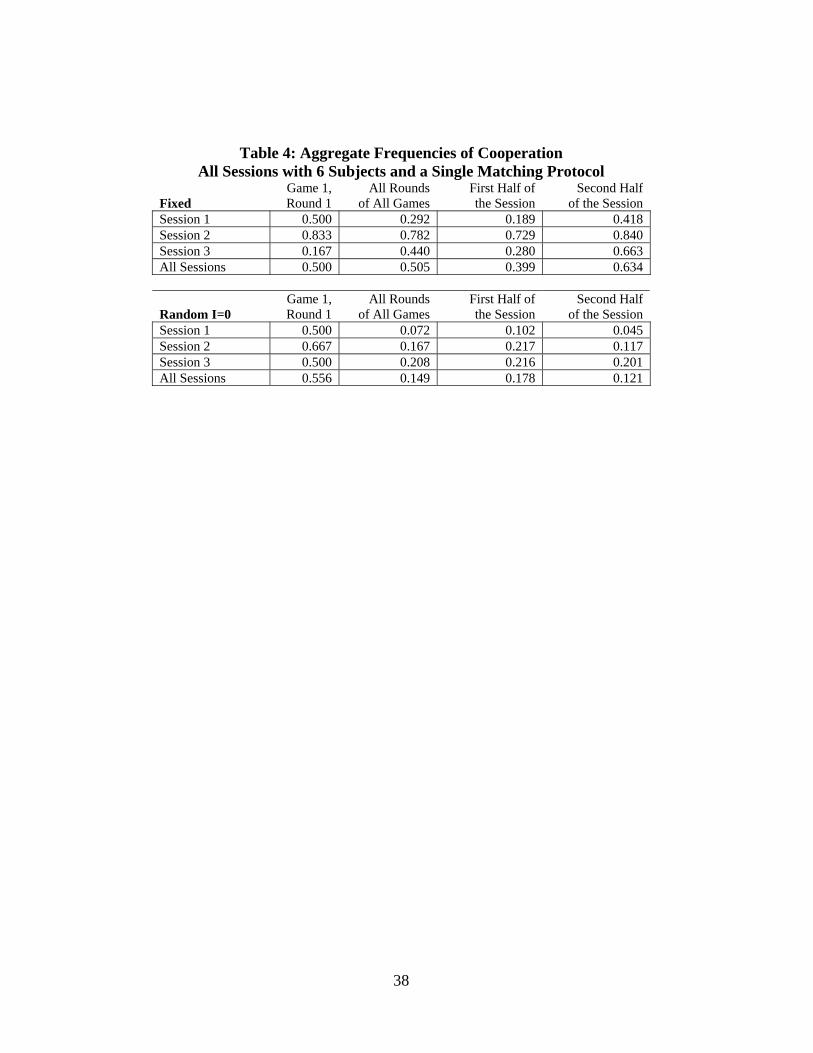
38
Table 4: Aggregate Frequencies of Cooperation All Sessions with 6 Subjects and a Single Matching Protocol
Game 1, All Rounds First Half of Second Half Fixed Round 1 of All Games the Session of the Session Session 1 0.500 0.292 0.189 0.418 Session 2 0.833 0.782 0.729 0.840 Session 3 0.167 0.440 0.280 0.663 All Sessions 0.500 0.505 0.399 0.634 Game 1, All Rounds First Half of Second Half Random I=0 Round 1 of All Games the Session of the Session Session 1 0.500 0.072 0.102 0.045 Session 2 0.667 0.167 0.217 0.117 Session 3 0.500 0.208 0.216 0.201 All Sessions 0.556 0.149 0.178 0.121
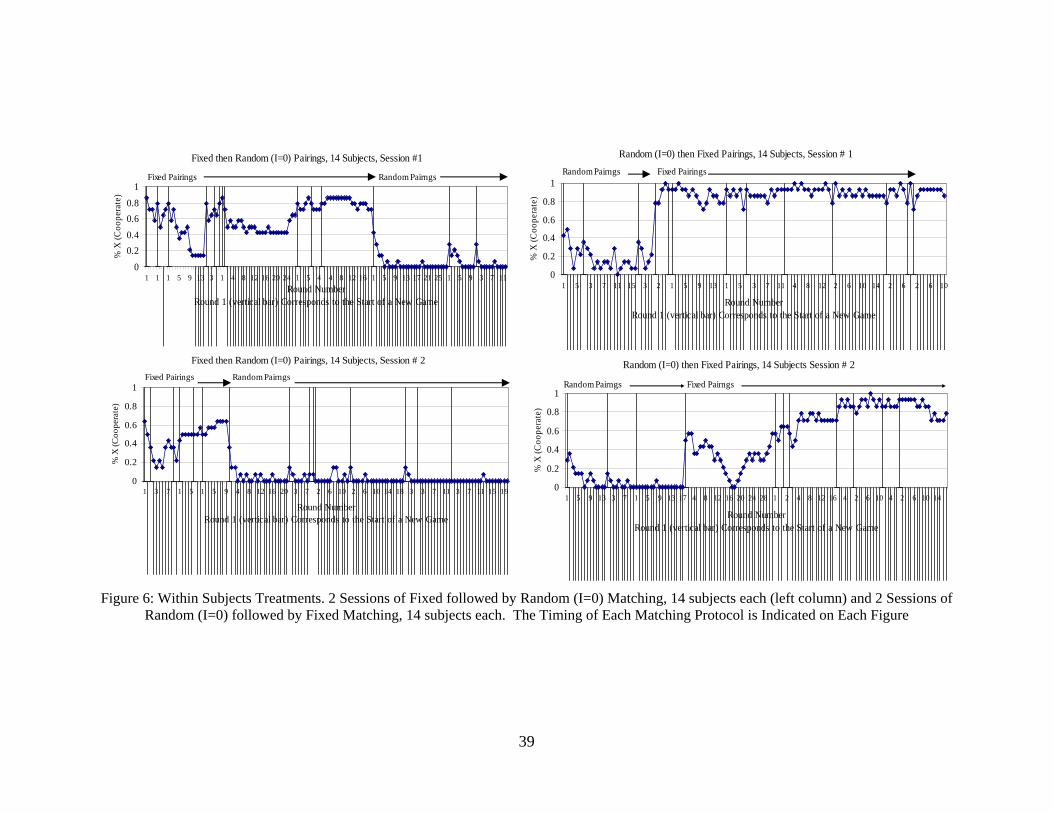
39
Figure 6: Within Subjects Treatments. 2 Sessions of Fixed followed by Random (I=0) Matching, 14 subjects each (left column) and 2 Sessions of Random (I=0) followed by Fixed Matching, 14 subjects each. The Timing of Each Matching Protocol is Indicated on Each Figure
Random (I=0) then Fixed Pairings, 14 Subjects, Session # 1
0
0.2
0.4
0.6
0.8
1
1 5 3 7 11 15 3 2 1 5 9 13 1 5 3 7 11 4 8 12 2 6 10 14 2 6 2 6 10
Round Number Round 1 (vertical bar) Corresponds to the Start of a New Game
% X
(Coo
pera
te)
Fixed PairingsRandom PairngsFixed then Random (I=0) Pairings, 14 Subjects, Session #1
0
0.20.40.60.8
1
1 1 1 5 9 13 3 1 4 8 12 16 20 24 1 5 4 4 8 12 16 1 5 9 13 17 21 25 1 5 9 3 7 11Round Number
Round 1 (vertical bar) Corresponds to the Start of a New Game
% X
(Coo
pera
te)
Random PairngsFixed Pairings
Fixed then Random (I=0) Pairings, 14 Subjects, Session # 2
0
0.2
0.4
0.6
0.8
1
1 3 7 1 5 1 5 9 4 8 12 16 20 3 7 2 6 10 2 6 10 14 18 3 3 7 11 3 7 11 15 19
Round Number Round 1 (vertical bar) Corresponds to the Start of a New Game
% X
(Coo
pera
te)
Fixed Pairings Random PairngsRandom (I=0) then Fixed Pairings, 14 Subjects Session # 2
0
0.2
0.4
0.6
0.8
1
1 5 9 13 3 7 1 5 9 13 17 4 8 12 16 20 24 28 1 2 4 8 12 16 4 2 6 10 4 2 6 10 14
Round Number Round 1 (vertical bar) Corresponds to the Start of a New Game
% X
(Coo
pera
te)
Fixed PairngsRandom Pairngs
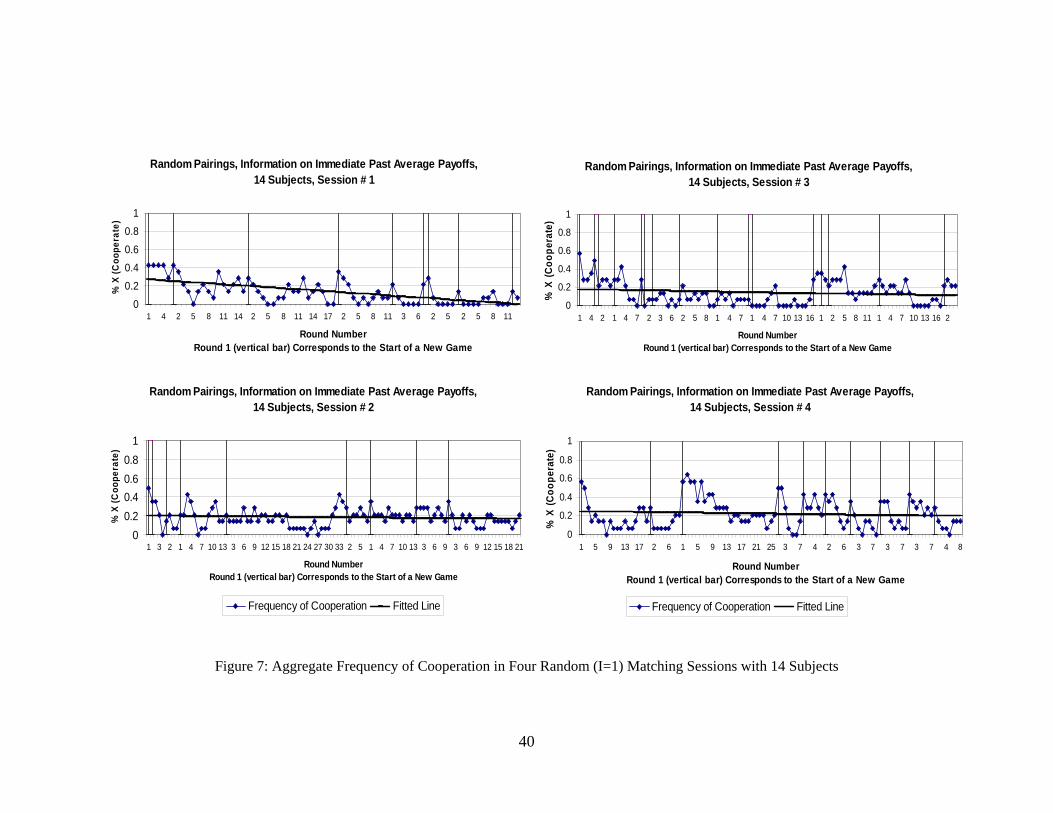
40
Figure 7: Aggregate Frequency of Cooperation in Four Random (I=1) Matching Sessions with 14 Subjects
Random Pairings, Information on Immediate Past Average Payoffs, 14 Subjects, Session # 1
00.20.40.60.8
1
1 4 2 5 8 11 14 2 5 8 11 14 17 2 5 8 11 3 6 2 5 2 5 8 11
Round Number Round 1 (vertical bar) Corresponds to the Start of a New Game
% X
(Coo
pera
te)
Random Pairings, Information on Immediate Past Average Payoffs, 14 Subjects, Session # 2
00.20.40.60.8
1
1 3 2 1 4 7 10 13 3 6 9 12 15 18 21 24 27 30 33 2 5 1 4 7 10 13 3 6 9 3 6 9 12 15 18 21
Round Number Round 1 (vertical bar) Corresponds to the Start of a New Game
% X
(Coo
pera
te)
Frequency of Cooperation Fitted Line
Random Pairings, Information on Immediate Past Average Payoffs, 14 Subjects, Session # 3
0
0.2
0.4
0.6
0.8
1
1 4 2 1 4 7 2 3 6 2 5 8 1 4 7 1 4 7 10 13 16 1 2 5 8 11 1 4 7 10 13 16 2
Round Number Round 1 (vertical bar) Corresponds to the Start of a New Game
% X
(Coo
pera
te)
Random Pairings, Information on Immediate Past Average Payoffs, 14 Subjects, Session # 4
0
0.2
0.4
0.6
0.8
1
1 5 9 13 17 2 6 1 5 9 13 17 21 25 3 7 4 2 6 3 7 3 7 3 7 4 8
Round Number Round 1 (vertical bar) Corresponds to the Start of a New Game
% X
(Coo
pera
te)
Frequency of Cooperation Fitted Line

41
Random Pairings, Information on Past Average Payoffs (I=1) 6 Subjects, Session #1
00.20.40.60.8
1
1 4 7 1 4 1 4 7 10 13 1 1 4 7 10 1 4 7 10 13 16 19 22 25 28 2 5 8 11 3 6 9 12
Round Number Round 1 (vertical bar) Corresponds to the Start of a New Game
% X
(Coo
pera
te)
Frequency of Cooperation Fitted Line
Figure 8: Aggregate Frequency of Cooperation in One Session of Random Pairings with Information on Past Average Payoffs (I=1), 6 Subjects

42
Random Pairings, Information on Immediate Past Actions (I=2) 14 Subjects, Session # 1
00.20.40.60.8
1
1 1 4 2 5 3 6 9 2 5 8 11 14 17 20 23 3 6 9 1 2 5 8 2 5 8 11 2 5 1 1 4 7 10 13 16 19
Round Number Round 1 (vertical bar) Corresponds to the Start of a New Game
% X
(Coo
pera
te)
Frequency of Cooperation Fitted Line
Figure 9: Aggregate Frequency of Cooperation in One Session of Random Pairings with Information on Past Actions of Opponents (I=2), 14 Subjects
Related Documents