COOPERATIVE AND NON-COOPERATIVE SOLUTIONS TO CARBON LEAKAGE Alessandro Antimiani - Valeria Costantini - Chiara Martini Luca Salvatici - Maria Cristina Tommasino Working Paper n° 136, 2011

Welcome message from author
This document is posted to help you gain knowledge. Please leave a comment to let me know what you think about it! Share it to your friends and learn new things together.
Transcript

COOPERATIVE AND NON-COOPERATIVE
SOLUTIONS TO CARBON LEAKAGE
Alessandro Antimiani - Valeria Costantini - Chiara Martini
Luca Salvatici - Maria Cristina Tommasino
Working Paper n° 136, 2011

I Working Papers del Dipartimento di Economia svolgono la funzione di divulgare tempestivamente, in
forma definitiva o provvisoria, i risultati di ricerche scientifiche originali. La loro pubblicazione è
soggetta all'approvazione del Comitato Scientifico.
Per ciascuna pubblicazione vengono soddisfatti gli obblighi previsti dall'art. l del D.L.L. 31.8.1945, n.
660 e successive modifiche.
Copie della presente pubblicazione possono essere richieste alla Redazione.
REDAZIONE:
Dipartimento di Economia
Università degli Studi Roma Tre
Via Silvio D'Amico, 77 - 00145 Roma
Tel. 0039-06-57335655 fax 0039-06-57335771
E-mail: [email protected]
COOPERATIVE AND NON-COOPERATIVE
SOLUTIONS TO CARBON LEAKAGE
Alessandro Antimiani - Valeria Costantini - Chiara Martini
Luca Salvatici - Maria Cristina Tommasino
Comitato Scientifico:
F. De Filippis
A. Giunta
P. Lazzara
L. Mastroeni
S. Terzi

Cooperative and non-cooperative solutions to carbon leakage
Alessandro Antimiani, INEA - Italian Research Institute for Agricultural Economics Valeria Costantini, Department of Economics, Roma Tre University1 Chiara Martini, Department of Economics, Roma Tre University Luca Salvatici, Department of Economics, Roma Tre University Maria Cristina Tommasino, ENEA - Italian National Agency for New Technologies, Energy and Sustainable Economic Development
Abstract A modified version of the CGE GTAP-E model is developed for assessing the economic and carbon emissions effects related to alternative policy measures implemented with the aim of reducing carbon leakage. We explore a set of scenarios, comparing solutions where Annex I countries introduce exogenously or endogenously determined carbon border taxes in order to solve the carbon leakage problem unilaterally. Results provide evidence on the scarce effectiveness of carbon tariffs in reducing carbon leakage and enhancing economic competitiveness, while they have large negative welfare effects not only on the Non-Annex countries, but also on certain Annex I countries.
Keywords: Carbon Leakage, Carbon Border Tax, GTAP-E model J.E.L. codes: Q430; Q470; Q540
1 Corresponding author: Valeria Costantini, Department of Economics, University of Roma Tre, Via Silvio D’Amico 77, 00145 Rome, Italy. Email: [email protected]. Tel. 0039.06.5733.5749 - Fax 0039.06.5733.5771. The authors whish to thank the insights received on a previous version of the paper by participants to the 2011 conference of the European Association of Environmental and Resource Economics (EAERE) held in Rome, and to the 2011 GTAP conference held in Venice. Comments and suggestions received by Roberto Roson and Maria Rosa Virdis are also gratefully acknowledged. This work has been supported by the research network ENEA-INEA-UNIROMA TRE on “Integrating bottom-up and top-down energy models: the case of GTAP-E and Markal-Italy” of which this work is a part.!
2
1. Introduction
In recent years, a large body of the international literature as well as the policy debate have
expressed increasing interest in measures to mitigate the negative externalities of climate
change policies. As a matter of fact, the imposition of stringent climate policies may produce
substantially distortive effects in terms of displacement and re-allocation of carbon intensive
production processes in countries where no climate policies are in force, a phenomenon also
known as carbon leakage effect (OECD, 2006). However, the extent of carbon leakage is
controversial and there is considerable debate on the design of the correct policy mix to
reduce it.
Generally speaking, the potential outcome of unilateral climate change policies may be a
reduction in carbon emissions of abating countries partially undermined by an increase in
carbon emissions by non-compliant countries. This negative outcome may be explained by
relative changes in the comparative advantages between non-compliant and abating
countries, whose climate policies will reduce competitiveness of domestic firms with respect
to foreign production. Consequently, some forms of border adjustments have been invoked
in order to restore a level playing field between domestic producers facing abatement
policies (e.g., carbon tax or emission trading) and foreign exporters subject to a carbon tariff
(Moore, 2010; Wooders and Cosbey, 2010).
The jury is still out on the exact design and practical implementation of these
adjustments, since there are several unresolved issues. In this respect, we will elaborate on
the existing studies providing further evidence about the extent of carbon leakage and the
impact of different forms of Carbon Border Tax (CBT). However, the major focus of the
paper is on the ambiguities regarding the possible goal(s) to be achieved through a CBT. As
a matter of fact, carbon tariffs are often justified both as instruments to reduce the leakage
rate or to restore the competitiveness of domestic firms: our results show that the two goals
are not necessarily overlapping.
In order to quantify in a more realistic way how CBTs influence emission behaviours of
non-compliant countries we develop a modified version of the computable general
equilibrium GTAP-E model (Burniaux and Truong, 2002; McDougall and Golub, 2007) in
order to assess the potential economic and carbon emissions effects related to CBT
adjustment schemes. We refer to the Kyoto objectives as our climate policy framework, to be
able to depict a world where two groups exist, abating and non abating countries. Our
regional aggregation includes the 11 Annex I countries/regions featuring country-specific
CO2 emission reduction commitments listed in the Kyoto Protocol and the largest emerging
economies within the Non-Annex list, including Brazil, China, India and Mexico, that are
3
expected to be the most likely source of carbon leakage. In terms of sectoral aggregation, we
distinguish 21 sectors in order to simulate the impact of alternative policies in energy
intensive and non-intensive sectors.
In order to build a benchmark for investigating the effectiveness of alternative forms of
CBT, we first assess the carbon leakage implied by an international emission reduction
agreement such as the Kyoto Protocol, modelling two scenarios with and without emission
trading. We then compare a cooperative scenario featuring global emission trading where
Non-Annex countries also play an active role with several approaches to deal with the
carbon leakage effect introducing different carbon tariff schemes (hereafter referred to as
non-cooperative scenarios).
On the one hand, in the cooperative scenario Annex I countries face their emission
targets as defined in the Kyoto agreement whereas Non-Annex countries are constrained to
a zero-increase in domestic emissions.
On the other hand, in the non-cooperative scenarios, carbon tariffs are either based on the
domestic carbon tax or endogenously computed as ad valorem equivalents. In the former
case, a specific carbon tariff is computed by multiplying the carbon tax either by the actual
carbon content of imports or by the carbon content of the corresponding domestic good. In
the latter case, the ad valorem tariff equivalent is set either with the aim of eliminating (or at
least reducing) the carbon leakage or with the aim of keeping the competitiveness of Annex I
countries in satisfying their domestic demand.
By applying the exogenously given CBT based on the domestic carbon tax, we assess the
economic impacts of the unilateral policies that are currently discussed in the political debate
especially in the European Union. The effects produced by an exogenous carbon tariff on
competitiveness, welfare changes and emission levels of Non-Annex countries are compared
with those resulting from ‘endogenous tariffs’ (i.e., tariffs computed in order to achieve a
given objective either in terms of leakage or competitiveness). The distance between the
exogenous and the endogenous carbon tariffs gives an idea of the distance between the
policy schemes actually discussed and the motivations put forward by the proponents of
these policies.
The economic and environmental effects resulting from alternative policies applied
unilaterally by Annex I countries are compared with the results from the cooperative - or
zero-leakage - scenario. Such a comparison highlights the advantage for Non-Annex
countries of changing their conservative position in the climate negotiations.
The rest of the paper is structured as follows. In Section 2 we provide a literature review
on carbon leakage and border adjustments. In Section 3 we describe the computable general

4
equilibrium model, the 2012 baseline and the non-cooperative and cooperative scenarios. In
Section 4 we present the main simulation results and Section 5 provides some final remarks.
2. The carbon leakage issue
2.1 The measurement of carbon leakage
A global solution to climate change has not been implemented yet, since the output of
Copenhagen meeting in 2009 was a non-binding agreement. Cancùn negotiations in 2010
represented a step forward for reaching a cooperative solution, but global international
cooperation for fighting climate change still seems a difficult goal to be achieved. For this
reason, policy actions to mitigate climate change and reduce emissions still remain
unilateral. It has already been noted that the efficiency of CO2 reduction policies could be
undermined by the presence of carbon leakage (Hamasaki, 2007). The use of economic
instruments for greenhouse gas (GHG) emission reduction with a non-global approach is
likely to have negative impacts on the international competitiveness of some industrial
sectors, for example, the steel and the cement sectors (OECD, 2003, 2005). If only a few
countries are involved in the implementation of climate change policies, non-abating
countries may have comparative advantages in producing and exporting energy intensive
goods, risking to nullify the efforts of abating countries. Veenendaal and Manders (2008), for
instance, point out that if a coalition of countries committing themselves to reducing GHG
emissions remains limited in its coverage, carbon leakage is likely to occur, partly offsetting
the reduction efforts made by the coalition. The vast and growing literature on this issue
distinguishes two typologies of leakage: the first one is caused by a shift in the location of
production towards non-compliant regions and the second one is related to an increase in
energy consumption in non-abating regions due to the lower prices resulting from the
reduced demand for fossil fuels on the international markets by abating countries.
Imposing stringent climate policies in certain countries may produce substantially
distortive effects in terms of displacement and development of carbon intensive production
processes in countries where no climate policies are in action, in a well consolidated
literature strand referring to the so-called pollution haven effect (Copeland and Taylor,
2004). The pollution haven hypothesis explains the first type of leakage where
carbon/energy intensive firms will move from abating countries to non-abating countries in
order to exploit relative comparative advantages arising from heterogeneous environmental
standards.

5
Carbon leakage due to production relocation is related to the fact that leakage increases
with the intensity of international competition in energy-intensive goods. If this competition
is strong and energy intensive goods are perfectly substitutable in terms of production
location, this will bring production of carbon intensive goods to countries with lower energy
costs. In other words, when countries have different environmental regulatory stringency,
production will be located where environmental costs are lower. As emphasized by Babiker
(2005), in extreme situations where energy-intensive goods produced in different countries
are perfectly homogeneous, the relocation of the production of carbon intensive goods to
non-abating countries is almost complete, leading to carbon leakage rates that can even
exceed 100%.
In addition to the leakage resulting from a shift in production location, a second type of
leakage could result from a substitution effect induced by decreasing carbon-energy demand
in the abating countries and the consequent fall in international energy prices (Gerlagh and
Kuik, 2007). This second type of carbon leakage can be explained by referring to the energy
market model: the reduction in fossil fuel demand in abating countries leads to lower prices
on the world energy markets, which in turn fosters energy demand in non-abating countries
(Burniaux and Oliveira Martins, 2000; Felder and Ruherford, 1993). As a matter of fact, the
relative magnitude of the taxing countries’ energy demand combined with the elasticity of
the energy supply curve are key drivers in determining different types of leakage (Kuik and
Gerlagh, 2003). According to Gerlagh and Kuik (2007), the energy market model seems to
be the prevalent explanation of carbon leakage estimates from simulation analyses.2
The rate of carbon leakage is usually computed as the ratio between the increase of CO2
emissions in non-abating countries and the reduction of CO2 emissions in countries
implementing GHG abatement policies. As reported by the Energy Modeling Forum (2000)
and Kuik and Verbruggen (2002), carbon leakage rates vary widely according to the model
used: 5% (GREEN), 8% (G-Cubed), 9% (GTEM), 11% (Gemini-E3), 14% (WorldScan), 26%
(MS-MRT), 34% (MERGE4).
In addition to these macro leakage rates, sectoral leakage rates can be computed as the
ratio of the additional emissions in each productive sector of Non-Annex I countries to the
emission reduction achieved in Annex I countries in the same sector (Kuik and Ofkes, 2010).
Sectoral rates are useful for understanding which sectors are most responsible for the
leakage rate and which should consequently be targeted by specific trade policy measures.
Even if the implications for international trade of emission abatement policies are crucial,
2 It is also worth noting that this is likely to be the main available mechanism in all models where only a partial international reallocation of factor endowments is allowed, such as the static GTAP-E used in this paper.!
6
especially when considering their acceptability and feasibility, few studies have adopted a
global approach and tried to quantify simultaneously the effects on emissions, sectoral
exports and output of all countries, as well as distributional welfare effects at country level.
Babiker and Jacoby (1999) use the EPPA-GTAP model and find a global leakage rate of
6%: 30% of the leakage is related to China alone and more than 60% to only five countries:
Brazil, China, India, Mexico and South Korea. McKibbin et al. (1999) use the G-Cubed
general equilibrium model and focus on the effects of the tradable emissions permit system
proposed in the Kyoto Protocol on international trade and capital flows. Their results show
a significant carbon leakage effect. Initially, over half of this leakage is due to the lower oil
demand from Annex I countries, and in particular from the US, and the fact that non-
abating countries buy and burn more oil. In the long run, it is economic growth that
produces most of the increase in Non-Annex emissions.
In the analysis developed by Haaparanta et al. (2001) using a modified GTAP-E version,
the leakage rate also decreases when emission permit trading is allowed between Annex I
countries compared to the case where Kyoto targets are only introduced on a national basis.
This result is mainly due to the crucial role played by the Former Soviet Union (FSU),
where emissions increase by 3.2% in the scenario with domestic implementation whereas
with emission permit trading, they are dramatically reduced by almost 60%. Among the
factors that potentially affect carbon leakage, little attention has been paid to changes in
import tariffs. Kuik and Verbruggen (2002) compare a scenario where emissions of Annex I
are constrained to the Kyoto objectives with no change in import tariffs and a similar one in
which tariffs are adjusted to implement the Uruguay Round and find that the leakage rate
increases with trade liberalization.
Carbon leakage estimates seem to be very sensitive to different model settings. Two key
parameters emerge as the driving factors of highly heterogeneous leakage rates: the
Armington elasticities in the import demand module and the substitution elasticities in the
energy nests of the production module (Gerlagh and Kuik, 2007). In particular, if lower
Armington elasticities values are assumed, there will be fewer opportunities for Non-Annex
countries to expand their exports towards compliant countries thus resulting in lower
leakage (McKibbin et al.,1999). Moreover, as a consequence of price impacts of emission
reduction targets, non-abating countries will import less carbon-intensive commodities from
Annex I countries due to changes in their comparative advantages. At the same time, given a
certain value of Armington elasticities, non-abating countries will easily substitute imported
intermediates from Annex I countries with intermediates from other non-abating countries
and substitute aggregate imports with domestic intermediates (Wang et al., 2009) eventually
7
producing a demand-driven leakage effect. In this respect, higher substitution elasticities in
the production function between energy and other inputs, as well as between alternative
fossil fuels, would lead to larger drops in world energy price and hence to larger leakage
rates (Kuik, 2001).
2.2 Alternative carbon border tax designs
Positive analysis on the existence and potential causes of the carbon leakage effect paved the
way for a growing strand of literature dealing with policies that could solve the problem.
We can provide a real-world example: European energy-intensive sectors, facing a price for
carbon emissions, could be at a competitive disadvantage compared with regions with a less
stringent, or inexistent, climate policy, and they are exposed to negative effects in terms of
loss of production and jobs. CBTs could then be introduced with the aim of restoring
competitive fairness and preventing carbon leakage.
Abating countries may decide to impose two forms of CBT: full or partial adjustment.
Full adjustment refers to a carbon tariff (in other words, a carbon border tax) applied to
imported goods from non-compliant countries plus a tax rebate for domestic goods which
are exported.3 Partial adjustment refers to the application of border carbon tariffs without
rebates on exports (Fischer and Fox, 2009). For example, in the European Union (EU), since
it is a net exporter of energy-intensive products, a refund on exports is a more effective
means of supporting employment in sectors covered by the Emission Trading System (ETS)
than a levy on imports (Veenendaal and Manders, 2008).
There is growing concern over CBT as a feasible and effective unilateral policy measure
for preventing carbon leakage. In particular, three major issues arise from the international
literature. The first issue is how to design a CBT which is consistent with WTO rules,
feasible in its implementation, and fair from the point of view of the heterogeneous
exporting countries facing the carbon tariff. Relative to this, there is an open debate on the
possibility of designing CBT adjustments consistent with WTO rules, since trade measures
might contravene WTO’s Article I on most-favoured nation treatment. The question is
whether tons of carbon from domestic or international sources should be treated in the same
way and whether goods are subject to similar treatment. On the other hand, based on Article
XX of the WTO dealing with environmental issues, the absence of a carbon policy in non-
abating countries could be considered an implicit production and export subsidy by abating
countries (Dong and Whalley, 2008). Because of the legal uncertainty, a CBT regime will be
3 In the rest of the paper, the terms “carbon tariff” or “carbon border tax” will be used interchangeably.!
8
controversial and probably lead to a number of disputes between WTO countries
(Messerlin, 2010; Moore, 2010; Wooders and Cosbey, 2010), but we will not be dealing with
this issue in this paper.
More importantly, against the expected benefits of a CBT, there are at least two expected
costs of border adjustments. First, there is a risk that the border adjustment system could be
abused for purely protectionist reasons by compliant countries, and second, there is a real
risk that border adjustments could lead to retaliatory tit-for-tat trade wars, particularly with
developing nations who may believe that developed nations bear a greater responsibility for
curbing climate change (Bordoff, 2008).
While the vast majority of scientific and political documents agree on the value of the
specific tariff which should be taken as equivalent to the specific carbon price in the abating
countries (i.e., equal to the domestic carbon tax or to the net equilibrium permits price if an
emissions trading scheme is allowed), there are different opinions about how to quantify the
embedded carbon in traded goods from non-compliant countries. Two alternative
computation methods are often proposed (Elliot et al., 2010a). The first one is to apply a best
available technology (BAT) approach in the importing country. In this case, the carbon
content for each good produced in the compliant countries is applied to imported goods
coming from non-abating economies. The second one considers the effective carbon content
of the imported goods, thus relying on the production technique applied by the producing
country. This second method could introduce a high degree of uncertainty for exporting
countries and lead to a heterogeneous treatment and a relative penalty for less developed
economies. According to Ismer and Neuhoff (2007), the CBT based on the carbon content of
the imported good as if it would be produced with the BAT in the levying country seems to
be the only trade measure that should be WTO compatible. Moreover, the two computation
methods may be applied twofold: if a direct approach is considered, only carbon emissions
related to the production process are accounted for. If an indirect accounting approach is
implemented, all CO2 emissions related to the production process of all intermediates are
considered for the application of the CBT, leading to substantially higher implementation
difficulties.4 Choosing the indirect emission accounting approach strongly affects carbon
leakage estimates. Atkinson et al. (2010) analyse the total embodied carbon emissions in
goods produced and consumed by different countries, combining the GTAP model with both
the Bilateral Trade Input-Output (BTIO) and Multi-Region Input-Output (MRIO)
approaches. They find that the carbon tariff equivalent to a carbon price of 50$ per ton of
4 Despite the indirect emissions approach seems to be the most promising from an environmental point of view, it should bring to high implementation costs at the administrative level.!

9
CO2 amounts to 10% of the value of the average export bundle of non-abating countries, but
tariffs may be two to three times higher for specific sectors. This suggests that CBTs –
when also indirect emissions are considered – present an higher risk of being trade
distorting and being associated with losses in efficiency and welfare, particularly in low and
middle income countries.
The second question concerns the effectiveness of CBT in preventing carbon leakage
(Schenker and Bucher, 2010). As a matter of fact, empirical analyses provide contrasting
results on the effective capacity of CBTs to reduce emissions from non-abating countries,
depending both on model settings and alternative CBT designs. For example, Mattoo et al.
(2009) show that carbon leakage is a very limited phenomenon, while introducing a CBT
based on the carbon content of imports would seriously damage Non-Annex trading
partners. Such an action would impose average tariffs on merchandise imports from India
and China of over 20 percent and would lower manufacturing exports of these countries
towards Annex I by between 16 and 21 percent. On the contrary, Dong and Whalley (2009)
simulate CBTs based on the emissions generated by comparable domestic production in the
importing country (BAT approach). In this case CBTs effects are generally small, depending
on the emission targets of abating countries, and CBTs contribute to alleviating the carbon
leakage effects.
Adopting a sector-based approach, the picture of the effectiveness of CBTs becomes even
more complex. Kuik and Hofkes (2010) explore the implications of CBTs on the EU ETS,
distinguishing between sectoral and macro rate of leakage. In this case, CBTs impose
significant reductions in sectoral leakage rates and more modest ones in the macro leakage
rate. This is due to the fact that CBTs preserve sectoral competitiveness in abating countries
but do not directly affect the emissions increase by non-compliant countries driven by the
fall in energy prices and the substitution effect which accounts for the largest part of the
macro rate of leakage. At the general level, empirical contributions find that CBTs are not
very effective from an environmental point of view.
A third issue relates to welfare implications of a CBT approach. The degree of political
acceptance of a policy is very likely to depend on its perceived “fairness” in terms of welfare
changes for the different economic agents or countries affected by its implementation
(OECD, 2006). It is worth noting that CBTs clearly represent a second best solution
compared with the implementation of global climate policies which would establish a similar
carbon price for all countries (Stern, 2006).!
10
3. Model and Scenario Setting
3.1 Model description
The Computable General Equilibrium GTAP-E model is an energy-environmental version
of the standard GTAP model specifically designed to simulate GHG emissions mitigation
policies. It includes an explicit treatment of energy demand, the possibility of inter-factor
and inter-fuel substitution, information on carbon dioxide emissions accounting and the
possibility of introducing market-based policy instruments such as carbon taxes or emissions
trading (Burniaux and Truong, 2002; McDougall and Golub, 2007).
As far as the production structure is concerned, GTAP-E adds several substitution nests
such as between a capital-energy composite and other production factors or between capital
and a energy-composite where the latter is obtained by substitution across different energy
commodities.
Carbon taxation is modelled with different tax wedges for firms, private and government
consumption of domestic and imported energy products. An international emissions trading
(IET) scheme, as described in Article 17 of the Kyoto Protocol, is modelled by defining bloc-
level emissions and emissions quotas in the abating (Annex I) countries. Carbon dioxide
emission permits can be traded in an international market where only compliant countries
are allowed to to buy or sell permits. Accordingly, once Kyoto targets for each Annex I
country are established, the model computes the carbon tax required to reach the emission
reduction objectives. The carbon tax represents the marginal cost of abatement equalized
between regions that participate in IET and at equilibrium coincides with the permits price.
If emission trade is not allowed, the carbon tax represents the domestic cost of abatement in
each Annex I country. If we consider the GTAP-E structure, the carbon tax reduces CO2
emissions by augmenting the cost of fossil fuels as inputs in the production and consumption
functions (for firms and private households, respectively).
In this paper, we introduce some changes in the GTAP-E model. First of all, some
substitution elasticities - namely the substitution elasticity between the capital-energy
composite and the other endowments and the substitution elasticity between capital and
energy in all the nests related to the energy composite - were replaced with those proposed
by Beckman and Hertel (2010). The Armington elasticities were also changed as in Hertel et
al. (2007).5 This specific choice allows a better assessment of carbon leakage implications
since the literature agrees on the crucial role of substitution elasticities in the quantification
5 For a comprehensive discussion on substitution elasticities in the energy sector, see Koetse et al. (2008), Okagawa and Ban (2008), while Panagarya et al. (2001) and Welsch (2008) discuss the role of import demand elasticities in international trade.!

11
and geographical distribution of leakage rates.
A second set of changes refers to the data. We updated the GTAP-E dataset using the
latest version of the GTAP Database version 7.1 (base year 2004) as well as the latest
version of the combustion-based CO2 emissions data provided by Lee (2008) for all GTAP
sectors and regions. It is worth mentioning that we introduced some adjustments to specific
sectors and regions where emissions were not consistent with data provided by the main
international energy agencies (EIA-DOE and IEA). Since CO2 emissions data are assigned
to each region/sector on the basis of energy input volumes and emission intensity factors,
we analysed country/sector specific data in order to understand which factors were driving
these distortions the most. We found that for some sectors and regions the emission
intensity factors were indeed much higher than the average leading to a substantial
overestimation of the corresponding emissions reported in the official IEA data on CO2
emissions from fossil fuels combustion. In order to reduce this bias, we replaced the emission
intensity factors for those sectors and regions whose values were out of the range -1/+1
compared with the official IPCC emission intensity factors (Herold, 2003). On the basis of
these new emission intensity factors, we computed adjusted CO2 emissions, obtaining new
values for those sectors/regions characterized by outlier emission factors.
In order to include CO2 emissions in the GTAP-E model, some preliminary changes had
to be made to adapt data to model requirements. Since the most recent CO2 emissions
database do not distinguish between domestic or imported sources, we computed these
shares as proportional to the volumes of domestic production and imports, respectively.
Such a choice is consistent with the methodological assumptions described in Ludena (2007)
and Lee (2008) where CO2 emissions data are calculated from the energy volume data of the
GTAP Version 6 database.6 It is worth noticing that emissions in our version could not
account for all other GHG emissions since they only relate to fossil fuels combustion, thus
providing a lower bound estimate of total emissions and abatement targets. Even if the
missing emissions amount to 15% of total GHG, the underestimation is quite homogeneous
across regions and sectors with the exception of the agricultural and chemical sectors, thus
not influencing the distributive effects of our simulations.
Finally, CO2 emissions are directly linked to the energy commodities considered in the
model such as coal, crude oil, natural gas, refined oil products and gas manufacture and
distribution. CO2 emissions are produced by energy consumption by firms, government and
private households. These direct emissions are taxed without discriminating between the
6 Following Mc Dougall and Golub (2007) and Ludena (2007) we converted emissions data from Ggcos’è? of CO2, as they were expressed in Lee (2008), into million tons of carbon.!
12
source of the energy products. In these sectors, domestic and imported goods are treated
alike and there are no grounds for fearing either carbon leakage or competitive disadvantage
of national firms. As a consequence, all the CBTs described in Section 3.3 only apply to the
sectors where fossil energy sources are burnt producing direct emissions (i.e. emissions
deriving from the use of energy commodities as intermediate inputs). Indirect emissions,
linked to the use of non energy intermediate inputs, whose production implied burning fossil
energy sources and CO2 emissions, are not taken into account.
3.2 Model setting and baseline
In order to simulate different scenarios in the context of an international agreement for the
reduction of CO2 emission we decided to hypothesize the implementation of the abatement
targets of the Kyoto Protocol. To this purpose, an aggregation of 21 sectors and 21 regions
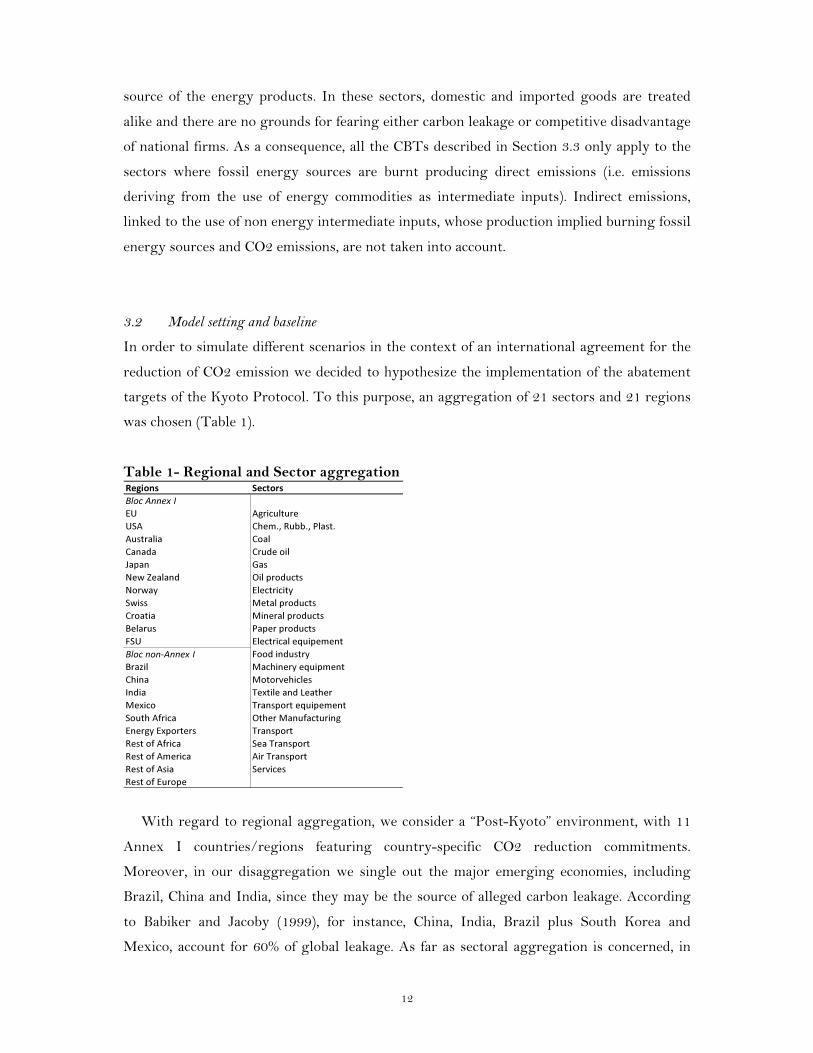
was chosen (Table 1).
Table 1- Regional and Sector aggregation
With regard to regional aggregation, we consider a “Post-Kyoto” environment, with 11
Annex I countries/regions featuring country-specific CO2 reduction commitments.
Moreover, in our disaggregation we single out the major emerging economies, including
Brazil, China and India, since they may be the source of alleged carbon leakage. According
to Babiker and Jacoby (1999), for instance, China, India, Brazil plus South Korea and
Mexico, account for 60% of global leakage. As far as sectoral aggregation is concerned, in
13
addition to the energy sectors such as coal, crude oil, gas,7 refined oil products and
electricity, we singled out energy intensive sectors (e.g., cement, paper, steel and aluminium)
that are expected to be the main sources of carbon leakage.
A 2012 baseline was created based on the GTAP 7.1 database and using 2004 data. To
this end, we build a business as a usual scenario for emissions data assuming a slow
adoption of clean technologies and economic projections to 2012 based on IMF and World
Bank data on actual growth rates after the financial and economic crisis. Several steps were
necessary to obtain a convincing 2012 baseline. We first updated the database to 2008,
assuming population and gross domestic product as reported by the World Bank and IMF
data8 and calibrating the emissions to the most recent IEA CO2 data (IEA, 2010). The same
procedure was adopted to bring the model to 2012. In both cases, while the emissions level
in aggregate was correct, its distribution in terms of emissions quota among regions was not
satisfactory. As a consequence, in the 2008 baseline, we corrected CO2 emissions to fit the
IEA data while in the 2012 baseline, we calibrated the CO2 emissions to the IEA projections
(IEA, 2010b).9
The carbon emissions in the baseline from 2004 to 2008 computed in our version of the
GTAP-E model, which includes the changes in emission intensity factors and substitution
elasticities, are much more consistent with those provided by international IEA. The
improvement obtained is quite substantial since the standard GTAP-E model provides
aggregate results that in some cases are at odds with current data. As a consequence, we are
confident that our specification is able to provide a more accurate assessment of the potential
extent of carbon leakage.10
As a final remark, we would like to mention that CO2 emissions in the GTAP-E model,
as well as the IEA data, refer to fossil fuels emissions only, excluding all other possible CO2
equivalent emission sources. As a consequence, we recomputed the 1990 emission levels in
order to get consistent CO2 emission targets in the implementation of Kyoto Protocol
commitments.11 Even if our ultimate goal is not to provide realistic CO2 projections but to
7 The gas sector in the present aggregation includes the sector of natural gas extraction and gas manufacture and distribution.!8!In order to treat regional GDP as an exogenous variable and to shock it, regional technological progress was taken as an endogenous variable.!9 Emissions have been swapped with technical progress using a specific closure (Altertax) that allows some data to be changed preserving the overall consistency of the model.!10 Robustness checks for model results to different parameters have been addressed by a sensitivity analysis where standard deviation from results in our version is rather small. More importantly, we have also found that relying on original GTAP 7.1 substitution elasticities, carbon leakage would result into overestimated values, especially due to substitution elasticity between capital and energy in the first nest under the production function.!11 In order to make emission levels in GTAP-E model as consistent as possible with those considered for the Kyoto targets by official IPCC documents, we first calculated the deviation between GTAP-E and IPCC
14
compare the economic effects of alternative policy scenarios, it is worth emphasizing that
Annex I emissions in our baseline are almost identical to those proposed by IEA (2010b) and
reported in the most recent European Environmental Agency Report (EEA, 2010).
3.3 Scenario Setting
The rate of carbon leakage is defined as the increase in CO2 emissions in the rest of the
world induced by the domestic reduction measures as a percentage share of the absolute
value of the volume of CO2 reduction obtained by compliant countries (Kuik and Ofkes,
2009). Then, we first check the existence of carbon leakage in a pure Kyoto Protocol
scenario, where we impose reduction targets on all Annex I countries with respect to their
1990 emission levels, as if also the United States ratified the Protocol.
We assess the existence of carbon leakage both allowing for the possibility of emission
trading among Annex I countries (KT scenario) and only implementing domestic measures
(KNT scenario).12 Since results show that emission trading is going to be a more efficient
policy instrument in terms of compliance costs for abating countries and consequently more
convenient in welfare terms at the global level (as explained in details in the results), all the
following simulations assume that the Kyoto Protocol is implemented by allowing for
emission trading (Figure 1).
When simulating emission targets, some corrective measures should be adopted since the
emission permits potentially supplied by transition economies (the FSU and Belarus in our
model) to the carbon market are substantially higher than permits demanded by the other
Annex I countries, resulting in a close-to-zero carbon price. Such uncertainties may be
included in the so-called ‘hot air’ debate which also addresses the role of the other flexible
mechanisms required by the Protocol (World Bank, 2010). In order to avoid these extreme
outcomes, we adjusted, albeit partially, the emission targets for Belarus and the FSU. For
these countries, the emission levels in 2012 represent the reference to which the 0% target
scheduled in the Protocol should be applied, rather than the usual 1990 period, substantially
reducing the permits supply.
emissions data in 2004 and then we proportionally changed the 1990 IPCC emissions data in order to calculate the effective abatement efforts required by the achievement of the Kyoto Protocol targets.!"#!
In this paper, we follow a standard assumption in the literature using applied general equilibrium models, namely that all abating policies may be expressed in monetary values by computing a domestic carbon tax applied to fossil fuels consumption. When we assume the existence of an emission trading system, the carbon tax at equilibrium equals the permits price. We are aware of the existence of more complex policy schemes adopted in many countries, but for the aim of this paper we are only concerned with the relative incidence of the compliance costs with respect to different countries and not to different environmental policies.!

15
Figure 1 – Simulation design
The fact that only some countries, namely the ones in Annex I, contribute to a global
common goal such as the avoidance of climate change is already quite controversial. The
very fact that the efforts made by a group of countries may be undermined, even partially, by
the behaviour of other countries cast serious doubts on the political feasibility of
international negotiations inspired by the Kyoto Protocol agreement. Since domestic firms,
especially in the energy intensive sectors, are going to be hurt by carbon taxes introduced to
meet the abatement targets, several governments are considering introducing taxes on
imports from countries that have not introduced climate change policies so far.
Border tax adjustments could be ‘two-way’ if they were also applied to products exported
to Non-Annex countries as is customary in differences in indirect taxes (e.g., the value added
tax) between trading partners. However, such an export rebate would provide obvious
incentives to keep ‘dirty’ plants operating for export purposes and this would make it even
more difficult for other firms to meet the abatement commitments (Fisher and Fox, 2009).
Consequently, our scenarios are based on ‘one-way’ CBTs, applied to all imported goods that
did not pay for the emissions implied by their production.13
The alternative strategies envisaged in order to cope with carbon leakage usually assume
that carbon tax is extended to imported goods from Non-Annex countries either on the basis
of the carbon intensity of domestic production or on the basis of the emission intensity in the
exporting country. In order to assess the impacts of these implementation choices, we
13 Since in the GTAP-E structure carbon tax is levied on all energy commodities, produced domestically or abroad, carbon tariff is not applied to imported energy commodities, otherwise a double counting problem will arise.!
Figure 1 Simulation design

16
simulate additional counterfactual scenarios not related to the current political debate. In
these scenarios, carbon tariffs are endogenously determined in order to achieve some
predetermined goals such as the elimination of carbon leakage or the preservation of
domestic firms’ competitiveness.
Since we allow for emission trading, CBT scenarios extending the carbon tax to imports
(KT-TCCNK and KT-TCC) are based on a single price for carbon emission, but border
taxes are going to differ by sector according to the carbon contents (Bordoff, 2008). In the
KT-TCCNK scenario, border taxes are based on the carbon content of imported goods
whereas in the KT-TCC scenario, they are based on the carbon content of the corresponding
domestic production in the importing country according to a BTA approach. In the latter
case, all Non-Annex countries face the same (specific) border taxes on their exports to each
Annex I country whereas in the former case, all Annex I countries adopt the same policy
implying different (specific) taxes for the same good according to the country of origin.
The KT-TCCNK scenario is likely to be deemed inconsistent with WTO provisions since
it discriminates between Non-Annex countries as well as between domestic and imported
products that are going to face different carbon taxes. The KT-TCC scenario avoids these
discriminations and it is certainly much more realistic in terms of information requirements,
but it should be noted that the ad valorem equivalent of the tax differs according to the
bilateral flows unit values so that we may well expect exporters of low quality goods to be
worse off. CBTs, as a matter of fact, are established in specific terms (i.e., price per ton of
emissions associated with the production of each good), and it is well-known that specific
tariffs translates into higher ad valorem equivalents for goods featuring lower prices.
These scenarios are close to the current political debate, especially in the EU, where a
non-distorting trade measure which can be designed as the difference between production
costs before and after the imposition of a carbon tax is the same, in absolute terms, in both
Annex I countries and elsewhere. All imports by Annex I countries then face the same price
difference when they enter the foreign markets.
By comparing the performance of these two approaches for CBT implementation in terms
of efficiency and effectiveness in reducing carbon leakage, we join a large and quickly
growing literature. The most innovative part of the paper adds to these somewhat standard
scenarios, where the carbon tariff is exogenously set according to the tax resulting from the
implementation of the abatement targets, other simulations where carbon tariffs are
endogenous. To this end, we start from a given goal, either in terms of carbon leakage or
competitiveness, and use the model to compute the sector-specific ad valorem tariffs that
would allow these goals to be reached. The counterfactual sector-specific tariffs are then
17
imposed by Annex I countries on all imports from the Non-Annex countries. Accordingly,
these tariff surcharges (since they are levied on top of the existing tariff structure) are
uniform across (Annex I) importers and (Non-Annex) exporters.
The first counterfactual scenario (KT-LEAK) targets carbon leakage, and one may think
that an obvious goal would be to keep the overall sectoral emissions in the exporting
countries constant. It turns out that such a goal is not feasible. In the model, as well as in
reality, emissions result from the choices of different agents – governments and households,
for instance – whereas exports only concern firms: even if we introduce prohibitive tariffs,
we cannot claim to influence overall emissions by only affecting a tiny share of production
such as exports. As a consequence, in our simulation, we adopt a closure by swapping the
tariff with the emissions by the exporting countries’ firms. Such a set-up is already quite
insightful: a carbon tariff that completely eliminates carbon leakage simply can not be
implemented, since no tariff can intervene on the energy price fall caused by the decrease on
Annex I countries, and then avoid the corresponding increase in Non-Annex domestic
demand.
As far as the competitiveness scenario is concerned (KT-COMP), we first need to define
what is meant by this elusive term. Given that much of the public debate is supposedly about
unfair competition, we assume that Annex I countries introduce ad valorem tariffs so that the
share of imports from Non-Annex I in total production in each sector remains constant.
All the above simulations have been conceived in a non-cooperative setting where Annex
I countries adopt unilateral policies in order to cope with the fact that other countries do not
act to keep their emissions under control. The final scenario (KT-COOP) simulates the
effects of a cooperative solution where Non-Annex countries do not allow their emissions to
increase with respect to the 2012 baseline. This would eliminate the leakage problem by
definition, since all Non-Annex countries accept to keep their overall emission levels
unchanged. Moreover, the introduction of emission trading at world level would represent
the most efficient way of reaching the emission reduction objectives. Consequently, even if
we do not necessarily consider this scenario a realistic one, we use it as a benchmark in order
to assess the relative benefits and costs of the other non-cooperative scenarios.
4. Empirical Results
We first compare the implementation of the abatement targets with and without an emission
trading scheme (KT and KNT scenarios). Results reported in Table 2 reveal that, when
18
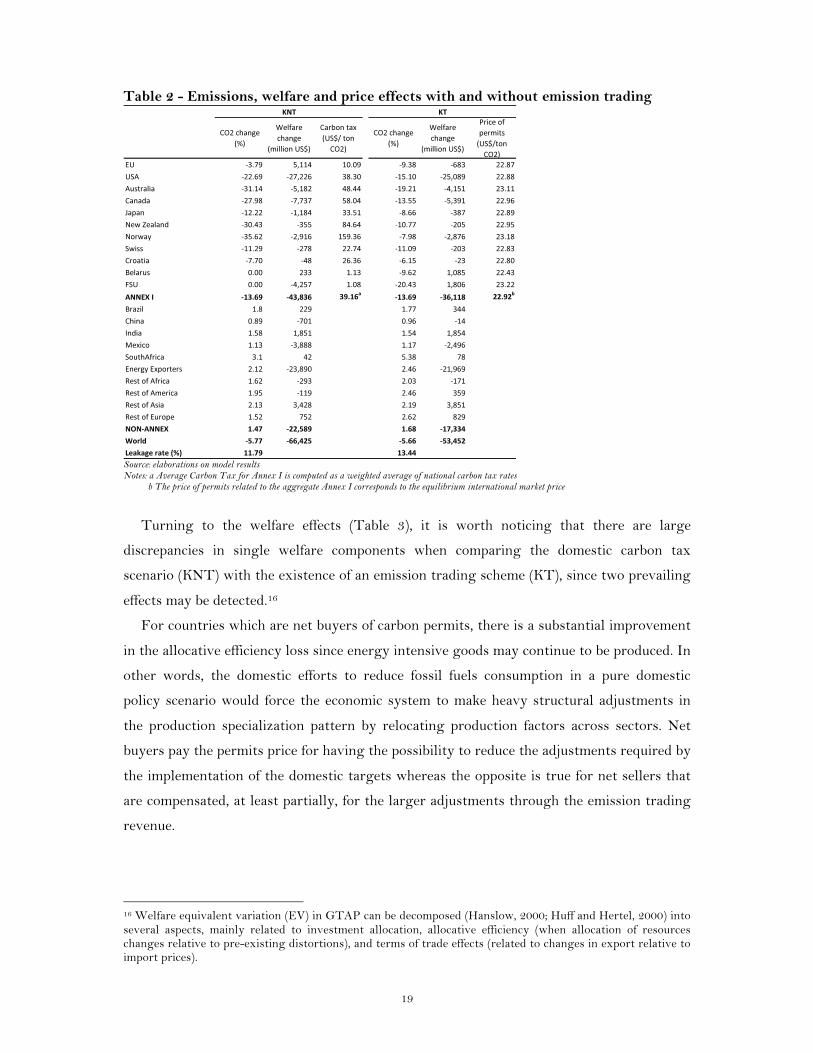
emission trading is allowed, there is a substantial reallocation in emission reductions. In
particular, the United States (US) reduce less with respect to their emissions quota whereas
the EU reduces more. This result is consistent with the expected higher allocative efficiency
of market-based instruments since larger abatement efforts are associated with countries
with lower marginal abatement costs. As a consequence the average domestic carbon tax
level in the KNT scenario (39.16 $ per tCO2) turns out to be much higher than the
equilibrium price for emission permits in the KT scenario (22.92 $ per tCO2). This result is
hardly surprising if we consider that the EU includes 12 new member states which are
characterized by substantially lower marginal abatement costs and less stringent abatement
constraints. The combination of these two elements explains why for the EU as a whole it is
more convenient to reduce emissions below the target, selling emission permits in the
international market. As expected, the other potential seller is FSU, given its production
structure as well as the abundance of fossil fuels endowment (Zhang, 2000, 2001).14
Both simulations generate carbon leakage, but in the KT scenario, the leakage rate is
higher than in the no trade scenario. We can explain this result by considering that, despite
the reduction in energy demand is the same in the KNT and KT scenarios fro Annex I as a
group – since the same overall emission reduction objective should be reached – it is
allocated in a different way. This implies that some large economies with demanding
abatement targets should implement less structural adjustments and undergo a smaller
contraction, showing higher imports from those non-compliant countries than in the KNT
scenario.
At country level, the Non-Annex countries most responsible for carbon leakage in
absolute terms are represented by South Africa, Rest of Europe and Energy exporters
countries,15 and – to a lesser extent – Brazil, India and China.
It is worth mentioning that our results are broadly consistent with previous findings,
such as, for instance, in Elliot et al. (2010b), where the percentage change in emissions
associated to a carbon tax of around 23 US$ per ton of CO2 is in the range of 5-6%, which
corresponds to our 5.66% world emission reduction in the KT scenario.
14 It is worth noticing that in the KNT scenario Belarus and FSU have a zero change constraint to emissions level, in order to reduce the potential dimension of a hot air event. As a check, when simulating a KNT scenario with no constraints for Belarus and FSU, these two countries behave more consistently with a zero constraint rather than with their potential percentage change in a pure Kyoto setting, corresponding to emissions increase by +0.95% and +1.85% with respect to emissions targets of +73% and +48% for Belarus and FSU, respectively.!15 The Energy exporter group represents countries in which energy resources represent the major asset in export flows, as defined by IEA Energy Balances. When Annex I countries apply some abatement strategies, the fossil fuels demand at world level decreases, thus inducing Energy exporters to shift their production structure towards energy intensive industries and explaining their role in producing carbon leakage.!
19
Table 2 - Emissions, welfare and price effects with and without emission trading
Source: elaborations on model results Notes: a Average Carbon Tax for Annex I is computed as a weighted average of national carbon tax rates b The price of permits related to the aggregate Annex I corresponds to the equilibrium international market price
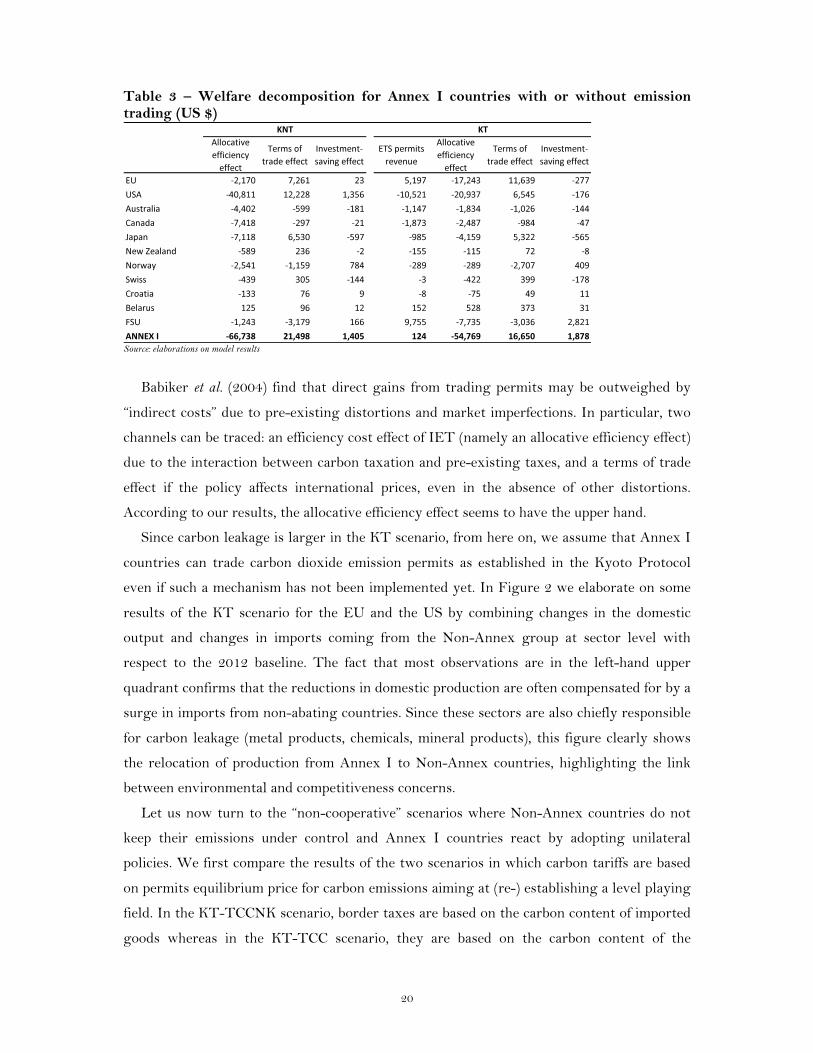
Turning to the welfare effects (Table 3), it is worth noticing that there are large
discrepancies in single welfare components when comparing the domestic carbon tax
scenario (KNT) with the existence of an emission trading scheme (KT), since two prevailing
effects may be detected.16
For countries which are net buyers of carbon permits, there is a substantial improvement
in the allocative efficiency loss since energy intensive goods may continue to be produced. In
other words, the domestic efforts to reduce fossil fuels consumption in a pure domestic
policy scenario would force the economic system to make heavy structural adjustments in
the production specialization pattern by relocating production factors across sectors. Net
buyers pay the permits price for having the possibility to reduce the adjustments required by
the implementation of the domestic targets whereas the opposite is true for net sellers that
are compensated, at least partially, for the larger adjustments through the emission trading
revenue.
16 Welfare equivalent variation (EV) in GTAP can be decomposed (Hanslow, 2000; Huff and Hertel, 2000) into several aspects, mainly related to investment allocation, allocative efficiency (when allocation of resources changes relative to pre-existing distortions), and terms of trade effects (related to changes in export relative to import prices).!
20
Table 3 – Welfare decomposition for Annex I countries with or without emission trading (US $)
Source: elaborations on model results
Babiker et al. (2004) find that direct gains from trading permits may be outweighed by
“indirect costs” due to pre-existing distortions and market imperfections. In particular, two
channels can be traced: an efficiency cost effect of IET (namely an allocative efficiency effect)
due to the interaction between carbon taxation and pre-existing taxes, and a terms of trade
effect if the policy affects international prices, even in the absence of other distortions.
According to our results, the allocative efficiency effect seems to have the upper hand.
Since carbon leakage is larger in the KT scenario, from here on, we assume that Annex I
countries can trade carbon dioxide emission permits as established in the Kyoto Protocol
even if such a mechanism has not been implemented yet. In Figure 2 we elaborate on some
results of the KT scenario for the EU and the US by combining changes in the domestic
output and changes in imports coming from the Non-Annex group at sector level with
respect to the 2012 baseline. The fact that most observations are in the left-hand upper
quadrant confirms that the reductions in domestic production are often compensated for by a
surge in imports from non-abating countries. Since these sectors are also chiefly responsible
for carbon leakage (metal products, chemicals, mineral products), this figure clearly shows
the relocation of production from Annex I to Non-Annex countries, highlighting the link
between environmental and competitiveness concerns.
Let us now turn to the “non-cooperative” scenarios where Non-Annex countries do not
keep their emissions under control and Annex I countries react by adopting unilateral
policies. We first compare the results of the two scenarios in which carbon tariffs are based
on permits equilibrium price for carbon emissions aiming at (re-) establishing a level playing
field. In the KT-TCCNK scenario, border taxes are based on the carbon content of imported
goods whereas in the KT-TCC scenario, they are based on the carbon content of the

21
corresponding domestic production in the importing country. Table 4 summarizes the
results in terms of carbon dioxide emissions and welfare changes for these two scenarios. As
a first result, according to Babiker and Rutherford (2005), the introduction of a CBT is
welfare improving for compliant countries with respect to the no tariff case.
Figure 2 – Changes in domestic output and imports from Non-Annex countries in KT scenario
Source: elaborations on model results
It is worth noting that the distribution of emission reductions across Annex I countries
hardly changes by applying an exogenous CBT. Conversely, the introduction of tariffs
strongly affects the geographical distribution of carbon leakage. In particular, the KT-
TCCNK scenario, where the carbon content is related to the exporting countries, reveals a
larger impact in terms of leakage reduction, especially for Energy exporters, South Africa,
China and India. In any case, the environmental effectiveness of such unilateral policies
seems to be rather small since, although carbon leakage is uniformly reduced across all Non-
Annex countries, the overall change is trivial (especially in the KT-TCC scenario).
This result is hardly surprising if we look at the share of emissions related to exports by
Non-Annex towards Annex I countries (Table 5). The first column includes the amount of
emissions associated with exports for each Non-Annex countries to the Annex-I group in
the KT scenario. If we compare these figures with the total amount of emissions produced by
firms in non-compliant countries (the second column), the share of emissions influenced by
the CBT is rather low (fourth column), and it is even lower if we compare it with total Non-
Annex emissions (third and last columns). In terms of welfare effects, CBTs improve the
terms of trade for Annex I countries while Non-Annex countries register a corresponding
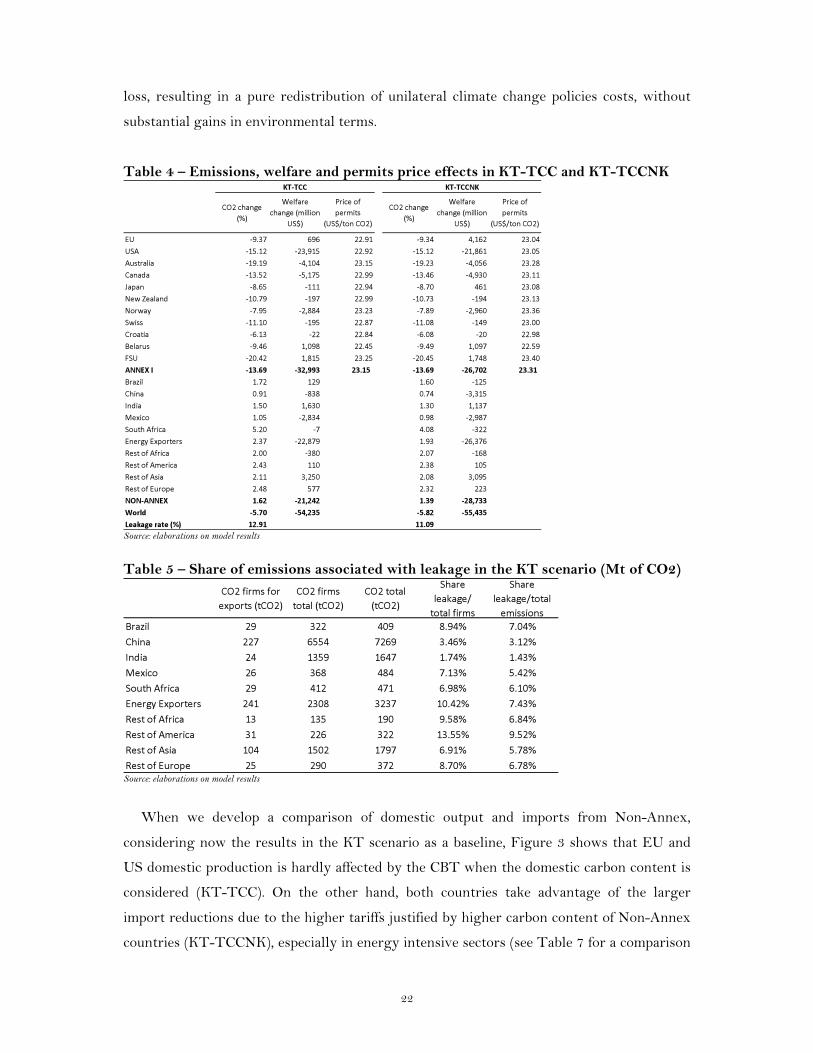
22
loss, resulting in a pure redistribution of unilateral climate change policies costs, without
substantial gains in environmental terms.
Table 4 – Emissions, welfare and permits price effects in KT-TCC and KT-TCCNK
Source: elaborations on model results
Table 5 – Share of emissions associated with leakage in the KT scenario (Mt of CO2)
Source: elaborations on model results
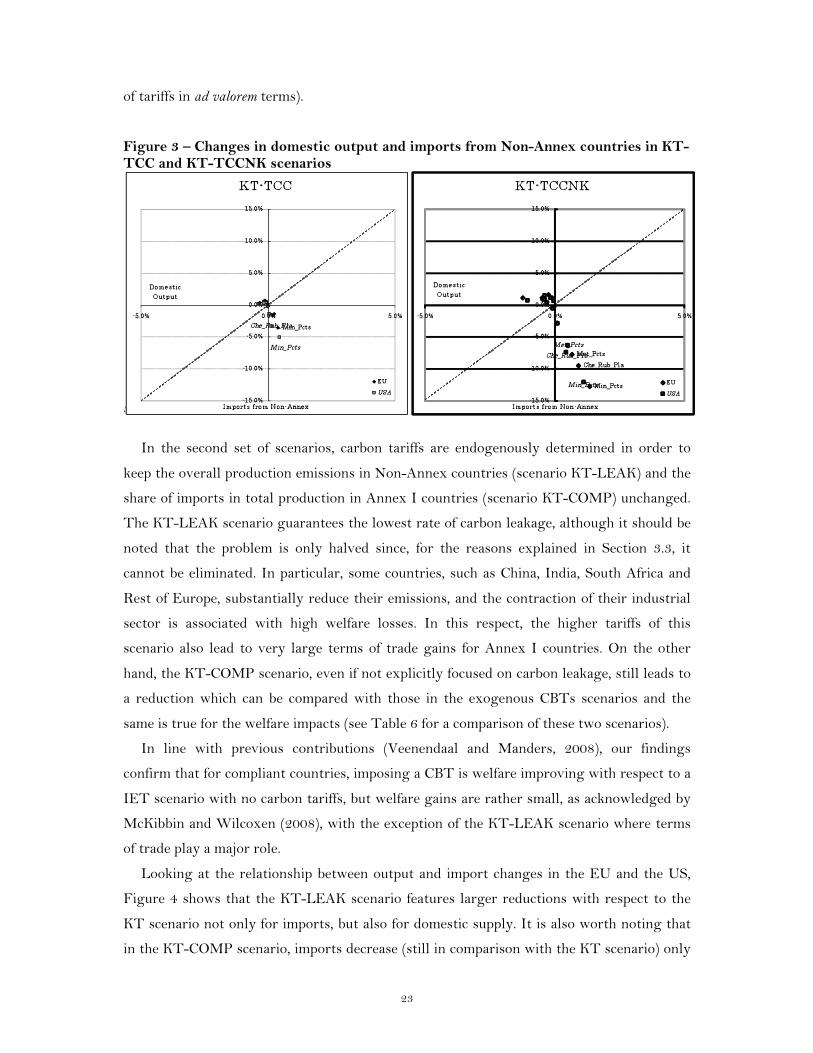
When we develop a comparison of domestic output and imports from Non-Annex,
considering now the results in the KT scenario as a baseline, Figure 3 shows that EU and
US domestic production is hardly affected by the CBT when the domestic carbon content is
considered (KT-TCC). On the other hand, both countries take advantage of the larger
import reductions due to the higher tariffs justified by higher carbon content of Non-Annex
countries (KT-TCCNK), especially in energy intensive sectors (see Table 7 for a comparison
23
of tariffs in ad valorem terms).
Figure 3 – Changes in domestic output and imports from Non-Annex countries in KT-TCC and KT-TCCNK scenarios
Source: elaborations on model results
In the second set of scenarios, carbon tariffs are endogenously determined in order to
keep the overall production emissions in Non-Annex countries (scenario KT-LEAK) and the
share of imports in total production in Annex I countries (scenario KT-COMP) unchanged.
The KT-LEAK scenario guarantees the lowest rate of carbon leakage, although it should be
noted that the problem is only halved since, for the reasons explained in Section 3.3, it
cannot be eliminated. In particular, some countries, such as China, India, South Africa and
Rest of Europe, substantially reduce their emissions, and the contraction of their industrial
sector is associated with high welfare losses. In this respect, the higher tariffs of this
scenario also lead to very large terms of trade gains for Annex I countries. On the other
hand, the KT-COMP scenario, even if not explicitly focused on carbon leakage, still leads to
a reduction which can be compared with those in the exogenous CBTs scenarios and the
same is true for the welfare impacts (see Table 6 for a comparison of these two scenarios).
In line with previous contributions (Veenendaal and Manders, 2008), our findings
confirm that for compliant countries, imposing a CBT is welfare improving with respect to a
IET scenario with no carbon tariffs, but welfare gains are rather small, as acknowledged by
McKibbin and Wilcoxen (2008), with the exception of the KT-LEAK scenario where terms
of trade play a major role.
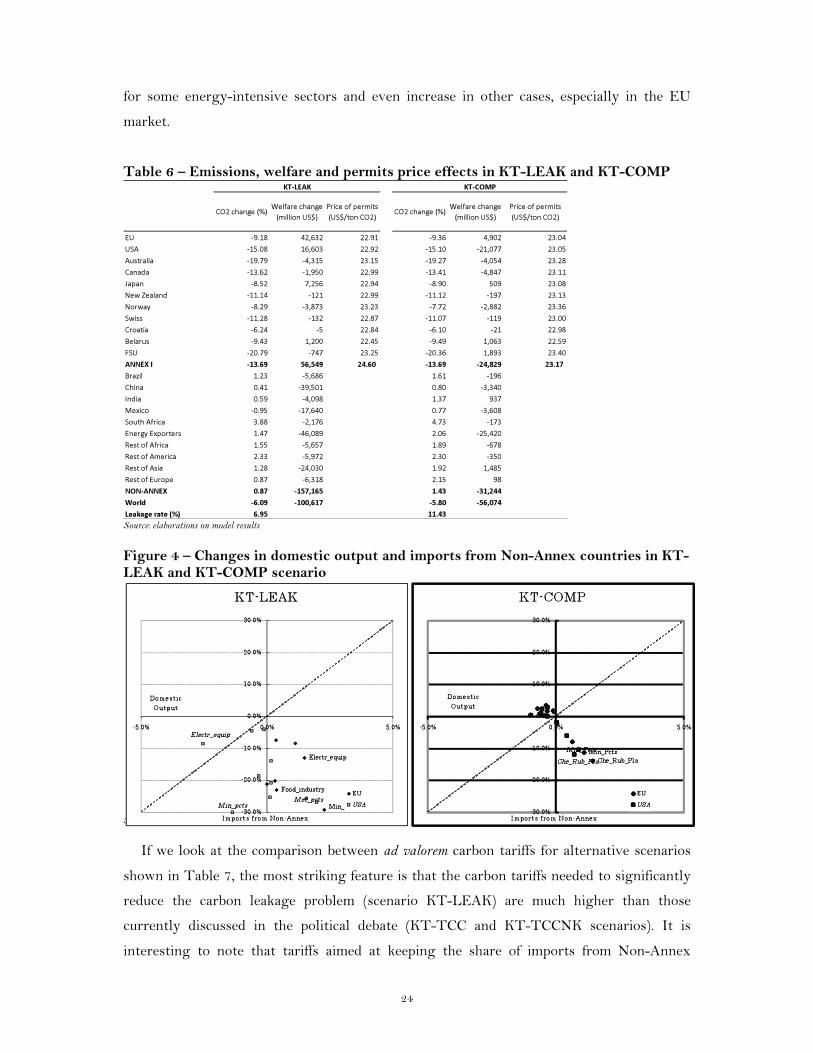
Looking at the relationship between output and import changes in the EU and the US,
Figure 4 shows that the KT-LEAK scenario features larger reductions with respect to the
KT scenario not only for imports, but also for domestic supply. It is also worth noting that
in the KT-COMP scenario, imports decrease (still in comparison with the KT scenario) only
24
for some energy-intensive sectors and even increase in other cases, especially in the EU
market.
Table 6 – Emissions, welfare and permits price effects in KT-LEAK and KT-COMP
Source: elaborations on model results
Figure 4 – Changes in domestic output and imports from Non-Annex countries in KT-LEAK and KT-COMP scenario
Source: elaborations on model results
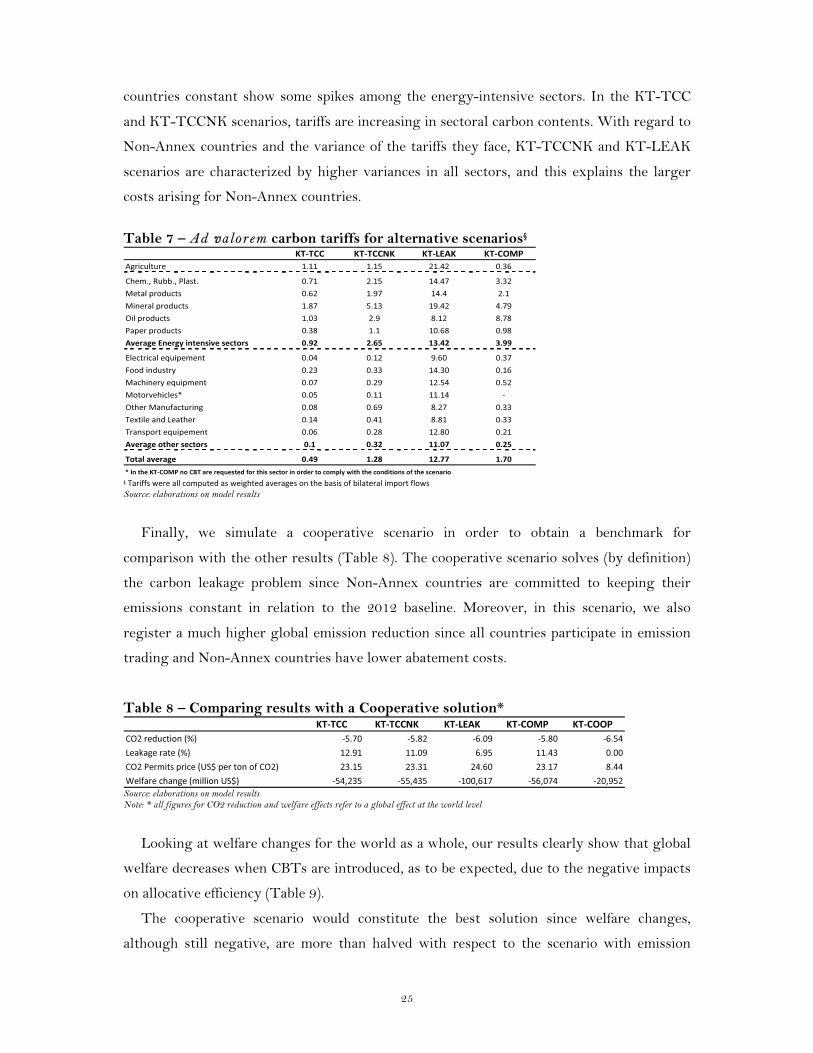
If we look at the comparison between ad valorem carbon tariffs for alternative scenarios
shown in Table 7, the most striking feature is that the carbon tariffs needed to significantly
reduce the carbon leakage problem (scenario KT-LEAK) are much higher than those
currently discussed in the political debate (KT-TCC and KT-TCCNK scenarios). It is
interesting to note that tariffs aimed at keeping the share of imports from Non-Annex
25
countries constant show some spikes among the energy-intensive sectors. In the KT-TCC
and KT-TCCNK scenarios, tariffs are increasing in sectoral carbon contents. With regard to
Non-Annex countries and the variance of the tariffs they face, KT-TCCNK and KT-LEAK
scenarios are characterized by higher variances in all sectors, and this explains the larger
costs arising for Non-Annex countries.
Table 7 – Ad valorem carbon tariffs for alternative scenarios§
§!$%&'(()!*+&+!%,,!-./012+3!%)!*+'452+3!%6+&%4+)!.7!25+!8%)')!.(!8',%2+&%,!'/0.&2!(,.*)!
Source: elaborations on model results
Finally, we simulate a cooperative scenario in order to obtain a benchmark for
comparison with the other results (Table 8). The cooperative scenario solves (by definition)
the carbon leakage problem since Non-Annex countries are committed to keeping their
emissions constant in relation to the 2012 baseline. Moreover, in this scenario, we also
register a much higher global emission reduction since all countries participate in emission
trading and Non-Annex countries have lower abatement costs.
Table 8 – Comparing results with a Cooperative solution*
Source: elaborations on model results Note: * all figures for CO2 reduction and welfare effects refer to a global effect at the world level
Looking at welfare changes for the world as a whole, our results clearly show that global
welfare decreases when CBTs are introduced, as to be expected, due to the negative impacts
on allocative efficiency (Table 9).
The cooperative scenario would constitute the best solution since welfare changes,
although still negative, are more than halved with respect to the scenario with emission
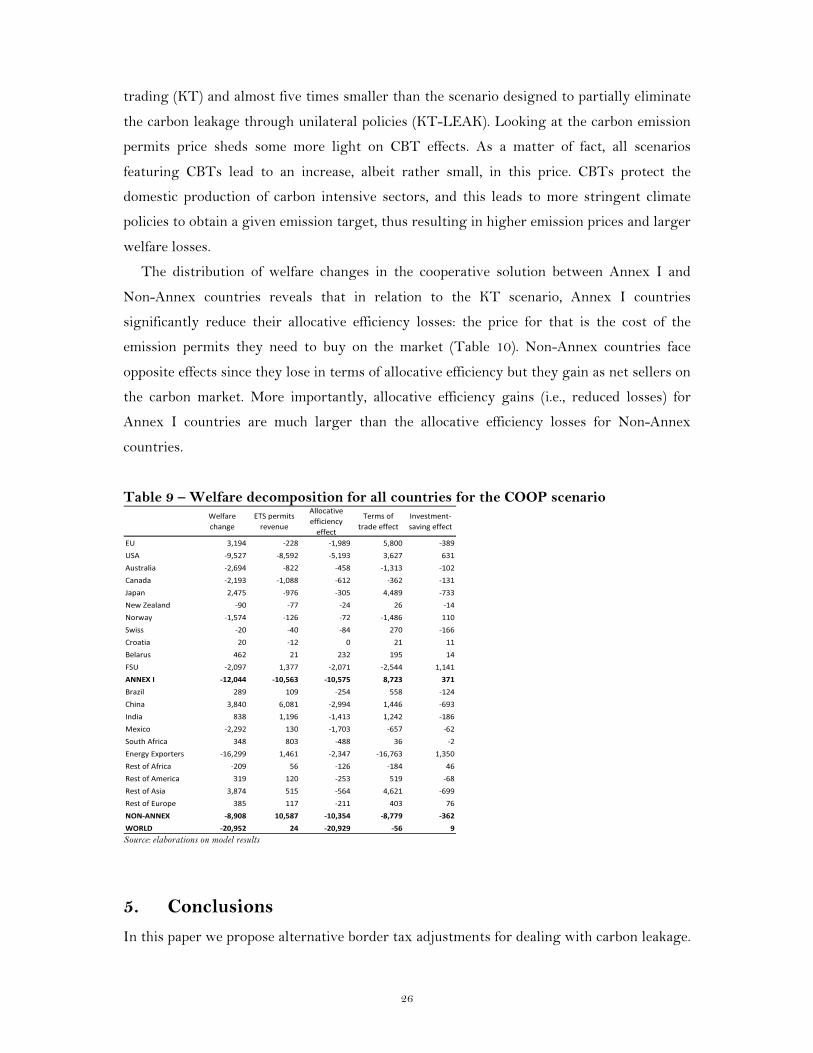
26
trading (KT) and almost five times smaller than the scenario designed to partially eliminate
the carbon leakage through unilateral policies (KT-LEAK). Looking at the carbon emission
permits price sheds some more light on CBT effects. As a matter of fact, all scenarios
featuring CBTs lead to an increase, albeit rather small, in this price. CBTs protect the
domestic production of carbon intensive sectors, and this leads to more stringent climate
policies to obtain a given emission target, thus resulting in higher emission prices and larger
welfare losses.
The distribution of welfare changes in the cooperative solution between Annex I and
Non-Annex countries reveals that in relation to the KT scenario, Annex I countries
significantly reduce their allocative efficiency losses: the price for that is the cost of the
emission permits they need to buy on the market (Table 10). Non-Annex countries face
opposite effects since they lose in terms of allocative efficiency but they gain as net sellers on
the carbon market. More importantly, allocative efficiency gains (i.e., reduced losses) for
Annex I countries are much larger than the allocative efficiency losses for Non-Annex
countries.
Table 9 – Welfare decomposition for all countries for the COOP scenario
Source: elaborations on model results
5. Conclusions
In this paper we propose alternative border tax adjustments for dealing with carbon leakage.
27
We simulate different scenarios to gain a better understanding of to what extent a border
tax is effective in reducing the leakage rate, and if major differences emerge when alternative
CBTs are modelled. More specifically, we are interested in investigating the impact in terms
of leakage reduction and to what extent such trade policies are also a valid instrument for
protecting the economic competitiveness of compliant countries in the international market.
Our results confirm that the effectiveness of CBTs in reducing carbon leakage is limited
and that they could even be damaging in terms of competitiveness. Moreover, border tariff
adjustment compatibility with WTO-rules is still a moot point and justifying them by
climate concerns could open the way to a proliferation of trade measures dealing with other
areas where the competitive playing field is viewed as uneven.
We also provide a comparison with a global cooperative scenario where all countries
contribute to reducing GHG emissions. In the cooperative scenario all major greenhouse gas
emitting countries such as US, China and India participate in emission reduction efforts.
Non-Annex countries pledge to maintain their current emission levels and they play a
relevant role in the attainment of emission reduction target of Annex I countries, by
participating in emission trading and offering cheap abatement opportunities. Our results
suggest that the cooperative scenario would be preferable both in terms of welfare impacts
and efficiency in emission reductions. We show that the cooperative solution is welfare
improving with respect to all CBT forms, while gaining effectiveness in CO2 reduction. This
last point suggests that the bargaining power exerted by Annex I countries in the Post-
Kyoto agreement should be directed towards a global solution rather than towards short-
sighted solutions in which a domestically-oriented point of view prevails losing effectiveness
as well as economic convenience.
28
References
Alexeeva-Talebi, V., Anger, Löschel, A., 2008, Alleviating Adverse Implications of EU Climate Policy on Competitiveness: The Case for Border Tax Adjustments or the Clean Development Mechanism?, ZEW Discussion Paper N. 08-095, Center for European Economic Research, Mannheim, Germany.
Armington, P.S., 1969, A Theory of Demand for Products Distinguished by Place of Production, Staff Papers - International Monetary Fund, Vol. 16 (1), pp. 159-178.
Atkinson, G., Hamilton, K., Ruta, G., Van der Mensbrugghe, D., 2010. Trade In 'Virtual Carbon': Empirical Results and Implications for Policy, World Bank Policy Research Working Paper Series 5194.
Babiker, M.H., 2005, Climate change policy, market structure, and carbon leakage, Journal of International Economics, No. 65 ,pp. 421– 445.
Babiker, M.H., Jacoby, H.D, 1999, Developing country effects of Kyoto-type emissions restrictions, Joint Program on the Science and Policy of Global Change Report No. 53. Massachusetts Institute of Technology, Cambridge.
Babiker, M.H., Reilly J., Viguir, L., 2004, Is International Emissions Trading Always Beneficial? The Energy Journal, Vol. 25, No. 2.
Babiker, M., Rutherford, T., 2005, The economic effects of border measures in subglobal climate agreements, The Energy Journal, Vol. 26 (4), pp. 99-126.
Balassa, B., 1965, Trade liberalization and “revealed” comparative advantage’, The Manchester School of Economic and Social Studies, Vol. 33, pp. 92–123.
Barker, T. Scrieciu, S.!., 2009, Unilateral climate change mitigation, carbon leakage and competitiveness: an application to the European Union, Int. J. Global Warming, Vol. 1 (4), pp. 405–417.
Beckman, J. F., Hertel, T. W. 2010, Validating Energy-Oriented CGE Models, GTAP Working Paper No. 54. Böhringer, C., Löschel, A., Moslener, U., Rutherford, T.F., 2009, EU climate policy up to 2020: An economic
impact assessment, Energy Economics, doi: 10.1016/j.eneco.2009.09.009, forthcoming. Bordoff, J., 2009, International Trade Law and the Economics of Climate Policy: Evaluating the Legality and
Effectiveness of Proposals to Address Competitiveness and Leakage Concerns, in Brainard, L., Sorkin, I. (Eds.), Climate Change, Trade, And Competitiveness: Is a Collision Inevitable (Brookings Trade Forum 2008/2009), The Brookings Institution, Washington DC.
Burniaux, J.M, Truong, T,2002 GTAP-E: An Energy-Environmental Version of the GTAP Model, GTAP Technical paper N°16.
Burniaux, J. and J. Oliveira M. (2000), Carbon Emission Leakages: A General Equilibrium View, OECD Economics Department Working Papers, No. 242,
Dong, Y., Whalley, J., 2009, How Large are the Impacts of Carbon Motivated Border Tax Adjustments, NBER Working Paper No. 15613.
Copeland, B.R., Taylor, M.S., 2004, Trade, Growth, and the Environment, Journal of Economic Literature, Vol. 21, pp. 7-71.
Dong, Y., Whalley, J., 2008, Carbon, Trade Policy, and Carbon Free Trade Areas, NBER Working Paper No. 14431.
EEA, 2010, Annual European Union greenhouse gas inventory 1990 – 2008, Inventory report. Elliott, J., Foster, I., Kortum, S., Munson, T., Pérez Cervantes, F., Weisbach, D., 2010a, Trade and Carbon
Taxes, American Economic Review: Papers & Proceedings, n. 100, pp. 465–469. Elliott, J., Foster, I., Kenneth, L.J., Kortum, S., Munson, T., Pérez Cervantes, F., Weisbach, D., 2010b, A
Quantitative Examination of Trade and Carbon Taxes” Preprint ANL/MCS-P1711–0110, MCS Division, Argonne National Laboratory.
EMF, 2000, EMF 18 Model Comparisons, Energy Modeling Forum, Stanford, February 23-25, 2000. Felder, S., Rutherford, T.F., 1993, Unilateral CO2 Reductions and Carbon Leakage: The Consequences of
International Trade in Oil and Basic Materials, Journal of Environmental Economics and Management, n. 25, pp. 162-176.
Fischer, C., and Fox, A.K., 2009. Comparing policies to combat emissions leakage. Discussion Paper 09-02, Resources for the Future, Washington, DC.
Fullerton, D., Karney, D., 2011, Negative Leakage, CESifo Working Paper Series No. 3379, Ludwig-Maximilians-Universitaet and the Ifo Institute for Economic Research, Munich, Germany.
Gardner, B.L., 1987, The Economics of Agricultural Policies, New York: McGraw-Hill. Gerlagh, R., Kuik, O.J., 2007, Carbon Leakage with International Technology Spillovers, FEEM Nota di
Lavoro No. 33. Gros, D., Egenhofer, C., 2009, Climate Change and Trade: Taxing Carbon at the Border?, Centre for European
Policy Studies (CEPS), Bruxelles. Haaparanta, P., Kerkelä, L., Liski, M., Riipinen, T., Sulamaa, P., 2001, Climate Change Policies, World
Markets, and Finland, Working paper, Helsinki School of Economics. Hamasaki, H., 2007, Carbon Leakage and a Post-Kyoto Framework, Research Paper No.287, Fujitsu Research
Institute.
29
Hanslow, K.J., 2000, A General Welfare Decomposition for CGE Models, GTAP Technical Paper No. 19. Herold, A., 2003, Comparison of CO2 emission factors for fuels used in Greenhouse Gas Inventories and consequences for
monitoring and reporting under the EC emissions trading scheme, ETC/ACC Technical Paper 2003/10, European Topic Centre on Air and Climate Change.
Hertel, T.W., Hummels, D., Ivanic, M. and R. Keeney. 2007. How Confident Can We Be Of CGE-Based Assessments of Free Trade Agreements? Economic Modelling, Vol. 24 (4), pp. 611-635.
Hurt, K.M., Hertel, T.W., 2000, Decomposing Welfare Changes in the GTAP Model, GTAP Technical Paper No. 5.
IEA, 2010a, CO2 Emissions from fuel combustion- Highlights, International Energy Agency, Paris. IEA, 2010b, World Energy Outlook, International Energy Agency, Paris. Ismer, R., Neuhoff, K., 2007, Border tax adjustment: a feasible way to support stringent emission trading,
European Journal of Law and Economics, Vol. 24 (2), pp. 137-164. Karp, L., 2010, Reflections on carbon leakage, paper presented at the 2010 International Agricultural Trade
Research Consortium (IATRC) Annual Meeting, December 12-14, 2010, Berkeley, California. Koetse, M., de Groot, H. and R. Florax, 2008, Capital-Energy Substitution and Shifts in Factor Demand: A
Meta-Analysis. Energy Economics, 30, pp. 2236-2251. Kuik, O.J., 2001, The Effect of Trade Liberalization on Carbon Leakage under the Kyoto Protocol:
Experiments with GTAP-E, Paper prepared for the 4th Annual Conference on Global Economic Analysis, June 27-29, Purdue University, West Lafayette, Indiana, USA.
Kuik, O.J., Verbruggen, H., 2002, The Kyoto Regime, Changing Patterns of International Trade and Carbon Leakage, in: Marsaliani, L., Rauscher, M., Withagen, C. Environmental Economics and International Economy, Kluwer Academic Publishers, Dordrecht, pp. 239-257.
Kuik, O.J., Gerlagh, R., 2003, Trade liberalization and carbon leakage, Energy Journal Vol. 24 (3), pp. 97–120. Kuik O., Hofkes, M., 2010, Border adjustment for European emissions trading: Competitiveness and carbon
leakage, Energy Policy Vol. 38 (4), pp 1741-1748. Lee, H., 2008, An Emissions Data Base for Integrated Assessment of Climate Change Policy Using GTAP. Ludena, C.,2007, CO2 Emissions in GTAP-E: Ready-for-aggregation GTAP 6.0 data. Mattoo, A., Subramanian, A., van der Mensbrugghe, D., He, J., 2009, Reconciling Climate Change and Trade
Policy, Peterson Institute for International Economics, WP 09-15. Manders T., Veenendaal, P., 2008, Border tax adjustments and the EU-ETS, CPB Documents 171, CPB
Netherlands Bureau for Economic Policy Analysis. McDougall, R., Golub, A., 2007, GTAP-E Release 6: A Revised Energy-Environmental Version of the GTAP Model,
GTAP Technical Paper No. 15. McKibbin, W. J., Ross, M. T., Shackleton, R. Wilcoxen,P. J., 1999, Emissions Trading, Capital Flows and the
Kyoto Protocol, Economics and Environment Network Working Papers 9901, Australian National University, Economics and Environment Network.
McKibbin, W.J., Wilcoxen, P.J., 2008, The Economic and Environmental Effects of Border Tax Adjustments for Climate Policy, CAMA Working Papers 2009-09, Australian National University, Centre for Applied Macroeconomic Analysis.
Messerlin, P.A.,2010, Climate Change and Trade Policy,From Mutual Destruction to Mutual Support, World Bank Policy Research Working Paper Series 5378, , The World Bank, Washington DC.
Moore,O.M., 2010, Implementing Carbon Tariffs. A Fool’s Errand? World Bank Policy Research Working Paper Series 5359, The World Bank, Washington DC.
Muth, R.F., 1964, The Derived Demand Curve for a Productive Factor and the Industry Supply Curve, Oxford Economic Papers, Vol. 16, pp. 221-234.
Nijkamp, P., Wang, S., Kremers, H., 2005, Modeling the impacts of international climate change policies in a CGE context: The use of the GTAP-E model, Economic Modelling, Vol. 22, pp. 955-974.
OECD, 2003, Environmental policy in the steel industry: Using economic instruments, OECD, Paris. OECD, 2005, The competitiveness impact of CO2 emissions reduction in the cement sector, OECD, Paris. OECD, 2006, The political economy of environmentally related taxes, OECD, Paris. Okagawa, A. and K. Ban. 2008. Estimation of Substitution Elasticities for CGE Models. Discussion Paper 08-
16, Graduate School of Economics and Osaka School of International Public Policy, Osaka, Japan. Paltsev, S.V., 2001. The Kyoto Protocol: regional and sectoral contributions to the carbon leakage, Energy
Journal, Vol. 22 (4), pp. 53–79. Panagarya, A., Shah, S., Mishra, D., 2001. Demand elasticities in international trade: are they really low?
Journal of Development Economics, n. 64, pp. 313–342. Peterson, E. B., Lee, H. L., 2009, Implications of incorporating domestic margins into analyses of energy
taxation and climate change policies, Economic Modelling, Vol. 26(2), pp. 370-378. Schenker, O., Bucher, R., 2010, On interactions of optimal climate policy and international trade. An
assessment of border carbon measures, University of Bern and Oeschger center for climate change, Munich Personal RePEc Archive.
Sheldon, I., McCorriston, S., 2011, Climate Policy, Carbon Leakage, and Competitiveness: How Might Border
30
Tax Adjustments Help?, Paper presented at the Agricultural & Applied Economics Association’s 2011 AAEA & NAREA Joint Annual Meeting, Pittsburg, Pennsylvania, July 24-26, 2011.
Stern, N, 2006, The Economics of Climate Change - The Stern Review, Cambridge University Press. Van der Berg, J.C.J.M., Faber, A., Idenburg, A., Oosterhuis, F, 2007, Evolutionary Economics and Environmental
Policy, Survival of the Greenest, Cheltenham, Edward Elgar. Veenendaal, P., Manders, T. 2008, Border tax adjustment and the EU-ETS, a quantitative assessment, CPB
Document No. 171, Central Planning Bureau, The Hague. Wang, S., Nijkamp, P., Kuik, O., 2001, Global Environment Change Regimes, Tinbergen Institute Discussion
Papers 01-097/3, Tinbergen Institute. Wang, S., De Groot, H. L. F., Nijkamp, P., Verhoef, E. T., 2009, Global and Regional Impacts of the Clean
Mechanism, Tinbergen Institute Discussion Paper 09-045/3. Welsch, H. 2008. Armington Elasticities for Energy Policy Modeling: Evidence from Four European
Countries. Energy Economics, Vol. 30, pp. 2252-2264. Wooders,P. and Cosbey, A., 2010, Climate-linked tariffs and subsidies: Economics aspects (competitiveness &
leakage), IISD, Thinking Ahead on International Trade (TAIT)- 2nd Conference Climate Change, Trade and Competitiveness: Issues for the WTO.
World Bank, 2010, State and Trends of the Carbon Market 2010, Carbon Finance at the World Bank, Environment Department, World Bank, Washington DC., USA.
Zhang, ZX., 2001, An assessment of the EU proposal for ceilings on the use of Kyoto flexibility mechanisms, Ecological Economics No. 37, pp. 53–69.
Zhang, ZX., 2000, Estimating the size of the potential market for the Kyoto flexibility mechanisms, Review of World Economics Vol. 136 (3), pp. 491–521.
Related Documents