COOPER-framework: A Unified Process for Non-parametric Projects Ali Emrouznejad and Kristof De Witte TIER WORKING PAPER SERIES TIER WP 10/05

Welcome message from author
This document is posted to help you gain knowledge. Please leave a comment to let me know what you think about it! Share it to your friends and learn new things together.
Transcript

COOPER-framework
A Unified Process for
Non-parametric Projects
Ali Emrouznejad and Kristof De Witte
TIER WORKING PAPER SERIES
TIER WP 1005
COOPER-framework A Unified Process for Non-parametric Projects Ali Emrouznejad1 Kristof De Witte2
1 Aston Business School Aston University Birmingham UK Aemrouznejadastonacuk 2 Center for Economic Studies University of Leuven (KUL) Leuven Belgium amp Top Institute for Evidence Based Education Research Maastricht University the Netherlands kristofdewitteeconkuleuvenbe
April 2010
Abstract
Practitioners assess performance of entities in increasingly large and complicated
datasets If non-parametric models such as Data Envelopment Analysis were ever
considered as simple push-button technologies this is impossible when many
variables are available or when data have to be compiled from several sources This
paper introduces by the lsquoCOOPER-frameworkrsquo a comprehensive model for carrying
out non-parametric projects The framework consists of six interrelated phases
Concepts and objectives On structuring data Operational models Performance
comparison model Evaluation and Result and deployment Each of the phases
describes some necessary steps a researcher should examine for a well defined and
repeatable analysis The COOPER-framework provides for the novice analyst
guidance structure and advice for a sound non-parametric analysis The more
experienced analyst benefits from a check list such that important issues are not
forgotten In addition by the use of a standardized framework non-parametric
assessments will be more reliable more repeatable more manageable faster and less
costly
Keywords DEA non-parametric efficiency unified standard process COOPER-
framework
Corresponding Author Ali Emrouznejad Aston Business School Aston University Birmingham
UK Email Aemrouznejadastonacuk Fax 0044 121 204 5271
1
1 Introduction
Efficiency analysis has never been a simple push-bottom technology Within a
performance assessment various interactions can intricate the analysis Indeed
changing the modelling technique or the input or output variables might result in
significantly different efficiency scores Therefore a systematic check list with the
several phases which are required to assess performance would make efficiency
analysis less costly more reliable more repeatable more manageable and faster
In addition the increasing performance of computers enables researchers to evaluate
and examine larger datasets Particularly evaluations of large surveys as in education
(eg the OECD Pisa dataset the Department for Education and Skills in England
(DfES) or the Belgian SiBo) business performance (eg World Economic Forum
CEO confidence surveys) or consumer confidence and the analysis of large statistical
databases (eg on company performances) became possible by increased computing
power Nowadays the weakest link lies (again) with the researcher who has to
overview the dataset Indeed datasets with more than 800 variables (as the Pisa
survey) require significant efforts from the researcher Therefore researchers start
collaborating with different stakeholders (eg policy makers practitioners) who may
be novice users of DEA This in turn makes the analysis more difficult A
standardized process could facilitate the researcher and reduce the possibility of
making mistakes Many studies dealing with large data eg data mining or analysing
complicated processes such as systems engineering have developed step-by-step
frameworks For example see data mining life cycles of CRISP-DM (CRoss Industry
Standard Process for Data Mining) and SEMMA (Sample Explore Modify Model
Assess) and SDLC (Systems Development Life Cycle) as a standard process of
developing systems (Olson and Delen 2008 Cerrito 2007 Blanchard and Fabrycky
2006) This paper presents an alternative step-by-step framework which should
facilitate the collaboration between stakeholders and experienced researchers
In this article we will focus on non-parametric models to examine the performance of
entities Indeed frequently the researcher does not observe the production process
(ie the transformation of inputs into outputs and as such the generic definition of
production process) Whereas parametric models do assume a particular a priori
specification on the production process non-parametric models let the data speak for
2
themselves In particular they estimate the relationship between inputs and outputs
with minimal assumptions (Charnes et al 1985) This makes non-parametric models
extremely attractive We will particularly focus on the widely applied non-parametric
Data Envelopment Analysis (DEA) model (for an overview of more than 4000 papers
published on DEA during 1978 and 2007 see Emrouznejad et al 2008)
Nevertheless the different phases of the suggested framework are not limited to the
traditional DEA model As also other methods follow similar phases the framework
can be used for a Stochastic Frontier Analysis (SFA Meeusen and van den Broeck
1977) or a parametric application with some modification Remark that particular
models (eg order-m bootstrap SFA see below) can not be interchanged (eg there
is no double bootstrap in SFA) Nevertheless a similar framework can be adopted for
parametric methods
The DEA model is based on a linear programming technique which evaluates the
efficiency of entities relative to best practice observations (Charnes et al 1978) To
do so the researcher has to specify input output and exogenous variables Although
this might seem a reasonable task the effort increases significantly when the available
data are growing To this end the present paper introduces a step-by-step framework
to evaluate large and unexplored datasets In this sense the paper links with previous
work of Avkiran (1999) Belton and Vickers (1993) Brown (2006) Dyson et al
(2001) Hollingsworth (2008) and Pedraja-Chaparro et al (1999) Although previous
papers already clearly indicated the pitfalls of DEA (Dyson et al 2001) provided
guidelines for novice users (Avkiran 1999) visual tools for an insightful
implementation (Belton and Vickers 1993) or difficulties and opportunities of
efficiency measurement (Hollingsworth 2008) this paper explicitly targets the
mixture of experienced and novice researchers Indeed frequently experienced
researchers (eg academics or consultants) collaborate with stakeholders (eg civil
servants or CEOs) who are less aware of the various methodological advances in the
literature Without a clear framework the stakeholders may refuse the implementation
of more advanced techniques (and prefer eg a simple bivariate analysis) Only by a
step-by-step analysis which gradually constructs the ultimate model inexperienced
stakeholders may be persuaded of advanced (non-)parametric methods As such (and
in contrast to previous literature) the framework is presented as a process model
which overcomes problem definition data collection model specification and
3
interpretation of the results The process model provides an ultimate tool to guide
novice users through the set-up of an efficiency analysis application
The contributions of the paper arise from three particular features of the proposed
process model that provides both the structure and the flexibility to suit most non-
parametric projects for comparison of a set of entities especially with large number of
units
Firstly the proposed model for processing non-parametric projects can help us
understand and manage interactions in the complex process of efficiency analysis
Therefore for the novice analyst the process model provides guidance helps to
structure the project and gives advice for each phase of the process This should
result in a more reliable model specification (both in terms of modelling technique as
in terms of selecting inputs and outputs) The experienced analyst can benefit from a
check list for each phase to make sure that nothing important has been forgotten But
the most important role of a standard process is to allow systematic treatment for
comprehensive phases in large non-parametric projects which facilitates the process
(eg by making it more repeatable and less expensive)
Secondly structure arises from the checklist for setting up non-parametric analyses
Indeed non-parametric models as DEA (including Free Disposal Hull FDH Deprins
et al 1984) are not push-button technologies but on the contrary a complex process
requiring various tools to identify the appropriate set of inputsoutputs and select a
suitable model The success of non-parametric projects depends on the proper mix of
managerial information and the skills of the analyst
Thirdly consider the flexibility The suggested framework consists of six connected
phases which have various feedback loops This is particularly an attractive feature
for the unexperienced stakeholder who will observe that early (methodological)
choices can have an effect in later phases
In sum the framework helps to link different tools and different people with diverse
skills and backgrounds in order to work on an efficient and effective project
The paper unfolds as follows The next section gives an overview of the proposed
framework Each of the sections 3 to 7 describes a particular phase of the COOPER-
4
framework Indeed each of the phases has several sub-phases which in turn cover a
broad literature We present the sub-phases systematically Finally we present some
concluding remarks
2 The COOPER-framework
In large and complicated datasets a standard process could facilitate performance
assessment and help to (1) translate the aim of the performance measurement to a
series of small tasks (2) select homogeneous DMUs and suggest an appropriate
inputoutput selection (3) detect a suitable model (4) provide means for evaluating
the effectiveness of the results and (5) suggest a proper solution to improve the
efficiency and productivity of entities (also called Decision Making Units DMUs)
We suggest a framework which involves six interrelated phases (1) Concepts and
objectives (2) On structuring data (3) Operational models (4) a Performance
comparison model (5) Evaluation and (6) Results and deployment Taking the first
letter of each phase we obtain the COOPER-framework (in honour of and in
agreement with one of the founders of DEA) Figure 1 systemizes the six phases
5
Figure 1 COOPER-framework a unified standard process
The first two phases of the COOPER-framework ie the lsquoconcepts and objectivesrsquo
and lsquoOn structuring datarsquo correspond to defining the problem and understanding how
decision making units operate The last two phases ie the lsquoevaluationrsquo and lsquoresults
and deploymentrsquo correspond to summarisation of the results and documentation of the
project for non-DEA experts In between we show how to synthesize lsquooperational
modelsrsquo for use as the most appropriate non-parametric model Indeed although we
present the framework for the non-parametric DEA model as mentioned before the
broad ideas of the framework can easily be adapted to other model specifications such
as FDH SFA Corrected Ordinary Least Squares (COLS) or Multi-level Models
(MLM) obviously with some modification Even more before starting the analysis a
researcher does not know ldquowhat is the best methodology to analyse the research
questionrdquo and thus could decide that eg SFA is more appropriate As such the
model specification is an intrinsic part of the process (see phase 3) The selected
model is applied in the lsquoperformance comparisonrsquo phase
Obviously the phases are interrelated and affect each other Therefore we provide
numerous feedback loops connecting the phases This framework is systematically
presented in Figure 2 and summarized in terms of articles in Appendix Basically if a
problem occurs in a particular phase the researcher should go back to previous phases
in chronological order (eg from phase 5 to 4 to 3 etc) Nevertheless reconsidering
a previous phase does not necessarily take a long time Once the problemissue is
analysed and solved the researcher follows again the order of the framework The
relationship between the phases is sometimes very subtle For example the ratio of
the number of observations to the number of inputs and outputs determines the bias on
DEA frontier (because of the lsquocurse of dimensionalityrsquo) As such a decision in a
previous phase creates issues (in this example problems with consistency) in later
phases
Also note that stakeholders regularly help to design the model (which is very often the
case with civil servants and companies because they want to keep control on the
study) As such stakeholders will be very reluctant to assume full availability of data
(because of both practical reason eg the data simply do not exist andor
opportunistic reason eg they do not want to provide sensitive data) Therefore the
6
data collection phase (phase 2) is presented in the framework before the model
construction (phase 4)
Figure 2 Systematic presentation of the COOPER-framework
In the following sections we discuss each of the phases in more detail
3 Concepts and objectives
A very large DEA project generally involves the expertise from numerous individuals
The concepts and objectives phase requires communication skills to work closely
together with the evaluated entities These are often (but not necessarily) the
organisations which are interested in the DEA results Naturally the undertaking of a
collaborative DEA project increases the complexity of the process There are also
potential benefits such as a more in depth analyses additional insights and a broader
range of operational characteristics which can be taken into account by suitably
combining the expertises
7
The concepts and objectives phase (systematically presented in Figure 3) aims at
defining the research question Besides determining the objectives of the study this
involves determining the operational environment of the observations and the
production processes A clear and a priori agreed definition of the environment can
avoid heated discussions in the evaluation of the results (phase 5) Indeed as DEA
measures relative efficiency [ie efficiency relative to best practice observations see
Thanassoulis (2001) and Zhu (2003) for a comprehensive introduction on DEA with a
software tool] it can easily be argued by observations that they are lsquototallyrsquo different
from the other observations in the sample and as such cannot be compared with
them A clear and sound definition of the research question and the operational
environment avoids similar discussions
Once the research question is defined the discussion should focus on the most
appropriate technique to assess the problem Different techniques could yield different
results For example composite indicators summarize the performance on multiple
inputs and multiple outputs in one synthetic indicator This could yield advantages
such as knowing at a single glance the performance easy to discuss with a general
audience and easy to set targets However composite indicators also face some
drawbacks as reducing the information and the necessity to weight the different sub-
indicators (OECD 2008) Every technique for composite indicators (eg DEA SFA
performance indicators) has its own peculiarities The different stakeholders should be
aware of this in order to avoid again discussion in the evaluation phase (for a
discussion on the peculiarities of the techniques see Fried et al 2008)
Every study balances on the trade-off between an analysis on micro-level or on
macro-level Micro-level studies have the advantage that they (normally) contain
more observations and are better comparable to each other Macro-level observations
allow the researcher to overview a broader picture but contain less observations
Directly connected to this trade-off is the issue on the identification of the appropriate
level of decision making ie can the micro (macro)-level act independently
A final step in the first phase consists of designing the project plan This should be
seen as broad as possible It again aims at avoiding discussion in the evaluation
phase Indeed empirical applications in general and data-driven approaches as DEA
in particular are sometimes sensitive to the provided data Traditional frontier
8
techniques such as DEA are deterministic techniques (ie they do not allow for
noise) they may be sensitive to outlying observations (eg Simar 1996) The latter
could arise from measurement errors or atypical observations Banker and Natarajan
(2004) supplied statistical tests based on DEA efficiency scores Therefore this step
should carefully examine the availability of correctly measured data In addition once
the objectives and the evaluation technique are determined the stakeholders should
agree on the criteria to evaluate the results For example will they use a ldquonaming and
shamingrdquo approach (ie sunshine regulation Marques 2006) a ldquoyardstick
competition approachrdquo (ie using the outcomes to set maximum prices or revenues
Bogetoft 1997) or will the results only be reported internally etc
Figure 3 Concepts and objectives phase
9
4 On structuring data
Having settled some preliminary questions in the first phase in a second phase the
researcher can start the analysis with the initial data collection Especially in large
datasets it is worthwhile spending sufficient time with this phase (summarized in
Figure 4) Various variables are potentially available and differences between them
are sometimes subtle In order to examine the research question from phase 1
additional data sources (such as statistical databases annual accounts or price
information) should have been consulted This requires a sound method of data
collection (in order to allow for reproduction of the dataset in the future) The latter is
facilitated if a clear data collection routine is defined
Having collected the data it is necessary to characterize them at the meta level (ie
describe and explore the data) The lsquoexplore datarsquo task typically consists of an initial
report with summarisation and possibly visualisation of data Although visualisation
is limited to two or three dimensions this frequently brings additional insights
(Grinstein et al 2002) Besides a brief description the lsquodescribe data taskrsquo contains
notification of the type of data (eg continuous or discrete) because different models
can be adapted depending on the data type (Cook and Zhu 2006)
Obviously data can differ significantly in quality Especially when compiling the data
from different sources (eg two different types of hard data) or different data
collection techniques (eg hard data combined with survey sample data) caution
should be taken For example the definitions of the variables could differ according
to the original source But the quality of the combined dataset could be at stake in
more subtle issues For example different data sources could have different random
samples (so the data should be weighted accordingly the researcher can account for
this by for example (1) in the robust order-m estimations of Cazals et al (2002)
drawing less frequently observations from the minority group or (2) in bootstrap
replications in comparison to the underrepresented observations replicating fewer the
overrepresented observations (for an empirical example Cherchye et al 2009) The
researcher should be constantly aware of potential differences in data definitions and
data collection techniques
10
Depending on the applied assessment technique (MLM COLS FDH DEAhellip see
phase 3) differences in data quality are increasing troublesome Particularly in
deterministic DEA models outlying and atypical observations due to a low quality of
data could heavily influence the outcomes Fortunately the non-parametric literature
has developed several techniques to deal with eg missing data (eg Kao and Liu
2000) negative data (eg Emrouznejad et al 2010a 2010b and Portela et al 2004)
zero values (eg Thompson et al 1993) or ratio data (Emrouznejad and Amin
2009) Efficiency estimation with noisy data (eg due to measurement errors) could
result in very imprecise results (for various models dealing with irregular data in DEA
see Zhu and Cook 2007) Therefore it is worthwhile to examine the noise around the
DEA estimates by bootstrapping techniques or statistical inferences (Simar and
Wilson 2007 see also phase 5)
Figure 4 On structuring data phase
11
In addition observations with a dramatic impact on the efficiency scores of other
observations could be removed from the sample The literature developed several
techniques to detect influential observations the peer count index (Charnes et al
1985) outlier detection by the use of super-efficiency model (Andersen and Petersen
1993) order-m based models (Simar 2003) leverage (Sousa and Stosic 2005) etc
are typical techniques for non-parametric models Outlier detection models exist for
parametric models as well (eg Langford and Lewis 1998 for MLM) Each of these
models has its own peculiarities and as such it could be worthwhile to combine the
different procedures (De Witte and Marques 2010)
On the other hand influential observations could be of increased interest as they could
reveal extreme best practices or indicate where someone has specialized into a niche
performance Therefore a researcher cannot simply remove the outliers from the
sample (an alternative non-parametric approach which reduces the impact of outlying
observations in the sample is the robust order-m model of Cazals et al 2002 see
phase 4) Finally this sub-phase aims at obtaining a quality report on the data such
that the weakest and strongest links can easily be noticed
Once settled the researcher has to prepare the final dataset on which the models will
be run The analyst has to collect the data from the different data sources and deal
with the missing zero or negative data appropriately Finally heshe obtains a clean
and ready to use dataset
5 Operational models
Dependant on (a) available data (b) the quality of the data (eg noisy) and (c) the
type of the data (eg negative values discrete variables desirableundesirable values
etc) specific classes of models are available Two main categories can be
distinguished As in Figure 5 the first class consists of parametric models (see eg
Greene 2008) This family of models assumes an a priori specification on the
production function (ie how the inputs are converted into outputs) The advantages
of this procedure are its well established statistical inference and its easy inclusion of
environmental characteristics Its disadvantage lies in the a priori specification of the
model It is often very difficult to argue that the production process follows eg a
12
Cobb-Douglas Translog or Fourier specification The second class consists of the
non-parametric models They do not require any a priori assumptions on the
production function They therefore have more flexibility and as such let the data
speak for themselves (Stolp 1990) A disadvantage of this class lies in the restrictive
curse of dimensionality and they often deliver a large variance and wide confidence
interval
Within these two families both deterministic and stochastic variants exist The
deterministic models assume that all observations belong to the production set This
assumption makes them sensitive to outlying observations However robust models
(Cazals et al 2002) avoid this limitation Stochastic models allow for noise in the
data and capture the noise by an error term However sometimes it is difficult to
distinguish the noise from inefficiency the stochastic frontier models are specifically
directed to this problem (Kumbhakar and Lovell 2000)
The literature has developed several models for efficiency estimations (for an
overview Daraio and Simar 2007) In the remainder of the paper we will focus only
on the non-parametric deterministic model However the researcher should be aware
of the other model specifications and even of particular variants of the traditional
model specifications [eg Dula and Thrall (2001) developed a DEA model which is
less computational demanding and as such interesting to analyze large datasets]
Although in the previous phase outliers and atypical observations were removed from
the dataset (or at least inspected more carefully) the deterministic model is still
vulnerable to these influential entities To reduce the impact of outlying observations
Cazals et al (2002) introduced robust efficiency measures Instead of evaluating an
entity against the full reference set an entity is evaluated against a subset of size m
By taking the average of these evaluations the estimates are less sensitive to outlying
units In addition these so-called robust order-m efficiency estimates allow for
statistical inference such as standard deviations and confidence intervals
Cazals et al (2002) and Daraio and Simar (2005) developed conditional efficiency
approach that include condition on exogenous characteristics in DEA models This
bridges the gap between parametric models (in which it is easy to include
heterogeneity) and non-parametric models Daraio and Simar (2007) develop
conditional efficiency estimates for multivariate continuous variables Badin et al
13
(2008) develop a data-driven bandwidth selection while De Witte and Kortelainen
(2008) extend the model to generalized discrete and continuous variables By using
robust conditional efficiency measures many advantages of the parametric models are
included now in the deterministic non-parametric models Daraio and Simar (2007)
present an adoption of the non-convex FDH and convex DEA efficiency scores to
obtain conditional and robust framework
Figure 5 Operational models phase
6 Performance comparison
Once a satisfactory dataset is collected the analysis is performed in the performance
comparison phase (for a summary see Figure 6) These analyses allow researchers to
obtain additional insights and to define a proper model and finally to run the model
14
The selection of the DMUs is an intrinsic and important step in a non-parametric
model and involves two issues (1) the number of DMUs and (2) the level of the
DMUs Firstly consider the number of DMUs Similar as in parametric regressions
the researcher should try to include as many observations as possible to obtain
meaningful estimations Indeed the relative nature of DEA makes it vulnerable to
problems with the degrees of freedom The number of degrees of freedom will
increase with the number of DMUs in the dataset and decrease with the number of
input and output variables Banker et al (1989) suggest a rough rule of thumb Let p
be the number of inputs and q be the number of outputs used in the analysis then the
sample size n should satisfy n ge maxp times q 3(p + q) In addition if observations are
added the lsquoworld best practice frontierrsquo will be better approached (Estache et al
2004) although due to the sample size bias average efficiency will decrease (see
below Zhang and Bartels 1998) Secondly consider the level of the DMUs which
influences the shape of the production possibility set (ie the frontier and is therefore
included in this phase) If the analysis is performed on a different level (eg macro
versus micro units) different results can be obtained For example when comparing
universities we may select universities that are research focused or teaching focused
or all universities Each case results in a different production possibility set and as
such a different efficiency score
Selecting different input and output variables could heavily influence the results of the
DEA model Indeed DEA estimates relative efficiencies (ie relative to a best
practice frontier) and allows for specialization in one or another input or output
variable The researcher should be aware of this important choice The inputs and
outputs can be justified by the existing literature by managerial analysis (ie what
are the best inputs and outputs according to the entities) by multivariate analysis
(eg is there multicolinearity between the different inputs and outputs) or by simple
ratio analysis Cook and Zhu (2008) suggest to use a ratio when it is not clear whether
a variable should be classified as an input or an output The ratio form generalizes
one-dimensional engineering-science definition of efficiency (which considers the
simple ratio 1Input
0 Output
) to a more general and multidimensional ratio
1Inputs
0 Outputs
If an increase in the value of the variable results in an increase in the
15
efficiency score then it belongs to the numerator and it is an output variable If an
increase in its value results in a decrease in the value of the efficiency ratio then it
belongs to the denominator and it is an input variable
As a rule of thumb Dyson et al (2001) suggest that the selected inputs and outputs
should cover the full range of resources used and outputs produced among the
evaluated entities We pointed already on the importance of exogenous variables If
the researcher wants to provide an accurate picture of reality (ie without assigning
higher efficiency scores to observations operating in a more favourable environment)
heshe needs to include exogenous characteristics Similar to the selection of inputs
and outputs exogenous variables can be selected by considering managerial
information or getting information from the previous studies in the literature
As DEA assumes free disposability and convexity assumptions (see Fried et al
2008) it is further restricted by making an assumption on the shape of the convex hull
or convex cone (Kleine 2004) The initial DEA model of Charnes Cooper and
Rhodes (1978) (so-called CCR model) assumed a convex cone As such in a two
dimensional picture the production frontier corresponds to a piecewise linear frontier
(ie the observation with the highest average efficiency as measured by the ratio of
outputs to inputs) The technical inefficiencies can be due to the ineffective operation
of the production process in transforming inputs to outputs and due to the divergence
of the entity from the Most Productive Scale Size (MPSS) As indicated in Banker
(1984) the most productive scale size is that scale for which the average productivity
measured is maximized (ie operating at optimal returns to scale) The DEA model
with variable returns to scale is often referred to as the BCC model after Banker et al
(1984) who introduced a convex hull instead of a convex cone around the data More
recently by the work of Kerstens and Vanden Eeckaut (1999) and by Podinovski
(2004) also in the non-convex FDH returns to scale were introduced The returns to
scale can be tested by bootstrap procedures (Simar and Wilson 2002) or statistical
tests (Kittelsen 1993 Banker and Natarajan 2004) In particular the procedure tests
by the use of bootstrapping whether there is a significant difference between CRS and
VRS Obviously in most applications the returns to scale specification (CRS versus
VRS) can deliver significantly different outcomes and as such a well considered
model should be selected Also the consistency of the estimates depends on the model
16
specification If the lsquotruersquo underlying production function exhibits VRS then only the
VRS-assumption delivers consistent results However if the true underlying model is
CRS both VRS and CRS assumption deliver consistent results Remark that the non-
convex FDH model delivers consistent results however at a lower rate of
convergence due to less structure in the model (Daraio and Simar 2007)
The DEA model basically weights the heterogeneous inputs and outputs such that the
highest efficiency score can be obtained The researcher can also decide to attach
specific weight restrictions to the DEA model These weight restrictions function as
value judgements on the different inputs and outputs (Allen et al 1997 Pedraja-
Chaparro et al 1997 and for a caveat Podinovski 1999)
Once some assumptions on the production possibility set are made and tested the
researcher can focus on the orientation of the model Different options are possible
The input-oriented framework minimizes the input set for a given output production
The output-oriented model maximizes the potential output production for a given
input set Under the CRS assumption the input-oriented efficiency scores are the
reciprocal of the output-oriented efficiency scores Obviously this is no longer the
case under VRS In many interesting real life applications the managers of an entity
are not considering input reductions and output expansions separately Non-oriented
models consider simultaneous input reductions and output expansions The literature
developed several procedures to estimate efficiency non-oriented see eg the
additive model of Charnes et al (1985) the Russell measure of Faumlre and Lovell
(1978) the range-adjusted measure of Cooper et al (1999) or the geometric distance
function of Portela and Thanassoulis (2002) (for a survey see Fried et al 2008)
The non-oriented measures are non-radial measures of efficiency This branch of
measures does not preserve the input-output mix in the efficiency score This
contrasts to the input- and output-oriented measures which are typically radial
measures of efficiency In a radial approach the input-output mix is preserved In
most situations a radial efficiency score is easier to work with (De Borger and
Kerstens 1996)
If panel data are available it could be worthwhile to examine the efficiency in the
larger panel dataset In contrast to a cross-section analysis (only variables for one
17
specific year) more observations will be available as typically the observations are
evaluated against their previous performance To handle panel data non-
parametrically several procedures have been developed First there are the
productivity measures such as the Tornquist index the Fisher index or the Malmquist
index (Cooper et al 2004) The Malmquist index differs from the others because it
decomposes efficiency changes into productivity growth (ie best practice frontier
improvements) and efficiency growth (ie changes relative to best practice frontier)
Malmquist indices can be bootstrapped to obtain statistical inferences (Simar and
Wilson 1999) Second in sequential methods the entity is assessed against all entities
(including itself) in the current period and in all periods before As such sequential
models reflect their history (see Grifell-Tatjeacute and Lovell 1999) However sequential
models suffer from sample size problem as the number of potential reference units
changes as time progresses The average and individual efficiency scores will
decrease if the number of observations in the sample increases (Zhang and Bartels
1998) which happens in sequential models if time progresses As alternative to
sequential DEA dynamic DEA (Emrouznejad 2003 and Emrouznejad and
Thanassoulis 2005 and 2010) and network DEA (Chen 2009) can be used specially
for entities with capital input or when the data include inter-temporal inputoutput
variables
A third procedure to handle panel data is a ldquowindow analysisrdquo (Cooper et al 2004)
The procedure works in manner analogues to lsquomoving averagesrsquo as the evaluated
observation in period t is evaluated with observations from period t-s to period t+s
(with s the size of the window for which normally a sensitivity analysis is performed)
Obviously the best procedure to handle panel data depends on the research question
and on the available data (see also Fried et al 2008 for an extensive discussion)
Finally once the various decisions on the model specifications are taken these are
combined and the model is run In the final description it is important to justify each
of the previous phases (eg why did the researcher opt for a VRS model with input-
orientation in a window analysis sample) The efficiency scores are initially reported
and for each of the observations the weights targets and slacks are carefully
examined
18
Figure 6 Performance comparison phase
7 Evaluation
Running a non-parametric model does not suffice for a meaningful analysis In a fifth
phase the model and its results should be carefully reviewed according to the core
objective of the study (systematically presented in Figure 7) The whole process (ie
the preceding four phases) is reviewed and a list of possible actions is elaborated
19
The evaluation phase starts with the evaluation of the results Especially in large
datasets it is often difficult to interpret the results and to present them in a meaningful
way Summary statistics and visual tools can help to get additional insights Even
more important is the presentation for policy makers (or for those interested in the
research) Interpreting radial efficiency scores is rather straightforward whereas non-
radial scores are more difficult to interpret and present By presenting the initial
results to the decision makers a first sounding board is possible
Closely related to this initial evaluation of the results is the review of the process
Having obtained the results it is important to consider why particular observations are
obtaining lsquooddrsquo results These lsquooddrsquo results could arise from outliers remaining in the
sample from particular input-output combinations or due to assumptions in the
model (eg weight restrictions or CRS) Obviously the results are what they are and
a particular observation could not perform as efficient as expected (even after
checking the assumptions)
Still particular observations could be influenced by the exogenous environment
Thanks to environmental characteristics the observations could obtain a higher
efficiency score when the characteristics are favourable and as such behave as an
additional (but unmeasured) input Contrarily when the environmental characteristics
are unfavourable they behave as an additional (but unmeasured) output Therefore
the environment where the entity is operating in should be included in the analysis
Several procedures exist (see below for the selection of the variables) such as the
frontier separation approach the all-in-one model multi-stage models bootstrapping
techniques and conditional efficiency estimates (see Fried et al 2008 Daraio and
Simar 2007) Each of these techniques has its peculiarities and drawbacks (see De
Witte and Marques (2008) for a review) If the researcher opted not to include the
operational environment in a first stage it is definitely worth examining the influence
of the environment in a second stage Simar and Wilson (2007) developed a double-
bootstrap procedure which estimates the impact of exogenous characteristics on the
production process (see also Fried et al (2008) for a complementary intuitive
explanation of the procedure)
Different model specifications (both in terms of model assumptions as VRS input-
orientation or environmental variable inclusion) could yield different outcomes it
20
could also be interesting to see whether these outcomes significantly differ Indeed so
if there is no significant difference between the several models it matters less which
model assumptions are specified A Monte Carlo comparison of two production
frontier estimation methods and a set of statistical tests were developed by Banker and
Natarajan (2004) Post-hoc statistical tests (Schaffnit et al 1998) regression analysis
(Camanho et al 2009) and classification and regression tree (Emrouznejad and
Anouz 2010) can be performed to investigate the impact of external factors on
efficiency scores obtained in DEA
Figure 7 Evaluation Phase
Besides evaluating heterogeneity (one-stage) bootstrap procedures are applied to
obtain statistical inference (Simar and Wilson 1998) In particular the bootstrap
21
estimates the noise (and bias) which arises from using the observed sample By
estimating the bias between the lsquotruersquo unobserved variables and the lsquobiasedrsquo observed
variables biased-corrected efficiency estimates can be obtained By bootstrapping
procedures also standard deviations and confidence intervals can be computed This
allows the researcher to report statistical inferences on the estimates
Finally the evaluation phase is concluded by setting some list of possible actions for
further improvement If necessary the researcher has to start again in the first phase
and check again each of the sub-phases Only when this loop of continuous
improvements is finished the next phase can be started
7 Result and deployment
In the final phase the result and deployment phase the proposed models are put into
action (Figure 8) The entire process is summarized in a report (which refers to all
previous deliverables) The report should clearly interpret the results and compare the
final results under different model specifications Indeed presenting different model
specifications will allow the evaluated entities to present themselves as well as
possible If the entity is ranked low in different model specifications it is more
difficult to argue that its ranking arises from the model
In their search for continuous improvements the entities could try to assess their
efficiency internally Therefore the researcher could decide to use an off-the-shelf
DEA package (eg Emrouznejad and Thanassoulis 2010 and Emrouznejad 2005) or
to develop a software package (with instructions for novice users) Combined with or
independent from the software package a document including some technical
information should be delivered in order to be able to repeat the non-parametric
analysis
Finally a well documented report containing some information on how to improve
the efficiency should be delivered Any suggestion for improvement has to arise from
the non-parametric model Thanks to the software package entities will be able to
experiment with changes in particular variables The recommended report has to be
written from the point of view of the decision makers Any technicalities should be
22
bundled in specific sections The DEA results and interpretations have to be explained
as clearly and simple as possible
Figure 8 Result and deployment phase
8 Conclusion
This paper provides a framework to deal with large data samples which are difficult to
oversee When different stakeholders have different objectives when different data
sources could differ in quality when model techniques could result in different
outcomes a uniform approach to assess performance is advised A standardized
model will make non-parametric assessments more reliable more repeatable and less
costly
We proposed a framework which consists of 6 interrelated phases (1) Concepts and
objectives (2) On structuring data (3) Operational models (4) Performance
23
comparison model (5) Evaluation and (6) Results and deployment Abbreviated we
obtain the lsquoCOOPER-frameworkrsquo The framework provides both support and a step-
by-step plan for the novice researcher as well as a check-list for the experienced
researcher It is a tool which can be further adapted and modified along the specific
needs of the researcher
This paper also provides some interesting and promising lines for further research
Firstly the Cooper-framework could benefit from the interaction with empirical
applications Indeed a similar framework should never be finished and always be
open for new developments Potential applications of the framework consist of
educational questions (eg the OECD Pisa dataset) business performance (eg
World Economic Forum) consumer confidence and the analysis of large statistical
databases (eg on company performances) The practitioner applying the framework
to a particular application may tailor the framework to hisher specific needs
Secondly although extending the idea of the framework from the outlined DEA
model to alternative methodologies (FDH SFA and parametric models) is rather
straightforward not every phase and checklist item is applicable We consider it as
further research to create a similar framework for other methodologies Finally the
framework will definitely benefit from new developments in the academic literature
As computing power grows and methodological advances are made the phases will
further evolve
Acknowledgments
The authors thank to Professor William W Cooper whose constructive comments
improved the quality of this article In addition we are grateful to the editor of EJOR
Professor Robert G Dyson and three anonymous referees for their constructive and
insightful comments
24
References
Allen R A Athanassopoulos RG Dyson and E Thanassoulis (1997) Weights restrictions and value judgments in Data Envelopment Analysis Evolution development and future directions Annals of Operations Research 73 13-34
Andersen P and N Petersen (1993) A procedure for ranking efficient units in data envelopment analysis Management Science 39 (10) 1261-1264
Avkiran N (1999) An application reference for data envelopment analysis in branch banking helping the novice researcher International Journal of Bank Marketing 17 (5) 206-220
Banker R D (1984) Estimating most productive scale size using data envelopment analysis European Journal of Operational Research 17(1) 35-44
Banker R D A Charnes and W W Cooper (1984) Some models for estimating technical and scale inefficiencies in data envelopment analysis Management Science 30
Banker R D A Charnes W W Cooper J Swarts and D Thomas (1989) An introduction to data envelopment analysis with some of its models and their uses Research in Governmental and Nonprofit Accounting 5 125ndash163
Banker R D W W Cooper E Grifell-Tatjeacute J T Pastor P W Wilson E Ley and C A K Lovell (1994) Validation and generalization of DEA and its uses TOP 2 (2) 249-314
Banker R D V M Gadh and W L Gorr (1993) A Monte Carlo comparison of two production frontier estimation methods Corrected ordinary least squares and data envelopment analysis European Journal of Operational Research 67(3) 332-343
Banker R D and R Natarajan (2004) Statistical Tests Based on DEA Efficiency Scores Chapter 11 in Handbook on Data Envelopment Analysis WW Cooper L Seiford and J Zhu (Eds) Kluwer Academic Publishers Norwell MA pp 299-321
Belton V and S Vickers (1993) Demystifying DEA - A Visual Interactive Approach Based on Multiple Criteria Analysis The Journal of the Operational Research Society 44 (9) 883-896
Blanchard B S and W J Fabrycky(2006) Systems engineering and analysis 4th edition New Jersey Prentice Hall
Bogetoft P (1997) DEA-based yardstick competition The optimality of best practice regulation Annals of Operations Research 73 277-298
Brown R (2006) Mismanagement or mismeasurement Pitfalls and protocols for DEA studies in the financial services sector European Journal of Operational Research 174 1100-1116
Camanho A S M C Portela and C B Vaz (2009) Efficiency analysis accounting for internal and external non-discretionary factors Computers amp Operations Research 36(5) 1591-1601
Cazals C J Florens and L Simar (2002) Nonparametric frontier estimation a robust approach Journal of Econometrics 106 1-25
Cerrito P B (2007) Introduction to Data Mining Using SAS Enterprise Miner SAS Publishing p 468
Charnes A W W Cooper and E Rhodes (1978) Measuring the efficiency of decision making units European Journal of Operational Research 2 429ndash444
25
Charnes A W W Cooper B Golany L Seiford and J Stutz (1985) Foundations of data envelopment analysis for Pareto-Koopmans efficient empirical production functions Journal of Econometrics 30 91-107
Chen C-M (2009) A network-DEA model with new efficiency measures to incorporate the dynamic effect in production networks European Journal of Operational Research 194 (3) 687-699
Cherchye L K De Witte E Ooghe and I Nicaise (2009) Equity and Efficiency in Private and Public Education a nonparametric comparison CES Discussion Paper Series DPS 0725 Forthcoming in European Journal of Operational Research
Cook W D and J Zhu (2006) Rank order data in DEA A general framework European Journal of Operational Research 174 (2) 1021-1038
Cook W D and J Zhu (2008) Classifying inputs and outputs in data envelopment analysis European Journal of Operational Research 180 (2) 692-699
Cooper W W K S Park and J T Pastor (1999) RAM A range measure of inefficiency for use with additive models and relations to other models and measures in DEA Journal of Productivity analysis 11 5-42
Cooper WW L Seiford and J Zhu (2004) Handbook of DEA Kluwer Academic Publishers
Daraio C and L Simar (2005) Introducing environmental variables in nonparametric frontier models a probabilistic approach Journal of Productivity Analysis 24 93-121
Daraio C and L Simar (2007) Advanced robust and nonparametric methods in efficiency analysis Series Studies in Productivity and Efficiency Springer
De Borger B and K Kerstens (1996) Radial and nonradial measures of technical efficiency An empirical illustration for Belgian local governments using an FDH reference technology Journal of Productivity Analysis 7 (1) 41-62
Deprins D L Simar and H Tulkens (1984) Measuring labor efficiency in post offices The Performance of Public Enterprises Concepts and Measurements M Marchand P Pestieau and H Tulkens (eds) Amsterdam North-Holland 243267
De Witte K and M Kortelainen (2008) Blaming the exogenous environment Conditional efficiency estimation with continuous and discrete environmental variables CES Discussion Paper Series PS 0833 MPRA Paper 14034
De Witte K and R Marques (2010) Designing incentives to local public utilities an international comparison to the drinking water sector Central European Journal of Operations Research In Press
De Witte K and R C Marques (2009) Influential observations in frontier models a robust non-oriented approach to the water sector mimeo
Dula J H and R M Thrall (2001) A Computational Framework for Accelerating DEA Journal of Productivity Analysis 16 (1) 63-78
Dyson R G R Allen A S Camanho V V Podinovski C S Sarrico E A Shale (2001) Pitfalls and protocols in DEA European Journal of Operational Research 132 (2) 245-259
Emrouznejad A (2003) An alternative DEA measure A case of OCED countries Applied Economic Letters 10 779ndash782
Emrouznejad A (2005) Measurement efficiency and productivity in SASOR Computers and Operations Research 32 1665ndash1683
26
Emrouznejad A and G R Amin (2009) DEA models for ratio data Convexity consideration Applied Mathematical Modelling 33 (1) 486-498
Emrouznejad A and A L Anouze (2010) DEACampR DEA with classification and regression tree a case of banking efficiency Expert Systems in Press
Emrouznejad A B Parker and G Tavares (2008) Evaluation of research in efficiency and productivity A survey and analysis of the first 30 years of scholarly literature in DEA Journal of Socio-Economic Planning Sciences 42(3) 151-157
Emrouznejad A and E Thanassoulis (2005) A mathematical model for dynamic efficiency using data envelopment analysis Applied Mathematics and Computation 160(2) 363-378
Emrouznejad A and E Thanassoulis (2010) Performance Improvement Management Software (PIMsoft) a user guide wwwDEAsoftwarecouk
Emrouznejad A and E Thanassoulis (2010) Measurement of productivity index with dynamic DEA International Journal of Operational Research in press
Emrouznejad A A L Anouze and E Thanassoulis (2010a) A semi-oriented radial measure for measuring the efficiency of decision making units with negative data using DEA European Journal of Operational Research In Press
Emrouznejad A G R Amin E Thanassoulis and A L Anouze (2010b) On the boundedness of the SORM DEA models with negative data European Journal of Operational Research in press
Estache A M Rossi and C Ruzzier (2004) The case for international coordination of electricity regulation evidence from the measurement of efficiency in South America Journal of Regulatory Economics 25(3) 271ndash295
Faumlre R And S Grosskopf (1996) Intertemporal Production Frontiers With Dynamic DEA Boston Kluwer Academic Publishers
Faumlre R and S Grosskopf (2000) Network DEA Socio-Economic Planning Sciences 34(1) 35-49
Faumlre R and C A K Lovell (1978) Measuring the technical efficiency of production Journal of Economic Theory 19 (1) 150-162
Fried H O C A K Lovell and S S Schmidt (2008) The measurement of productive efficiency and productivity growth Oxford University Press
Greene W (2008) Econometric Analysis 6th Edition Prentice Hall
Grifell-Tatjeacute E and C A K Lovell (1999) Profits and productivity Management Science 45 (9) 1177-1193
Grinstein G P Hoffman and R Pickett (2002) Benchmark Development for the Evaluation of Visualization for Data Mining In Fayyad U G Grinstein and A Wierse Information Visualization in Data Mining and Knowledge Discovery
Hollingsworth B (2008) The measurement of efficiency and productivity of health care delivery Health Economics 17 1007-1028
Kao C and S Liu (2000) Data envelopment analysis with missing data an application to University libraries in Taiwan Journal of the Operational Research Society 51 897ndash905
Kerstens K and P Vanden Eeckaut (1999) Estimating returns to scale using non-parametric deterministic technologies A new method based on goodness-of-fit European Journal of Operational Research 113 (1) 206-214
27
Kittelsen S (1993) Stepwise DEA Choosing variables for measuring technical efficiency in Norwegian electricity distribution Memorandum No 693 from the Department of Economics University of Oslo
Kleine A (2004) A general model framework for DEA Omega 32 (1) 17-23
Kuosmanen T (2009) Data envelopment analysis with missing data Journal of the Operational Research Society 60(12) 1767-1774
Kuosmanen T and M Kortelainen (2007) Stochastic Nonparametric Envelopment of Data Cross-Sectional Frontier Estimation Subject to Shape Constraints University of Joensuu Economics Discussion Paper No 46
Kumbhakar S C and CAK Lovell (2000) Stochastic Frontier Analysis Cambridge University Press Cambridge UK
Langford I and T Lewis (1998) Outliers in Multilevel data Journal of the Royal Statistical Society Series A 161 (2) 121-160
Marques R C (2006) A yardstick competition model for Portuguese water and sewerage services regulation Utilities Policy 14 (3) 175-184
Meeusen W and J van den Broeck (1977) Efficiency estimation from Cobb-Douglas production functions with composed error International Economic Review 18 (2) 435-444
OECD (2008) Handbook on Constructing Composite Indicators Methodology and User Guide OECD Publishing
Olson D L and D Delen (2008) Advanced Data Mining Techniques Springer p 180
Pedraja-Chaparro F J Salinas-Jimenez and P Smith (1997) On the Role of Weight Restrictions in Data Envelopment Analysis Journal of Productivity Analysis 8 (2) 215-230
Pedraja-Chaparro F J Salinas-Jimenez P Smith (1999) On the Quality of the Data Envelopment Analysis Model The Journal of the Operational Research Society 50 (6) 636 - 644
Podinovski V (1999) Side effects of absolute weight bounds in DEA models European Journal of Operations Research 115 (3) 583-595
Podinovski V (2004) Local and global returns to scale in performance measurement Journal of the Operational Research Society 55 170ndash178
Portela M and E Thanassoulis (2002) Profit efficiency in DEA Aston Business School Research Paper RP 0206
Portela M E Thanassoulis and G Simpson (2004) Negative data in DEA a directional distance approach applied to bank branches The journal of the Operational Research Society 55 (10) 1111-1121
Ray Subhash C (2004) Data Envelopment Analysis Theory and Techniques for Economics and Operations Research Cambridge University Press Cambridge UK
Ruggiero J (2004) Data Envelopment Analysis with stochastic data Journal of the Operational Research Society 55(9)1008ndash12
Schaffnit C D Rosen and J C Paradi (1998) Best practice analysis of bank branches An application of DEA in a large Canadian bank European Journal of Operational Research 98(2) 269-289
28
29
Sengupta J K (1995) Dynamics of Data Envelopment Analysis Theory of Systems Efficiency Kluwer Academic Publishers London
Sengupta J K (1998) Stochastic Data Envelopment Analysis a new approach Applied Economics Letters 5(5) 287
Simar L (1996) Aspects of statistical analysis in DEA-type frontier models Journal of Productivity Analysis 7 (2-3) 177-185
Simar L (2003) Detecting outliers in frontier models a simple approach Journal of Productivity Analysis 20 391-424
Simar L and P Wilson (1998) Sensitivity Analysis of Efficiency Scores How to Bootstrap in Nonparametric Frontier Models Management Science 44 (1) 49-61
Simar L and P Wilson (1999) Estimating and bootstrapping Malmquist indices European Journal of Operational Research 115 (3) 459-471
Simar L and P Wilson (2002) Non-parametric tests of returns to scale European Journal of Operational Research 139 (1) 115-132
Simar L and P Wilson (2007) Estimation and inference in two-stage semi-parametric models of production processes Journal of Econometrics 136 (1) 31-64
Sousa M and B Stosic (2005) Technical efficiency of the Brazilian municipalities correcting nonparametric frontier measurement of outliers Journal of Productivity Analysis 24 157-181
Stolp C (1990) Strengths and Weaknesses of Data Envelopment Analysis An Urban and Regional Perspective Computer Environment and Urban Systems 14 (2) 103-106
Thanassoulis E (2001) Introduction to the theory and application of Data Envelopment Analysis A foundation text with integrated software Springer p 281
Thompson R P Dharmapala and R Thrall (1993) Importance for DEA of zeros in data multipliers and solutions Journal of Productivity Analysis 4 (4) 379-390
Zhang Y and R Bartels (1998) The Effect of Sample Size on the Mean Efficiency in DEA with an Application to Electricity Distribution in Australia Sweden and New Zealand Journal of Productivity Analysis 9 (3) 187-204
Zhu J (2003) Quantitative Models for Performance Evaluation and Benchmarking Data Envelopment Analysis with Spreadsheets and DEA Excel Solver Springer p 297
Zhu J and W D Cook (2007) Modeling Data Irregularities and Structural Complexities in Data Envelopment Analysis Springer p 334
Appendix Systematic presentation of references
Phase Sub-phase TaskProblem SolutionMethod Reference
Concepts and objectives
DEA goals - To understanding the objectives the production process and the requirements from stakeholders
DEA vs performance indicators
Charnes et al 1978 Thanassoulis 2001 Ray 2004 and Zhu 2003
On structuring data
Describe and explore data
Data description data type Cook and Zhu 2006 and Zhu and Cook 2007
- To get familiar with the data
Summarisation and visualisation
Grinstein et al 2002
Quality of data Missing data Kao and Liu 2000 and Kuosmanen 2009
Negative data Emrouznejad et al 2009 and Portela et al 2004
Zero data Thompson et al 1993
Ratio data Emrouznejad and Amin 2009
Noisy data Zhu and Cook 2007 Simar and Wilson 2007
- To identify data quality
- To discover and detect any data irregularities
Atypical observations Charnes et al 1985 Andersen and Petersen 1993 Simar 2003 Sousa and Stosic 2005 Langford and Lewis 1998
Operational models
Parametric models
Deterministic models Greene 2008 Kumbhakar and Lovell 2000
- To investigate possibility of using parametric vs non-parametric models within these whether to use deterministic or stochastic models Stochastic models Meeusen and van den Broeck 1977 Kumbhakar and Lovell
2000
Non-parametric models
Data Envelopment Analysis Charnes et al 1978 Fried et al 2008 Thanassoulis 2001 and Ray 2004
Free Disposal Hull Deprins et al 1986 Daraio and Simar 2005
Robust FDHDEA Cazals et al 2002 Daraio and Simar 2007
- To specify an appropriate non-parametric model
Stochastic DEA Sengupta 1998 and Ruggiero 2004
30
31
StoNED Kousmanen and Kortelainen 2007
Performance Comparison
Define PPS Inputoutput Banker et al 1989 Cook and Zhu 2008 Dyson et al 2001
Returns to scale Banker et al 1984 Podinovski 2004 Simar and Wilson 2002 Kittelsen 1993 Banker and Natarajan 2004
- To define the base for the DEA model including selection of variable returns to scale and inclusion of any value judgments
Value Judgement Allen et al 1997 Pedraja-Chaparro et al 1997 Podinovski 1999
Select measure Inputoutput orientation Thanassoulis 2001 and Ray 2004
Additive multiplicative models
Charnes et al 1985 Faumlre and Lovell 1978 Cooper et al 1999 Portela and Thanassoulis 2002
- To select the inputoutput variables
- To investigate radial and non-radial measure of efficiency including additive and slack-based measure
Non-radial De Borger and Kerstens 1996
Panel data Productivity measure Fare et al 2004 Cooper et al 2004 and Chen 2009
Window analysis Cooper et al 2004
- To examine the use of panel data techniques
- T o study the use of productivity measurement Dynamic DEA network
DEA Chen 2009 Emrouznejad and Thanassoulis 2005 2010 Fare et al 1996 and Sengupta 1995
Evaluation Statistical test Monte Carlo Banker and Natarajan 2004
Post-hoc statistical tests Schaffnit et al 1998
regression analysis Camanho et al 2009
classification and regression tree
Emrouznejad and Anouze 2010
- To evaluate the model more thoroughly
- To review the selected inputs-outputs as well as the model specifications using statistical inferences
- To verify the process
- To make sure nothing important has been ignored Bootstrapping Simar and Wilson 1998
Results and deployment
Deployment - To develop a software package or a repeatable procedure
-To list possible actions from DEA results
Software Emrouznejad and Thanassoulis 2010 Emrouznejad 2005
TIER WORKING PAPER SERIES
TIER WP 1005
copy TIER 2010
ISBN 978-94-003-0005-7
32
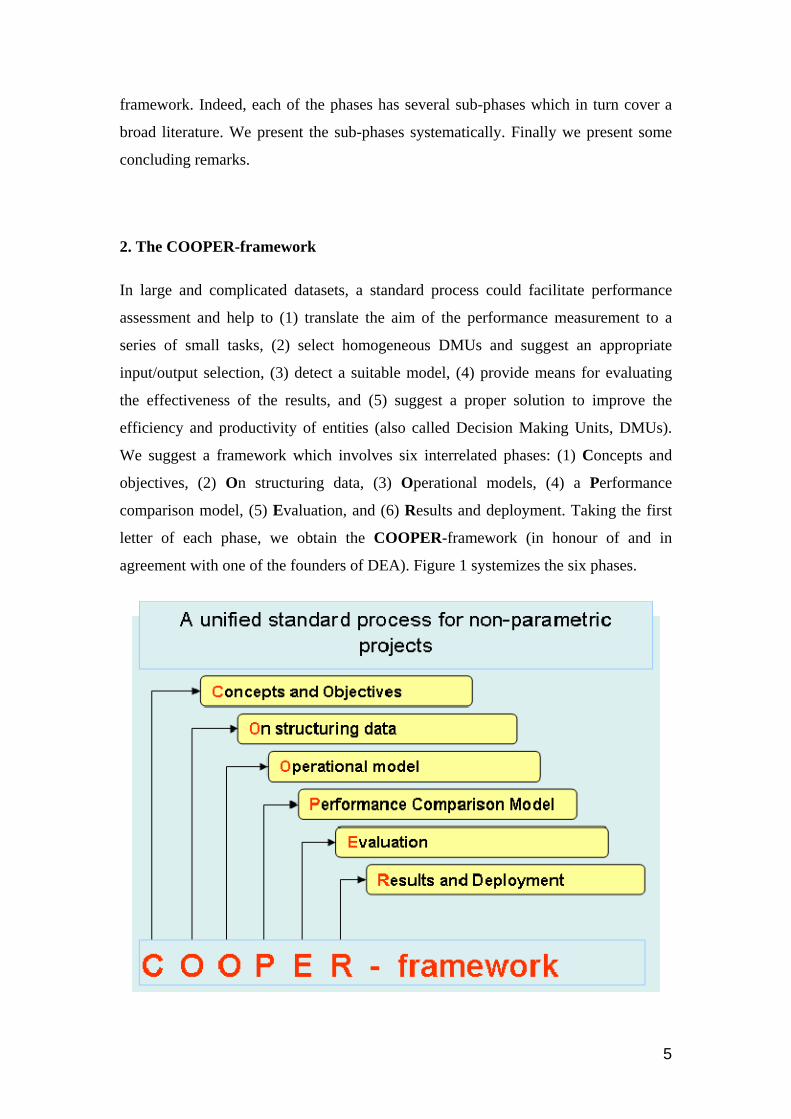
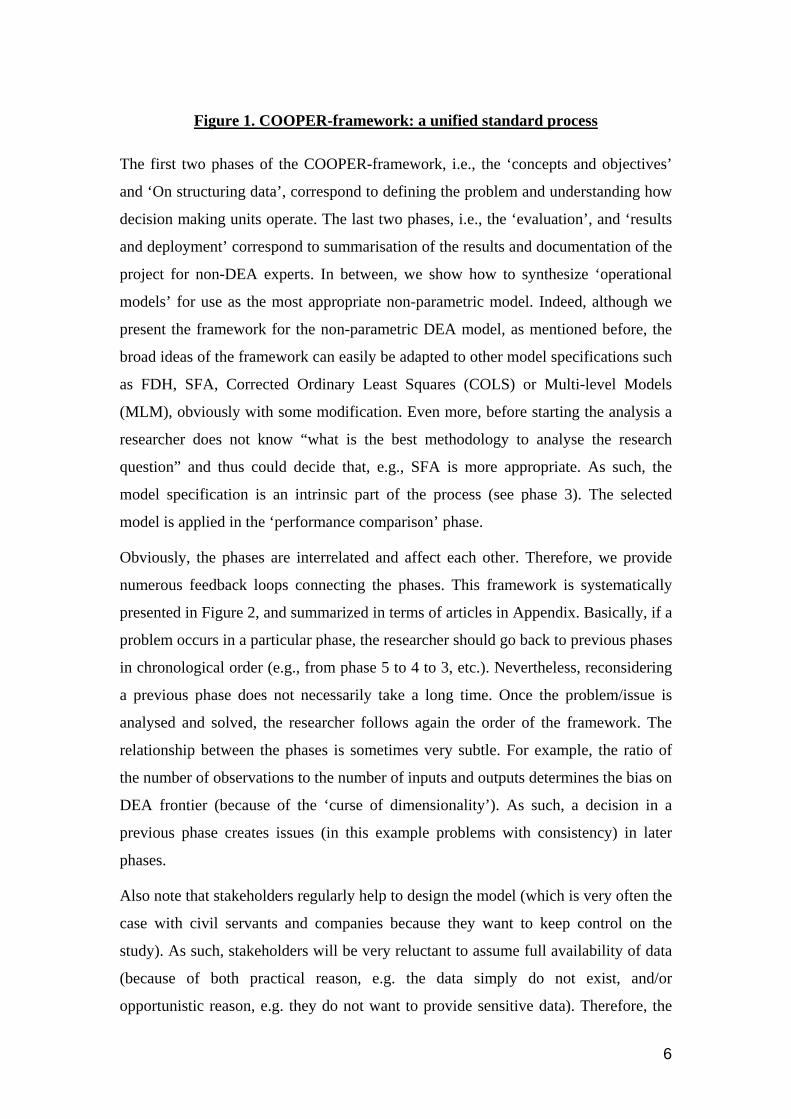
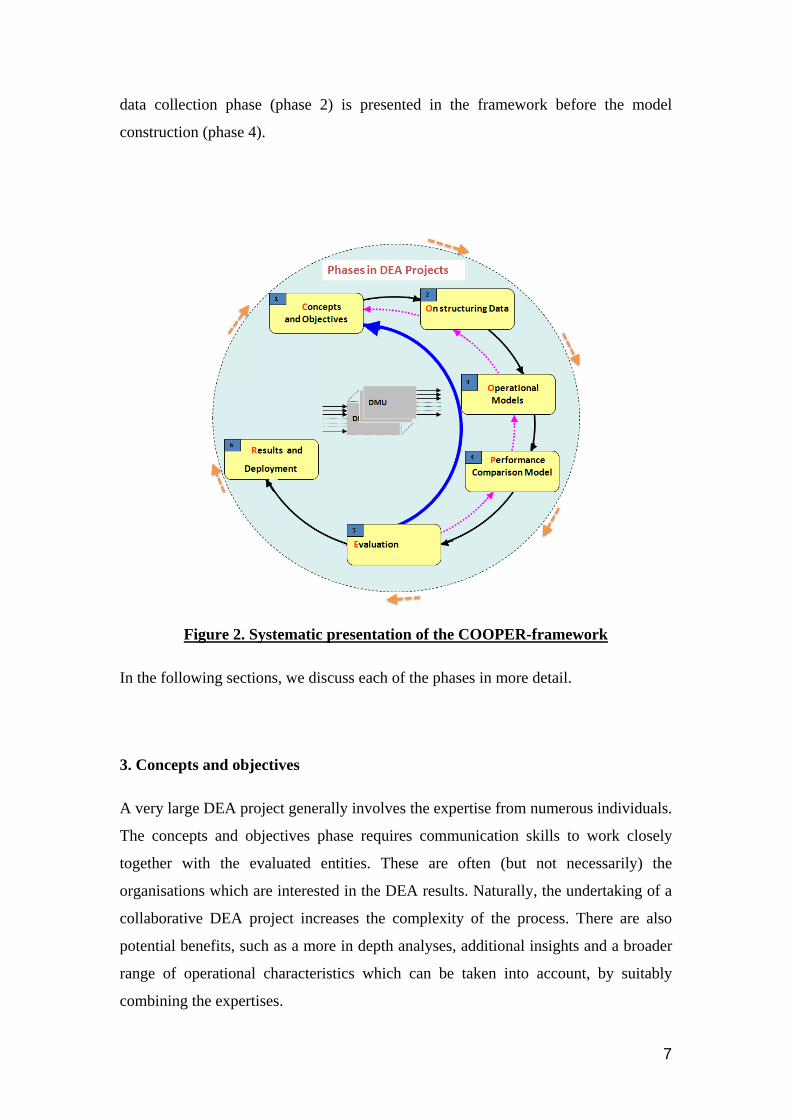
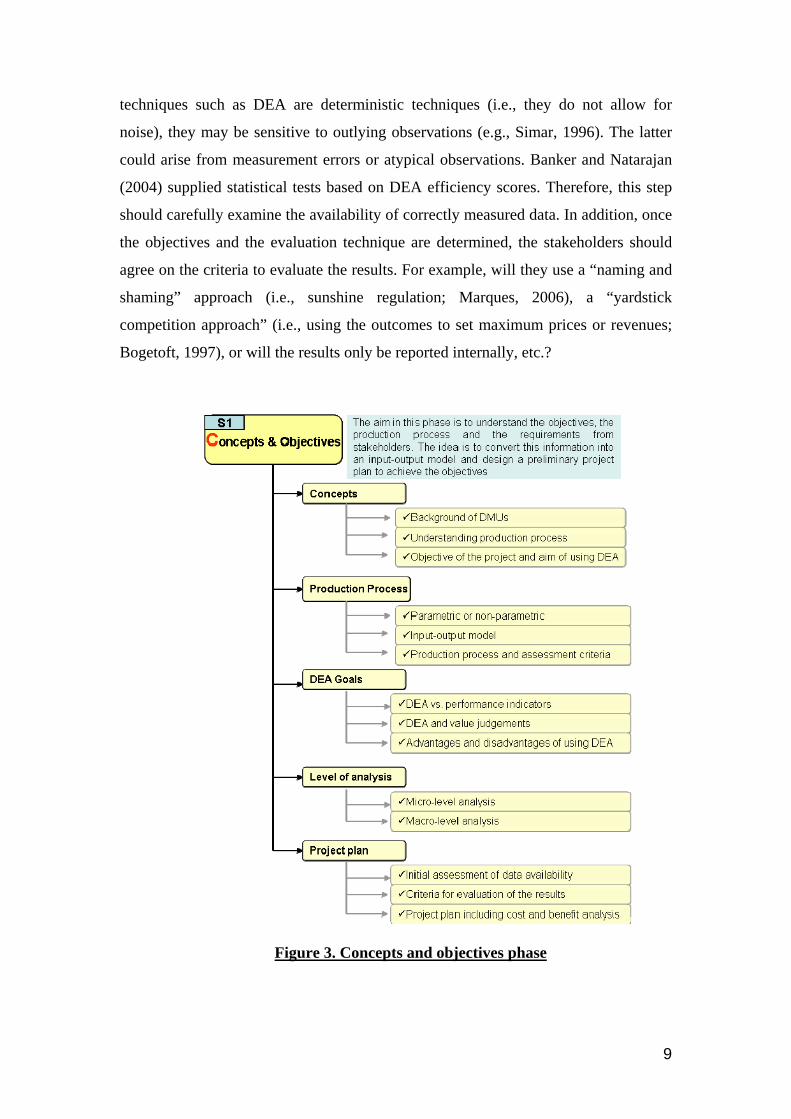
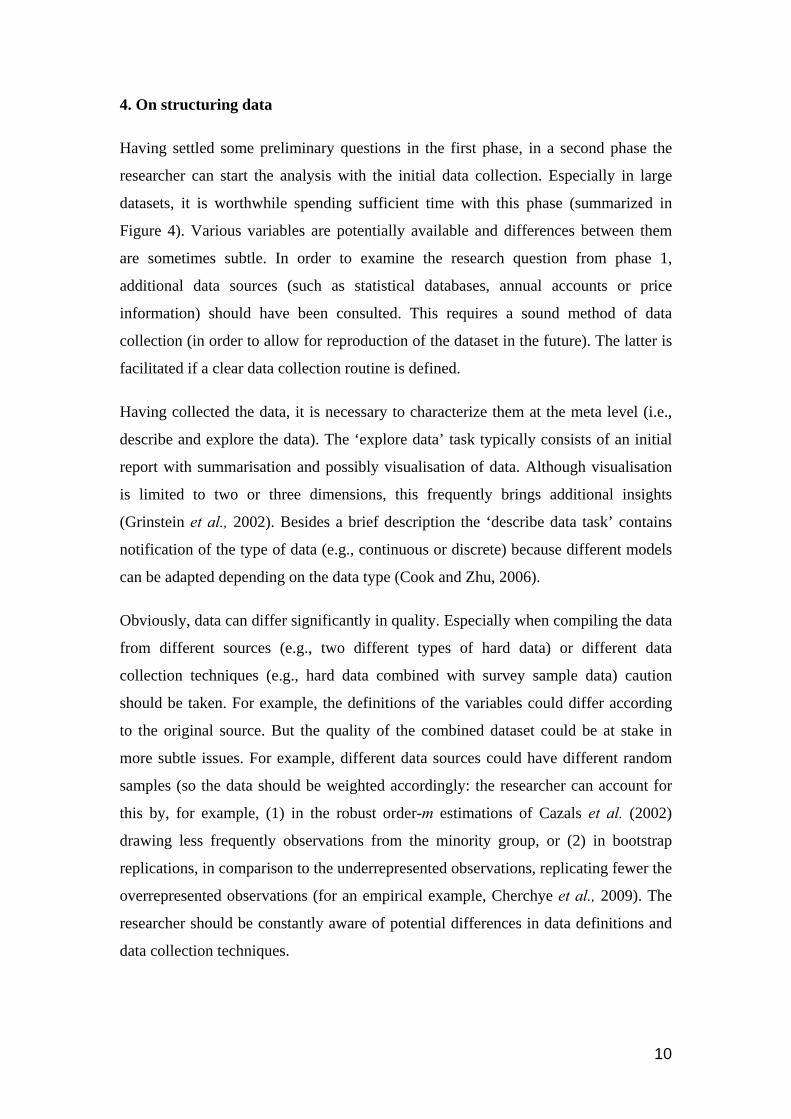
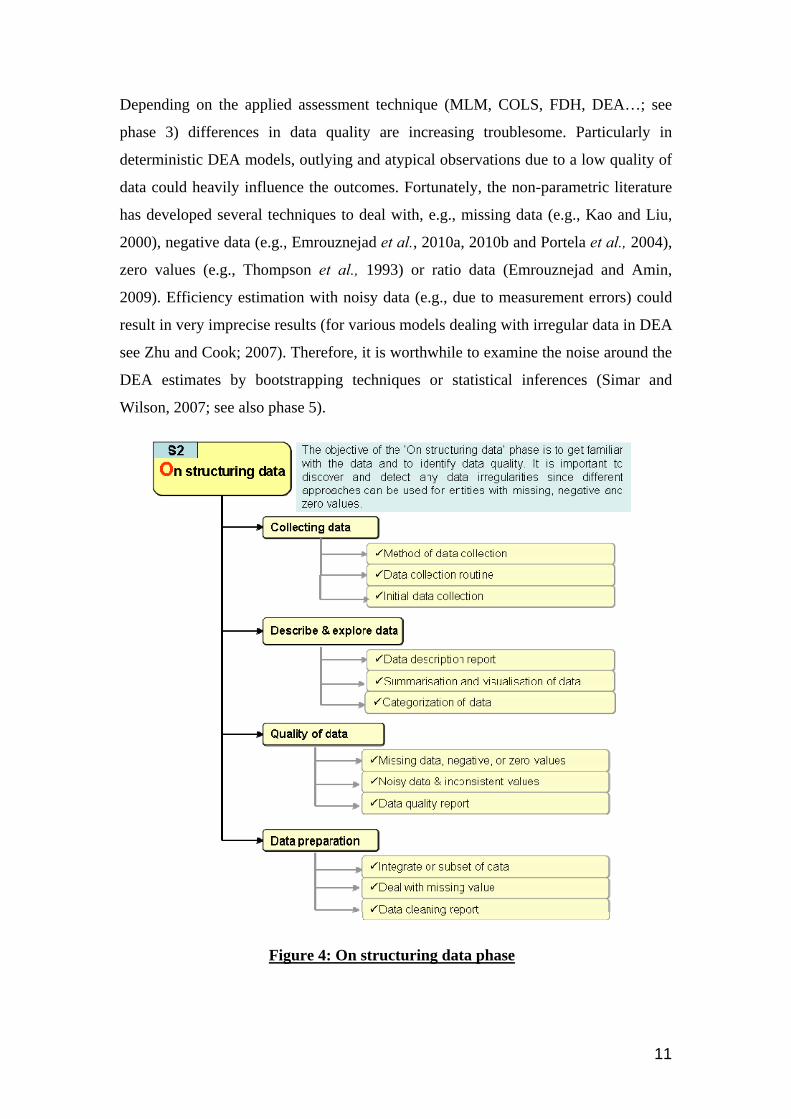
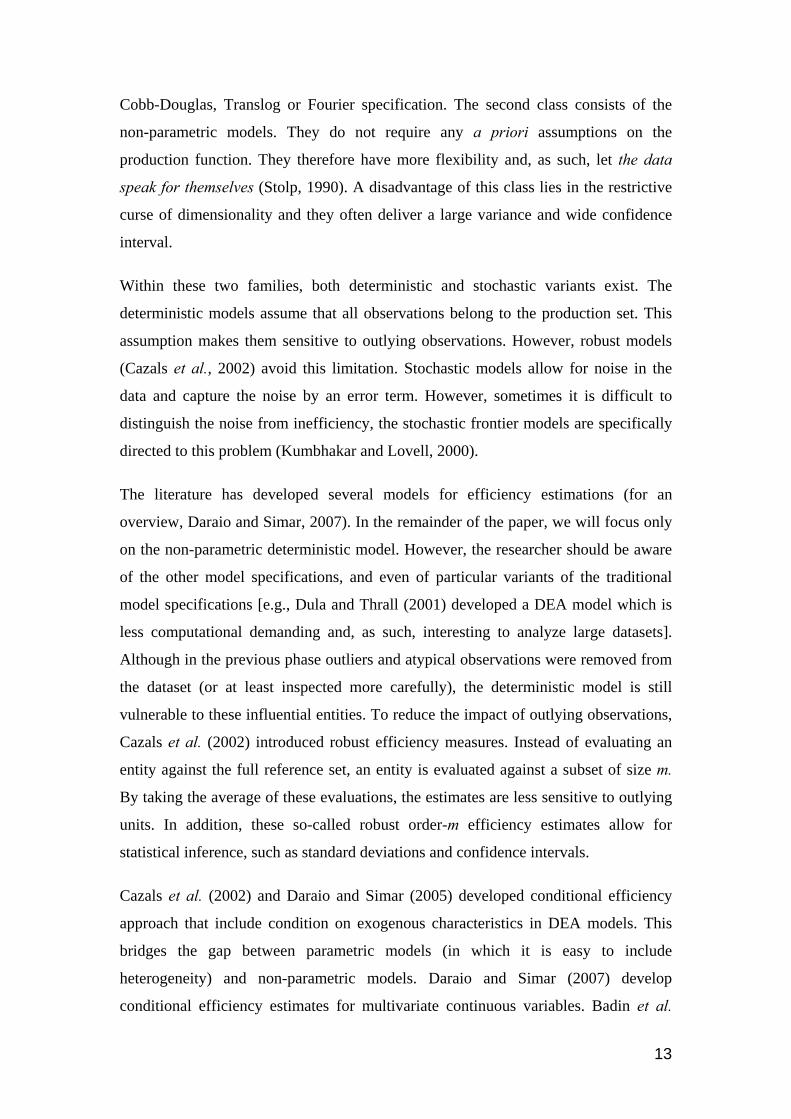
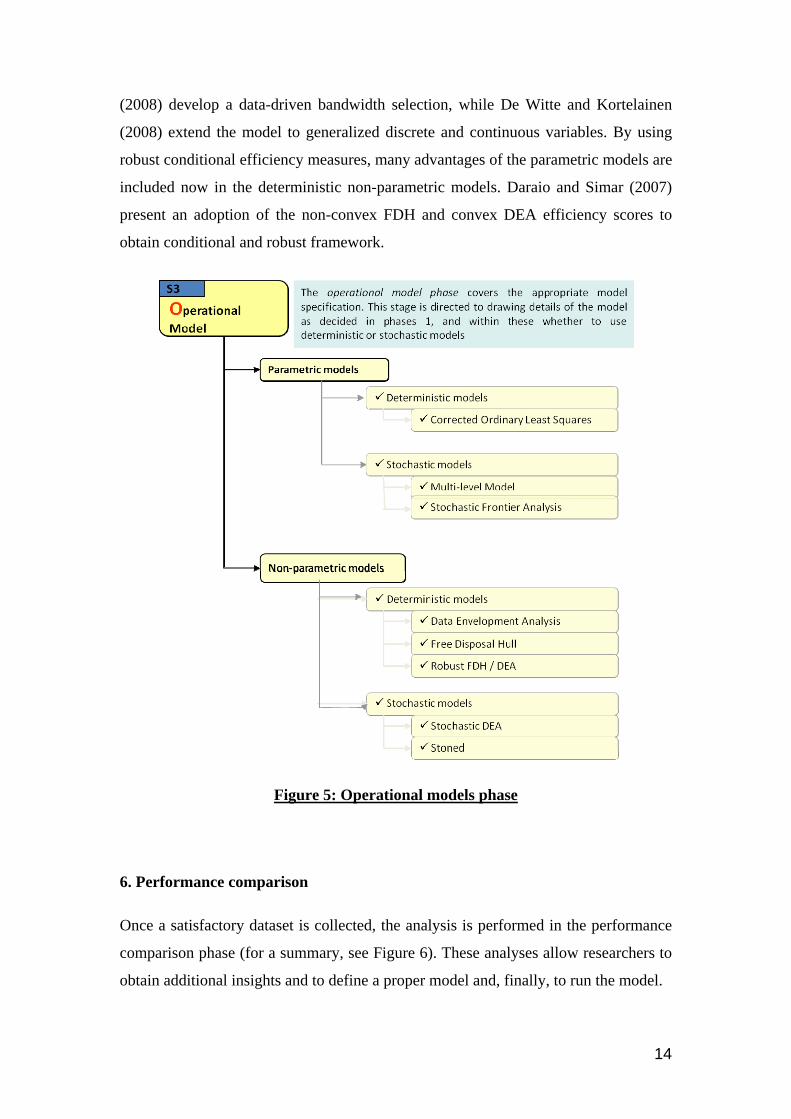
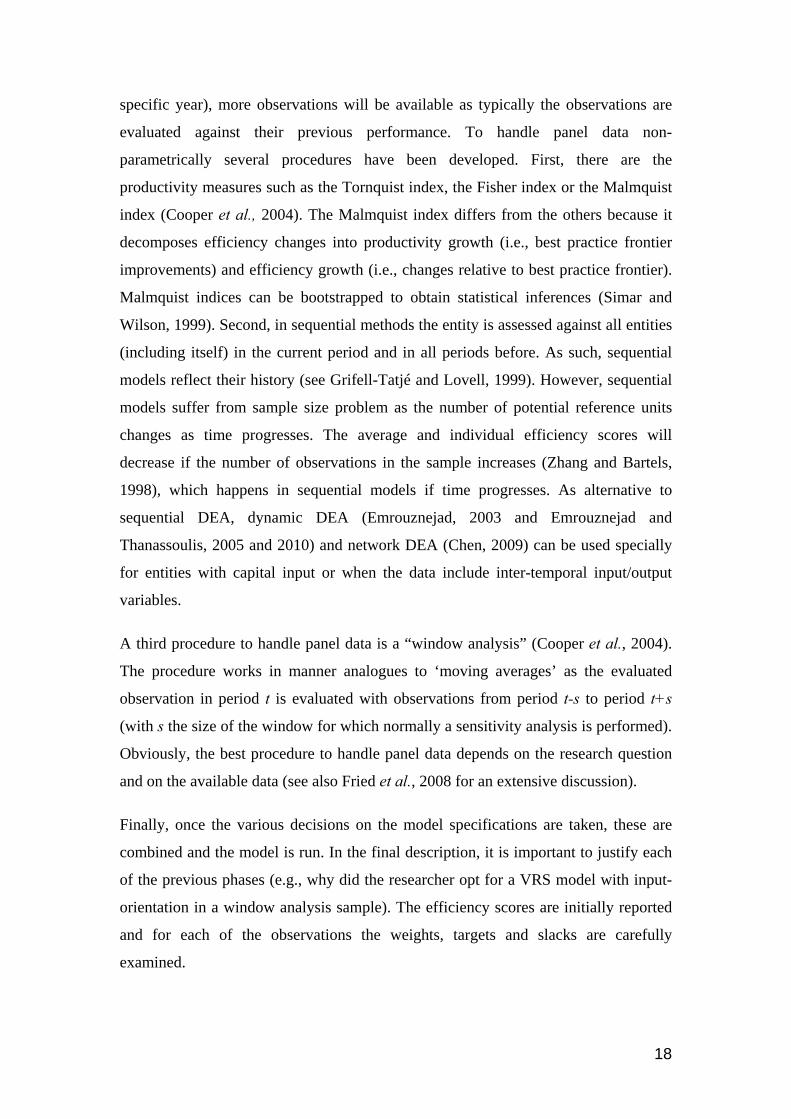
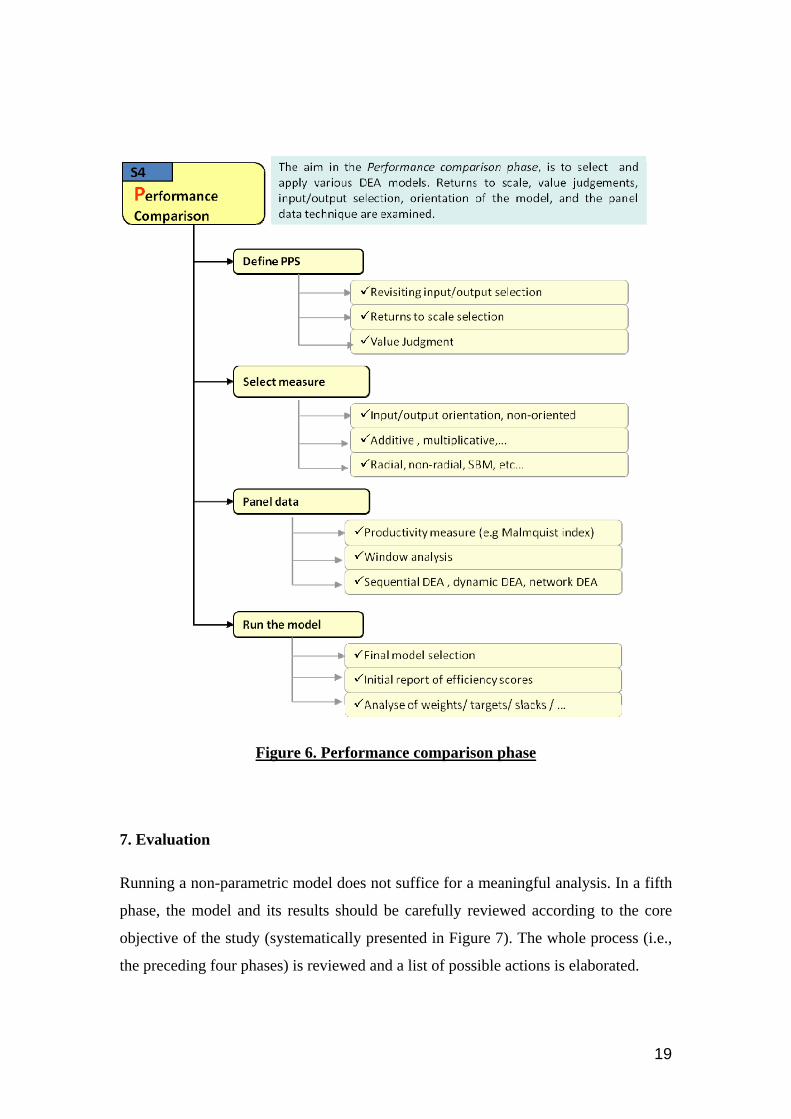
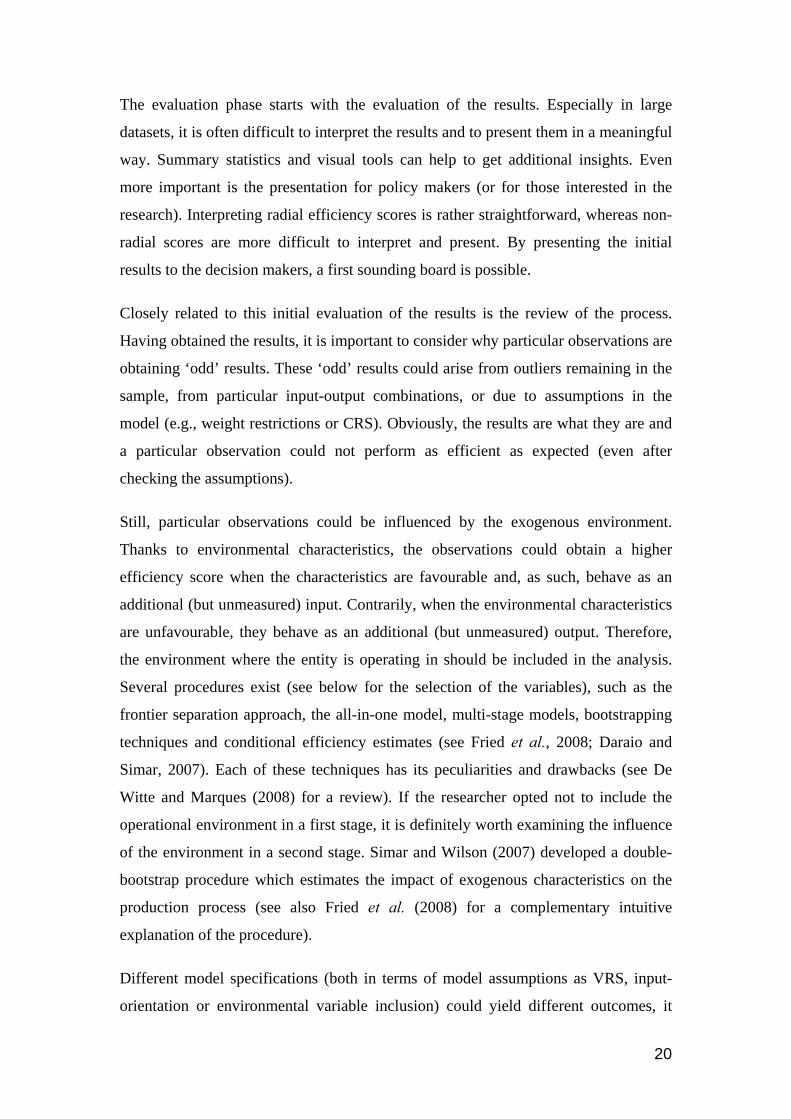
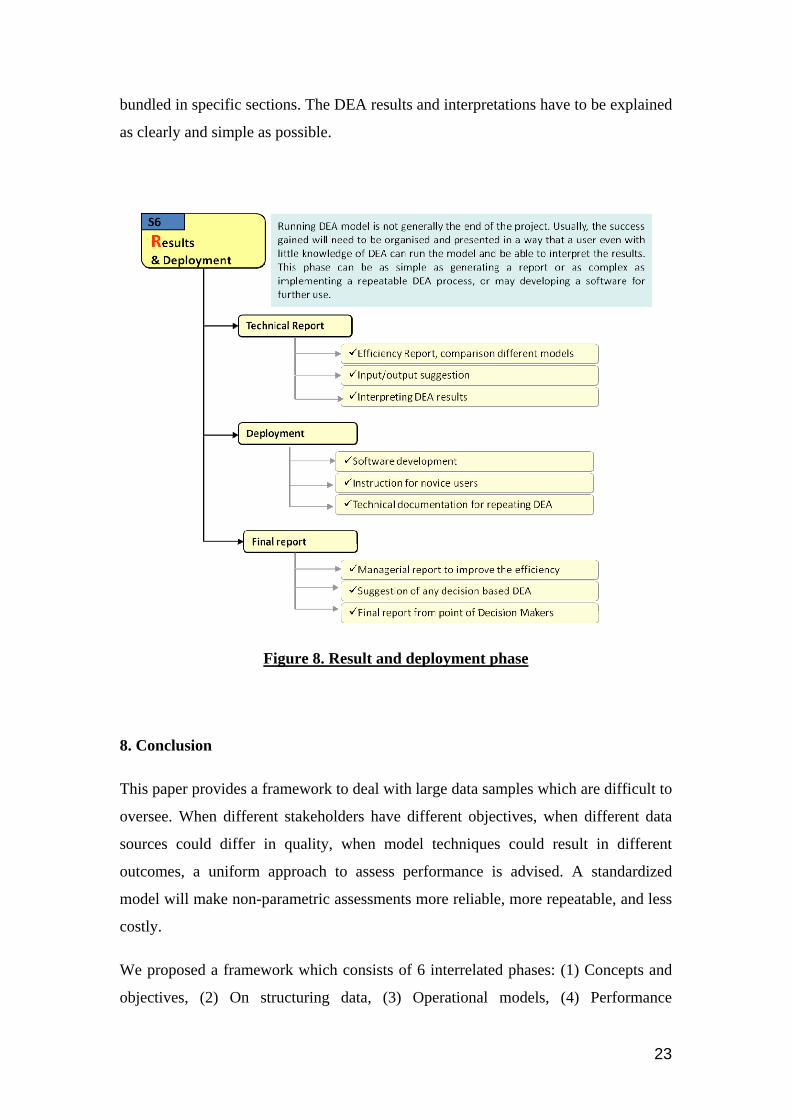
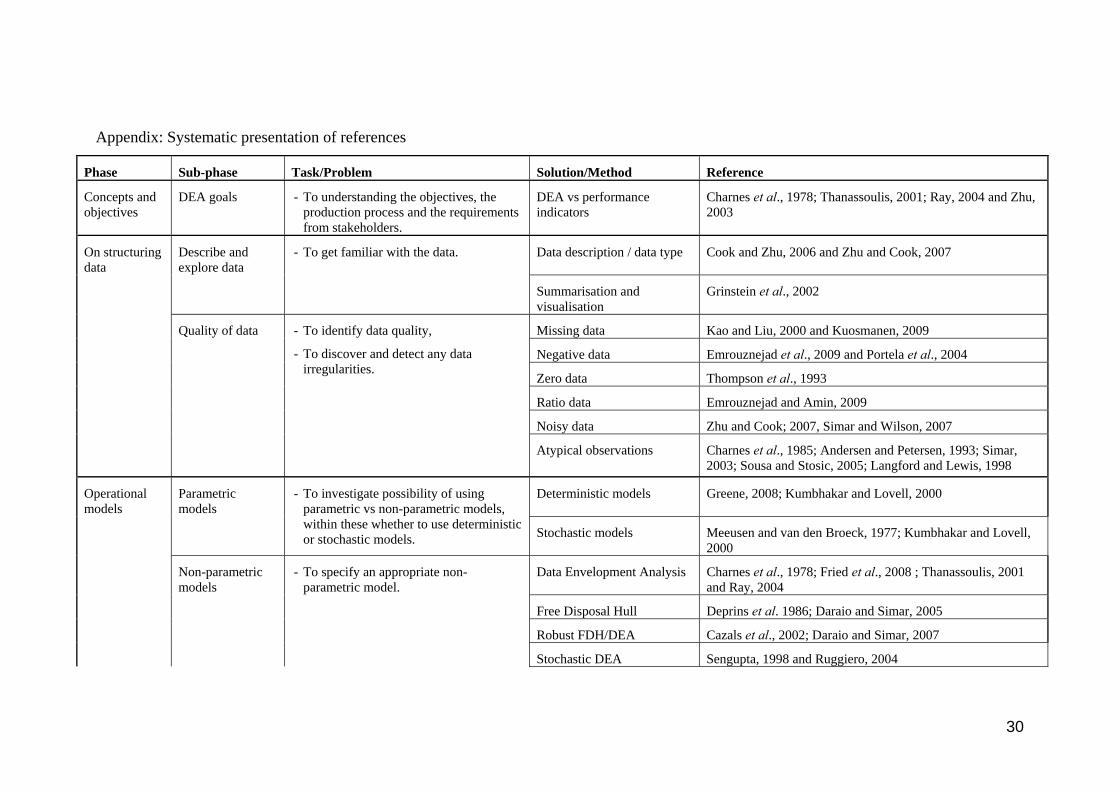
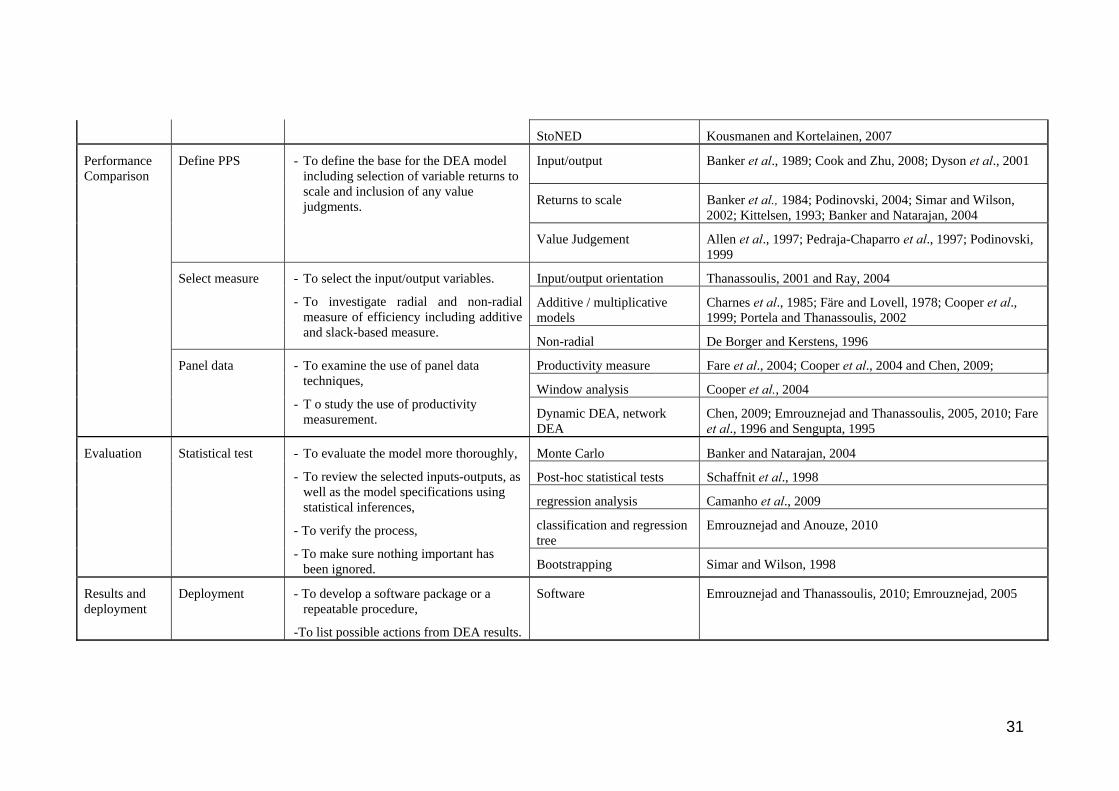

TIER WORKING PAPER SERIES
TIER WP 1005
copy TIER 2010
ISBN 978-94-003-0005-7
32
Related Documents


![A UNIFIED FRAMEWORK FOR INTERNATIONAL BUSINESSmikepeng/documents/PengWangSunMiles0901.pdfA UNIFIED FRAMEWORK FOR INTERNATIONAL BUSINESS [Abstract] International business (IB) is known](https://static.cupdf.com/doc/110x72/5eb2a505c8d44113d72cdd2b/a-unified-framework-for-international-business-mikepengdocumentspengwangsunmiles0901pdf.jpg)


