“Medically Ready Force…Ready Medical Force” 1 DoD Influenza Surveillance and Mid- Season Vaccine Effectiveness Armed Forces Health Surveillance Branch (AFHSB) Naval Health Research Center (NHRC) United States Air Force School of Aerospace Medicine (USAFSAM) DoD Global Influenza Network Partners Presentation to the Vaccines and Related Biological Products Advisory Committee (VRBPAC) – 9 March 2017 CAPT Michael Cooper, PhD** **Representing the DoD CONUS and OCONUS lab-based influenza surveillance activities

Welcome message from author
This document is posted to help you gain knowledge. Please leave a comment to let me know what you think about it! Share it to your friends and learn new things together.
Transcript

“Medically Ready Force…Ready Medical Force” 1
DoD Influenza Surveillance and Mid-Season Vaccine Effectiveness
Armed Forces Health Surveillance Branch (AFHSB)
Naval Health Research Center (NHRC) United States Air Force School of Aerospace Medicine (USAFSAM)
DoD Global Influenza Network Partners
Presentation to the Vaccines and Related Biological Products Advisory Committee (VRBPAC) – 9 March 2017
CAPT Michael Cooper, PhD** **Representing the DoD CONUS and OCONUS lab-based influenza surveillance activities

2
Disclaimer
The views expressed in this presentation are those of the author and do not necessarily reflect the official policy or position of the Department of
Defense or the U.S. Government.

Briefing Outline
1. Program Description 2. Strain Circulation 3. Molecular Analyses 4. Vaccine Effectiveness
3
• PURPOSE: Provide a concise update to the VRBPAC on DoD influenza surveillance activities, 2016-2017

Speaker Notes for Slide 3
My name is Michael Cooper and I am the Lead for respiratory infection surveillance at the Armed Forces Health Surveillance Branch in the division of Global Emerging Infection Surveillance and Response. We are a DoD asset. Today I will be presenting data on the 2016-17 influenza season from our influenza surveillance network. Included here will be surveillance data from our partners in North America, Africa , Asia and Europe. In addition, surveillance data will also be presented on military recruits. I will also be presenting a brief summary of phylogenetic analyses developed by US Air Force School of Aerospace Medicine. In addition, I’ll be presenting three mid-year estimates of vaccine effectiveness developed from the Naval Health Research Center (NHRC), the United States Air Force School of Aerospace Medicine (USAFSAM and the Armed Forces Health Surveillance Branch.
4

Breadth of DoD Influenza Surveillance
• Global Virus Surveillance – Approximately 400 locations in over 30 countries
• Military; Local government/academic
– Extensive characterization capabilities within the DoD • Culture, PCR, Sequencing, Serology
– Rapid sharing of results with CDC and/or regional WHO reference centers • Yearly average: ~30,000 samples collected and analyzed each year • ~300 sequences submitted to GenBank in fiscal year 2016
• Comprehensive Epidemiology and Analysis Capabilities – 1.4 Million Active Duty records (health care utilization, immunizations,
deployment, reportable diseases, etc) • Produce Medical Surveillance Monthly Reports, Ad-hoc requests, Studies/analyses, • Weekly influenza reports • Vaccine safety and effectiveness studies
5

Speaker Notes for Slide 5
I just want to take a moment to give some background on my organization and our influenza surveillance network. Again, we are a DoD asset dedicated to the surveillance of infectious disease primarily, but not exclusively, in the military community. Our influenza surveillance program extends to over 400 locations in over 30 countries. In addition to monitoring US military personnel our partners have relationships with foreign governments including ministries of health, ministries of defense and academic institutions which provide disease surveillance data on local national populations. Our laboratories have extensive characterization capabilities including cell culture, pcr and sequencing capabilities. On average, about 30,000 respiratory samples are collected and analyzed each year within our surveillance network and approximately 300 sequences are submitted to GenBank.
6

GEIS-Supported Influenza Surveillance Footprint
7
In 2017: --Over 30 countries --Over 400 sites

Strain Circulation
8
0%
10%
20%
30%
40%
50%
60%
70%
80%
90%
100%
0
5
10
15
20
25
30
40 43 46 49 52 2 5 8 11 14 17 20 23 26 29 32 35 38 41 44 47 50 1 4 7 10 13 16 19 22 25 28 31 34 37 40 43 46 49 52 3 6
Perc
ent P
ositi
ve
Num
ber o
f Spe
cim
ens
Week
United States Military Recruits Number and Proportion of Specimens Positive for Influenza by Subtype
Week 40, 2014 - Week 5, 2017
H1N1 H3N2 A (Not subtyped) Influenza B % Positive Source: NHRC

Speaker Notes for Slide 8
Epi week is along the X axis and the percentage of positive samples is along the right hand side. The number of specimens submitted is along the Y axis on the left hand side. The data for the current flu season is located at the right hand side of the graph (starting with week 40). Different colors indicate the different sub-types . Military Recruits are particularly vulnerable to respiratory infections due to factors such as crowded living conditions and stressful work environment. Historically, up to 20% of recruit classes might be hospitalized for respiratory infections during the two months of recruit training. In addition, recruits are a highly vaccinated population. Surveillance on them gives us information on what viruses might be evading current vaccines. These data come from eight recruit training sites throughout the United States. So far, recruits have experienced low levels of influenza infection. Influenza A H3N2 has been the dominate subtype with low levels of flu B reported. Sample submission and the number of positive samples for recruits peaked (so far) in week 5. Note the outbreaks of H3N2 during May and July of last year. Benefit and need for year-round surveillance. Ft Benning Georgia, Ft Jackson, SC, Ft Leonard Wood (Missouri), Naval Recruit Training Center, Great Lakes (Illinois), Lackland AFB (Texas), Marine Corps Recruit Depots, Paris Island (SC) and San Diego, Coast Guard Training Center, Cape May NJ Army = 10 wks, Navy 8 weeks, Marines = 13 weeks, AF 8 weeks
9

Strain Circulation
10
0%
10%
20%
30%
40%
50%
60%
70%
80%
90%
100%
0
50
100
150
200
250
300
350
40 43 46 49 52 2 5 8 11 14 17 20 23 26 29 32 35 38 41 44 47 50 1 4 7 10 13 16 19 22 25 28 31 34 37 40 43 46 49 52 3 6
Perc
ent P
ositi
ve
Num
ber o
f Spe
cim
ens
Week
North America Number and Proportion of Specimens Positive for Influenza by Subtype
Week 40, 2014 - Week 6, 2017
H1N1 H3N2 A (Not subtyped) Influenza B % PositiveSource: USAFSAM, NHRC

Speaker Notes for Slide 10
This graph represents surveillance data for military members and their dependents residing within the United States and select civilian populations along the Mexico border. So far, in North America, flu levels have been fairly low with H3/N2 as the dominant sub-type.
11

Strain Circulation
12
0%
10%
20%
30%
40%
50%
60%
70%
80%
90%
100%
0
20
40
60
80
100
120
140
160
40 43 46 49 52 2 5 8 11 14 17 20 23 26 29 32 35 38 41 44 47 50 1 4 7 10 13 16 19 22 25 28 31 34 37 40 43 46 49 52 3 6
Perc
ent P
ositi
ve
Num
ber o
f Spe
cim
ens
Week
Europe Number and Proportion of Specimens Positive for Influenza by Subtype
Week 40, 2014 - Week 7, 2017
H1N1 H3N2 A (Not subtyped) Influenza B % PositiveSource: LRMC/PHCR-Europe

Speaker Notes for Slide 12
This graph represents surveillance data for military members and their dependents residing in one of seven countries in Europe (Belgium, Germany, Italy, Spain, Turkey, United Kingdom, Portugal). Flu activity for this population is relatively low and dominated by H3N2.
13

Strain Circulation
14
0%
10%
20%
30%
40%
50%
60%
70%
80%
90%
100%
0
10
20
30
40
50
60
70
40 43 46 49 52 2 5 8 11 14 17 20 23 26 29 32 35 38 41 44 47 50 1 4 7 10 13 16 19 22 25 28 31 34 37 40 43 46 49 52 3 6
Perc
ent P
ositi
ve
Num
ber o
f Spe
cim
ens
Week
Latin America Number and Proportion of Specimens Positive for Influenza by Subtype
Week 40, 2014 - Week 6, 2017
H1N1 H3N2 A (Not subtyped) Influenza B % Positive Source: NAMRU-6

Speaker Notes for Slide 14
These surveillance data come from select local national populations within Peru, Paraguay, Columbia Nicaragua, and Honduras. Relatively low flu activity with a mix of H3N2 and flu B. These countries fall with in the tropics band so we don’t expect peaks at this time.
15

Strain Circulation
16
0%
10%
20%
30%
40%
50%
60%
70%
80%
90%
100%
0
50
100
150
200
250
40 43 46 49 52 2 5 8 11 14 17 20 23 26 29 32 35 38 41 44 47 50 1 4 7 10 13 16 19 22 25 28 31 34 37 40 43 46 49 52 3 6
Perc
ent P
ositi
ve
Num
ber o
f spe
cim
ens
Week
Asia Number and Proportion of Specimens Positive for Influenza by Subtype
Week 40, 2014 - Week 8, 2017
H1N1 H3N2 A (Not subtyped) Influenza B % PositiveSource: AFRIMS, NAMRU-2, 65th Med Brigade, NH Yokosuka

Speaker Notes for Slide 16
These data represent US military personnel and dependents stationed in ASIA and select local national populations. Our surveillance in Asia indicates moderate influenza activity with a mix of H3, H1 and flu B reported between weeks 28 and 40 (early July through early October). Countries: Bhutan Cambodia Japan Indonesia Nepal Philippines South Korea Thailand Pakistan
17

Strain Circulation
18
0%
10%
20%
30%
40%
50%
60%
70%
80%
90%
100%
0
2
4
6
8
10
12
14
16
18
20
40 43 46 49 52 2 5 8 11 14 17 20 23 26 29 32 35 38 41 44 47 50 1 4 7 10 13 16 19 22 25 28 31 34 37 40 43 46 49 52 3 6
Perc
ent P
ositi
ve
Num
ber o
f Spe
cim
ens
Week
East Africa Number and Proportion of Specimens Positive for Influenza by Subtype
Week 40, 2014 - Week 6, 2017
H1N1 H3N2 A (Not subtyped) Influenza B % Positive Source: USAMRU-K

Speaker Notes for Slide 18
Moderate activity from week 22 through 37 (late May through early September) with a mix of H1, H3 and flu B. In recent months activity has been low with mixed flu types. These countries are located within the tropics.
Countries: Kenya, Uganda, Tanzania
19

Summary of Circulating Strain Activity to date
• In North America and Europe, military members and dependents have experienced low to moderate flu activity so far; positive samples have been primarily H3N2
• Globally, a mix of H3N2 and H1N1 has been detected in the DOD network
20

USAFSAM/DoD Phylogenetic Analysis 2016-2017 Influenza Season
21

“Medically Ready Force…Ready Medical Force”
Distribution of Sequenced Influenza A/H1N1pdm09, A/H3N2, and B Specimens within the DoD, 2016-2017
Contributors AFRIMS Deployed Laboratories Landstuhl Regional Medical Center NAMRU-2 NAMRU-6 Naval Health Research Center – San Diego, CA USAMRD-K USAFSAM– Wright-Patterson AFB, Ohio WRAIR
412 Total Sequences
United States Air Force School of Aerospace Medicine (USAFSAM/PHE)
2510 5th Street, Wright-Patterson AFB OH 45433
Cambodia Country 1 Country 2 Egypt Germany Italy
Japan Kenya Nigeria Paraguay Peru Philippines
South Korea Thailand Turkey United States
5
8
266
13 9
3 1
1 1
15
2
2 6
6
19
8
10 19
1 8
14
341
39 13 19
Countries
Total
A(H3N2) A(H1N1)pdm09
B Victoria B Yamagata

Speaker Notes for Slide 22
For these analyses a Total 412 sequences were collected, 341 (83%) were influenza A(H3N2), 19 (5%) were influenza A(H1N1)pdm09, 39 (10%) were influenza B Victoria, and 13 (3%) were influenza B Yamagata. These sequences come from 16 countries on five continents. A(H3N2) was the predominant subtype in all regions collected from except for Africa and southeast Asia, where B Victoria was either equal to or greater than the number of A(H3N2) sequences.
23

Geographical Distribution of Sequences
• Of a total of 412 sequences collected to date , 341 (83%) were influenza A(H3N2),
• 19 (5%) were influenza A(H1N1)pdm09, • 39 (10%) were influenza B Victoria, • 13 (3%) were influenza B Yamagata -Sequences collected from 16 countries over 5 continents
-A(H3N2) was the predominant subtype in all regions collected from except for Africa and southeast Asia (B Victoria)
24

25
DoD Influenza H1N1pdm09 A/Cambodia/AD07365/2016
A/Cambodia/FSS31691/2016 A/Cambodia/FSS33767/2016
A/Thailand/PMKA4975/2016 A/Cambodia/AD07451/2016
A/Cambodia/FSS33232/2016 cnic A/Guangdong-Luohu/SWL1294/2016 Apr e wSAg
A/California/NHRC NMCSD0076/2016 2016 6B.1 Consensus Feb-Sep
A/Washington/700/2016 vidrl A/Fiji/3/2016 May e wF
A/Michigan/x5/2016 A/Nebraska/1979/2017
A/California/NHRC NMCSD0075/2016 A/Paraguay/FYF00541/2016
A/Ohio/w228/2016 A/Valparaiso/43870/2016 Jun F A/Brazil/1168/2016 Jun F
A/Mississippi/x20/2016 A/North Carolina/x107/2017
vidrl A/Brisbane/181/2015 Oct wF A/Michigan/45/2015 Sep e wF F SAg wSAg A/Michigan/45/2015 Sep F CSAg
A/Thailand/KPPH01191/2016 A/Thailand/KPPH01196/2016
A/Kenya/017/2016 A/Kenya/022/2016
niid A/Yokohama/50/2015 Feb wF 2016 6B.2 Consensus Feb-Sep
A/Iowa/53/2015 Nov F SAg wSAg
A/California/07/2009 Apr e F SAg wSAg 0.002
2016-2017 A(H1N1)pdm09 Vaccine strain: A/California/07/2009
Reference Strain August 2016
September 2016 October 2016
November 2016 December 2016 January 2017
ADD GLY Create Glycosylation Motif F – CDC Reference Antigen
wF – WHOcc Reference Antigen SAg - Serology Antigen
CSAg – CDC Serology Antigen wSAg – WHOcc Serology Antigen
e Egg Isolate
2016-2017 Influenza A(H1N1)pdm09 HA Phylogenetic Analysis
VRBPAC 2017 N = 19
L70F S162R N473D
P83S D97N K163Q S185T S203T A256T
S84N
I96L
D127E
S143G E283G
N156K M257L
S162N ADD GLY I216T
I166V S183P R205K
A186T V321I
V272F I324V
K366Q G482R
T474M
V520A
K283E I321V E374K S451N E499K
6B.2
6B.1
6B

Speaker Notes for Slide 25
• All 19 of the H1N1 sequences collected were in clade 6B; 15 of them (79%) were in subclade 6B.1
• A/Michigan/45/2015-like virus is the recommended A(H1N1)pdm09 component of the 2017-2018 influenza vaccine.
26

DoD Influenza H3N2
27
A/Maryland/x1/2016A/New Jersey/1861/2017
A/Texas/x15/2016A/Thailand/PMKA5082/2016
A/California/4818/2016A/California/NHRC SAR10458N/2017
A/South Korea/x56/2016A/Oklahoma/1625/2017
A/Colorado/1052/2016A/Kansas/689/2016A/Texas/x28/2016
A/Germany/x9/2016A/California/NHRC SEA030/2017A/Washington/1777/2017
A/Kentucky/1990/2017A/South Korea/x86/2017
A/Country 1/1940/2017A/Arizona/2033/2017A/Germany/x76/2016 A/Florida/1569/2017
A/Georgia/NHRC 68641/2017A/Washington/1755/2016
A/Virginia/1581/2017A/Illinois/NHRC 18495/2016
A/Oregon/1567/2017A/Oklahoma/1876/2017
A/Idaho/1995/2017A/Idaho/647/2016A/Japan/244/2016A/South Korea/1159/2016A/Idaho/784/2016A/Montana/1469/2017
A/Montana/1845/2017A/Georgia/NHRC 68549/2016
A/South Korea/x60/2017A/Country1/1141/2016
A/Kansas/1875/2017A/Germany/x167/2017
A/Ohio/w187/2016A/New Jersey/921/2016A/Ohio/w313/2017 A/Japan/1922/2017
A/New York/1965/2017A/South Carolina/1321/2017A/Ohio/1041/2016A/New York/1623/2017 A/North Carolina/1648/2017
A/Kansas/1198/2016A/New York/1001/2016A/Japan/338/2016
A/Japan/834/2016A/California/863/2016
A/California/NHRC FDX90131/2016A/Massachusetts/2056/2017
A/Delaware/1528/2017A/Missouri/NHRC 36943/2016
A/Washington/1816/2017A/Texas/1888/2017A/New York/960/2016
A/Texas/x42/2016A/Nev ada/293/2016
A/South Korea/x51/2016v idrl A/Newcastle/30/2016 Mar wSAg
A/Kenya/015/2016A/Japan/21/2016
A/Philippines/NHRC MCY0131/20162016 HA 3C2a Consensus Feb-Sep
A/California/1369/2017A/Alaska/232/2015 Sep F MNAg wSAg
A/South Carolina/NHRC 75576/2016A/Georgia/2026/2017niid A/Yokohama/120/2016 Apr wSAg
A/Cambodia/AD07235/2016A/Cambodia/FSS33659/2016
A/Germany/x23/2016A/Thailand/PMKA5225/2016
A/Country 2/1079/2016A/Country 2/893/2016A/Virginia/1044/2016
A/California/62/2016 A/California/1400/2017A/Alaska/232/2015 Sep e F CSAg MNAg
A/Florida/1054/2016A/Wyoming/1926/2017
A/Texas/x110/2017A/California/NHRC BRD12267N/2016
A/California/656/2016A/Missouri/NHRC 36946/2017
A/Utah/1128/2016A/Japan/1175/2016
crick A/Hong Kong/97/2016 Jan wSAgA/Kenya/023/2016 2016/10/012
A/Maryland/1429/2017A/South Korea/195/2016
A/New Jersey/1286/2017A/Utah/1127/2016
A/Wyoming/1916/2017A/Georgia/1384/2017A/California/1111/2016 HOSPITALIZED
A/Idaho/1882/2017A/California/487/2016
A/California/NHRC FDX90197/2017A/Florida/1234/2017A/Nebraska/1245/2016
A/New Mexico/925/2016A/New Jersey/1644/2017A/Oklahoma/1483/2017
A/Washington/1501/2017A/Colorado/1544/2017
A/Nebraska/1631/2017A/South Korea/x64/2016
A/Alaska/1780/2017A/Florida/890/2016
A/Kentucky/1987/2017A/Ohio/1521/2017A/Alabama/1667/2017
A/South Carolina/1516/2017A/South Carolina/1192/2016
A/Colorado/1983/2017A/Washington/1340/2017
A/North Carolina/1324/2017A/North Carolina/x97/2016A/Italy/x72/2016
A/Texas/x114/2017A/Germany/x36/2016
A/Idaho/1124/2016A/Cambodia/FSS33465/2016
A/Ohio/w111/2016A/Washington/4800/2016 A/Country 2/1218/2016
A/Country 2/1314/2017A/Virginia/1986/2017A/Kansas/1601/2017
A/Thailand/PMKA5160/2016A/Nigeria/1514A03007000T/2016
A/California/1960/2017A/Country2/1216/2016
A/Country2/1948/2017A/Germany/x78/2016A/Utah/1815/2017
A/Kenya/016/2016A/Germany/x10/2016
crick A/Slov enia/129/2016 Jan wSAgA/Peru/FPP02924/2016
A/Mississippi/x6/2016A/Washington/14/2016
A/Hong Kong/4801/2014 Feb e wF F SAg MNAg wSAg A/Connecticut/1944/2017A/Maryland/1958/2017
A/New York/1615/2017A/New York/1239/2016
A/New York/849/2016A/North Carolina/x92/2017
A/Texas/88/2016 Feb FRA HKLR F SAg MNAg wSAgA/Switzerland/9715293/2013 Dec e F wF SAg wSAg
A/South Korea/x63/2016A/Oklahoma/805/2016
2016 HA 3C3a Consensus Feb-SepA/Idaho/33/2016 Jun F
A/Nev ada/1042/2016A/California/1402/2017v idrl A/Sydney/142/2016 Jun wSAgA/Texas/50/2012 F
0.002
2016-2017 A(H3N2)Vaccine strain: A/Hong Kong/4801/2014
Reference StrainJuly 2016
August 2016September 2016
October 2016November 2016December 2016January 2017
ADD GLY Create Glycosylation MotifLOSS GLY Loss of Glycosylation Motif
F – CDC Reference AntigenwF – WHOcc Reference Antigen
SAg - Serology AntigenCSAg – CDC Serology Antigen
wSAg – WHOcc Serology Antigene Egg Isolate
Selected 2016-2017 Influenza A(H3N2) HA Phylogenetic Analysis
VRBPAC 2017N = 150
Sequences were selected to be representative of the total distribution of H3N2 specimens sequenced
K2R
L3IN128T ADD GLYN144S LOSS GLYF159YP198SQ311H
R2K N31S D53N F193S
L3I S91N P198S
L3I I192T A530V
G5EN121KR142GS262N
N6S N31DS47T D53NT235A P239SA530V
N6D
S9G
T12M T135A LOSS GLY S199P
T10M LOS GLY I140M V347M Q501H
I25M S145N
N31S
R33Q T440I
S46T
S47T G78S V529F
D53N
D53N F193S
D53N S198P
D53E Q75H
D53Y Q75H K171R I192N A530V
I58V R141K
I58V
I58VR142K
R33Q S219Y
E62K
E62G R142G
D77E R261Q S262R
Q80K F193SV88I T135K LOSS GLY
K92R
K92RH311Q
A93T
A106T
V112I
N121K
N121KS144K
N121K L431M
N122D LOSS GLYS262N
S124G I515L
N128AA138SR142GF159SK326R
T131KR142K
T135K LOSS GLY S198T
T135KLOSS GLY
T135K LOSS GLY N158D LOSS GLY
I140M
I140M
I140M
R142G I242VR142G
R142G
R142KQ197R
R142K
N144K LOSS GLYF193S
S144N ADD GLY
N145SN225DD489N
N158K LOSS GLY
N158H
K160TADD GLY
T160K LOSS GLY
T160I LOSS GLY F193ST160K LOSS GLY
T160K LOSS GLY V166M I214T
T160K LOSS GLY F193S
M168V
P169S
N171KI406VG484E
D188N
I192V F193S
F193S V347M
Q197R
Q197K R261Q
Q197K
A212T
A212T
I217V
S219F
I236V
T248A LOSS GLY
R261Q
R261Q
R261Q
G263R
D271N
G275S
A304T
S312D
S312N
N378S
I385V
L431V T440I A476T
T440I
K450R
K468R
G479E
G484E
N489D
K508R
I522T
A530V
A530V
3C.3a
3C.2a1
Proposed 3C.2a2
3C.2a
3C.2a
3C.2a164.9%
Total 2016-2017 A(H3N2)N = 341
3C.2a Only16.1%
3C.3a7.3%
3C.2a211.4%

Speaker Notes for Slide 27
• 150 of the 341 influenza A(H3N2) sequences collected for the 2016-2017 season were selected to represent the clade proportions as well as geographical and temporal distribution
• 7% of sequences were in clade 3C.3a, 65% were in subclade 3C.2a1, 11% were in clade 3C.2a2, and 16.1% were in clade 3C.2a with no further subclade designation
• A/Hong Kong/4801/2014-like virus is the recommended as
A(H3N2) component of the 2017-2018 vaccine.
28

Substitution Frequencies of H3N2 Key Amino Acids
29
# of
Seq
uenc
es

Speaker Notes for Slide 29
These graphs highlight the genetically dynamic nature of A(H3N2). The frequency plots show the amino acid substitutions at either consistently low levels (I58V, N122D), spiking at some point in the analysis (S144K, R142G), increasing at the end of the analysis (T135K), or variable throughout the analysis time period (N171K, N121K). • The bottom right graph shows the number of
sequences by month
30

31
DoD Influenza B Victoria B/Thailand/KPPH01232/2016
crick B/Ireland/3154/2016 Jan wF wSAg B/North Carolina/1546/2017 B/North Carolina/1723/2017 B/New York/1890/2017 B/Georgia/1119/2016 B/Georgia/NHRC 68492/2016
B/Kenya/012/2016 B/Cambodia/FSS33515/2016 B/Cambodia/FSS33829/2016 B/Cambodia/FSS33491/2016
B/South Carolina/1061/2016 B/Thailand/KPPH01193/2016
B/Texas/x46/2016 B/Texas/x30/2016
B/Texas/x16/2016 B/Texas/x18/2016
B/Kenya/013/2016 B/Kenya/019/2016
vidrl B/Brisbane/46/2015 Apr wF B/Washington/461/2016
B/Thailand/KPPH01158/2016 B/Cambodia/AD07294/2016
B/Cambodia/FSS34002/2016 B/Thailand/KPPH01202/2016
B/Kenya/024/2016 B/Kenya/018/2016
B/Georgia/1903/2017 B/Kenya/021/2016
vidrl B/South Australia/17/2016 Jun wSAg B/Paraguay/FYC00811/2016 B/Kanagawa/IC45/2016 Apr vidrl B/Brisbane/46/2015 Apr e wF
B/Cambodia/FSS33518/2016 B/Cambodia/FSS33746/2016
B/Cambodia/FSS33555/2016 B/Cambodia/AD07596/2016 B/Cambodia/FSS33359/2016 B/Cambodia/FSS32091/2016 B/Cambodia/FSS33627/2016
B/Cambodia/FSS33470/2016 B/Cambodia/FSS33667/2016
B/Cambodia/FSS31334/2016 B/Florida/78/2015 Nov e F CSAg
B/Florida/78/2015 Nov F SAg B/Ohio/w253/2017 B/Ohio/w254/2017
cnic B/Zhejiang-Dinghai/1466/2016 Jun e wSAg B/Texas/02/2013 Jan e F B/Texas/02/2013 Jan F
B/Brisbane/60/2008 e wF F SAg B/Ohio/01/2005 Feb e LR F
0.005
Current 2016-2017 B Victoria vaccine strain: B/Brisbane/60/2008-like virus
Reference Strain July 2016
August 2016 September 2016
October 2016 November 2016 December 2016 January 2017
ADD GLY Create Glycosylation Motif LOSS GLY Loss of Glycosylation Motif
F – CDC Reference Antigen SAg - Serology Antigen
wF – WHOcc Reference Antigen CSAg – CDC Serology Antigen
wSAg – WHOcc Serology Antigen e Egg Isolate
LR Low Reactor to B/Brisbane/60/2008 (≥ 8 fold)
2016-2017 Influenza B Victoria HA Phylogenetic Analysis
VRBPAC 2017 N = 39
K48E N75K E80R V146I N165K S172P I190V A199T ADD GLY I555V
V24I
K75E
R80K
I117V
N126D K345R
K129D
K162N
K162D N163V D164Y
K162_N163del
K162_N163del T548A
K162_N163del
N163S
V180I R279K K498R
I180V R498K
N197S LOSS GLY
I267V M550I
I553V
V1A

Speaker notes for Slide 31
• All 39 of the influenza B Victoria sequences were in clade 1A; - Three strains were found to have a deletion at amino acid positions 162 and 163
• Either -B/Texas/02/2013-like virus or
B/Brisbane/60/2008-like virus is recommended for the 2017-18 flu season.
32

DoD Influenza B Yamagata
33
B/New York/2000/2017 B/New York/2001/2017 B/Virginia/1224/2017 B/Montana/1988/2017
B/Illinois/NHRC 18462/2016 B/Nevada/283/2016
vidrl B/South Auckland/14/2016 Jul wSAg vidrl B/Townsville/6/2016 Feb
B/Nebraska/1736/2017 B/California/NHRC 27794/2016
B/Arizona/10/2015 Nov SAg wSAg B/Cambodia/FSS33766/2016
B/Turkey/2013/2017 B/Peru/CFI3361/2016
crick B/Hamburg/1/2016 Jan wSAg B/Ohio/w230/2016
B/Germany/x24/2016 B/Phuket/3073/2013 Nov e F wF SAg wSAg
B/Massachusetts/02/2012 Mar F wF
0.005
Current 2016-2017 B Yamagata vaccine strain: B/Phuket/3073/2013
Reference Strain July 2016
August 2016 October 2016
November 2016 December 2016 January 2017
F – CDC Reference Antigen SAg - Serology Antigen
wF – WHOcc Reference Antigen wSAg – WHOcc Serology Antigen
e Egg Isolate
2016-2017 Influenza B Yamagata HA Phylogenetic Analysis
VRBPAC 2017 N = 13
K48R A108P N116K S150I N166Y
R48K
V90A
L173Q M252V
V177I
K121R
A182T N203S G230D K299E E313K
Y3

Speaker Notes for Slide 33
-All 13 of the influenza B Yamagata specimens were in clade 3 -B/Phuket/3073/2013-like virus is the recommended influenza B Yamagata component of the 2017-2018 quadrivalent influenza vaccine
34

Summary of Recommendations
• For the 2017-2018 influenza trivalent vaccine: -A(H1N1)pdm09 component: A/Michigan/45/2015-like virus -A(H3N2) component: A/Hong Kong/4801/2014-like virus -B Victoria component: B/Brisbane/60/2008-like virus, OR B/Texas/02/2013-like virus (depending on production)
• For the 2017-2018 quadrivalent vaccine: -B Yamagata component: B/Phuket/3073/2013-like virus
35

Vaccine Effectiveness (VE)
36
VE Preview
• To this point, the flu season has been relatively mild in most regions covered by the DoD influenza surveillance network – Not enough cases for detailed sub-analyses
• Simplified Analyses
– No LAIV use – Very little H1N1
37
VE Preview
• Mid-year estimates provided by – US Air Force School of Aerospace Medicine (USAFSAM) – Naval Health Research Center (NHRC) – AFHSB, Epidemiology and Analysis
• Case-Control studies, logistic regression used to estimate VE – Two studies used control-test negative method – Epidemiology and Analysis used Health Controls – No analyses by flu “A” subtype; H3 dominant season – Each influenza infection was confirmed by PCR or viral
culture
38

Testing Criteria for ILI
• Specimens should be collected within 72 hours of onset symptoms
39
•Fever ≥100.5°F (38°Celsius)
AND •Cough and/or Sore Throat
Speaker Notes for Slide 39
- surveillance sites are asked to submit up to 10 specimens per week, giving priority to the sickest or hospitalized patients.
40

Unclassified
41
USAFSAM Case-Control Analyses

42
United States Air Force School of Aerospace Medicine (USAFSAM)
• Adjusted Estimates of Vaccine Effectiveness – Population: DoD healthcare beneficiaries (excluding Active Duty) – Time period: October 2, 2016 – February 18 2017 – Analysis by influenza subtype/type (H3N2 and B) and by age group
(children and adults) – Adjusted for age, month of illness and region – Cases: n=534 ; confirmed by RT-PCR or viral culture – Controls: n=838 ; test-negative; RATIO NOT OPTIMAL – Vaccination rates: cases 32%, controls 36% – Of total cases:
• 89% were influenza A (H3N2) • 1% were influenza A(H1N1)pdm09 • 10% were influenza “B”

Unclassified
43 “Medically Ready Force…Ready Medical Force”
USAFSAM: Cases and Controls by Age Group
60.1%
39.9%
66.0%
34.0%
0.0%
10.0%
20.0%
30.0%
40.0%
50.0%
60.0%
70.0%
80.0%
90.0%
100.0%
<18 18+
Perc
ent
Age Groups (Years)
Cases and Controls by Age Group (USAFSAM)
Cases Controls 43
Unclassified
44 “Medically Ready Force…Ready Medical Force”
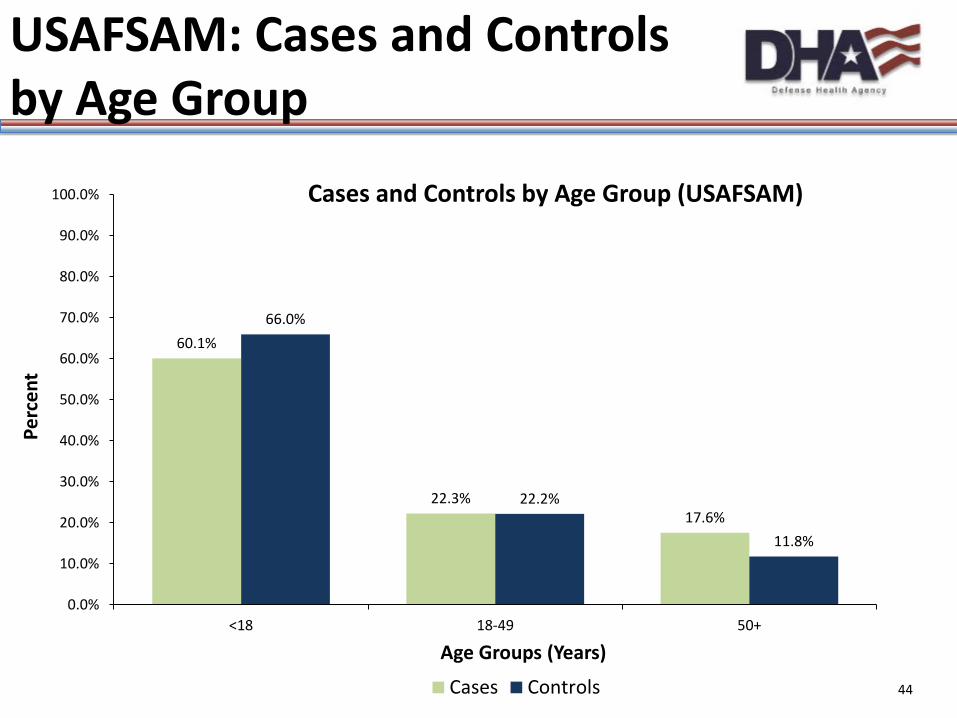
USAFSAM: Cases and Controls by Age Group
60.1%
22.3% 17.6%
66.0%
22.2%
11.8%
0.0%
10.0%
20.0%
30.0%
40.0%
50.0%
60.0%
70.0%
80.0%
90.0%
100.0%
<18 18-49 50+
Perc
ent
Age Groups (Years)
Cases and Controls by Age Group (USAFSAM)
Cases Controls 44

Unclassified
45
• Adjusted Estimates of Vaccine Effectiveness
– H3N2: overall adjusted VE was moderately protective and statistically significant for influenza A(H3N2) (VE = 42%) – Significantly protective for children – Not significantly protective for adults
– Flu “B”: overall adjusted VE was moderately protective and statistically significant for influenza “B” (VE = 53%) – 77% of subjects under 18
USAFSAM: Adjusted Estimates of Vaccine Effectiveness 2016-2017

Unclassified
46
“Medically Ready Force…Ready Medical Force”
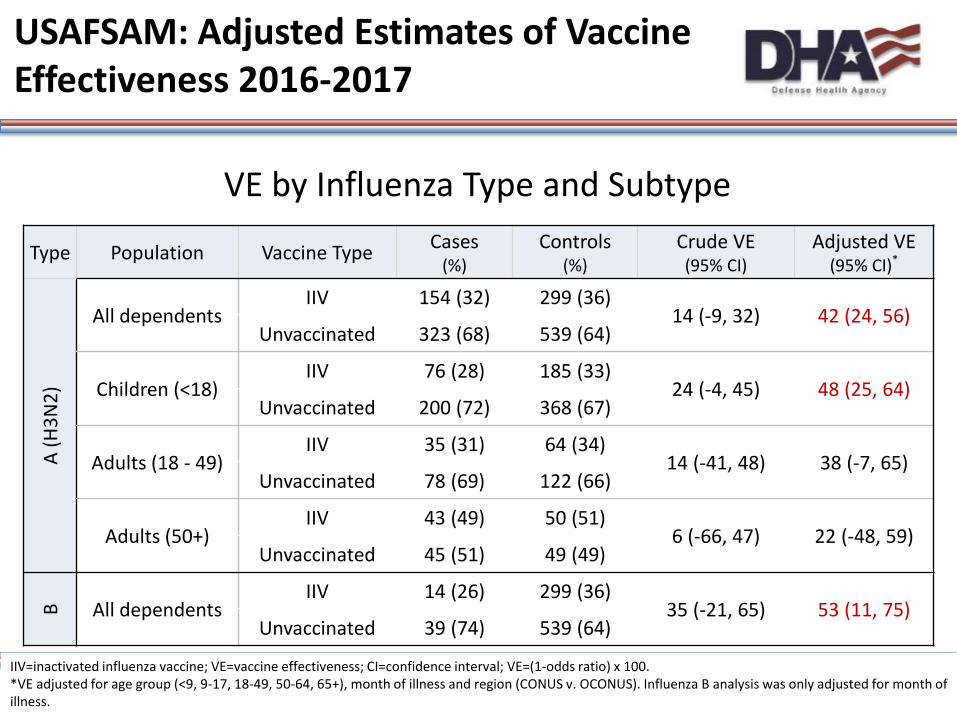
USAFSAM: Adjusted Estimates of Vaccine Effectiveness 2016-2017
VE by Influenza Type and Subtype
IIV=inactivated influenza vaccine; VE=vaccine effectiveness; CI=confidence interval; VE=(1-odds ratio) x 100. *VE adjusted for age group (<9, 9-17, 18-49, 50-64, 65+), month of illness and region (CONUS v. OCONUS). Influenza B analysis was only adjusted for month of illness.
Type Population Vaccine Type Cases (%)
Controls (%)
Crude VE (95% CI)
Adjusted VE (95% CI)*
A (H
3N2)
All dependents IIV 154 (32) 299 (36)
14 (-9, 32) 42 (24, 56) Unvaccinated 323 (68) 539 (64)
Adults (>18) IIV 78 (39) 114 (40)
5 (-38, 34) 32 (-3, 55) Unvaccinated 123 (61) 171 (60)
Children (<18) IIV 76 (28) 185 (33)
24 (-4, 45) 48 (25, 64) Unvaccinated 200 (72) 368 (67)
B All dependents IIV 14 (26) 299 (36)
35 (-21, 65) 53 (11, 75) Unvaccinated 39 (74) 539 (64)
46

NHRC Case-Control Analyses
47

48
Naval Health Research Center
• Adjusted Estimates of Vaccine Effectiveness – Population: Civilians only
• DoD dependents in Southern California , Arizona, and Illinois outpatient clinics • Civilians at outpatient clinics near US-Mexico border (CDC and CA State collaboration)
– Adjusted for: age and study population (military dependents VS US-Mexico border civilians)
– Cases: n=75; confirmed by RT-PCR – Controls: n=224; test-negative 3:1 ratio – Vaccination Rates: cases 33%, controls 48% – 93% of cases were A/H3 – 4% were flu B – 3% were A/H1

49
Naval Health Research Center
68.0%
32.0%
0.0%
64.0%
36.0%
0.0% 0.0%
10.0%
20.0%
30.0%
40.0%
50.0%
60.0%
70.0%
80.0%
90.0%
100.0%
0-17 18-64 65+
Perc
ent
Age Groups (Years)
Cases and Controls by Age Group (NHRC)
Cases Controls

50
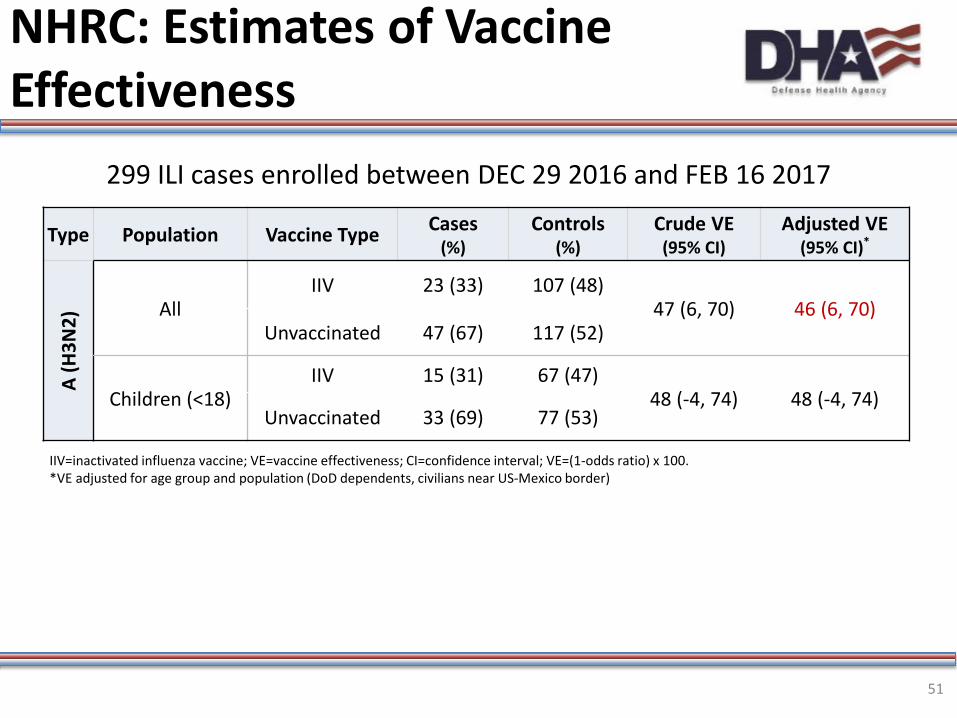
Naval Health Research Center
• Adjusted Estimates of Vaccine Effectiveness – VE against H3 was moderately protective and statistically
significant – VE for children (0-17, H3 only) was moderately protective but
not statistically significant
51
NHRC: Estimates of Vaccine Effectiveness
299 ILI cases enrolled between DEC 29 2016 and FEB 16 2017
Type Population Vaccine Type Cases (%)
Controls (%)
Crude VE (95% CI)
Adjusted VE (95% CI)*
A (H
3N2)
All IIV 23 (33) 107 (48)
47 (6, 70) 46 (6, 70) Unvaccinated 47 (67) 117 (52)
Children (<18) IIV 15 (31) 67 (47)
48 (-4, 74) 48 (-4, 74) Unvaccinated 33 (69) 77 (53)
IIV=inactivated influenza vaccine; VE=vaccine effectiveness; CI=confidence interval; VE=(1-odds ratio) x 100. *VE adjusted for age group and population (DoD dependents, civilians near US-Mexico border)

AFHSB Epidemiology and Analysis
Case-Control Analyses
52

• Matched Case Health-Control Study of VE – Population: Active component service members
• Army, Navy, Air Force, Marines • CONUS and OCONUS
– Lab-confirmed flu cases (n=987) • Rapid, RT-PCR, or culture
53 53
AFHSB Mid-Season 2016-2017 Case Health Control VE Study (Active Component)
• Health Controls (n=3709) • Medical encounter for injuries or mental health
conditions with no ILIs reported at encounter • No medical encounters for influenza during
season • Matched to cases by sex, age, date of
encounter (+/- 3 days), and location
• Models adjusted for 5-yr vaccination status (Y/N)
54
AFHSB Mid-Season 2016-2017 Case Health Control VE Study (Active Component)

AFHSB Mid-Season 2016-2017 Case-Test Negative Control VE Study (Active Component)
55
29.4%
18.8%
37.1%
14.7%
29.5%
18.7%
37.8%
14.0%
0%
10%
20%
30%
40%
50%
60%
70%
80%
90%
100%
18-24 25-29 30-39 40+
Perc
enta
ge
Age Groups (Years)
Cases and Controls by Age Group (AFHSB)
Cases Controls

• Vaccination Status – Cases: 91% vaccinated – Controls: 89% vaccinated
• Cases – Influenza A (unsubtyped) = 636* – Influenza A H3N2 = 261 – Influenza A H1N1 = 12 – Influenza B = 79
• 93% of cases and 95% of controls had prior flu vaccine in previous 5 years
• IIV was the only vaccine used by DoD this season
56
AFHSB Mid-Season 2016-2017 Case Health Control VE Study (Active Component)
56

AFHSB Mid-Season 2016-2017 Case Health Control VE Study (Active Component)
57
29.4%
18.8%
37.1%
14.7%
29.5%
18.7%
37.8%
14.0%
0%
10%
20%
30%
40%
50%
60%
70%
80%
90%
100%
18-24 25-29 30-39 40+
Perc
enta
ge
Age Groups (Years)
Cases and Controls by Age Group (AFHSB)
Cases Controls
Unclassified
58
• VE estimates for Flu “A” were very low and not
statistically significant
• Wide CIs, low power due to relatively small numbers and very high vaccination rates ( 90%)
• For Flu “B” numbers were too small to produce reliable estimates
Active Duty Vaccine Effectiveness 2016-2017

59
OR = Odds Ratio; IIV = inactivated influenza vaccine; *Adjusted for sex, age, month of diagnosis, and vaccination status in 5 years prior (Y/N)
AFHSB Mid-Season 2016-2017 Case Health Control VE Study (Active Component)
Influenza Type/Subtype Vaccine Type Cases
(%) Controls
(%) Crude VE
(95% CI) Adjusted VE
(95% CI)*
Influenza A IIV 823 (91) 3109 (91)
5 (-23, 27) 3 (-25, 25) Unvaccinated 86 (9) 315 (9)
A/H3N2 IIV 228 (87) 898 (91)
32 (-6, 57) 33 (-6, 57) Unvaccinated 33 (13) 93 (9)
59
60
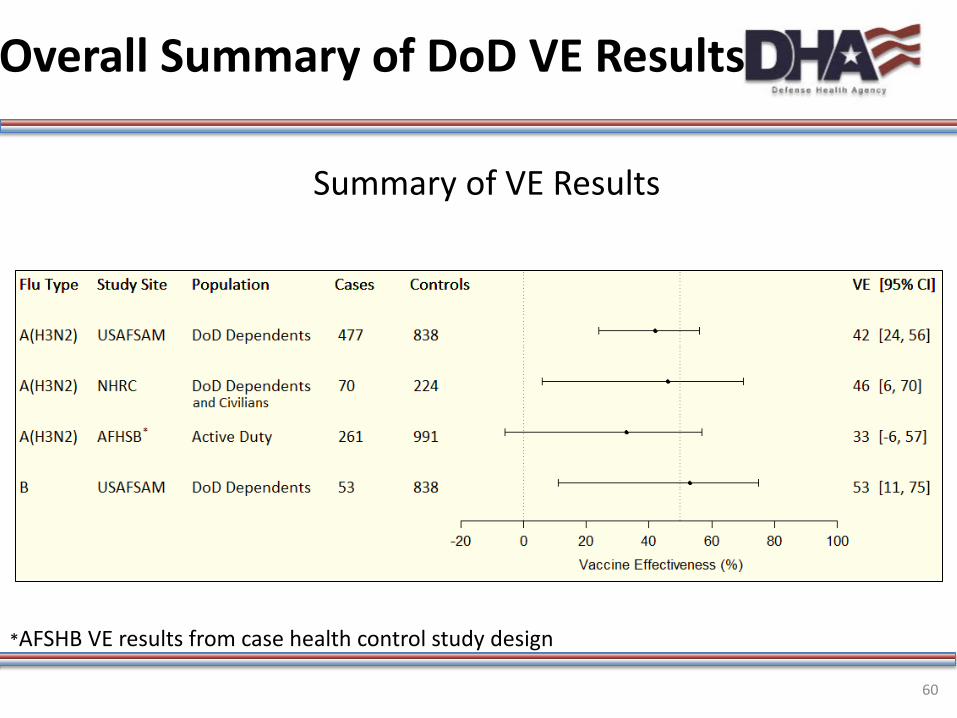
Overall Summary of DoD VE Results
Summary of VE Results
*AFSHB VE results from case health control study design

Summary of VE Results
• For Dependents and Civilians overall: – VE against H3N1 was moderately protective and
statistically significant – VE against Flu “B” was moderately protective and
statistically significant
• For Active Duty Military: – VE was not statistically significant for Flu “A”
61

Discussion-Limitations
• Generalizability – Subjects were sick enough to seek medical
attention, can’t comment on vaccine impact for less severe cases
– Active Duty military population is highly immunized, this could have a negative impact on VE (potential method issues and biological effects such as attenuated immune response with repeated exposures)
62

Discussion-Limitations
– Populations are younger; cannot comment on vaccine impact in older, high-risk pops
– USAFSAM analyses was limited by a suboptimal control : case ratio
– NHRC analyses were limited by small numbers – AFHSB analyses were limited by high vaccination
rates
–Low statistical power
63

Thanks
64

Acknowledgements AFHSB COL Douglas Badzik Dr. Angelia Cost Ms Christina Chommanard Ms. Emily Cisney CDR Franca Jones Dr. Jose “Toti” Sanchez AFRIMS COL Louis Macareo COL John Maza MAJ Damon Ellison Dr. Klungthong Chonticha Dr. Ans Timmermans Ms. Tippa Wongstitwilairoong
65th MEDICAL BRIGADE CPT Daniel Boudreux Ms. Young Mi Kwon LRMC/PHCR-Europe LT Daniel Pederson Mr. Fritz Castillo COL Rodney Coldren
NAMRU-2 LCDR Catherine M. Berjohn Mr. Agus Rachmat Mr. Vireak Heang NAMRU-6 Dr. Mores Dr. Yeny Tinoco Dr. Sonia Ampuero Dr. Marita Silva Mr. Vidal Felices Dr. Giselle Soto
65

Acknowledgements NHRC Mr. Anthony Hawksworth Dr. Chris Myers Dr. Pete Kammerer Ms. Erin Hansen LCDR Paul Graf USAFSAM Ms. Kathy Bush Mr. Joshua Cockerham Mr. Matthew Crum Ms. Michelle Crum Ms. Laurie DeMarcus Maj Maryann Edwards Lt Col Susan Federinko Dr. Anthony Fries Ms. Kristine Fumia Mr. William Gruner Mr. James Hanson Mr. Jerry Heeg Ms. Geeta Kersellius Dr. Elizabeth Macias
Mr. Don Minnich Mr. Patrick Paul Ms. Marie Powell Ms. Lisa Shoubaki Mr. Jeffrey Thervil Ms. Elizabeth Toure Mr. Scott Wallace Carol Garrett Matt Couch Matt Sanders Matt Levine Aleta Yount SrA Dalton Barrie Sgt Ashley Seaton USAMRD-K Dr. Wallace Bulimo Ms. Janet Majanja Mr. Silvanos Opanda COL James Mancuso
WRAIR Dr. Maljkovic Berry Dr. Huo-Shu Houng MAJ Richard Jarman MAJ Shannon Walls CDC-BIDS Dr. Kathleen Moser Ms. Alba Phippard Ms. Eva Fabian CA and County Depts of Health Dr. Esmeralda Iniguez-Stevens Dr. Paula Kriner Dr. Annie Kao Dr. Maria Fierro
66
Questions? CAPT Michael Cooper, PhD
Head, Dept. of Respiratory Infections Surveillance Tel: 301-319-3258
E-mail: [email protected]
COL Douglas Badzik, MD Chief, AFHSB
E-mail: [email protected]
CDR Franca Jones, PhD Director, GEIS
E-mail: [email protected]
67

Back-up slides (USAFSAM)
Unclassified
69
“Medically Ready Force…Ready Medical Force”
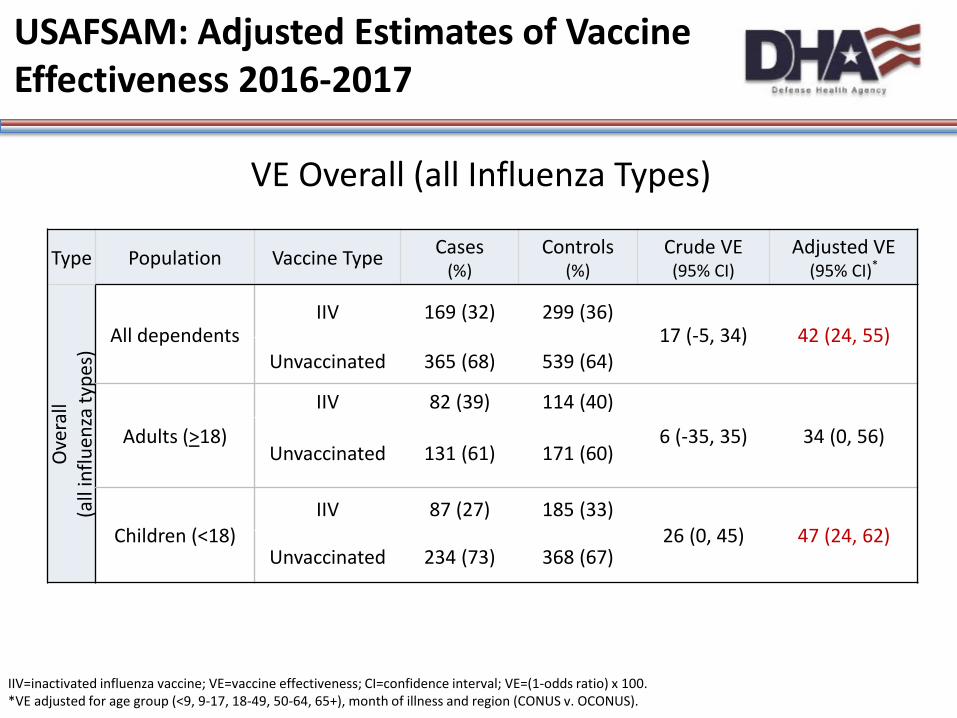
VE Overall (all Influenza Types)
Type Population Vaccine Type Cases (%)
Controls (%)
Crude VE (95% CI)
Adjusted VE (95% CI)*
Ove
rall
(all
influ
enza
type
s) All dependents
IIV 169 (32) 299 (36) 17 (-5, 34) 42 (24, 55)
Unvaccinated 365 (68) 539 (64)
Adults (>18)
IIV 82 (39) 114 (40)
6 (-35, 35) 34 (0, 56) Unvaccinated 131 (61) 171 (60)
Children (<18) IIV 87 (27) 185 (33)
26 (0, 45) 47 (24, 62) Unvaccinated 234 (73) 368 (67)
IIV=inactivated influenza vaccine; VE=vaccine effectiveness; CI=confidence interval; VE=(1-odds ratio) x 100. *VE adjusted for age group (<9, 9-17, 18-49, 50-64, 65+), month of illness and region (CONUS v. OCONUS).
USAFSAM: Adjusted Estimates of Vaccine Effectiveness 2016-2017

Speaker Notes for Slide 69
*Strengthen Our Role as a Combat Support Agency *Fortify Our Relationship with the Services -Respond to Immediate Mission Needs (W2) -Support Service Needs for Data, Reporting, and Analytics (W7) - Improve System of DHA Accountability (W9) - Leverage Strategic Partnerships (W10)
70

Characteristics of laboratory confirmed influenza cases and test-negative controls from October 2, 2016 –February 18, 2017
US Air Force School of Aerospace Medicine’s DoD Global, Laboratory-based, Influenza Surveillance Program
aSpecimen collection began during Week 40 (October 2, 2016) and continued through Week 7 (February 18, 2017). bCONUS=continental United States, OCONUS=outside of continental United States cVaccination status was determined by electronic medical records and plausible self-report at enrollment dVaccination status is the exposure of interest, see VE tables
Characteristic Cases (n=534) No.(%)
Controls (n=838 ) No.(%) p-Value
Gender 0.385 Male 246 (46.1) 366 (43.7) Female 288 (53.9) 472 (56.3)
Age (years) <0.001 <9 151 (28.3) 406 (48.5) 9-17 170 (31.8) 147 (17.5) 18-49 119 (22.3) 186 (22.2) 50-64 74 (13.9) 64 (7.6) 65+ 20 (3.7) 35 (4.2)
Beneficiary Category 0.008 Child 321 (60.1) 553 (66.0) Adult (18-49) 119 (22.3) 186 (22.2) Adult (50+) 94 (17.6) 99 (11.8)
Month of Illnessa <0.001 October 4 (0.7) 101 (12.1) November 10 (1.9) 188 (22.4) December 90 (16.9) 181 (21.6) January 211 (39.5) 242 (28.9) February 219 (41.0) 126 (15.0)
Geographic Regionb 0.945 CONUS 510 (95.5) 801 (95.6) OCONUS 24 (4.5) 37 (4.4)
Vaccination Statusc -d
Vaccinated 169 (31.6) 299 (35.7) Unvaccinated 365 (68.4) 539 (64.3)
Influenza Type - B 53 (9.9) - A(H1N1) 4 (0.8) - A(H3N2) 477 (89.3) -

0
10
20
30
40
50
60
70
80
90
100
0
10
20
30
40
50
60
70
80
90
100
Percent Positve N
umbe
r of I
LI p
atie
nts
Week
USAFSAM Cases and Controls by Week & Percent Positivity
Case Control Percent Positive
Note: The last few weeks still had pending results which are not included in the analysis and are not shown here; percent positivity is affected by this and may be artificially inflated

73 “Medically Ready Force…Ready Medical Force”
Overall Summary of DoD VE Results
Summary of VE Results (w/AFHSB test-negative results)
*AFSHB VE results from test-negative case-control study design

Back-up slides (USAFSAM) Alternate age stratification
Unclassified
75
“Medically Ready Force…Ready Medical Force”
USAFSAM: Adjusted Estimates of Vaccine Effectiveness 2016-2017
VE by Influenza Type and Subtype
Type Population Vaccine Type Cases (%)
Controls (%)
Crude VE (95% CI)
Adjusted VE (95% CI)*
A (H
3N2)
All dependents IIV 154 (32) 299 (36)
14 (-9, 32) 42 (24, 56) Unvaccinated 323 (68) 539 (64)
Children (<18) IIV 76 (28) 185 (33)
24 (-4, 45) 48 (25, 64) Unvaccinated 200 (72) 368 (67)
Adults (18 - 49) IIV 35 (31) 64 (34)
14 (-41, 48) 38 (-7, 65) Unvaccinated 78 (69) 122 (66)
Adults (50+) IIV 43 (49) 50 (51)
6 (-66, 47) 22 (-48, 59) Unvaccinated 45 (51) 49 (49)
B All dependents IIV 14 (26) 299 (36)
35 (-21, 65) 53 (11, 75) Unvaccinated 39 (74) 539 (64)
IIV=inactivated influenza vaccine; VE=vaccine effectiveness; CI=confidence interval; VE=(1-odds ratio) x 100. *VE adjusted for age group (<9, 9-17, 18-49, 50-64, 65+), month of illness and region (CONUS v. OCONUS). Influenza B analysis was only adjusted for month of illness.

Speaker Notes for Slide 75
*Strengthen Our Role as a Combat Support Agency *Fortify Our Relationship with the Services -Respond to Immediate Mission Needs (W2) -Support Service Needs for Data, Reporting, and Analytics (W7) - Improve System of DHA Accountability (W9) - Leverage Strategic Partnerships (W10)
76

77
USAFSAM: Adjusted Estimates of Vaccine Effectiveness 2016-2017
VE by Influenza Type and Subtype
Related Documents